tourism investment monitor 2016 - tra
TRANSCRIPT

TOURISM INVESTMENT MONITOR 2016
TOURISM INVESTMENT MONITOR 2016
July 2016

Tourism Research Australia Austrade GPO Box 2386 Canberra ACT 2601 Email: [email protected] Web: www.tra.gov.au
Publication date: July 2016
This work is licensed under a Creative Commons Attribution 3.0 Australia licence. To the extent that copyright subsists in third party quotes and diagrams it remains with the original owner and permission may be required to reuse the material.
This work should be attributed as Tourism Investment Monitor 2016, Tourism Research Australia, Canberra.
Enquiries regarding the licence and any use of work by Tourism Research Australia are welcome at [email protected]
Cover image: Millions of passengers fly from Sydney Airport each year, supplied by Sydney Airport.

TOURISM INVESTMENT MONITOR 2016 TOURISM RESEARCH AUSTRALIAi
CONTENTS
2015 - A REMARKABLE YEAR FOR TOURISM INVESTMENT ....................1
AUSTRALIA’S TOURISM INVESTMENT PIPELINE 2015 ............................2
1. OVERVIEW ................................................................................................................. 32. INFLUENCES ON 2015’S INVESTMENT ENVIRONMENT ............................................... 43. THE 2015 INVESTMENT PIPELINE .............................................................................. 74. CONCLUSION ........................................................................................................... 11
AVIATION .............................................................................................12
ARTS, RECREATION AND BUSINESS SERVICES INFRASTRUCTURE .......14
ACCOMMODATION ...............................................................................15
MIXED-USE ACCOMMODATION PROJECTS ............................................17
ii
FIGURES
FIGURE 1: TOURISM INVESTMENT PIPELINE – VALUE OF INVESTMENT BY SECTOR AND STATE/TERRITORY, 2015 ...................................................................... 8
FIGURE 2: TOURISM INVESTMENT PIPELINE PROGRESS, BY VALUE, 2011–2015 ........... 9
FIGURE 3: PIPELINE PROGRESS, BY VALUE AND VOLUME, 2015 COMPARED TO 2014 ........................................................................................... 10
FIGURE 4: CHANGE IN AVIATION INVESTMENT, 2015 COMPARED TO 2014 ................... 12
FIGURE 5: TRANSACTION VOLUMES AND NUMBER OF TRANSACTIONS, 2000 TO 2015 ............................................................................................................. 15
FIGURE 6: CHANGE IN ACCOMMODATION INVESTMENT, 2015 COMPARED TO 2014 ...... 16
FIGURE 7: MIXED-USE INVESTMENT, 2012 TO 2015 .................................................... 17
FIGURE 8: MIXED-USE INVESTMENT BY STATE/TERRITORY, 2015 ................................. 18

TOURISM INVESTMENT MONITOR 2016TOURISM RESEARCH AUSTRALIA1
UNDER E
MBARGO
2015 - A REMARKABLE YEAR FOR TOURISM INVESTMENT
Offshore capital still features for development projects but to a lesser extent given the nuances of working with local planning regimes. Site availability, record low interest rates and the strong residential market triggering hotel/serviced apartment components have all been contributing factors onshore whereas the push for diversification and a succession of Free Trade Agreements has encouraged more overseas developers to look for opportunities in the Australian market. New construction technology is also bringing new product and players into the mix.
Development activity is greatest in the major centres of Sydney, Melbourne, Brisbane and Perth and with a high proportion of new hotels pitched at the upscale and luxury end, reflecting the predominance of mixed-use developments. In Sydney, near-term supply additions are spread across the broader metropolitan with few CBD projects underway. Those that have been announced are scheduled to open over the long term and will follow the closure of a number of properties in the city/fringe for conversion to alternate use. Trading fundamentals in Sydney are therefore expected to remain sound.
More broadly, Australian tourism is capturing the attention of new sources of investment capital as offshore investors, private equity firms and domestic privates look to secure a first mover advantage and capitalise on the sector’s recent and projected growth. Golf, food, wine, cruise, leisure attractions and technology all feature in the current Australian tourism narrative.
BY KAREN WALES, SENIOR INVESTMENT SPECIALIST (TOURISM), AUSTRADE
2015 was another remarkable year for investment in Australia’s tourism sector with record levels of hotel transaction activity and new pricing benchmarks being set.
Sydney proved the highlight, while investor demand for Gold Coast hotels ramped up on the back of investments in infrastructure and the expectation that Chinese visitation will increase. Moving forward we expect to see increased activity in Melbourne, while dislocation in the resource markets will likely hamper deal flow.
Offshore investment has been the key driver with capital predominantly being sourced from South East Asia and Greater China but with a growing level of enquiry from Japan and the Middle East. On the whole, however, quality stock remains limited and is forecast to become scarce over the next few years. This is driving pricing while adjusting for lower volumes in future years.
Australia’s accommodation development pipeline is also at a decade high with new openings expected to peak in 2018. The commencement of major infrastructure projects in some markets and high levels of residential development, however, could see construction costs spike, which may in turn slow the forward pipeline of rooms.

2
UNDER E
MBARGO
TRA.GOV.AU
AUSTRALIA’S TOURISM INVESTMENT PIPELINE 2015
Notes: All changes are as compared to 2014. Go to tra.gov.au for the full report and information on how projects are classified & accounted for.The size and value of the total tourism investment pipeline includes 12 accommodation projects worth $1.0 billion that were completed in2015. The total pipeline does not account for the remaining 10 aviation and arts, recreation and business services projects worth $1.2 billionthat were also completed in 2015. This is due to benchmarking the progress of the Tourism 2020 accommodation rooms target.
$59.8bTOTAL VALUE OF PIPELINE
6 PROJECTS▶173 PROJECTS
1.
CAPITAL CITIES AVIATION FLEET REGIONAL
$8.8b 12 PROJECTS
AVIATION INFRASTRUCTURE $539m
4 PROJECTS
$13.2b 52 PROJECTS
ARTS, RECREATION & BUSINESS SERVICES
$1.4b 12 PROJECTS
$6.8b 13,830 ROOMS
70 PROJECTS
ACCOMMODATION $830m 2,060 ROOMS
16 PROJECTS
MIXED USECAPITAL CITIES
$29.4b15,100 ROOMS
63 PROJECTS
REGIONAL
$5.7b8,900 ROOMS
16 PROJECTS
$35.1b24,000 ROOMS
$9.4b $1.6b
$14.6b $0.7b
$7.6b $0.6b15,900 ROOMS 330
$28.2b $7.8b$28.8b
134 PROJECTS$2.8b
32 PROJECTS▶$6.5b
$1.5b
5,700

TOURISM INVESTMENT MONITOR 2016 TOURISM RESEARCH AUSTRALIA3
1. OVERVIEW The fifth in the series, Tourism Research Australia’s (TRA)Tourism Investment Monitor 2016 (Monitor) estimates the number and total value of large-scale projects in Australia’s tourism investment pipeline in 2015. Results in this year’s monitor reflect a consistent methodology used in previous editions of the report and provide benchmarks for growth comparisons.
n There were 173 projects in the tourism investment pipeline in 2015 – up by a net 6 projects from 2014
n They were valued at $59.8 billion – up $6.5 billion (or 12 per cent)
�Aviation projects accounted for the majority of the pipeline – $37.6 billion (mainly in new aircraft orders)
�Arts, recreation and business services infrastructure projects were valued at $14.6 billion
�Accommodation projects were valued at $7.6 billion – providing a potential 15,900 new rooms to accommodation supply.
Growth in the pipeline was supported by strong investor appetite for projects in each of the sectors:
n The arts, recreation and business services pipeline saw strong interest with 15 new projects worth $1.6 billion entering the pipeline in 2015. Many of these projects are in regional Australia and once completed will help drive dispersal of international and domestic visitors into the regions.
n The value of the aviation pipeline increased largely as a result of the devaluation of fleet orders (after a 17 per cent decline in the value of the Australian dollar against the US dollar in 2015). Three airport projects worth $480 million were completed in 2015, while 6 new aviation infrastructure projects worth $495 million were added to the pipeline.
n The value of the accommodation pipeline declined. However, there has been a shift in investor focus to increasingly pursue mixed-use developments, rather than typical ‘standalone’ hotels. These types of developments offer increased returns and diversification of risk across a variety of complementary uses, making them attractive to investors. Mixed-use projects are very common in Asia and many developers in Australia now see them as the future for real estate development.
n In addition to the $59.8 billion tourism investment pipeline, this year’s monitor identifies very strong growth in mixed-use developments. These developments were valued at $35.1 billion (up $1.5 billion, compared to 2014) across 79 projects (up by a net 10 projects). They have the potential to generate a total of around 24,000 new rooms if realised (up by an additional 5,700 rooms). When combined with the anticipated additional 15,900 rooms from standalone accommodation projects, accommodation supply could grow by around an additional 39,900 rooms, if all projects are fulfilled in their publicised forms.
The current strength of the tourism investment pipeline is supported by continued investor appetite for Australian tourism infrastructure investment projects. Demand for tourism services also continues to go from strength to strength, increasing the importance of the industry’s contribution to the Australian economy. Combined, this places Australia’s tourism industry in a good position to attain its goals set under Tourism 2020.
Specific targets of Tourism 2020 include: growing overnight visitor expenditure to between $115 billion and $140 billion; growing accommodation supply by up to an additional 20,000 rooms; growing international aviation capacity by between 40 and 50 per cent; growing domestic aviation capacity by between 23 and 30 per cent; and growing the tourism labour force by up to an additional 152,000 workers to meet demand.
Image: Sydney Airport’s baggage system Image courtesy of Sydney Airport

4
2. INFLUENCES ON 2015’S INVESTMENT ENVIRONMENT
SOLID ECONOMIC CONTRIBUTION BY THE TOURISM INDUSTRY (2014–15)$
n Direct tourism GDP – $47.5 billion, or 3.0 per cent of total GDP
n Direct employment – 580,800 persons, or 5.0 per cent of total employment
International events continued to stimulate arrivals to Australia.
Very strong growth in arrivals during February and March 2015 (up 14.7% and 13.5%, respectively) coincided with the Asian Football Cup, the ICC Cricket World Cup and Lunar New Year (ABS, 2016a).
n Total exports – $30.7 billion, or 9.6 per cent of total exports – this makes the tourism industry one of Australia’s largest export industries (ABS, 2016b).
RECORD BREAKING INTERNATIONAL VISITOR ARRIVALS & SPEND
FOR YEAR ENDING DECEMBER 2015 (ABS, 2016a):
n International arrivals reached 7.4 million – up 8.1 per cent on the previous 12 months
n China remained a very strong driver of growth in arrivals – up 22 per cent to 1.0 million arrivals, with strong growth also coming from India (up 18.6 per cent to 233,600 visitors)
n Arrivals continue to be driven by leisure travel (holiday and visiting friends and relatives – VFR, combined), and now account for almost three-quarters of all international visitors (74 per cent) – holiday arrivals were up 9.6 per cent and VFR was up 7.7 per cent
n International visitors travelling for education purposes saw very strong growth over the period – up 18.4 per cent.
FOR YEAR ENDING DECEMBER 2015 (TRA, 2016a):
n International visitors spent a record 248.1 million nights in Australia – up 11.3 per cent – representing an average length of stay of 36 nights per trip in Australia. Nights spent in hotels, motels and serviced apartments grew 6.7 per cent to the highest level since 2005.
n International visitor nights spent in a rented house or apartment, or the property of a friend or relative continued to increase in share, accounting for 39 per cent of total nights and 31 per cent of total nights, respectively.
n International visitor spend reached $36.6 billion – up 17.7 per cent.
FORECASTS FOR 2014–15 TO 2024–25 (TRA, 2015):
n International arrivals are forecast to increase 5.6 per cent per year to 12.3 million.
n Two thirds of the additional 5.2 million arrivals to 2024–25 are expected to come from Australia’s top five inbound markets (New Zealand, China, UK, US and Singapore), while China is expected to contribute over (40 per cent) of total growth.
n Total international visitor expenditure (real terms) is forecast to increase by 6.0 per cent per year to $67.8 billion.

TOURISM INVESTMENT MONITOR 2016 TOURISM RESEARCH AUSTRALIA5
RECORD BREAKING DOMESTIC OVERNIGHT TRIPS & SPEND
FOR YEAR ENDING DECEMBER 2015 (TRA, 2016b):
n Domestic overnight trips reached 87.1 million for the first time on record – an increase of 6.9 per cent compared to the same period in 2015.
n Domestic visitors spent a record 322 million nights travelling in Australia – up 4.2 per cent – representing an average length of stay of 3.7 nights per trip. Nights spent in hotels, motels and serviced apartments grew at a faster rate of 8.0 per cent, reaching the highest level on record.
n Domestic visitor nights accounted for 76 per cent of total nights spent in hotels, motels and serviced apartments.
n Overnight trips were underpinned by a spike in overnight business trips – up 12.7 per cent – and increased holiday visitors – up 6.6 per cent.
n Domestic overnight spend reached a record high of $57.9 billion – up 6.4 per cent.
FORECASTS FOR 2014–15 TO 2024–25 (TRA, 2015):
n Domestic overnight trips are forecast to increase 3.5 per cent per year to 117.6 million.
n Total domestic overnight visitor expenditure is forecast to increase by 2.6 per cent per year to $72.4 billion (in real terms).
INCREASED AVIATION CAPACITY
n Inbound aviation capacity increased, with growth in the number of international seats available – up 1.5 per cent in 2015 (BITRE, 2016b).
n Increased capacity out of the United Arab Emirates (UAE), the US, New Zealand and China drove overall inbound capacity growth in 2015. Capacity growth was also achieved out of the Philippines, Japan, and Hong Kong.
n Capacity from Malaysia and Indonesia decreased over the same period, primarily due to a revaluation of routes and decreased confidence in a number of international airlines.
n China saw increased growth driven by a newly signed air services agreement with Australia which will facilitate a significant increase in capacity in the years ahead.
n Domestically, the number of seats available declined marginally (down 0.3 per cent in 2015) – resulting in a similar decline in domestic available seat kilometres (down 0.3 per cent in 2015) (BITRE, 2016a).
n Domestic capacity growth continued with most of the growth on shorter city pair routes including Sydney-Melbourne, Sydney-Tamworth and Cairns-Townsville in 2015.
n City pair routes that declined include Canberra-Sydney, Karratha-Perth and Brisbane-Rockhampton.
MODERATE ACCOMMODATION PERFORMANCE, WEAKER IN REGIONAL AREAS
FOR YEAR ENDING JUNE 2015 (ABS, 2015):
n Establishments – 4,464 establishments, down 0.4 per cent (or 19 establishments)
n Room supply – 248,573 rooms, up 0.4 per cent (or 1,035 rooms) despite a decline in regional areas
n Room nights occupied – 58.4 million nights, up 0.9 per cent (or 500,382 nights)
n Room occupancy rate – 64.9 per cent, up 0.5 percentage points
n Takings from accommodation – $10.0 billion, up 3.2 per cent (or $314 million)
n Yield (revenue per room night available / RevPAR) – $111 per night, up 3.1 per cent (or $4.70 per night).
Image: White Night Melbourne 2014 Image courtesy of Roberto Seba and Tourism Australia

6
ACROSS THE CAPITAL CITIES1 IN 2014–15:
n Demand for accommodation increased, with an additional 683,757 nights occupied through the year (up 1.9 per cent), outpacing growth in the number of room nights available
n The average occupancy rate increased to 75.5 per cent (up 0.5 percentage points)
n Total takings grew to $6.7 billion (up 4.0 per cent), with yield reaching $140 per available night.
REGIONALLY, THE ACCOMMODATION SECTOR’S PERFORMANCE WAS WEAK:
n Accommodation supply declined (rooms down 1.1 per cent or 1,333 rooms, establishments down 1.0 per cent or 30 establishments, room nights available down 1.2 per cent or 490,958 nights)
n Demand for accommodation declined (room nights occupied down 0.8 per cent or 183,375 nights)
n The marginally slower rate of decline in demand for accommodation saw muted growth in the average occupancy rate to 52.8 per cent (up 0.2 percentage points)
n Takings from accommodation increased marginally to reach $3.3 billion (up 1.7 per cent), with yield increasing 2.9 per cent to $78 per available night.
1 Capital cities are defined as all state capital city tourism regions and the Gold Coast
The Australian accommodation sector performed moderately in 2014–15, after a relatively weak performance in 2013–14. Nationally, the supply of accommodation rooms increased through the year with an additional 1,035 rooms added to supply, although the number of establishments declined marginally – down 0.4 per cent or 19 establishments, when compared to reweighted 2013–14 data (ABS, 2015).
Demand for accommodation grew marginally, with an additional 500,382 nights occupied through the year – up 0.9% – and outpaced growth in the number of room nights available – up 0.1%. As a result, the national occupancy rate increased to 64.9% through the year.
Stronger demand growth (compared to supply growth) resulted in yield increasing to an average of $111 per available night. Combined with increased supply of accommodation, total takings from the sector grew moderately to reach $10.0 billion.
Image: Sydney Hotels Image courtesy of Masaru Kitano snaK Productions and Tourism Australia

TOURISM INVESTMENT MONITOR 2016 TOURISM RESEARCH AUSTRALIA7
3. THE 2015 INVESTMENT PIPELINE
TOTAL INVESTMENT PIPELINE $59.8b
ACTIVITY
New projects n 47 new projects entered in 2015
n value $3.4 billion
Progressing projects n 16 projects progressed from the Under consideration/possible stages to
Committed/under construction
n value $2.0 billion
Completed projects n 22 projects reached completion
n value $2.2 billion
PROJECTS
Aviation
$37.6b $6.3b
n 16 airport infrastructure projects valued at $9.4 billion ( $1.6 billion)
n $28.2 billion in aircraft (fleet) investment ( $7.8 billion)
Arts, Recreation & Business Services
$14.6b $0.7b
n 64 infrastructure projects
n 7 projects
Accommodation
$7.6b $0.6b
n 86 accommodation projects accounting for 15,900 expected new rooms
n 2 projects (net)
n 330 rooms (net)
DISTRIBUTION
n Aviation infrastructure projects were concentrated in the main airport hub states:
�New South Wales (2 projects valued at $2.8 billion)
�Victoria (3 projects, $2.5 billion)
�Queensland (4 projects, $2.1 billion)
�Western Australia (5 projects, $2.0 billion)
n Arts, recreation and business services infrastructure projects were concentrated in:
�New South Wales (16 projects, valued at $3.9 billion)
�Western Australia (10 projects, $3.2 billion)
�Victoria (12 projects, $2.5 billion)
n Accommodation projects were concentrated in:
�New South Wales (23 projects valued at $2.7 billion)
�Queensland (23 projects, $1.9 billion)
�Western Australia (19 projects, $1.9 billion)
Two-thirds (66%, or 102 projects) of non-fleet projects in the 2015 tourism investment pipeline (valued at $20.9 billion) were located in New South Wales, Victoria and Queensland (Figure 1).
$6.5b

8
FIGURE 1: TOURISM INVESTMENT PIPELINE – VALUE OF INVESTMENT BY SECTOR AND STATE/TERRITORY, 2015
27%28%45%
$7.0 BILLION 22%
100%
$152 MILLION 0.5%
$6.0 BILLION 19%
32%35%34%
29%30%41%
$9.3 BILLION 29%
12%
88%
$795 MILLION 2.5%
22%12%
66%
$509 MILLION 1.6%
11%
45% 45%
$5.6 BILLION 18%
9%
91%
$2.3 BILLION 7%
ACCOMMODATIONAVIATION INFRASTRUCTUREARTS, RECREATION AND BUSINESS
TOURISM INVESTMENT PIPELINE - 2015
$59.8 BILLION*
* Includes $28.2 billion in fleet expansion not allocated to states/territories
Source: Brisbane Marketing; CAPA; DAE; JLL; STR Global; TRA

TOURISM INVESTMENT MONITOR 2016 TOURISM RESEARCH AUSTRALIA9
The size of the tourism investment pipeline increased in 2015, and included a total of 173 projects worth $59.8 billion – a net increase of $6.5 billion (or 12.0 per cent) in value and a net increase of 6 projects from 2014 (Figure 2). Since 2011, the value of the tourism investment pipeline has grown by $23.6 billion, with around $4.0 billion of projects completed and open for business over the same period.
2015
2014
2013
2012
2011UNDER CONSIDERATION/POSSIBLE
COMMITTED/UNDER CONSTRUCTION
RECENTLY COMPLETED*
$8.3b $27.9b
$11.8b $31.9b $0.5b
$11.7b $36.7b $1.0b
$21.0b $30.9b $1.5b
$19.2b $39.7b $1.0b
* ‘Recently completed’ only for the accommodation sector.
Source: Brisbane Marketing; CAPA; DAE; JLL; STR Global; TRA
The tourism investment pipeline identifies not only the size and value of total investment – the ‘stock’ – but also the size, value, and progress of projects within and between each of the phases of the investment pipeline – the ‘flow’. The phases of the pipeline include Under consideration/possible, Committed/under construction, and Recently completed. Together, these phases represent the ‘flow’ of projects through the pipeline. The Tourism Investment Monitor includes major investments valued at $20 million or more that will impact on supply. It does not claim to account for all tourism investments and is not designed to be an exhaustive list of current or potential development projects2.
2
2 For more information about how the tourism investment pipeline is constructed and measured, and how projects are classified and included, please see the Tourism Investment Monitor methodology at tra.gov.au
FIGURE 2: TOURISM INVESTMENT PIPELINE PROGRESS, BY VALUE, 2011–2015

10
FIGURE 3: PIPELINE PROGRESS, BY VALUE AND VOLUME, 2015 COMPARED TO 2014
15
12
9
6
3
0
80
70
60
50
40
30
20
10
0
VALU
E (
$B
ILLI
ON
)
PR
OJE
CTS
(N
O.)
VALUE ($BILLION) PROJECTS (NO.)
NEW PROJECTS
PROGRESS FROM
PLANNING TO COMMITTED
PROJECTS ABANDONED
PROJECTS COMPLETED
NEW PROJECTS
PROGRESS FROM
PLANNING TO COMMITTED
PROJECTS ABANDONED
PROJECTS COMPLETED
2014
2015
Source: Brisbane Marketing; CAPA; DAE; JLL; STR Global; TRA
Image: Construction of Cairns Aquarium Image courtesy of Cairns Aquarium

11
4. CONCLUSIONThe Australian tourism investment pipeline was sizeable in 2015 – 173 projects valued at $59.8 billion. The growth in the value of the pipeline (up $6.5 billion and a net increase of six projects, compared to 2014) has been supported by strong growth in the number and value of investment projects located not just in metropolitan areas of Australia, but also in regional areas. Growth in the number and value of regional projects in the pipeline indicates that investors are willing to invest in regional areas, for the right projects. This interest will assist to improve access to regional Australia, which should in turn assist to encourage greater visitor dispersal out of the capital cities.
Growth in the number and value of arts, recreation and business services projects (64 projects worth $14.6 billion – up seven projects worth $700 million) will assist to drive tourism activity to destinations, and can encourage longer stays and repeat visitation. In regional Australia, 12 projects worth $1.4 billion are in the pipeline. These range from theme parks, art galleries and zoos to convention centres, stadiums and aquatic centres.
Increased attention is now on airports outside of the major gateways, with projects across seven airports now in the pipeline (worth over $880 million). Once completed, this will improve international and domestic visitors’ access to the regional areas that these airports service, and result in greater regional dispersal of visitors away from the major gateways.
Although the value of the accommodation pipeline declined in 2015 (down $580 million), this has been more than offset by the growth in mixed-use developments (up $1.5 billion and 10 projects). This represents a shift in focus of investors from typical ‘standalone’ hotels into developments that include a short-term accommodation component combined with other non-tourism components (like residential, office or retail spaces).
These ‘shifts’ in focus are consistent with the investment outlook for Australia’s tourism industry. Investors are increasingly turning to projects that can yield strong returns quickly, for example, mixed-use developments. Governments are also increasingly facilitating investment activities in regional areas, to drive and support regional growth. These shifts will be beneficial for Australia’s tourism industry, helping it remain globally competitive, increasing supply and improving the quality of its tourism product offering.
Image: Echidna at Taronga Zoo, Sydney, NSW Image courtesy of Ellenor Argyropoulos and Tourism Australia

AVIATION
INFRASTRUCTURE$9.4b $1.6b
FLEET$28.2b $7.8b
TOTAL $37.6b $6.3b
THE PIPELINEThe aviation pipeline consists of investment in both infrastructure projects, including passenger terminals, runways and associated infrastructure, and investment by Australian airlines in new fleet.
The value of the 2015 aviation investment pipeline increased by $6.3 billion compared to 2014 (Figure 4). This was mainly due to a $7.8 billion increase in aviation fleet investment,
FIGURE 4: CHANGE IN AVIATION INVESTMENT, 2015 COMPARED TO 2014
8,000
7,000
6,000
5,000
4,000
3,000
2,000
1,000
0
-1,000
CH
AN
GE
($
MIL
LIO
N)
UNDER CONSIDERATION/
POSSIBLE
COMMITTED UNDER CONSTRUCTION TOTAL COMPLETED/ DELIVERED
AVIATION INFRASTRUCTURE
AIRCRAFT ORDERS
TOTAL
Source: Airbus, Boeing; CAPA; DAE; TRA
AVIA
TIO
N
driven by the devaluation of the Australian dollar against the US dollar. This contributed to the increased cost of aircraft in 2015 compared to 2014. Investment in aviation infrastructure projects declined by $1.6 billion through the year, although the net number of infrastructure projects increased to 16 projects, thanks to increased investment in a number of regional airports.

13
AVIATION
AVIA
TIO
N
AVIATION INFRASTRUCTURE INVESTMENTIn 2015, aviation infrastructure projects were worth $9.4 billion across 16 projects. Although the value of the pipeline declined in 2015, activity expanded with the addition of six new projects, valued at $495 million.
PLANNING/ UNDER
CONSIDERATION
PROJECTS: 12 VALUE: $7.0b
PROJECTS: 4 VALUE: $2.4b PROJECTS: 3
VALUE: $480m
PROJECTS: 1 VALUE: $1.6b
PROJECTS: 6 VALUE: $495m
NEW
COMMITTED/ IN CONSTRUCTION
COMPLETED
EXITED
The major international gateway cities – Sydney, Melbourne, Brisbane and Perth – continue to be responsible for much of the value of the aviation infrastructure pipeline ($8.5 billion), bolstered by a number of large scale projects including:
n Western Sydney Airport development at Badgerys Creek – $2.5 billion
n Essendon Fields Airport redevelopment in Melbourne – $2.0 billion
n Perth Airport international and domestic terminals upgrade and third runway construction – $1.85 billion
n Brisbane Airport domestic terminal expansion and parallel runway construction – $1.4 billion.
Aviation infrastructure continues to be a key element in driving international demand and access to regional destinations. In 2015, the aviation pipeline included projects across seven airports outside of the gateway airports, valued at over $880 million:
n Sunshine Coast Airport – $419 million runway upgrade
n Gold Coast Airport – $250 million terminal upgrade
n Hobart International Airport – $63 million terminal and runway upgrade
n Busselton Airport – $60 million runway upgrade
n Port Hedland International Airport – $40 million upgrade
n Karratha Airport – $35 million upgrade
n Mildura Regional Airport – $20 million upgrade.
In 2015, three projects (valued at $480 million) were completed and exited the pipeline, including the new domestic terminal and associated works at Melbourne Airport (valued at $400 million); Brisbane Airport international terminal redevelopment ($45 million); and the Karratha Airport upgrade ($35 million).
AIRCRAFT INVESTMENT
AIRCRAFT: 163 VALUE: $28.2b
AIRCRAFT: 2 VALUE: $345m
ON ORDER DELIVERED
The value of aircraft under consideration, on order or under construction amounted to around $28.2 billion in 20153. Qantas Group accounted for around $21.3 billion and Virgin Australia $6.9 billion of the total fleet orders.
In 2015, there were two aircraft delivered worth around $345 million, compared to the 18 aircraft that were delivered in 2014. These aircraft deliveries included the last of Jetstar’s Boeing 787 Dreamliner order.
Qantas and Virgin Australia have options to purchase up to 45 additional Boeing 787 Dreamliner aircraft not included in this analysis4. If both Qantas and Virgin Australia were to exercise these options, (TRA) estimates this additional investment would be worth around $16.5 billion.
3 This estimate does not differentiate between aircraft that are either owned outright or leased by the airline. It is common practice by airlines to operate aircraft using a ‘sale and leaseback’ arrangement.
4 Fleet options are not included directly in the tourism investment pipeline, as this type of aircraft order can be highly subject to change.
Source: Airbus; Boeing; Qantas; Virgin.
Source: DAE; TRA

TOURISM INVESTMENT MONITOR 2016 TOURISM RESEARCH AUSTRALIA14
ARTS, RECREATION AND BUSINESS SERVICES INFRASTRUCTURE
ARTS
, REC
RE
ATIO
N A
ND
BU
SIN
ESS
SER
VICE
S IN
FRAS
TRU
CTU
RE
CONSIDERED/POSSIBLE $8.8b $625m
COMMITTED/CONSTRUCTION$5.8b $120m
TOTAL $14.6b $750m
THE PIPELINEThe infrastructure investment pipeline was worth $14.6 billion in 2015, consisting of 64 projects – a net increase of $750 million and 7 projects compared to 2014.
In 2015, 15 new projects entered the pipeline, valued at $1.6 billion. Of these, 11 were in the Under consideration/possible phase. The largest projects include:
n New Canberra Convention Centre – $700 million
n Sydney Opera House upgrade – $200 million.
The investment pipeline consisted of 27 projects in the Committed/under construction phase (valued at $5.8 billion). Four of these projects entered the pipeline in 2015, while 5 projects transitioned from the Under consideration/possible phase in 2014 into the Construction phase in 2015.
Additionally, eight projects exited the pipeline in 2015 of which 7 (valued at $700 million) were completed, and 1 (valued at $20 million) exited the pipeline before completion.
Regional investment in arts, recreation and business services infrastructure increased to 12 projects, valued at $1.4 billion in 2015, including:
n Chinese Theme Park in Warnervale, New South Wales – $500 million
n Townsville Integrated Stadium and
PLANNING/ UNDER
CONSIDERATION
PROJECTS: 37 VALUE: $8.8b
PROJECTS: 27 VALUE: $5.8b PROJECTS: 7
VALUE: $700m
PROJECTS: 1 VALUE: $20m
PROJECTS: 15 VALUE: $1.6b
NEW
COMMITTED/ IN CONSTRUCTION
COMPLETED
EXITED
Sporting facilities continue to be a major driver of investment, with 28 projects valued at $6.1 billion directly related to sporting complexes, arenas, stadiums and ovals in the pipeline. Major works include:
n Perth Stadium construction – $1.2 billion
n Moonee Valley Racecourse development – $1.4 billion
n Penrith Stadium redevelopment – $500 million.
INFRASTRUCTURE INVESTMENT
Entertainment Precinct, Queensland – $315 million.
Source: DAE; TRA
15
ARTS, RECREATION AND BUSINESS SERVICES INFRASTRUCTURE ACCOMMODATION
ACCO
MM
OD
ATIO
N
VALUE $7.6b $580m
ROOMS15,900 330
TRANSACTIONS $4.2b $1.4b
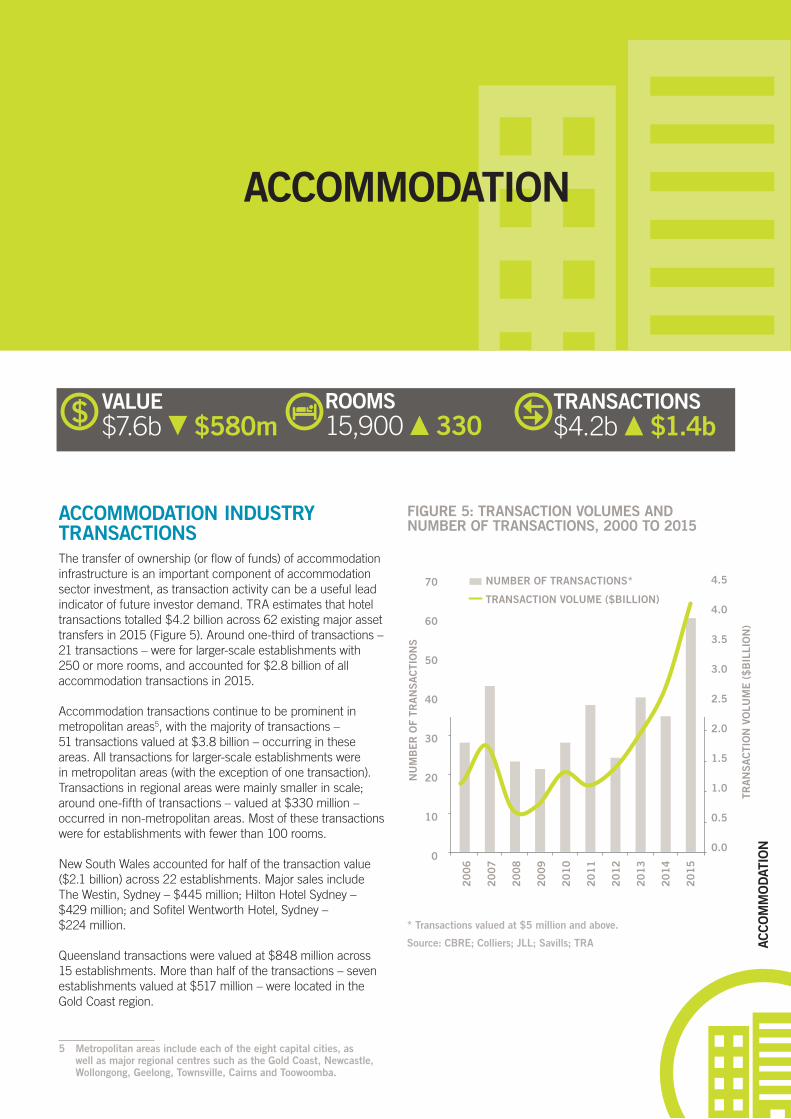
ACCOMMODATION INDUSTRY TRANSACTIONSThe transfer of ownership (or flow of funds) of accommodation infrastructure is an important component of accommodation sector investment, as transaction activity can be a useful lead indicator of future investor demand. TRA estimates that hotel transactions totalled $4.2 billion across 62 existing major asset transfers in 2015 (Figure 5). Around one-third of transactions – 21 transactions – were for larger-scale establishments with 250 or more rooms, and accounted for $2.8 billion of all accommodation transactions in 2015.
Accommodation transactions continue to be prominent in metropolitan areas5, with the majority of transactions – 51 transactions valued at $3.8 billion – occurring in these areas. All transactions for larger-scale establishments were in metropolitan areas (with the exception of one transaction). Transactions in regional areas were mainly smaller in scale; around one-fifth of transactions – valued at $330 million – occurred in non-metropolitan areas. Most of these transactions were for establishments with fewer than 100 rooms.
New South Wales accounted for half of the transaction value ($2.1 billion) across 22 establishments. Major sales include The Westin, Sydney – $445 million; Hilton Hotel Sydney – $429 million; and Sofitel Wentworth Hotel, Sydney – $224 million.
Queensland transactions were valued at $848 million across 15 establishments. More than half of the transactions – seven establishments valued at $517 million – were located in the Gold Coast region.
5 Metropolitan areas include each of the eight capital cities, as well as major regional centres such as the Gold Coast, Newcastle, Wollongong, Geelong, Townsville, Cairns and Toowoomba.
FIGURE 5: TRANSACTION VOLUMES AND NUMBER OF TRANSACTIONS, 2000 TO 2015
70
60
50
40
30
20
10
0
4.5
4.0
3.5
3.0
2.5
2.0
1.5
1.0
0.5
0.0
20
06
20
07
20
08
20
09
20
10
20
11
20
12
20
13
20
14
20
15
NU
MB
ER
OF
TRA
NS
AC
TIO
NS
TRA
NS
AC
TIO
N V
OLU
ME
($
BIL
LIO
N)
NUMBER OF TRANSACTIONS*
TRANSACTION VOLUME ($BILLION)
* Transactions valued at $5 million and above.
Source: CBRE; Colliers; JLL; Savills; TRA

TOURISM INVESTMENT MONITOR 2016 TOURISM RESEARCH AUSTRALIA16
ACCO
MM
OD
ATIO
N
ACCOMMODATION INVESTMENTPLANNING/
UNDER CONSIDERATION
PROJECTS: 39 VALUE: $3.4bROOMS:7,760
PROJECTS: 35 VALUE: $3.2bROOMS:6,590 PROJECTS: 12
VALUE: $1.0b ROOMS:1,540
PROJECTS: 2 VALUE: $436mROOMS:360
PROJECTS: 26 VALUE: $1.3bROOMS:4,480
NEW
COMMITTED/ IN CONSTRUCTION
COMPLETED
EXITED
The accommodation investment pipeline was worth $7.6 billion in 2015, consisting of 86 projects – a net decrease of $580 million compared to 2014 (Figure 6).
Strong investment interest in accommodation developments realised 26 new accommodation projects in the 2015 pipeline – valued at $1.3 billion and accounting for 4,480 rooms. Of these new projects, nine had progressed into the Construction phase by the end of 2015, and four projects had opened for business. Key accommodation projects that entered the TRA tourism investment pipeline in 2015 include:
n Elements of Byron MGallery Collection – $100 million, 193 rooms
n Aloft Hotel, Adelaide – $100 million, 200 rooms
n The Courtyard, Perth – $47 million, 330 rooms.
More than one-third of the projects in the accommodation pipeline (34 projects) were in the Under Construction phase – valued at $2.9 billion and accounting for 6,380 rooms. Around one-third of projects under construction (11 projects) progressed from the Under Consideration/possible phase in 2014. The largest projects in the Under construction phase
include:
The completion of 12 projects in 2015 – valued at $1.0 billion – added 1,540 new rooms to accommodation supply.
While capital cities continue to be of major interest to investors looking for accommodation projects, 16 projects were located in regional Australia (valued at $829 million), accounting for 2,060 new rooms to regional supply. Around half of regional accommodation projects are currently under construction in region. Key regional projects include:
n Quality Hotel Regent, Rockhampton – $200 million, 50 rooms
n Elements of Byron MGallery Collection – $100 million, 193 rooms
n Acacia Court Hotel extension, Cairns – $80 million, 271 rooms.
FIGURE 6: CHANGE IN ACCOMMODATION INVESTMENT, 2015 COMPARED TO 2014
UNDER CONSIDERATION/
POSSIBLE
COMMITTED/ UNDER
CONSTRUCTION
RECENTLY COMPLETED
SOLD
TOTAL
n Sofitel Darling Harbour, Sydney – $500 million, 600 rooms
n Jupiters Hotel and Casino extension, Gold Coast – $350 million, 80 new rooms
n Como the Treasury, Perth – $208 million, 48 rooms.
SOLD
-$1.3b
$1.2b
-$0.5b
$1.4b
-$0.6b
-830
2,680
-1,515
330
VALUE ($MILLION) ROOMS (N0.)
Source: DAE; TRA
Source: DAE; JLL; STR Global; TRA; Brisbane Marketing

TOURISM INVESTMENT MONITOR 2016 TOURISM RESEARCH AUSTRALIA17
MIX
ED-U
SE A
CCO
MM
OD
ATIO
N P
RO
JECT
S
MIXED-USE ACCOMMODATION PROJECTS
VALUE $35.1b $1.5b
ROOMS24,000 5,700
PROJECTS 79 10
FIGURE 7: MIXED-USE INVESTMENT, 2012 TO 2015
VALUE ($MILLION)
ROOMS (NO.)
VALUE ($MILLION)
ROOMS (NO.)
VALUE ($MILLION)
ROOMS (NO.)
VALUE ($MILLION)
ROOMS (NO.)
0 5,000 10,000 15,000 20,000 25,000 30,000 35,000 40,000 45,000
UNDER CONSIDERATION/POSSIBLE
COMMITTED/UNDER CONSTRUCTION
RECENTLY COMPLETED20
12
20
13
20
14
20
15
Source: Brisbane Marketing; DAE; JLL; STR Global; TRA
THE PIPELINEA shift towards mixed-use projects for accommodation investment has continued, with the 2015 investment pipeline showing 79 projects valued at $35.1 billion and the potential to generate around an additional 24,000 rooms. This is an increase of 10 projects, $1.5 billion and around 5,700 rooms compared to 2014 (Figure 7).
In 2015:
n 2 mixed-use projects valued at $180 million reached completion, delivering 387 new rooms to accommodation supply.
n 19 new projects entered the pipeline valued at $6.3 billion, with the potential to add more than 3,600 rooms to accommodation supply.
n 7 projects valued at $2.6 billion progressed from the Under consideration/possible phase to the Committed/under construction phase.
n 33 projects valued at $15.2 billion were Under construction, and have the potential to add around 5,700 rooms to supply.

18
Queensland continues to attract the majority of mixed-use investment, with 15,400 rooms across 23 projects, valued at $16.4 billion (Figure 8). Key Queensland projects are dominated by integrated resort developments6, and include:
n Queen’s Wharf Integrated Resort – $3 billion – Brisbane
n Aquis Great Barrier Reef project – $2.0 billion – Yorkeys Knob
n ASF Consortium Gold Coast Integrated Resort – $2.0 billion – Broadwater
6 Integrated resorts are developments that include a mix of uses including a hotel, residential properties and other facilities
FIGURE 8: MIXED-USE INVESTMENT BY STATE/TERRITORY, 2015
$5.4 BILLION
142,270
$16.4 BILLION
2315,480
$0.9 BILLION
5270
$0.7 BILLION
6615$6.8 BILLION
143,280
$1.4 BILLION
7940
$3.2 BILLION
81,110
$0.2 BILLION
2110
ESTABLISHMENTS NO.
ROOMS NO.
VALUE$
MIX
ED-U
SE A
CCO
MM
OD
ATIO
N P
RO
JECT
S
Mixed-use development investment in New South Wales and Victoria now accounts for 28 projects valued at $12.2 billion. These projects have the potential to deliver around 5,500 rooms to accommodation supply. Fifteen of these projects (valued at $5.7 billion) are currently in the Under construction phase and have the potential to deliver more than 2,700 rooms to supply.
Source: DAE; JLL; STR Global; TRA; Brisbane Marketing; TRA

TOU
RIS
M IN
VES
TME
NT M
ON
ITOR
20
16
| July 20
16