tourism snapshot - destinationcanada.com · tourism snapshot march 2018 | 1 ... system at airports...
TRANSCRIPT

Tourism Snapshot March 2018 | 1
Tourism SnapshotA Monthly Monitor of the Performance of Canada’s Tourism Industry
March 2018Volume 14, Issue 2
www.destinationcanada.com© T
ouris
m S
aska
toon
/ C
arey
Sha
w
2 | Tourism Snapshot March 2018
• Over the first quarter of 2018, overnight arrivals from China surpassed arrivals from the United Kingdom, thus emerging as Destination Canada’s largest long-haul market for the first time ever in any quarter.
• In Q1 2018, Canada welcomed a record high 3.1 million international overnight visitors, representing a year-over-year gain of 9.3%, as arrivals from the US (+8.9%) reached their highest level since 2005 and Destination Canada’s nine long-haul markets (+10.8%) established a new peak for the first quarter of the year, respectively.
• With the Easter holiday period falling over the last weekend of March 2018, international overnight arrivals in that month registered a 15.1% gain, which was largely supported by a swell from the US (+16.2%) combined with solid growth performances from Destination Canada’s long-haul markets (+14.1%) and the rest of the world (10.1%).
• A surge in overnight arrivals in March 2018 from Mexico (+41.0%), the United States (+16.2%) and the United Kingdom (+9.5%) was in part associated with travels coinciding with the Easter holiday period. The March arrivals from these markets contributed to their performances over the first quarter of 2018, with Mexico leading the way (28.2%), followed by arrivals
from the United States by air (+12.9%), by automobile (+6.1%) and by other modes of transport (+7.5%), while the United Kingdom (-0.1%) recaptured losses sustained over the first two months of the year.
• The increase in overnight arrivals direct by air from Mexico in Q1 2018 (+72.7%) was commensurate with the increase in direct air capacity between Mexico City and Canada (+77.2%). Direct air arrivals accounted for 80.8% of overnight arrivals from Mexico over the first quarter of 2018.
• Overnight arrivals in March 2018 were also characterized by robust performances from Destination Canada’s Asia-Pacific Region (+15.2%), where new peak arrival levels from China (+34.2%), India (+30.1%), South Korea (+22.9%) and Australia (+9.4%) combined to mask a double-digit contraction from Japan (-16.6%). Year-to-date March 2018, tourist arrivals from the Asia-Pacific region were up 12.1%.
• In Q1 2018, overnight arrivals from Destination Canada’s nine long-haul markets varied by mode of entry, with direct air arrivals expanding fastest (+16.8%, representing 73.9% of tourist arrivals from these markets), which compensated for a contraction in arrivals via the US (-4.5%).
KEY HIGHLIGHTS
QUICK LINKS
Note the following caveat from Statistics Canada associated with the March 2018 data: Data for Statistics Canada’s Frontier Counts program are produced using administrative data received from the Canada Border Services Agency (CBSA) on all international travellers who have been cleared for entry or re-entry into Canada. This includes residents of Canada, the United States and overseas entering Canada from abroad.
In 2017, the CBSA began introducing the electronic Primary Inspection Kiosk (PIK) system at airports in Canada. The PIK system replaces the E-311 Declaration Cards that are completed by international travellers to Canada. As of the end of November, the PIK system was deployed at the following airports: Macdonald-Cartier, Ottawa (March 2017), Vancouver (April 2017), Toronto International Airport T3 (June 2017), Edmonton (September 2017), Halifax (October 2017), and Pierre-Elliot Trudeau, Montréal (November 2017).
While waiting for the introduction of PIK data into the frontier counts in the near future, Statistics Canada has prepared preliminary estimates for airports at which PIK has been deployed. These estimates are based on CBSA reports of total international travellers by airport, while the distribution between Canadian, US and travellers from individual overseas countries are modelled estimates based on historical data and trends, using methods similar to those used to do seasonal adjustment.
Tourism Snapshot March 2018 | 3
Industry Performance Dashboard
March 2018 YTD
Overnight Arrivals1
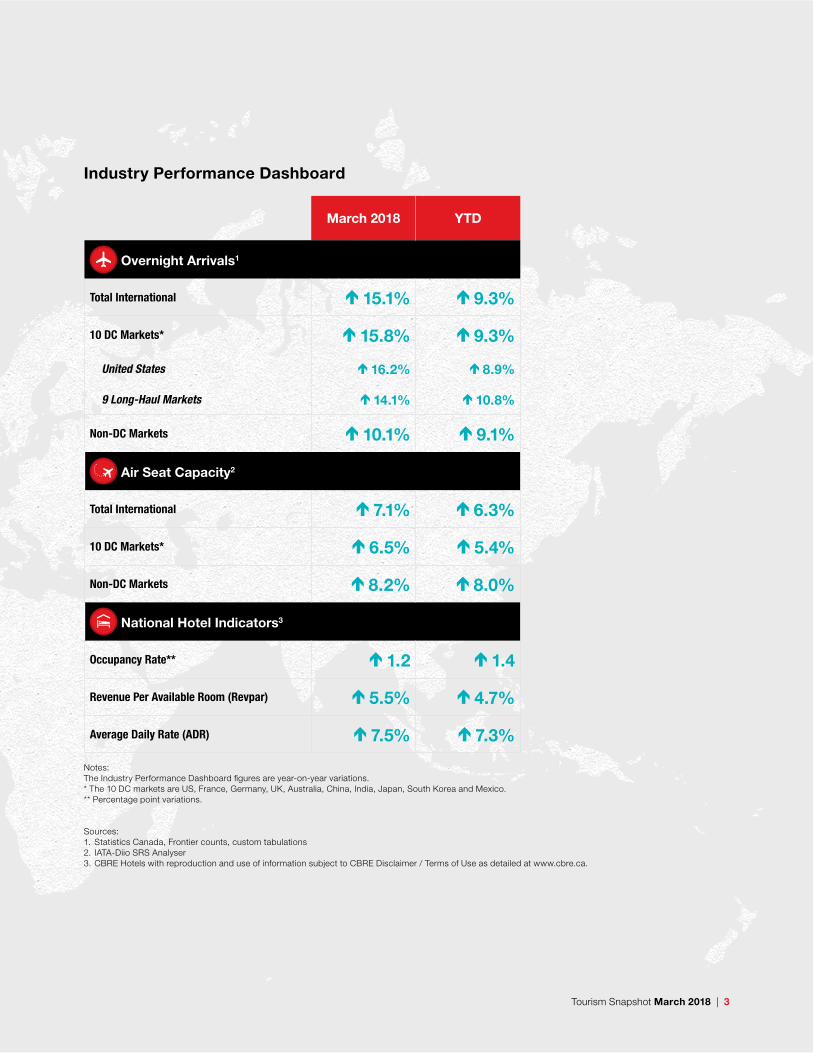
Total International 15.1% 9.3%
10 DC Markets* 15.8% 9.3%
United States 16.2% 8.9%
9 Long-Haul Markets 14.1% 10.8%
Non-DC Markets 10.1% 9.1%
Air Seat Capacity2
Total International 7.1% 6.3%
10 DC Markets* 6.5% 5.4%
Non-DC Markets 8.2% 8.0%
National Hotel Indicators3
Occupancy Rate** 1.2 1.4
Revenue Per Available Room (Revpar) 5.5% 4.7%
Average Daily Rate (ADR) 7.5% 7.3%
Notes:The Industry Performance Dashboard figures are year-on-year variations. * The 10 DC markets are US, France, Germany, UK, Australia, China, India, Japan, South Korea and Mexico.** Percentage point variations.
Sources:1. Statistics Canada, Frontier counts, custom tabulations2. IATA-Diio SRS Analyser3. CBRE Hotels with reproduction and use of information subject to CBRE Disclaimer / Terms of Use as detailed at www.cbre.ca.
4 | Tourism Snapshot March 2018
Overnight Arrivalsi Arrival YOY
Variations (%)Air Seat
capacityii Local currency
vs. CADiii
Market Mar. 2018 YTD 2018 Mar. 2018 YTD 2018 Mar. 2018 YTD 2018 Mar. 2018 Average
YTD Average
DC North America
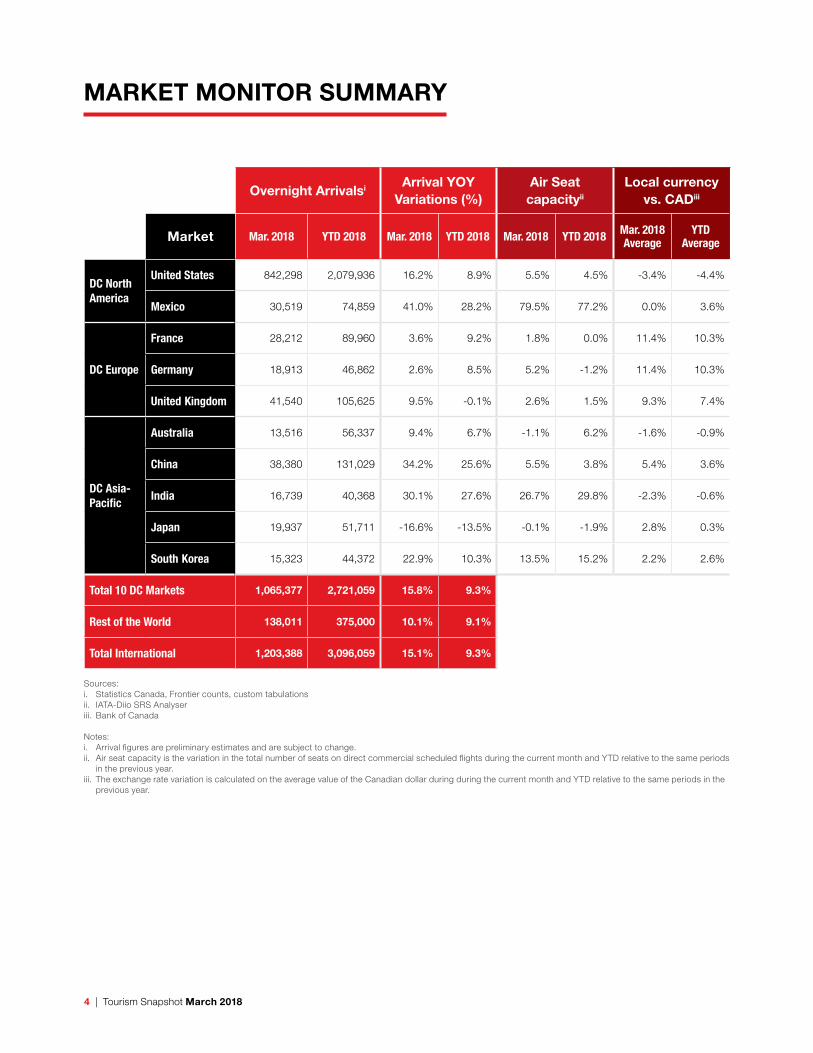
United States 842,298 2,079,936 16.2% 8.9% 5.5% 4.5% -3.4% -4.4%
Mexico 30,519 74,859 41.0% 28.2% 79.5% 77.2% 0.0% 3.6%
DC Europe
France 28,212 89,960 3.6% 9.2% 1.8% 0.0% 11.4% 10.3%
Germany 18,913 46,862 2.6% 8.5% 5.2% -1.2% 11.4% 10.3%
United Kingdom 41,540 105,625 9.5% -0.1% 2.6% 1.5% 9.3% 7.4%
DC Asia-Pacific
Australia 13,516 56,337 9.4% 6.7% -1.1% 6.2% -1.6% -0.9%
China 38,380 131,029 34.2% 25.6% 5.5% 3.8% 5.4% 3.6%
India 16,739 40,368 30.1% 27.6% 26.7% 29.8% -2.3% -0.6%
Japan 19,937 51,711 -16.6% -13.5% -0.1% -1.9% 2.8% 0.3%
South Korea 15,323 44,372 22.9% 10.3% 13.5% 15.2% 2.2% 2.6%
Total 10 DC Markets 1,065,377 2,721,059 15.8% 9.3%
Rest of the World 138,011 375,000 10.1% 9.1%
Total International 1,203,388 3,096,059 15.1% 9.3%
Sources:i. Statistics Canada, Frontier counts, custom tabulationsii. IATA-Diio SRS Analyseriii. Bank of Canada
Notes: i. Arrival figures are preliminary estimates and are subject to change.ii. Air seat capacity is the variation in the total number of seats on direct commercial scheduled flights during the current month and YTD relative to the same periods
in the previous year.iii. The exchange rate variation is calculated on the average value of the Canadian dollar during during the current month and YTD relative to the same periods in the
previous year.
MARKET MONITOR SUMMARY
Tourism Snapshot March 2018 | 5
UNITED STATES
JAN FEB MAR APR MAY JUN JUL AUG SEP OCT NOV DEC
OVER
NIG
HT A
RRIV
ALS
(000
s)
20182017
PEAK: MARCH2002
0
500
1,000
1,500
2,000
2,500
3,000
United States: Key Indicators
Air Seat CapacityiMarch 2018 5.5%
YTD 4.5%
Exchange RateiiMarch 2018 -3.4%
YTD -4.4%
Consumer Confidence Index (1985=100)iii
March 2018 127.0
Previous Month 130.0
YTD Arrival Peakiv
Peak Year 2002
Current % of Previous Peak
90.7%
Source:i. IATA-Diio SRS Analyser, Year-on-year % variance.ii. Bank of Canada, Year on year % variance.iii. Consumer Confidence Index, the Conference Board (USA).iv. Statistics Canada, Frontier counts, custom tabulations.
Trend Plot: Total United States Arrivals
Overnight Arrivals
March 2018 YTD 2018
Arrivals % YOY Variance Arrivals % YOY
Variance
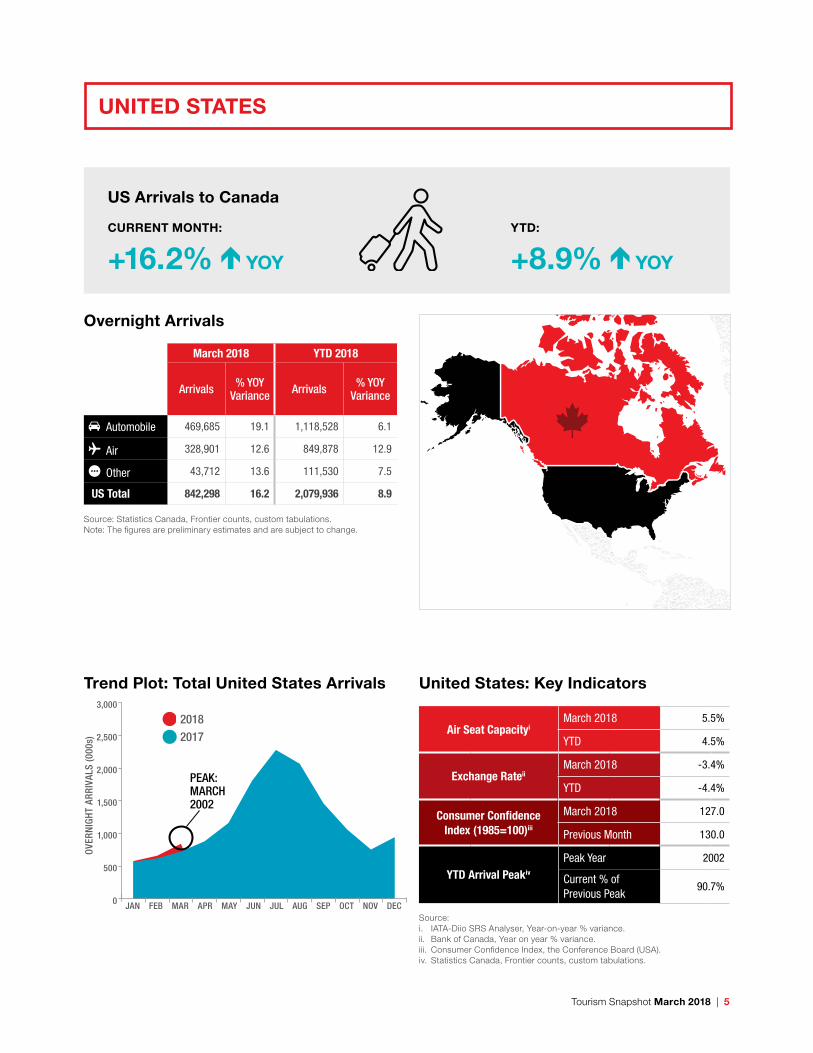
Automobile 469,685 19.1 1,118,528 6.1
Air 328,901 12.6 849,878 12.9
Other 43,712 13.6 111,530 7.5
US Total 842,298 16.2 2,079,936 8.9
Source: Statistics Canada, Frontier counts, custom tabulations.Note: The figures are preliminary estimates and are subject to change.
US Arrivals to Canada
CURRENT MONTH:
+16.2% YOY
YTD:
+8.9% YOY

6 | Tourism Snapshot March 2018
• The US market rounded out the end of a strong first quarter with an impressive surge in overnight arrivals in March 2018. With just over 842,000 visitors, March arrivals were up 16.2% year-over-year, bringing the Q1 2018 total up to 2.1 million (+8.9% over Q1 2017). These are the highest US arrivals numbers recorded since 2005, despite a weaker US dollar in Canada at the start of 2018 (-3.4% in March, -4.4% YTD).
• This strong performance from the US market continued to draw from expanded air arrivals – up 12.6% in March (+12.9% YTD) and making up about 40% of US arrivals over this period (39.0% in March, 40.9% YTD). The steady extension of air capacity between Canada and the US (+5.5% in March, +4.5% YTD) supported this shift toward more air travel to Canada.
• However, in March 2018 the biggest push in US visitation was seen from the largest segment, auto arrivals, which were up 19.1% year-over-year to reach nearly 470,000 visitors. Q1 2018 US auto arrivals reached 1.1 million (+6.1%) after a slower start to the quarter.
1 States of origin information is based on Integrated Primary Inspection Lane (IPIL) data collected from US residents entering Canada in automobiles with license plate registered in the United States.
2 Some automobiles driven across the border may be rental vehicles. Rented vehicles in one US state may be registered in different state.
• Arrivals by other modes of transportation, such as bus, train, and cruise, also saw a solid increase over this period, up 13.6% in March 2018 to bring the YTD arrivals up 7.5% over Q1 2017.
• The surge in US arrivals in March 2018 compared to March 2017 can be attributed in large part to travel over the Easter long weekend, which this year fell on the last weekend of March, vs. last year when it fell mid-April. This trend can be observed in the March daily vehicle arrivals data1, which shows the typical weekend peaks in both 2017 and 2018, but a particularly large spike in US visitors driving across the border over the Easter weekend in 2018.
• The largest share of US vehicle arrivals originated from Washington (19.4% in March, 22.4% YTD), New York (18.4% in March, 19.9% YTD), and Michigan (12.2% in March, 12.1% YTD)2. In March 2018, particularly notable increases were seen in vehicle arrivals from New Jersey, Pennsylvania, and New York.
• After a big jump of 5.7 points in February, the consumer confidence index published by the US Conference Board remained relatively high but dropped back down -3.0 points to 127.0 in March 2018.
UNITED STATES
1 2 3 4 5 6 7 8 9 10 11 12 13 14 15 16 17 18 19 20 21 22 23 24 25 26 27 28 29 30 31
DAIL
Y AR
RIVA
LS
DATE
0
10,000
20,000
30,000
40,000
50,0002018
2017
2018 Easter long weekend (in 2017, Easter fell in mid-April)
Daily US Overnight Auto Arrivals – March 2018
Note: Daily US resident overnight auto arrivals at land ports with Integrated Primary Inspection Lane (IPIL).
Tourism Snapshot March 2018 | 7
MEXICO
JAN FEB MAR APR MAY JUN JUL AUG SEP OCT NOV DEC
OVER
NIG
HT A
RRIV
ALS
(000
s)
0
10
20
30
40
50
6020182017
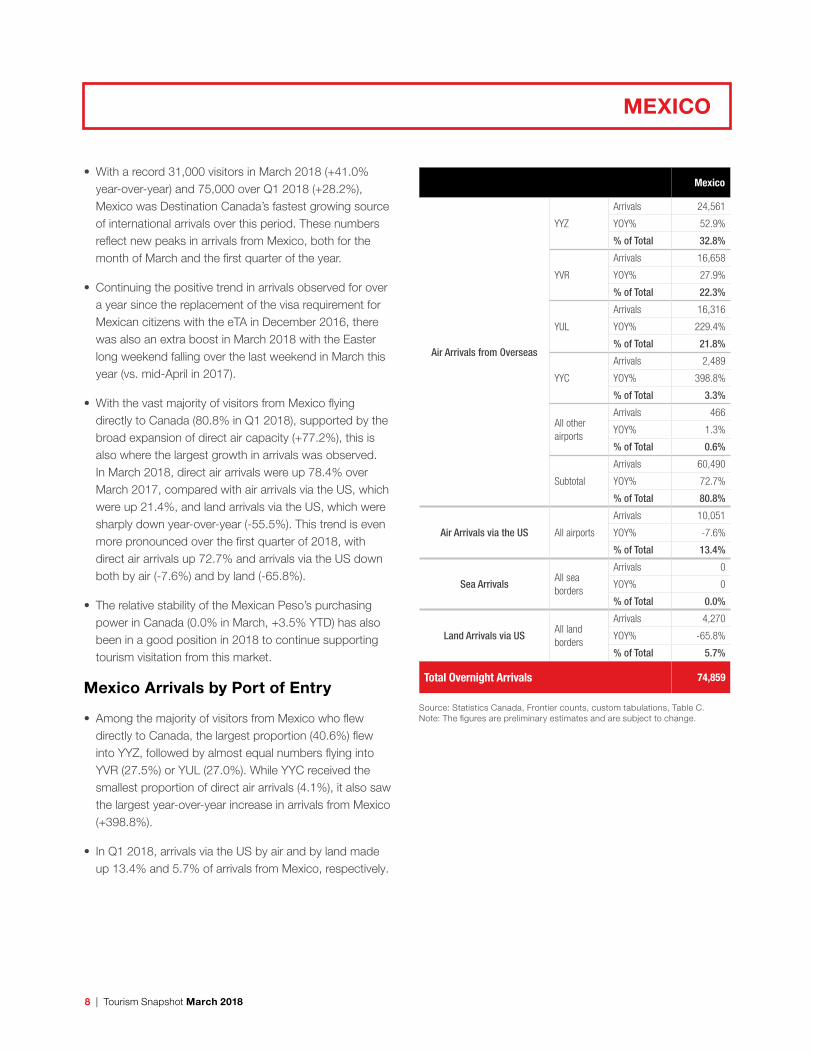
PEAK: MARCH 2018
Arrival Trend Plot – Total Mexico
MEXICO
Mexico: Key Indicators
Mexico
Air Seat Capacityi
March 2018 79.5%
YTD 77.2%
Exchange RateiiMarch 2018 0.0%
YTD 3.6%
YTD Arrival Peakiii
Peak Year 2017
Current % of Previous Peak
128.2%
Sources:i. IATA-Diio SRS Analyser, Year-on-year % variance.ii. Bank of Canada, Year on year % variance.iii. Statistics Canada, Frontier counts, custom tabulations.
Overnight Arrivals
March 2018 YTD 2018
Arrivals % YOY Variance Arrivals % YOY
Variance
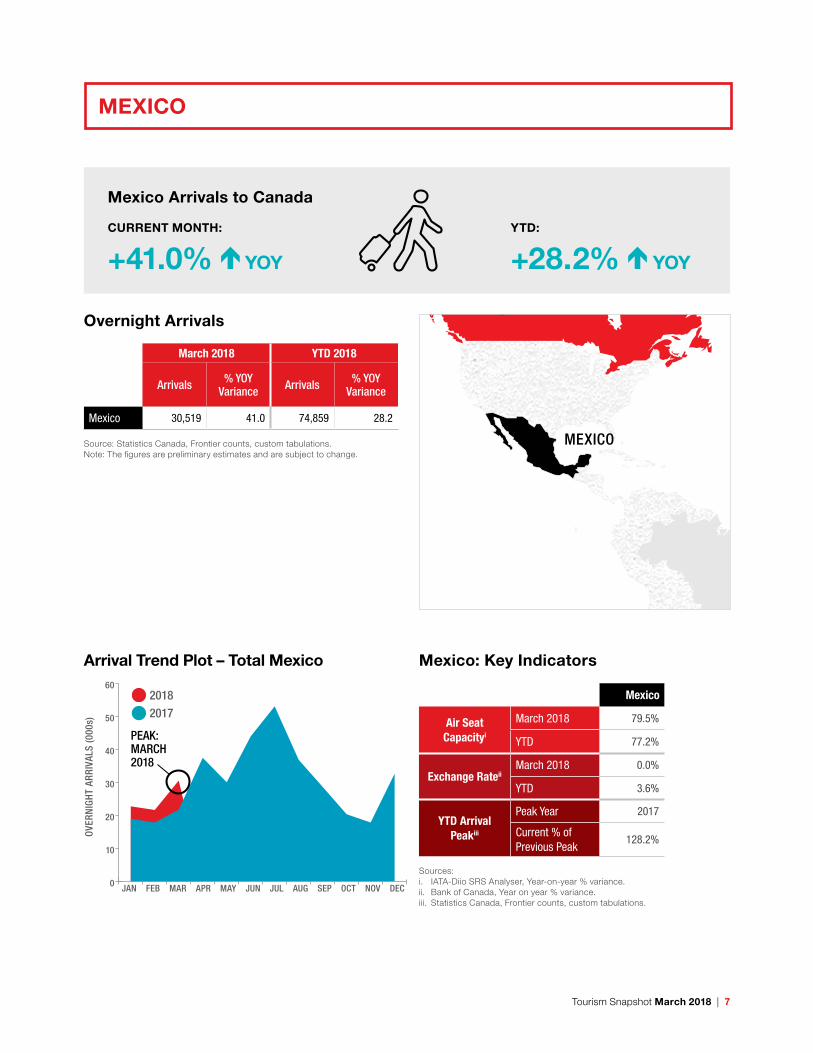
Mexico 30,519 41.0 74,859 28.2
Source: Statistics Canada, Frontier counts, custom tabulations.Note: The figures are preliminary estimates and are subject to change.
Mexico Arrivals to Canada
CURRENT MONTH:
+41.0% YOY
YTD:
+28.2% YOY
8 | Tourism Snapshot March 2018
• With a record 31,000 visitors in March 2018 (+41.0% year-over-year) and 75,000 over Q1 2018 (+28.2%), Mexico was Destination Canada’s fastest growing source of international arrivals over this period. These numbers reflect new peaks in arrivals from Mexico, both for the month of March and the first quarter of the year.
• Continuing the positive trend in arrivals observed for over a year since the replacement of the visa requirement for Mexican citizens with the eTA in December 2016, there was also an extra boost in March 2018 with the Easter long weekend falling over the last weekend in March this year (vs. mid-April in 2017).
• With the vast majority of visitors from Mexico flying directly to Canada (80.8% in Q1 2018), supported by the broad expansion of direct air capacity (+77.2%), this is also where the largest growth in arrivals was observed. In March 2018, direct air arrivals were up 78.4% over March 2017, compared with air arrivals via the US, which were up 21.4%, and land arrivals via the US, which were sharply down year-over-year (-55.5%). This trend is even more pronounced over the first quarter of 2018, with direct air arrivals up 72.7% and arrivals via the US down both by air (-7.6%) and by land (-65.8%).
• The relative stability of the Mexican Peso’s purchasing power in Canada (0.0% in March, +3.5% YTD) has also been in a good position in 2018 to continue supporting tourism visitation from this market.
Mexico Arrivals by Port of Entry
• Among the majority of visitors from Mexico who flew directly to Canada, the largest proportion (40.6%) flew into YYZ, followed by almost equal numbers flying into YVR (27.5%) or YUL (27.0%). While YYC received the smallest proportion of direct air arrivals (4.1%), it also saw the largest year-over-year increase in arrivals from Mexico (+398.8%).
• In Q1 2018, arrivals via the US by air and by land made up 13.4% and 5.7% of arrivals from Mexico, respectively.
Mexico
Air Arrivals from Overseas
YYZ
Arrivals 24,561
YOY% 52.9%
% of Total 32.8%
YVR
Arrivals 16,658
YOY% 27.9%
% of Total 22.3%
YUL
Arrivals 16,316
YOY% 229.4%
% of Total 21.8%
YYC
Arrivals 2,489
YOY% 398.8%
% of Total 3.3%
All other airports
Arrivals 466
YOY% 1.3%
% of Total 0.6%
Subtotal
Arrivals 60,490
YOY% 72.7%
% of Total 80.8%
Air Arrivals via the US All airports
Arrivals 10,051
YOY% -7.6%
% of Total 13.4%
Sea ArrivalsAll sea borders
Arrivals 0
YOY% 0
% of Total 0.0%
Land Arrivals via USAll land borders
Arrivals 4,270
YOY% -65.8%
% of Total 5.7%
Total Overnight Arrivals 74,859
Source: Statistics Canada, Frontier counts, custom tabulations, Table C.Note: The figures are preliminary estimates and are subject to change.
MEXICO
Tourism Snapshot March 2018 | 9
EUROPE
JAN FEB MAR APR MAY JUN JUL AUG SEP OCT NOV DEC
OVER
NIG
HT A
RRIV
ALS
(000
s)
20182017
0
50
100
150
200
250
300
PEAK: MARCH2018
Trend Plot: Total DC Europe Arrivals
DC Europe: Key Indicators
France GermanyUnited
Kingdom
Air Seat Capacityi
March 2018
1.8% 5.2% 2.6%
YTD 0.0% -1.2% 1.5%
Exchange Rateii
March 2018
11.4% 11.4% 9.3%
YTD 10.3% 10.3% 7.4%
YTD Arrival Peakiii
Peak Year 2017 1996 2008
Current % of Previous Peak
109.2% 102.7% 74.0%
Sources:i. IATA-Diio SRS Analyser, Year-on-year % variance.ii. Bank of Canada, Year on year % variance.iii. Statistics Canada, Frontier counts, custom tabulations.
Overnight Arrivals
March 2018 YTD 2018
Arrivals % YOY Variance Arrivals % YOY
Variance
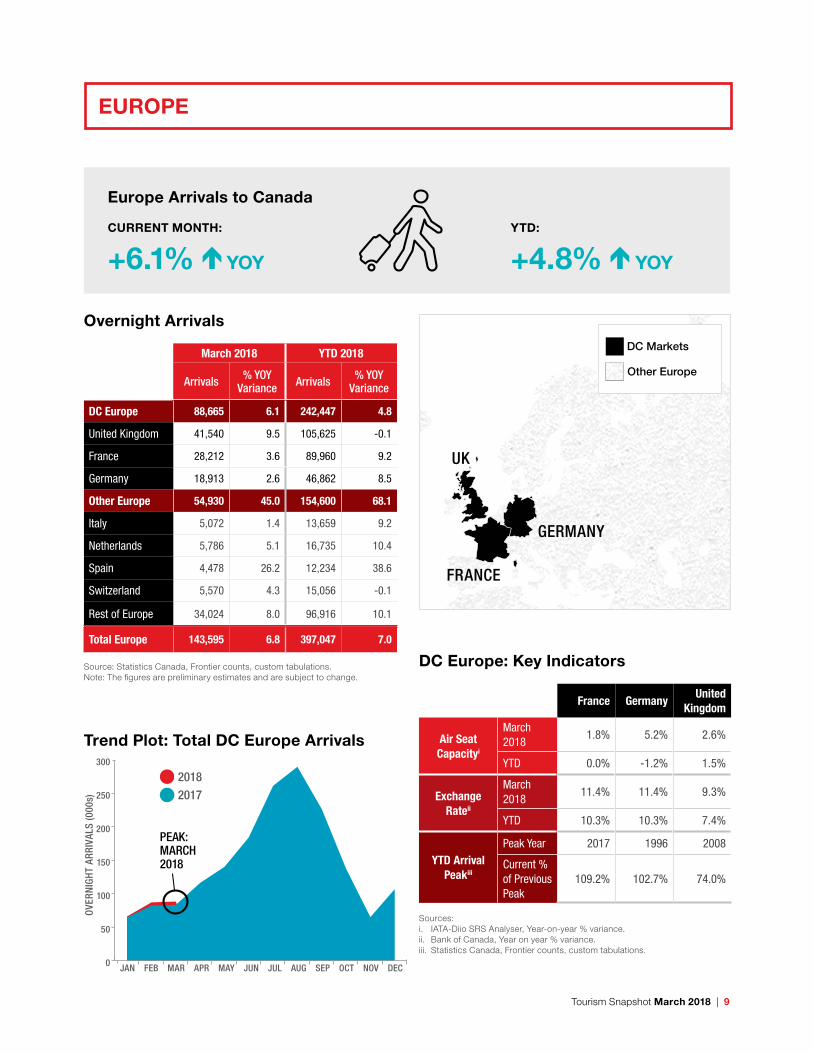
DC Europe 88,665 6.1 242,447 4.8
United Kingdom 41,540 9.5 105,625 -0.1
France 28,212 3.6 89,960 9.2
Germany 18,913 2.6 46,862 8.5
Other Europe 54,930 45.0 154,600 68.1
Italy 5,072 1.4 13,659 9.2
Netherlands 5,786 5.1 16,735 10.4
Spain 4,478 26.2 12,234 38.6
Switzerland 5,570 4.3 15,056 -0.1
Rest of Europe 34,024 8.0 96,916 10.1
Total Europe 143,595 6.8 397,047 7.0
Source: Statistics Canada, Frontier counts, custom tabulations.Note: The figures are preliminary estimates and are subject to change.
UK
FRANCE
GERMANY
DC Markets
ASIA-PACIFIC
DC EUROPEUS
DC LATIN-AMERICA
Other Europe
Europe Arrivals to Canada
CURRENT MONTH:
+6.1% YOY
YTD:
+4.8% YOY
10 | Tourism Snapshot March 2018
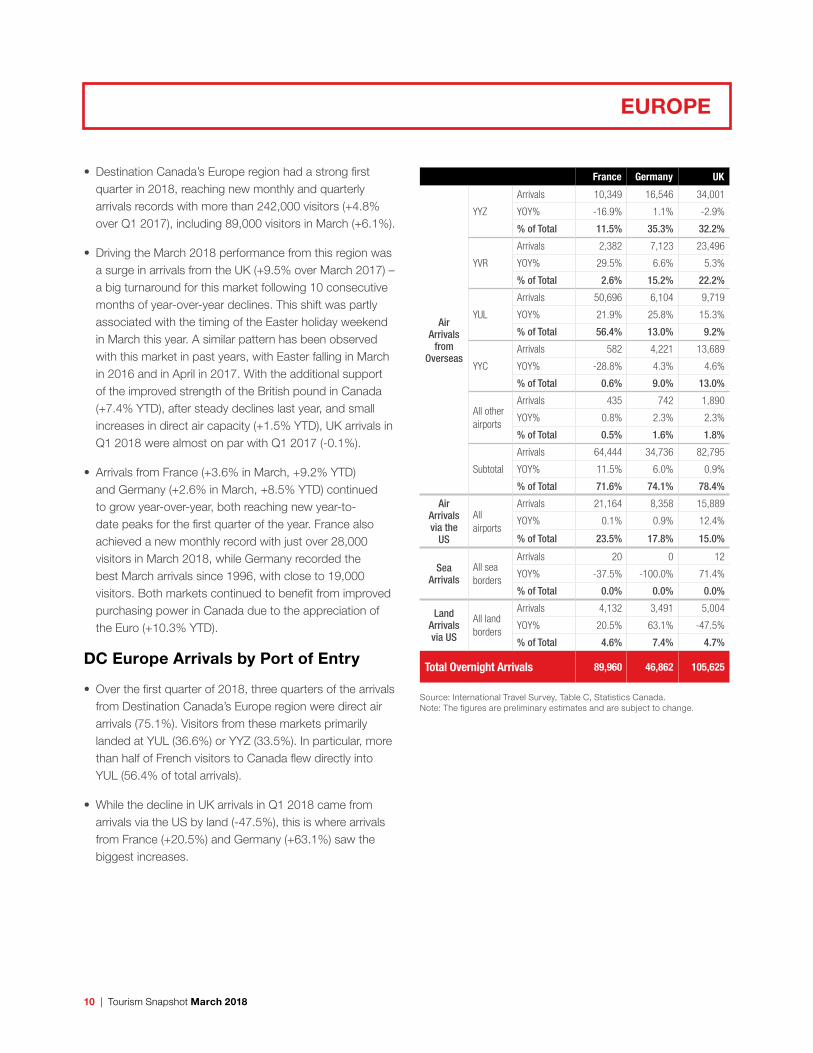
• Destination Canada’s Europe region had a strong first quarter in 2018, reaching new monthly and quarterly arrivals records with more than 242,000 visitors (+4.8% over Q1 2017), including 89,000 visitors in March (+6.1%).
• Driving the March 2018 performance from this region was a surge in arrivals from the UK (+9.5% over March 2017) – a big turnaround for this market following 10 consecutive months of year-over-year declines. This shift was partly associated with the timing of the Easter holiday weekend in March this year. A similar pattern has been observed with this market in past years, with Easter falling in March in 2016 and in April in 2017. With the additional support of the improved strength of the British pound in Canada (+7.4% YTD), after steady declines last year, and small increases in direct air capacity (+1.5% YTD), UK arrivals in Q1 2018 were almost on par with Q1 2017 (-0.1%).
• Arrivals from France (+3.6% in March, +9.2% YTD) and Germany (+2.6% in March, +8.5% YTD) continued to grow year-over-year, both reaching new year-to-date peaks for the first quarter of the year. France also achieved a new monthly record with just over 28,000 visitors in March 2018, while Germany recorded the best March arrivals since 1996, with close to 19,000 visitors. Both markets continued to benefit from improved purchasing power in Canada due to the appreciation of the Euro (+10.3% YTD).
DC Europe Arrivals by Port of Entry
• Over the first quarter of 2018, three quarters of the arrivals from Destination Canada’s Europe region were direct air arrivals (75.1%). Visitors from these markets primarily landed at YUL (36.6%) or YYZ (33.5%). In particular, more than half of French visitors to Canada flew directly into YUL (56.4% of total arrivals).
• While the decline in UK arrivals in Q1 2018 came from arrivals via the US by land (-47.5%), this is where arrivals from France (+20.5%) and Germany (+63.1%) saw the biggest increases.
EUROPE
France Germany UK
Air Arrivals
from Overseas
YYZ
Arrivals 10,349 16,546 34,001
YOY% -16.9% 1.1% -2.9%
% of Total 11.5% 35.3% 32.2%
YVR
Arrivals 2,382 7,123 23,496
YOY% 29.5% 6.6% 5.3%
% of Total 2.6% 15.2% 22.2%
YUL
Arrivals 50,696 6,104 9,719
YOY% 21.9% 25.8% 15.3%
% of Total 56.4% 13.0% 9.2%
YYC
Arrivals 582 4,221 13,689
YOY% -28.8% 4.3% 4.6%
% of Total 0.6% 9.0% 13.0%
All other airports
Arrivals 435 742 1,890
YOY% 0.8% 2.3% 2.3%
% of Total 0.5% 1.6% 1.8%
Subtotal
Arrivals 64,444 34,736 82,795
YOY% 11.5% 6.0% 0.9%
% of Total 71.6% 74.1% 78.4%
Air Arrivals via the
US
All airports
Arrivals 21,164 8,358 15,889
YOY% 0.1% 0.9% 12.4%
% of Total 23.5% 17.8% 15.0%
Sea Arrivals
All sea borders
Arrivals 20 0 12
YOY% -37.5% -100.0% 71.4%
% of Total 0.0% 0.0% 0.0%
Land Arrivals via US
All land borders
Arrivals 4,132 3,491 5,004
YOY% 20.5% 63.1% -47.5%
% of Total 4.6% 7.4% 4.7%
Total Overnight Arrivals 89,960 46,862 105,625
Source: International Travel Survey, Table C, Statistics Canada.Note: The figures are preliminary estimates and are subject to change.
Tourism Snapshot March 2018 | 11
ASIA-PACIFIC
JAN FEB MAR APR MAY JUN JUL AUG SEP OCT NOV DEC
OVER
NIG
HT A
RRIV
ALS
(000
s)
20182017
0
50
100
150
200
250
PEAK: MARCH 2018
Trend Plot: Total DC Asia-Pacific Arrivals
CHINA
INDIA
AUSTRALIA
JAPAN
SOUTHKOREA
Asia-Pacific: Key Indicators
Australia China India JapanSouth Korea
Air Seat Capacityi
Mar. 2018 -1.1% 5.5% 26.7% -0.1% 13.5%
YTD 6.2% 3.8% 29.8% -1.9% 15.2%
Exchange Rateii
Mar. 2018 -1.6% 5.4% -2.3% 2.8% 2.2%
YTD -0.9% 3.6% -0.6% 0.3% 2.6%
YTD Arrival Peakiii
Peak Year 2017 2017 2017 1997 2017
Current % of Previous Peak
106.7% 125.6% 127.6% 54.9% 110.3%
Sources:i. IATA-Diio SRS Analyser, Year-on-year % variance.ii. Bank of Canada, Year on year % variance.iii. Statistics Canada, Frontier counts, custom tabulations.
Overnight Arrivals
March 2018 YTD 2018
Arrivals % YOY Variance Arrivals % YOY
Variance
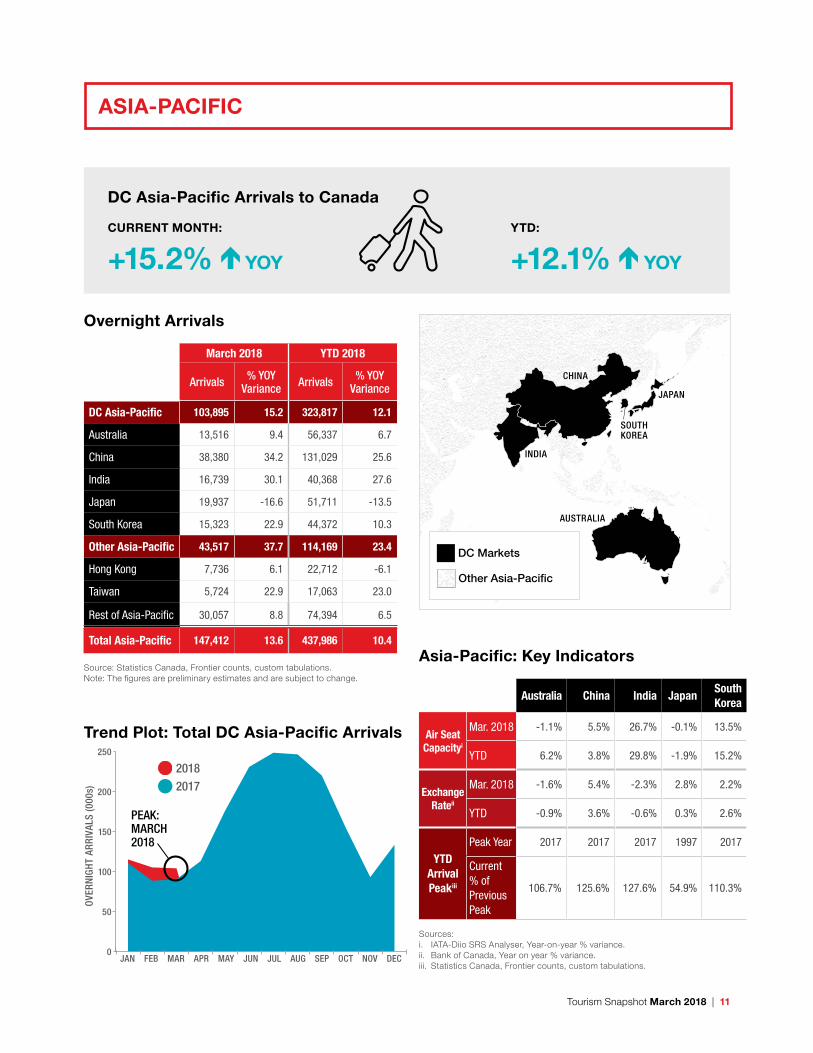
DC Asia-Pacific 103,895 15.2 323,817 12.1
Australia 13,516 9.4 56,337 6.7
China 38,380 34.2 131,029 25.6
India 16,739 30.1 40,368 27.6
Japan 19,937 -16.6 51,711 -13.5
South Korea 15,323 22.9 44,372 10.3
Other Asia-Pacific 43,517 37.7 114,169 23.4
Hong Kong 7,736 6.1 22,712 -6.1
Taiwan 5,724 22.9 17,063 23.0
Rest of Asia-Pacific 30,057 8.8 74,394 6.5
Total Asia-Pacific 147,412 13.6 437,986 10.4
Source: Statistics Canada, Frontier counts, custom tabulations.Note: The figures are preliminary estimates and are subject to change.
DC Markets
ASIA-PACIFIC
DC EUROPEUS
DC LATIN-AMERICA
Other Asia-Pacific
DC Asia-Pacific Arrivals to Canada
CURRENT MONTH:
+15.2% YOY
YTD:
+12.1% YOY
12 | Tourism Snapshot March 2018
• Arrivals from Destination Canada’s Asia-Pacific region hit nearly 324,000 in Q1 2018 (+12.1%), including 104,000 in March (+15.2%), reaching new peaks for both the month of March and the first quarter of the year. Four of the five markets also set new records for monthly and quarterly arrivals: China, Australia, South Korea, and India.
• The biggest contributor to the Asia-Pacific region’s results over this period was a remarkable performance from China in the first quarter of the Canada-China Year of Tourism (CCYT). In Q1 2018, overnight arrivals from China (131,000, +25.6%) surpassed arrivals from the United Kingdom, thus emerging as Destination Canada’s largest long-haul market for the first time ever in any quarter. Following very strong gains in February, with the Lunar New Year falling in mid-February in 2018 (vs. late January in 2017), the positive trend continued into March with more than 38,000 visitors (+34.2% vs. March 2017).
• Both for the month of March and over the first quarter of 2018, strong growth in arrivals was also recorded from India (+30.1% in March, +27.6% YTD), South Korea (+22.9% in March, +10.3% YTD), and Australia (+9.4% in March, +6.7% YTD). For India and Australia this growth came primarily from direct air arrivals, while for South Korea the biggest gains were in land arrivals via the US.
• Japan (-16.1%) was the only one of Destination Canada’s markets to record a decline in arrivals in March 2018, though with approximately 20,000 visitors it was still the second largest source of arrivals among Destination Canada’s Asia-Pacific markets. Arrivals were also down over Q1 2018 (-13.5%). Alongside a slight decline in direct air capacity to Canada (-1.9% YTD), the drop in visitation came primarily from air arrivals – both direct (-14.6%) and via the US (-20.9%).
ASIA-PACIFIC
DC Asia-Pacific Arrivals by Port of Entry
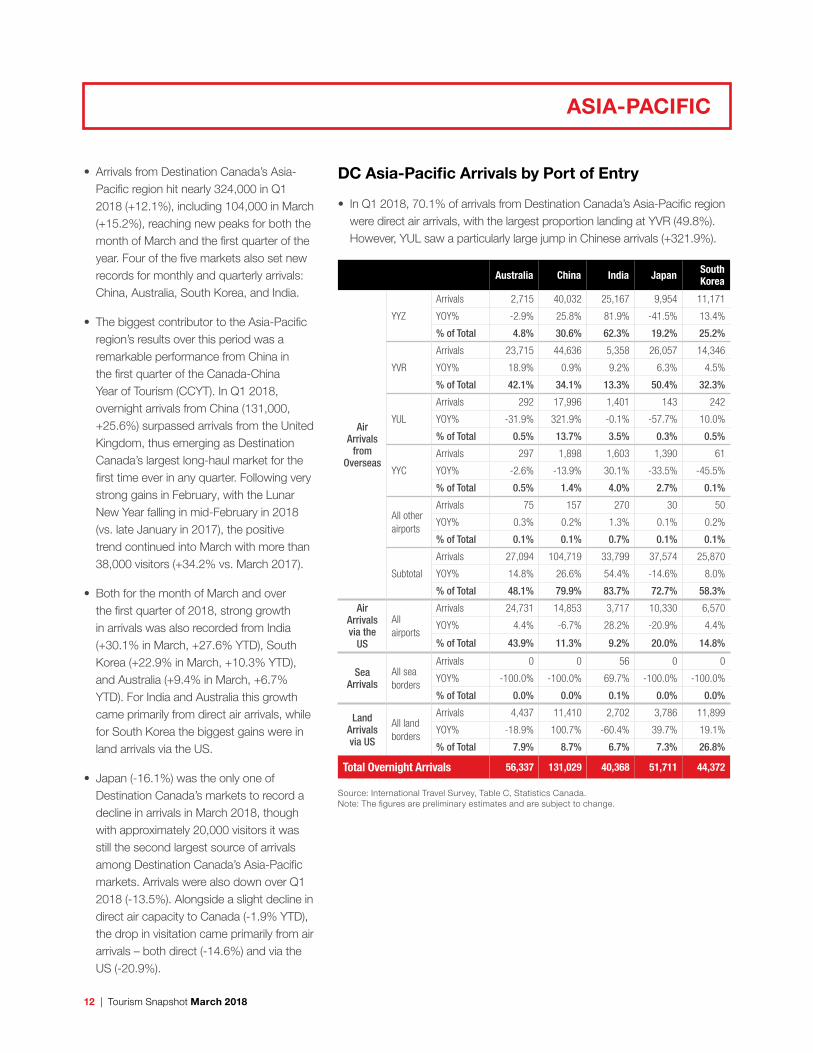
• In Q1 2018, 70.1% of arrivals from Destination Canada’s Asia-Pacific region were direct air arrivals, with the largest proportion landing at YVR (49.8%). However, YUL saw a particularly large jump in Chinese arrivals (+321.9%).
Australia China India Japan South Korea
Air Arrivals
from Overseas
YYZ
Arrivals 2,715 40,032 25,167 9,954 11,171
YOY% -2.9% 25.8% 81.9% -41.5% 13.4%
% of Total 4.8% 30.6% 62.3% 19.2% 25.2%
YVR
Arrivals 23,715 44,636 5,358 26,057 14,346
YOY% 18.9% 0.9% 9.2% 6.3% 4.5%
% of Total 42.1% 34.1% 13.3% 50.4% 32.3%
YUL
Arrivals 292 17,996 1,401 143 242
YOY% -31.9% 321.9% -0.1% -57.7% 10.0%
% of Total 0.5% 13.7% 3.5% 0.3% 0.5%
YYC
Arrivals 297 1,898 1,603 1,390 61
YOY% -2.6% -13.9% 30.1% -33.5% -45.5%
% of Total 0.5% 1.4% 4.0% 2.7% 0.1%
All other airports
Arrivals 75 157 270 30 50
YOY% 0.3% 0.2% 1.3% 0.1% 0.2%
% of Total 0.1% 0.1% 0.7% 0.1% 0.1%
Subtotal
Arrivals 27,094 104,719 33,799 37,574 25,870
YOY% 14.8% 26.6% 54.4% -14.6% 8.0%
% of Total 48.1% 79.9% 83.7% 72.7% 58.3%
Air Arrivals via the
US
All airports
Arrivals 24,731 14,853 3,717 10,330 6,570
YOY% 4.4% -6.7% 28.2% -20.9% 4.4%
% of Total 43.9% 11.3% 9.2% 20.0% 14.8%
Sea Arrivals
All sea borders
Arrivals 0 0 56 0 0
YOY% -100.0% -100.0% 69.7% -100.0% -100.0%
% of Total 0.0% 0.0% 0.1% 0.0% 0.0%
Land Arrivals via US
All land borders
Arrivals 4,437 11,410 2,702 3,786 11,899
YOY% -18.9% 100.7% -60.4% 39.7% 19.1%
% of Total 7.9% 8.7% 6.7% 7.3% 26.8%
Total Overnight Arrivals 56,337 131,029 40,368 51,711 44,372
Source: International Travel Survey, Table C, Statistics Canada.Note: The figures are preliminary estimates and are subject to change.
Tourism Snapshot March 2018 | 13
Overnight Trips by Canadians
March 2018 YOY % Variance Jan.- Mar. 2018 YOY % Variance
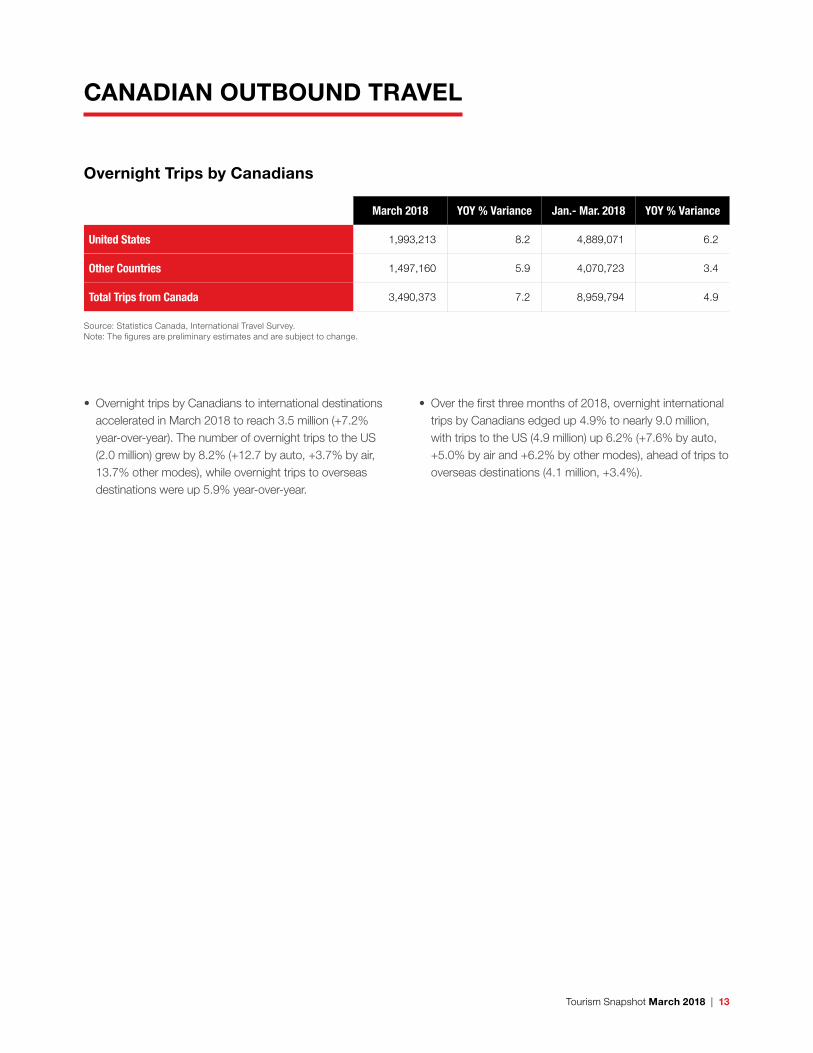
United States 1,993,213 8.2 4,889,071 6.2
Other Countries 1,497,160 5.9 4,070,723 3.4
Total Trips from Canada 3,490,373 7.2 8,959,794 4.9
Source: Statistics Canada, International Travel Survey.Note: The figures are preliminary estimates and are subject to change.
• Overnight trips by Canadians to international destinations accelerated in March 2018 to reach 3.5 million (+7.2% year-over-year). The number of overnight trips to the US (2.0 million) grew by 8.2% (+12.7 by auto, +3.7% by air, 13.7% other modes), while overnight trips to overseas destinations were up 5.9% year-over-year.
• Over the first three months of 2018, overnight international trips by Canadians edged up 4.9% to nearly 9.0 million, with trips to the US (4.9 million) up 6.2% (+7.6% by auto, +5.0% by air and +6.2% by other modes), ahead of trips to overseas destinations (4.1 million, +3.4%).
CANADIAN OUTBOUND TRAVEL
14 | Tourism Snapshot March 2018
Overnight Arrivals by Province of Entry
Newfo
undl
and
and
Labr
ador
Prin
ce E
dwad
Isla
nd
Nova
Sco
tia
New B
runs
wick
Québ
ec
Onta
rio
Tota
l One
or
mor
e ni
ghts
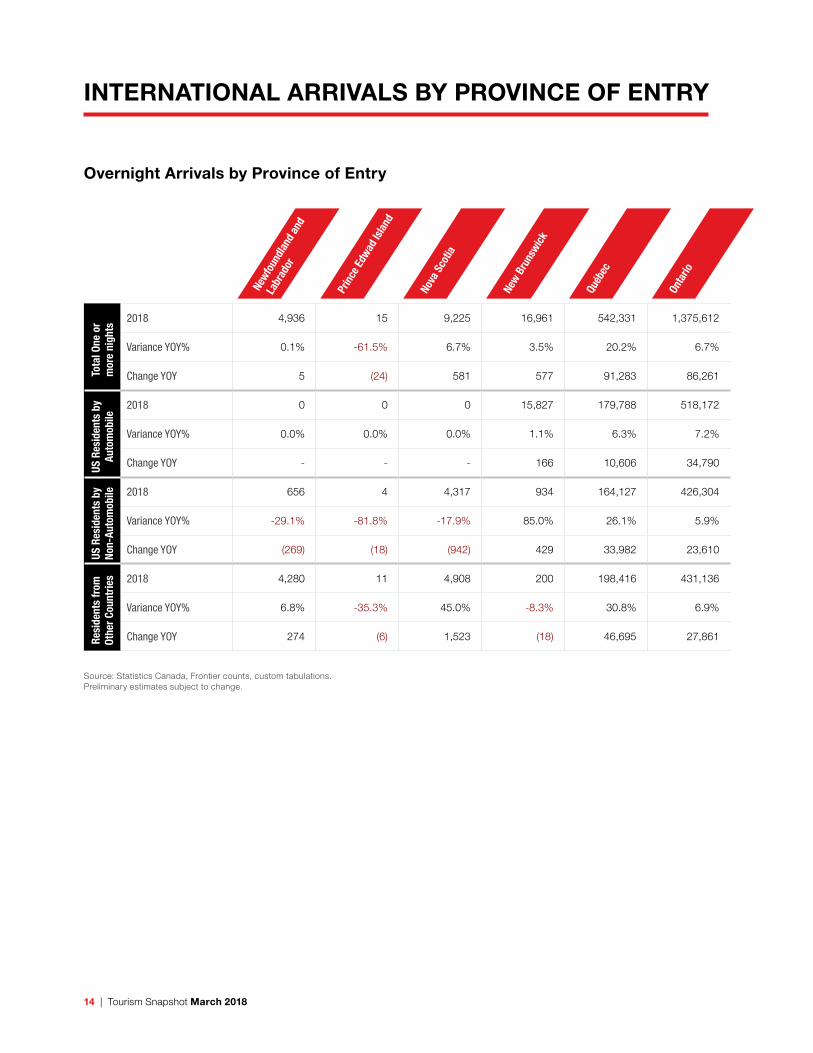
2018 4,936 15 9,225 16,961 542,331 1,375,612
Variance YOY% 0.1% -61.5% 6.7% 3.5% 20.2% 6.7%
Change YOY 5 (24) 581 577 91,283 86,261
US R
esid
ents
by
Auto
mob
ile
2018 0 0 0 15,827 179,788 518,172
Variance YOY% 0.0% 0.0% 0.0% 1.1% 6.3% 7.2%
Change YOY - - - 166 10,606 34,790
US R
esid
ents
by
No
n-Au
tom
obile 2018 656 4 4,317 934 164,127 426,304
Variance YOY% -29.1% -81.8% -17.9% 85.0% 26.1% 5.9%
Change YOY (269) (18) (942) 429 33,982 23,610
Resi
dent
s fr
om
Othe
r Cou
ntrie
s 2018 4,280 11 4,908 200 198,416 431,136
Variance YOY% 6.8% -35.3% 45.0% -8.3% 30.8% 6.9%
Change YOY 274 (6) 1,523 (18) 46,695 27,861
Source: Statistics Canada, Frontier counts, custom tabulations. Preliminary estimates subject to change.
INTERNATIONAL ARRIVALS BY PROVINCE OF ENTRY
Tourism Snapshot March 2018 | 15
Overnight Arrivals by Province of Entry
Man
itoba
Sask
atch
ewan
Albe
rta
Briti
sh C
olum
bia
Yuko
n
Nuna
vut
CANA
DA
Tota
l One
or
mor
e ni
ghts
2018 34,732 7,081 161,189 938,420 5,450 107 3,096,059
Variance YOY%
3.2% 11.4% 6.0% 8.2% 19.9% -38.5% 9.2%
Change YOY 1,083 726 9,065 71,163 906 (67) 261,559
US R
esid
ents
by
Auto
mob
ile
2018 23,382 5,787 11,350 359,032 5,190 0 1,118,528
Variance YOY%
4.4% 10.1% -0.8% 4.8% 23.5% 0.0% 6.1%
Change YOY 981 533 (92) 16,524 986 - 64,494
US R
esid
ents
by
No
n-Au
tom
obile 2018 10,112 815 98,406 255,638 79 16 961,408
Variance YOY%
-1.4% 12.1% 9.6% 18.1% 36.2% 433.3% 12.2%
Change YOY (141) 88 8,609 39,234 21 13 104,616
Resi
dent
s fr
om
Othe
r Cou
ntrie
s 2018 1,238 479 51,433 323,750 181 91 1,016,123
Variance YOY%
24.4% 28.1% 1.1% 5.0% -35.8% -46.8% 10.0%
Change YOY 243 105 548 15,405 (101) (80) 92,449
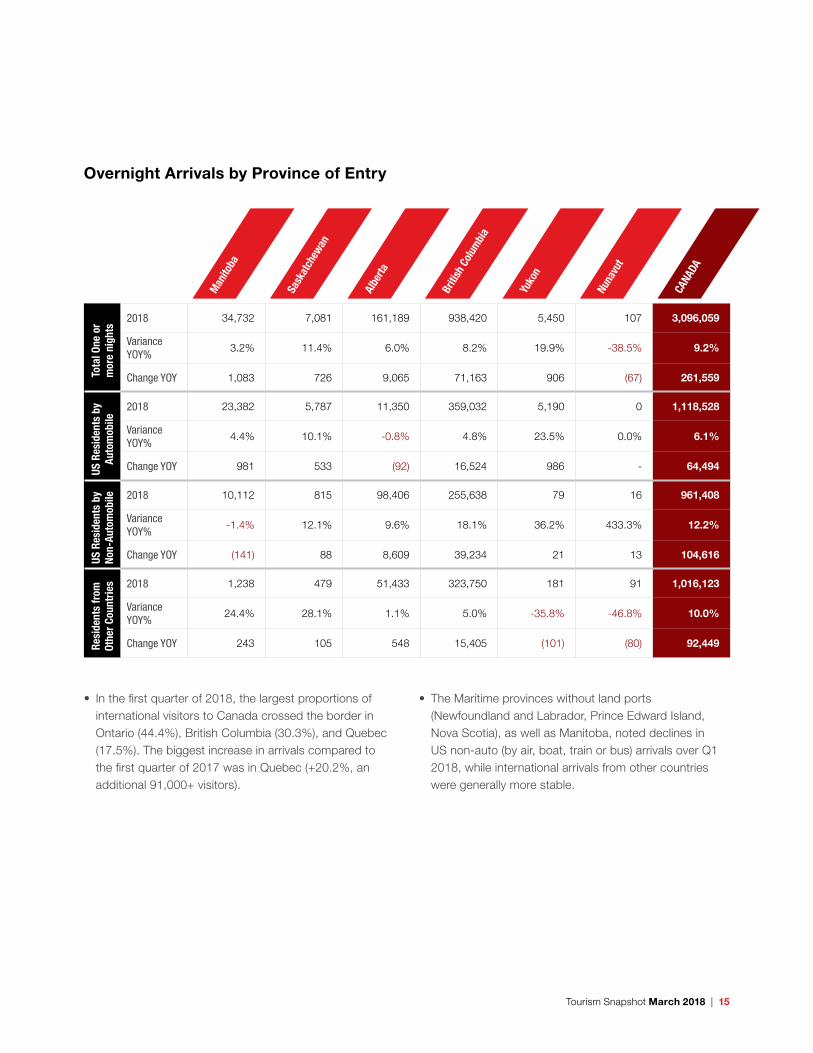
• In the first quarter of 2018, the largest proportions of international visitors to Canada crossed the border in Ontario (44.4%), British Columbia (30.3%), and Quebec (17.5%). The biggest increase in arrivals compared to the first quarter of 2017 was in Quebec (+20.2%, an additional 91,000+ visitors).
• The Maritime provinces without land ports (Newfoundland and Labrador, Prince Edward Island, Nova Scotia), as well as Manitoba, noted declines in US non-auto (by air, boat, train or bus) arrivals over Q1 2018, while international arrivals from other countries were generally more stable.
16 | Tourism Snapshot March 2018
Hotel Performance Indicators by Province
Occupancy Rates Average Daily Rate (ADR) Revenue Per Available Room (RevPAR)
Mar. 2018 YOY^ Variance
Jan.- Mar.
YOY^ Variance Mar. 2018 YOY %
VarianceJan.- Mar.
YOY % Variance Mar. 2018 YOY %
VarianceJan.- Mar.
YOY % Variance
Alberta1 54.0% 1.5 49.6% 1.9 $128.11 -0.2% $126.64 -0.9% $69.24 2.7% $62.81 3.2%
British Columbia 68.3% 1.9 62.5% 1.7 $167.10 10.7% $167.10 9.8% $114.20 13.9% $104.44 12.9%
Saskatchewan 56.3% 3.4 51.1% 3.0 $120.20 -1.3% $117.55 -3.0% $67.67 5.1% $60.01 3.2%
Manitoba 66.9% -3.3 62.5% -0.5 $124.59 2.5% $122.73 2.1% $83.37 -2.3% $76.69 1.3%
Ontario 64.1% 2.1 60.1% 2.3 $151.31 6.2% $147.10 5.6% $96.93 9.9% $88.42 9.7%
Quebec 61.7% -0.3 59.4% -1.2 $152.85 3.4% $153.35 3.0% $94.38 2.9% $91.03 1.0%
New Brunswick 51.1% -1.1 47.0% 0.0 $117.30 2.7% $116.06 4.0% $59.91 0.5% $54.55 4.0%
Nova Scotia 64.1% 0.4 51.7% 0.1 $130.05 5.1% $126.03 4.4% $83.38 5.8% $65.12 4.5%
Newfoundland 42.6% -19.5 39.7% -10.7 $131.66 -3.5% $131.59 -0.6% $56.04 -33.8% $52.26 -21.7%
Prince Edward Island 32.0% -4.0 37.6% -1.6 $106.47 2.3% $111.46 6.8% $34.02 -9.2% $41.92 2.4%
Northwest Territories 88.8% 7.4 83.4% 4.9 $157.06 6.4% $154.23 4.1% $139.51 16.0% $128.69 10.6%
Yukon 57.6% -2.1 53.0% -0.8 $127.40 8.3% $123.19 6.5% $73.33 4.5% $65.28 4.9%
Canada 61.7% 1.2 57.2% 1.4 $148.40 5.5% $146.42 4.7% $91.49 7.5% $83.70 7.3%
Note: Based on the operating results of 237,545 rooms (unweighted data).^ Percentage points. 1 Excluding Alberta resorts.
Source: CBRE Hotels with reproduction and use of information subject to CBRE Disclaimer / Terms of Use as detailed at www.cbre.ca.Users of this information are advised that CBRE Hotels does not represent the information contained herein to be definitive or all-inclusive. CBRE Hotels believes the information to be reliable, but is not responsible for errors or omissions.
ACCOMMODATION
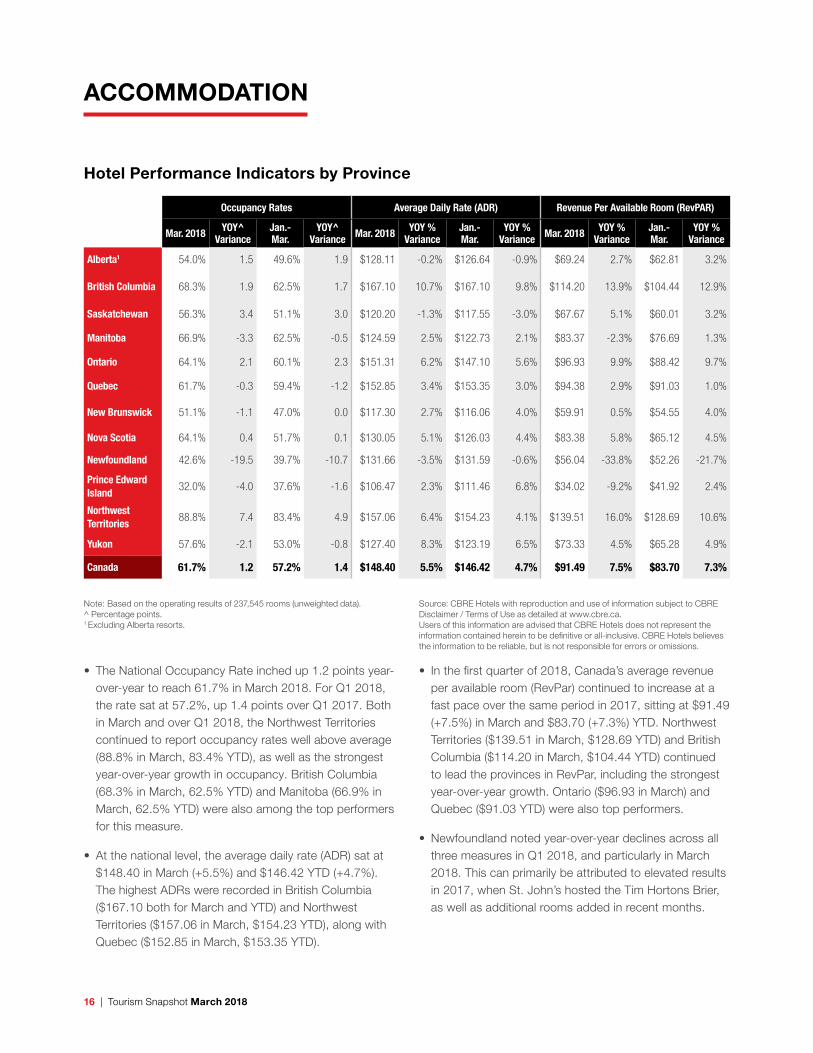
• The National Occupancy Rate inched up 1.2 points year-over-year to reach 61.7% in March 2018. For Q1 2018, the rate sat at 57.2%, up 1.4 points over Q1 2017. Both in March and over Q1 2018, the Northwest Territories continued to report occupancy rates well above average (88.8% in March, 83.4% YTD), as well as the strongest year-over-year growth in occupancy. British Columbia (68.3% in March, 62.5% YTD) and Manitoba (66.9% in March, 62.5% YTD) were also among the top performers for this measure.
• At the national level, the average daily rate (ADR) sat at $148.40 in March (+5.5%) and $146.42 YTD (+4.7%). The highest ADRs were recorded in British Columbia ($167.10 both for March and YTD) and Northwest Territories ($157.06 in March, $154.23 YTD), along with Quebec ($152.85 in March, $153.35 YTD).
• In the first quarter of 2018, Canada’s average revenue per available room (RevPar) continued to increase at a fast pace over the same period in 2017, sitting at $91.49 (+7.5%) in March and $83.70 (+7.3%) YTD. Northwest Territories ($139.51 in March, $128.69 YTD) and British Columbia ($114.20 in March, $104.44 YTD) continued to lead the provinces in RevPar, including the strongest year-over-year growth. Ontario ($96.93 in March) and Quebec ($91.03 YTD) were also top performers.
• Newfoundland noted year-over-year declines across all three measures in Q1 2018, and particularly in March 2018. This can primarily be attributed to elevated results in 2017, when St. John’s hosted the Tim Hortons Brier, as well as additional rooms added in recent months.
Tourism Snapshot March 2018 | 17
ACCOMMODATION
Hotel Performance Indicators by Property Type
Occupancy Rates Average Daily Rate (ADR)
Mar. 2018 YOY^ Change Jan.- Mar. YOY^ Variance Mar. 2018 YOY Variance Jan.- Mar. YOY Variance
Property Size Under 50 rooms 45.5% 0.6 42.5% 0.6 $108.07 4.1% $107.12 3.8%
50-75 rooms 53.9% 1.5 50.6% 2.1 $111.18 3.8% $109.92 3.6%
76-125 rooms 60.3% 1.2 55.7% 1.7 $125.06 3.2% $124.12 2.7%
126-200 rooms 62.5% 0.4 57.6% 0.9 $136.30 5.1% $134.44 4.3%
201-500 rooms 65.3% 1.3 61.0% 1.4 $175.75 7.0% $175.10 6.5%
Over 500 rooms 70.4% 2.4 64.9% 0.5 $218.20 6.3% $208.29 6.0%
Total 61.7% 1.2 57.2% 1.4 $148.40 5.5% $146.42 4.7%
Property Type Limited Service 56.6% 1.3 52.5% 1.8 $114.69 3.2% $113.35 3.0%
Full Service 63.9% 1.3 59.1% 1.4 $157.81 5.7% $153.92 5.1%
Suite Hotel 70.6% 0.1 65.8% 0.1 $157.50 7.7% $154.78 6.4%
Resort 63.3% 0.8 59.4% -0.4 $239.34 10.7% $250.28 9.5%
Total 61.7% 1.2 57.2% 1.4 $148.40 5.5% $146.42 4.7%
Price Level Budget 54.2% 1.7 50.2% 1.7 $99.34 6.7% $98.53 7.1%
Mid-Price 62.6% 0.7 57.8% 1.2 $138.53 3.3% $136.48 3.0%
Upscale 67.3% 1.7 63.3% 0.9 $243.07 8.2% $239.23 6.7%
Total 61.7% 1.2 57.2% 1.4 $148.40 5.5% $146.42 4.7%
Note: Based on the operating results of 237,545 rooms (unweighted data).^ Percentage points.
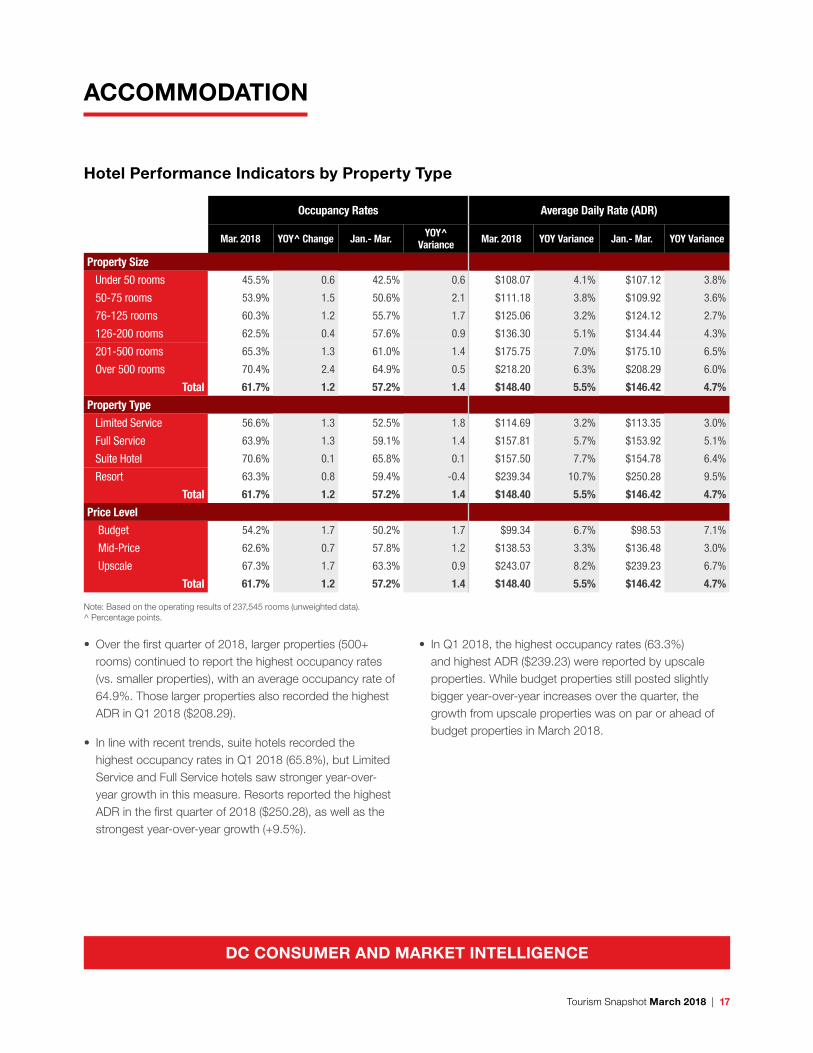
• Over the first quarter of 2018, larger properties (500+ rooms) continued to report the highest occupancy rates (vs. smaller properties), with an average occupancy rate of 64.9%. Those larger properties also recorded the highest ADR in Q1 2018 ($208.29).
• In line with recent trends, suite hotels recorded the highest occupancy rates in Q1 2018 (65.8%), but Limited Service and Full Service hotels saw stronger year-over-year growth in this measure. Resorts reported the highest ADR in the first quarter of 2018 ($250.28), as well as the strongest year-over-year growth (+9.5%).
• In Q1 2018, the highest occupancy rates (63.3%) and highest ADR ($239.23) were reported by upscale properties. While budget properties still posted slightly bigger year-over-year increases over the quarter, the growth from upscale properties was on par or ahead of budget properties in March 2018.
DC CONSUMER AND MARKET INTELLIGENCE