tourist accommodation 5 - visit brussels | visit brussels · tourist accommodation _____ 5 ......
TRANSCRIPT
Observatory for Tourism in Brussels Page 2.
Summary of tourism year 2014 in Brussels _____________________________ 3
Tourist accommodation _____________________________________________ 5
Accommodation offer ____________________________________________________ 5
Tourist arrivals and overnights ____________________________________________ 9
Meeting industry __________________________________________________ 36
Supply of meeting rooms ________________________________________________ 36
Number of meetings of international associations - UIA ______________________ 37
Number of meetings of international associations - ICCA _____________________ 38
Trade fairs and shows __________________________________________________ 39
Cultural tourist services ____________________________________________ 40
Cultural offer in museums and tourist attractions ___________________________ 40
Number of visitors in museums and attractions _____________________________ 40
Financial impact of the museums and attractions ___________________________ 41
Guided tours and Greeters ______________________________________________ 42
Special and regular events in Brussels ____________________________________ 43
Transport ________________________________________________________ 46
Airports ______________________________________________________________ 46
Brussels Airport – Zaventem _____________________________________________ 47
Railway ______________________________________________________________ 48
Sustainable tourism _______________________________________________ 49
The Eco-Labels ________________________________________________________ 50
Offer of eco-certified accommodations ____________________________________ 52
The Green City Index ___________________________________________________ 55
Green spaces _________________________________________________________ 55
Persons with reduced mobility ___________________________________________ 57
Observatory for Tourism in Brussels Page 3.
Summary of tourism year 2014 in Brussels
The progress registered in 2013 continued in 2014, with a 5.4% increase in overnight stays
to over 6.6 million by 3.4 million visitors. Length of stay also increased, to 1.93 nights per
visitor.
If we take into account the figures form other booking platforms, Brussels exceeds for the
first time - and largely - the 7 million overnight stays, a figure that we had announced during
the year.
As in 2013, the reasons for this increase can be found in the confirmation that we are out of
the crisis, the return of consumer and entrepreneur confidence and the improved
attractiveness and infrastructures of Brussels.
Both leisure tourism and business trips have contributed to this growth, with 5.1% and 5.8%
respectively. This means that business visitors remain ahead, with almost 53% of overnight
stays in Brussels. Brussels remains in second place globally in the UIA rankings and also
becomes the leading city in the world for meetings of international associations and
organisations with over 50 participants. This also moves it up the ICCA ranking to 11th place
globally, four places higher than the previous year.
Most visitors still stay in hotels, which have seen a 1.6% increase in occupancy rates to 73%,
while average prices have decreased by 1.6%. However, we can already state that 2015 has
reversed this downward trend in hotel prices.
France, Great Britain, Spain, Italy and the United States are the Top 5 foreign markets, but
still behind the domestic market, which is highest in Brussels (19.6% market share). Spain
returns to the 3rd position that it had ceded to Germany last year, thanks to a 15% increase
in overnight stays. The United States, our 15th largest market, also significantly increased its
overnight stays, by 14.1%.
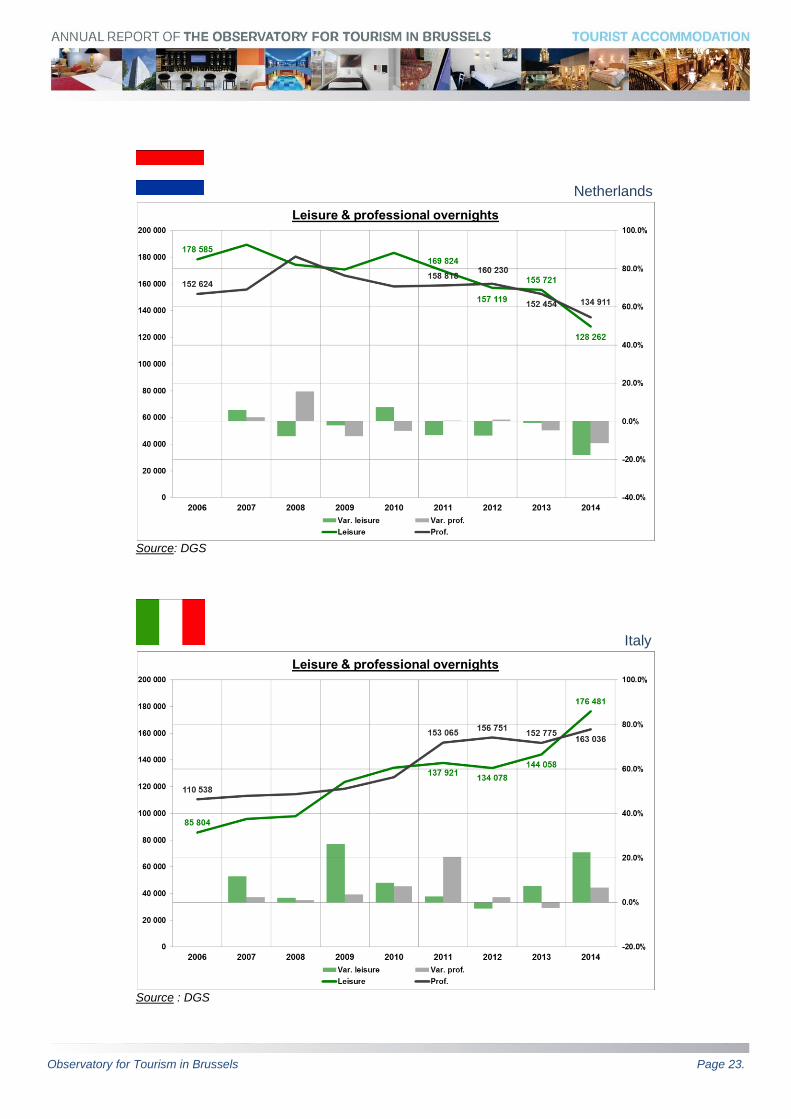
Among the most important countries, the Netherlands and Russia stand out due to a major
decrease. Visitor numbers from the Netherlands have been dropping constantly since 2011
(throughout Belgium) and those from Russia have been falling ever since the Ukrainian
crisis.
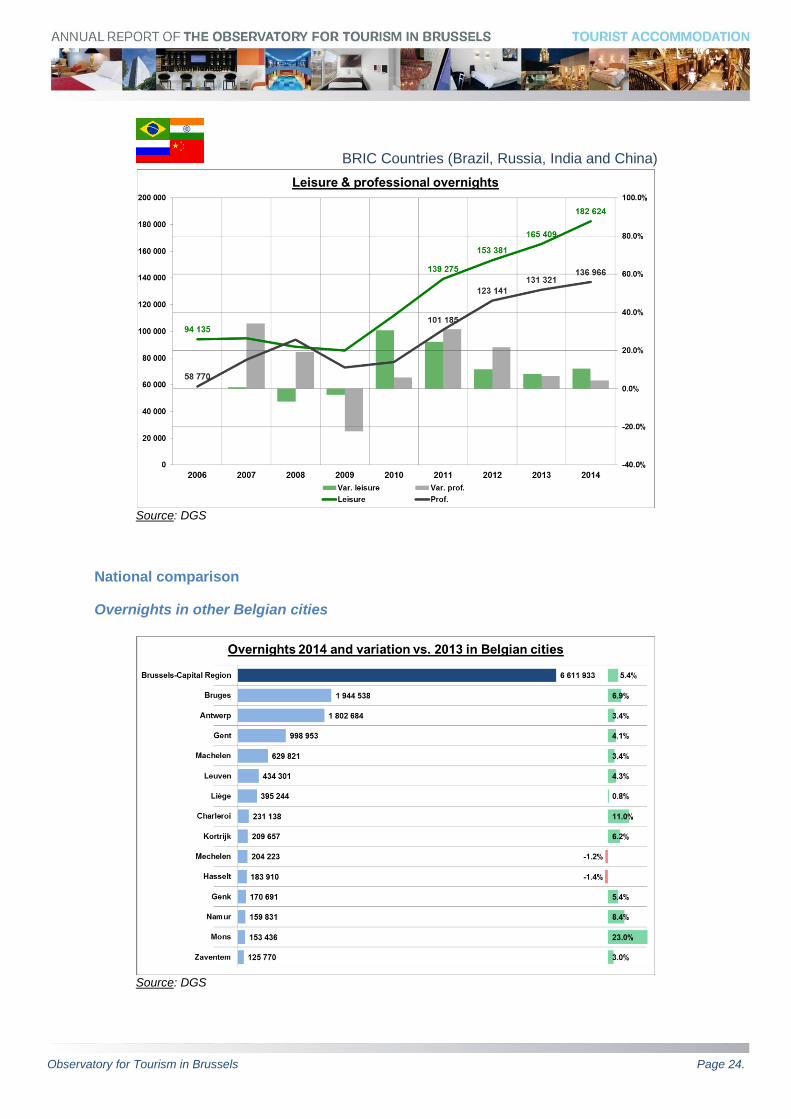
The Top 30 countries showing the highest increases are Greece (28%), Brazil (27.8%) and
Portugal (23.8%), closely followed by Australia (23.5%).
Initial observations on 2014 and the new hotel projects mean allow us to remain optimistic
about achieving our target of 10 million overnight stays by 2020.
Museums and attractions had a stable year, with less than 1% growth in visitor numbers.
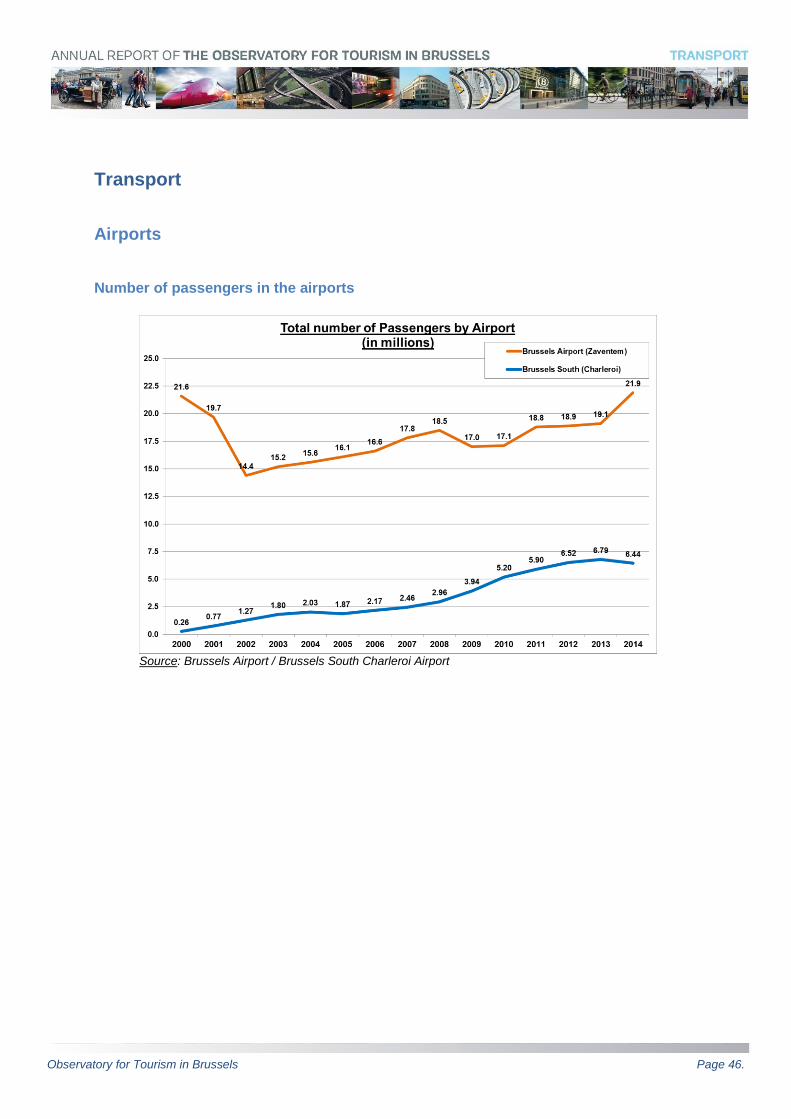
With regard to transport, Brussels Airport- Zaventem had an exceptional year, beating its
record passenger numbers from 2000 before the bankruptcy of Sabena, with 21.9 million
passengers (compared with 21.6 in 2000). The arrival of Ryanair has certainly had an
impact, as the destinations with the highest increases in passenger numbers (Barcelona,
Observatory for Tourism in Brussels Page 4.
Lisbon, etc.) are served by this airline. At the same time, Brussels South-Charleroi has
witnessed a decrease in passenger numbers following years of growth.
The outlook for the future is very healthy and we are pleased with the efforts made by the
entire sector to make Brussels more and more attractive to visitors from around the world
and ensure that it can continue to show strong growth, as demonstrated by greatly improved
figures.
We hope you enjoy reading it.
Happy reading.
Frédéric Cornet
Manager, Brussels Tourism Observatory
The annual report of the Brussels tourism observatory is a publication resulting from the collection and
processing of data provided by, among others, the FPS Economy, MKG Hospitality, TourMIS and
tourism service providers such as Brussels museums and attractions. It is established according to an
efficient methodology recognised by all Brussels tourism stakeholders.
The Tourism Observatory also publishes monthly barometers on the website of vist.brussels
(www.visitbrussels.be - Menu “Observatory”). These barometers show the trends in night stays, hotel
activity and visits to museums and attractions.
Observatory for Tourism in Brussels Page 5.
Tourist accommodation
Accommodation offer
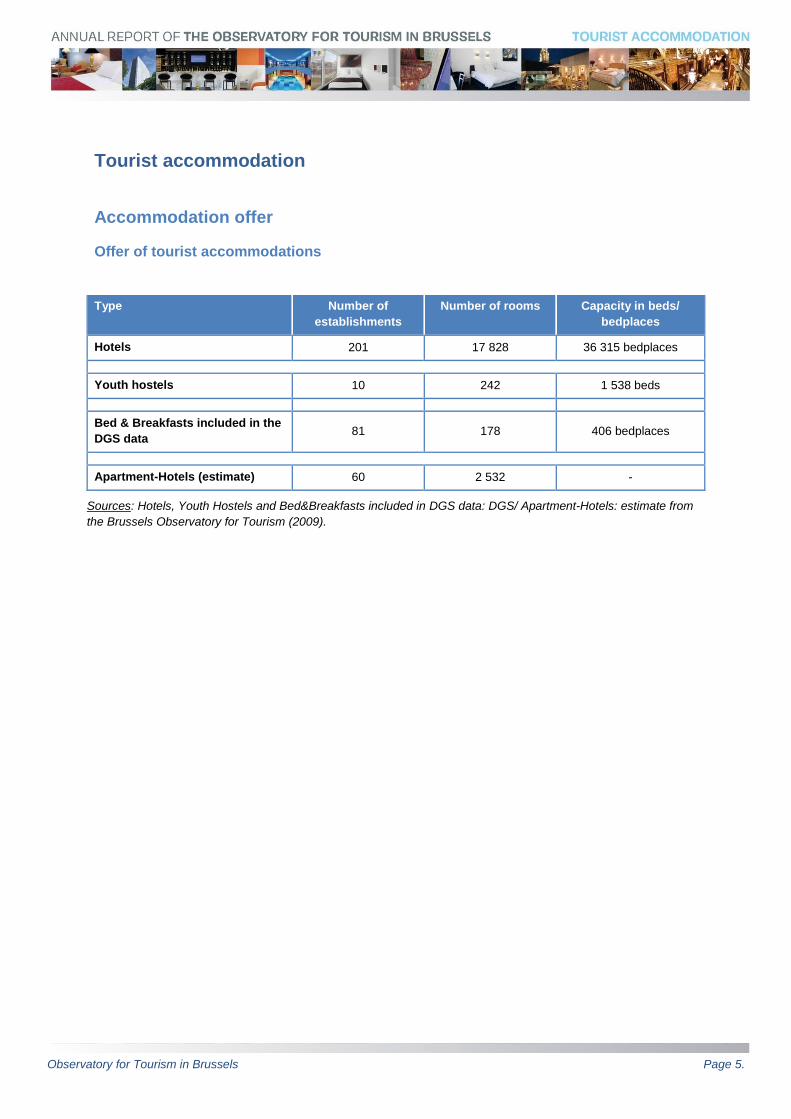
Offer of tourist accommodations
Type Number of
establishments
Number of rooms Capacity in beds/
bedplaces
Hotels 201 17 828 36 315 bedplaces
Youth hostels 10 242 1 538 beds
Bed & Breakfasts included in the
DGS data 81 178 406 bedplaces
Apartment-Hotels (estimate) 60 2 532 -
Sources: Hotels, Youth Hostels and Bed&Breakfasts included in DGS data: DGS/ Apartment-Hotels: estimate from
the Brussels Observatory for Tourism (2009).
Observatory for Tourism in Brussels Page 6.
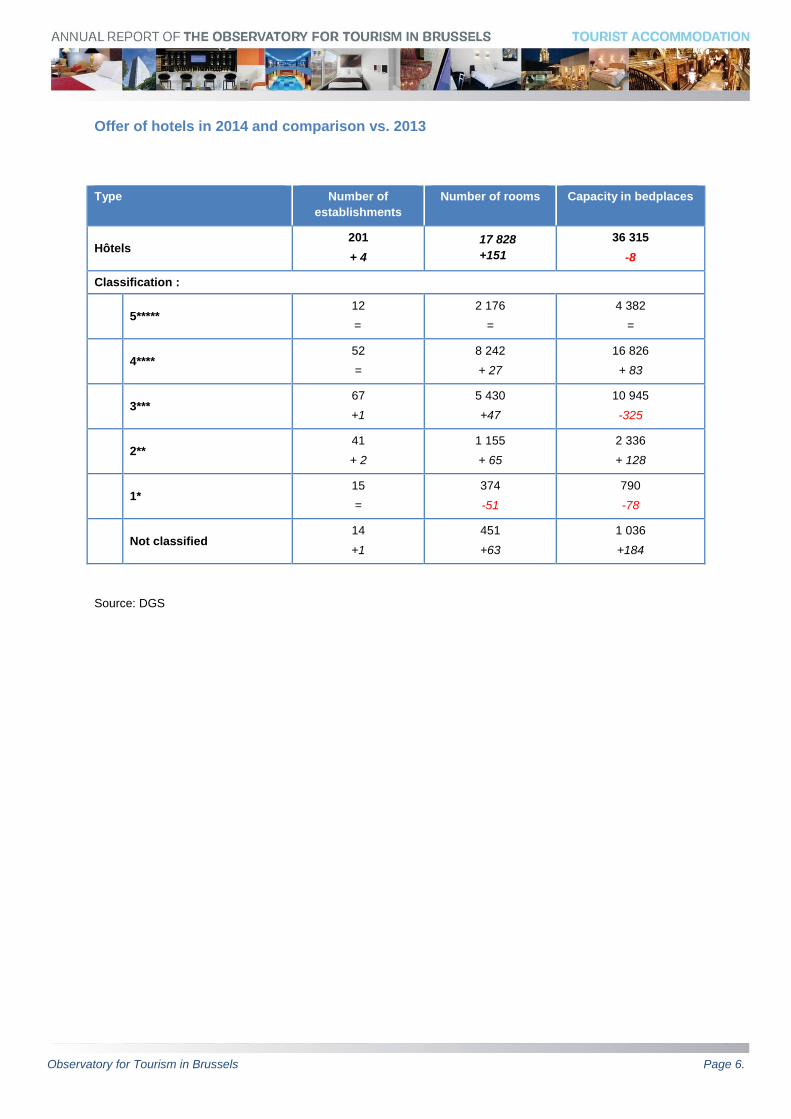
Offer of hotels in 2014 and comparison vs. 2013
Type Number of
establishments
Number of rooms Capacity in bedplaces
Hôtels 201
+ 4
17 828
+151
36 315
-8
Classification :
5*****
12
=
2 176
=
4 382
=
4****
52
=
8 242
+ 27
16 826
+ 83
3***
67
+1
5 430
+47
10 945
-325
2**
41
+ 2
1 155
+ 65
2 336
+ 128
1*
15
=
374
-51
790
-78
Not classified
14
+1
451
+63
1 036
+184
Source: DGS
Observatory for Tourism in Brussels Page 7.
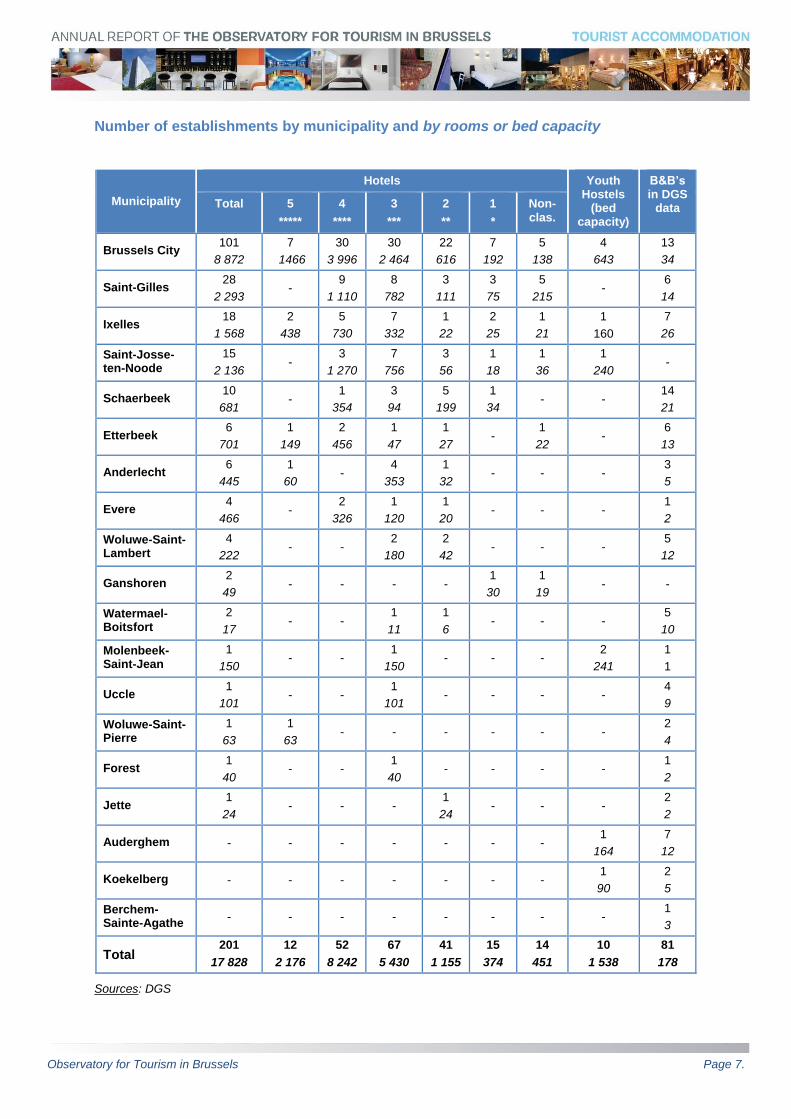
Number of establishments by municipality and by rooms or bed capacity
Municipality
Hotels Youth Hostels
(bed capacity)
B&B’s in DGS
data Total 5
*****
4
****
3
***
2
**
1
*
Non-clas.
Brussels City 101
8 872
7
1466
30
3 996
30
2 464
22
616
7
192
5
138
4
643
13
34
Saint-Gilles 28
2 293 -
9
1 110
8
782
3
111
3
75
5
215 -
6
14
Ixelles 18
1 568
2
438
5
730
7
332
1
22
2
25
1
21
1
160
7
26
Saint-Josse-ten-Noode
15
2 136 -
3
1 270
7
756
3
56
1
18
1
36
1
240 -
Schaerbeek 10
681 -
1
354
3
94
5
199
1
34 - -
14
21
Etterbeek 6
701
1
149
2
456
1
47
1
27 -
1
22 -
6
13
Anderlecht 6
445
1
60 -
4
353
1
32 - - -
3
5
Evere 4
466 -
2
326
1
120
1
20 - - -
1
2
Woluwe-Saint-Lambert
4
222 - -
2
180
2
42 - - -
5
12
Ganshoren 2
49 - - - -
1
30
1
19 - -
Watermael-Boitsfort
2
17 - -
1
11
1
6 - - -
5
10
Molenbeek-Saint-Jean
1
150 - -
1
150 - - -
2
241
1
1
Uccle 1
101 - -
1
101 - - - -
4
9
Woluwe-Saint-Pierre
1
63
1
63 - - - - - -
2
4
Forest 1
40 - -
1
40 - - - -
1
2
Jette 1
24 - - -
1
24 - - -
2
2
Auderghem - - - - - - - 1
164
7
12
Koekelberg - - - - - - - 1
90
2
5
Berchem-Sainte-Agathe
- - - - - - - - 1
3
Total 201
17 828
12
2 176
52
8 242
67
5 430
41
1 155
15
374
14
451
10
1 538
81
178
Sources: DGS
Observatory for Tourism in Brussels Page 8.
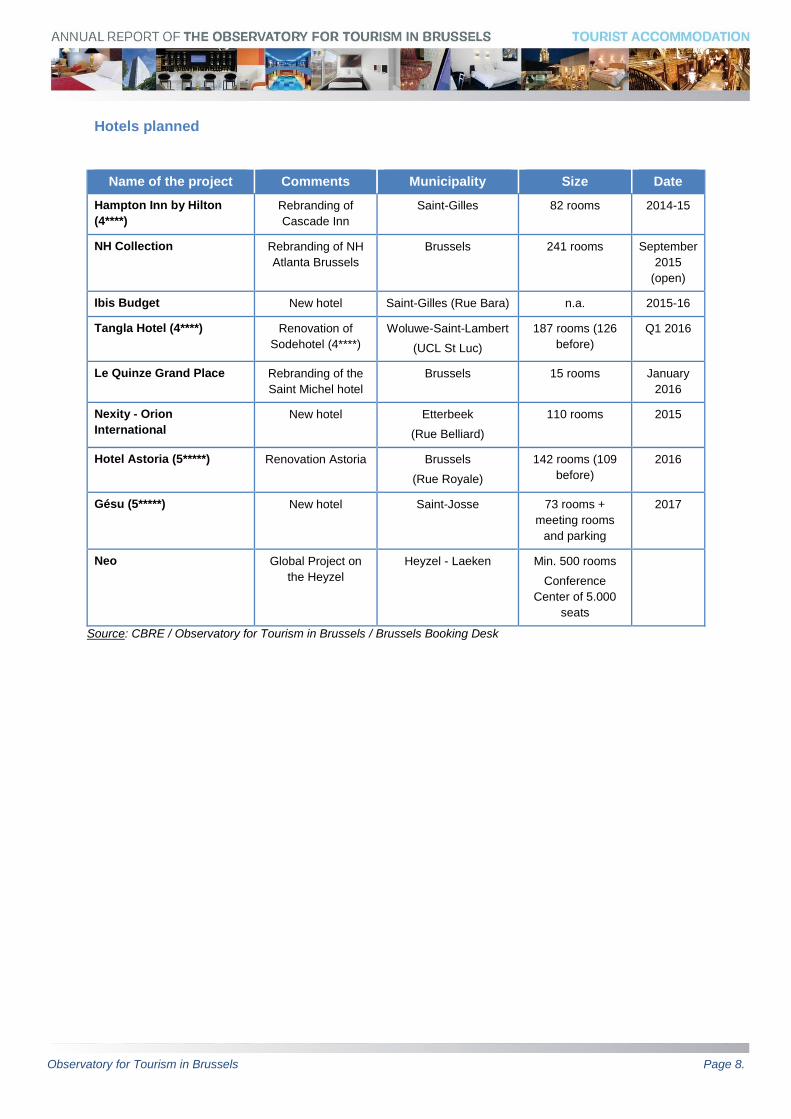
Hotels planned
Name of the project Comments Municipality Size Date
Hampton Inn by Hilton
(4****)
Rebranding of
Cascade Inn
Saint-Gilles 82 rooms 2014-15
NH Collection Rebranding of NH
Atlanta Brussels
Brussels 241 rooms September
2015
(open)
Ibis Budget New hotel Saint-Gilles (Rue Bara) n.a. 2015-16
Tangla Hotel (4****) Renovation of
Sodehotel (4****)
Woluwe-Saint-Lambert
(UCL St Luc)
187 rooms (126
before)
Q1 2016
Le Quinze Grand Place Rebranding of the
Saint Michel hotel
Brussels 15 rooms January
2016
Nexity - Orion
International
New hotel Etterbeek
(Rue Belliard)
110 rooms 2015
Hotel Astoria (5*****) Renovation Astoria Brussels
(Rue Royale)
142 rooms (109
before)
2016
Gésu (5*****) New hotel Saint-Josse 73 rooms +
meeting rooms
and parking
2017
Neo Global Project on
the Heyzel
Heyzel - Laeken Min. 500 rooms
Conference
Center of 5.000
seats
Source: CBRE / Observatory for Tourism in Brussels / Brussels Booking Desk
Observatory for Tourism in Brussels Page 9.
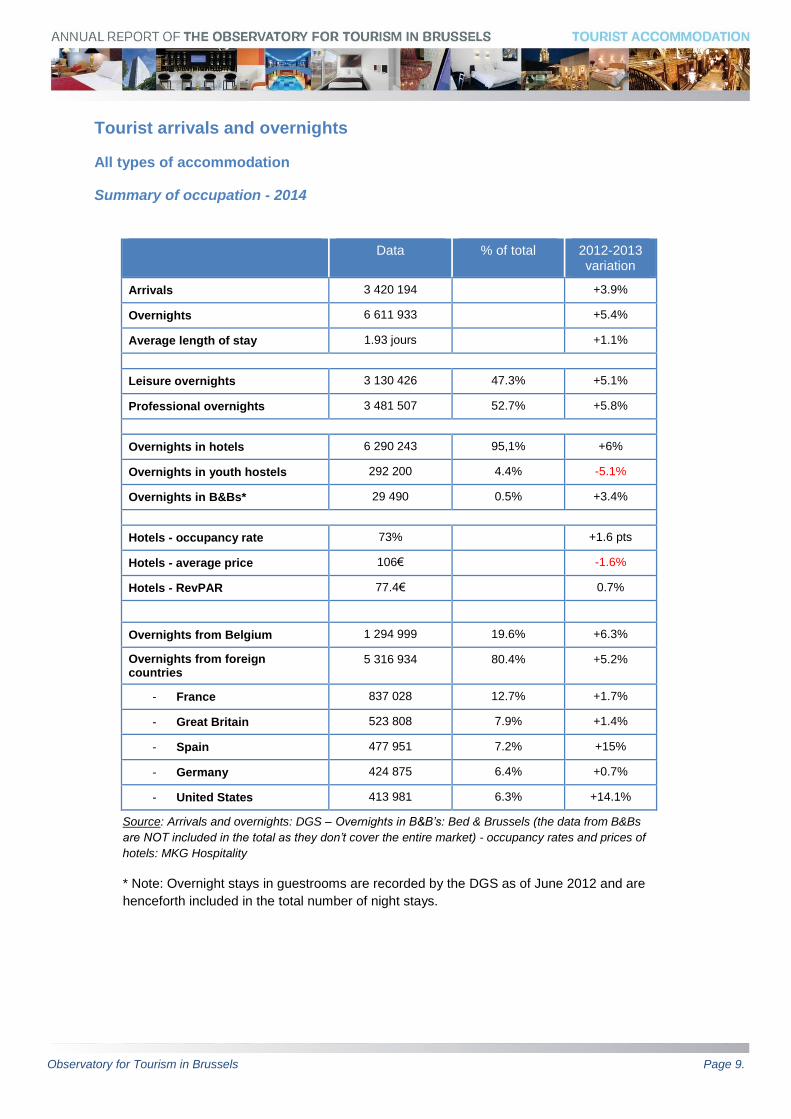
Tourist arrivals and overnights
All types of accommodation
Summary of occupation - 2014
Data % of total 2012-2013 variation
Arrivals 3 420 194 +3.9%
Overnights 6 611 933 +5.4%
Average length of stay 1.93 jours +1.1%
Leisure overnights 3 130 426 47.3% +5.1%
Professional overnights 3 481 507 52.7% +5.8%
Overnights in hotels 6 290 243 95,1% +6%
Overnights in youth hostels 292 200 4.4% -5.1%
Overnights in B&Bs* 29 490 0.5% +3.4%
Hotels - occupancy rate 73% +1.6 pts
Hotels - average price 106€ -1.6%
Hotels - RevPAR 77.4€ 0.7%
Overnights from Belgium 1 294 999 19.6% +6.3%
Overnights from foreign countries
5 316 934 80.4% +5.2%
- France 837 028 12.7% +1.7%
- Great Britain 523 808 7.9% +1.4%
- Spain 477 951 7.2% +15%
- Germany 424 875 6.4% +0.7%
- United States 413 981 6.3% +14.1%
Source: Arrivals and overnights: DGS – Overnights in B&B’s: Bed & Brussels (the data from B&Bs
are NOT included in the total as they don’t cover the entire market) - occupancy rates and prices of
hotels: MKG Hospitality
* Note: Overnight stays in guestrooms are recorded by the DGS as of June 2012 and are
henceforth included in the total number of night stays.
Observatory for Tourism in Brussels Page 10.
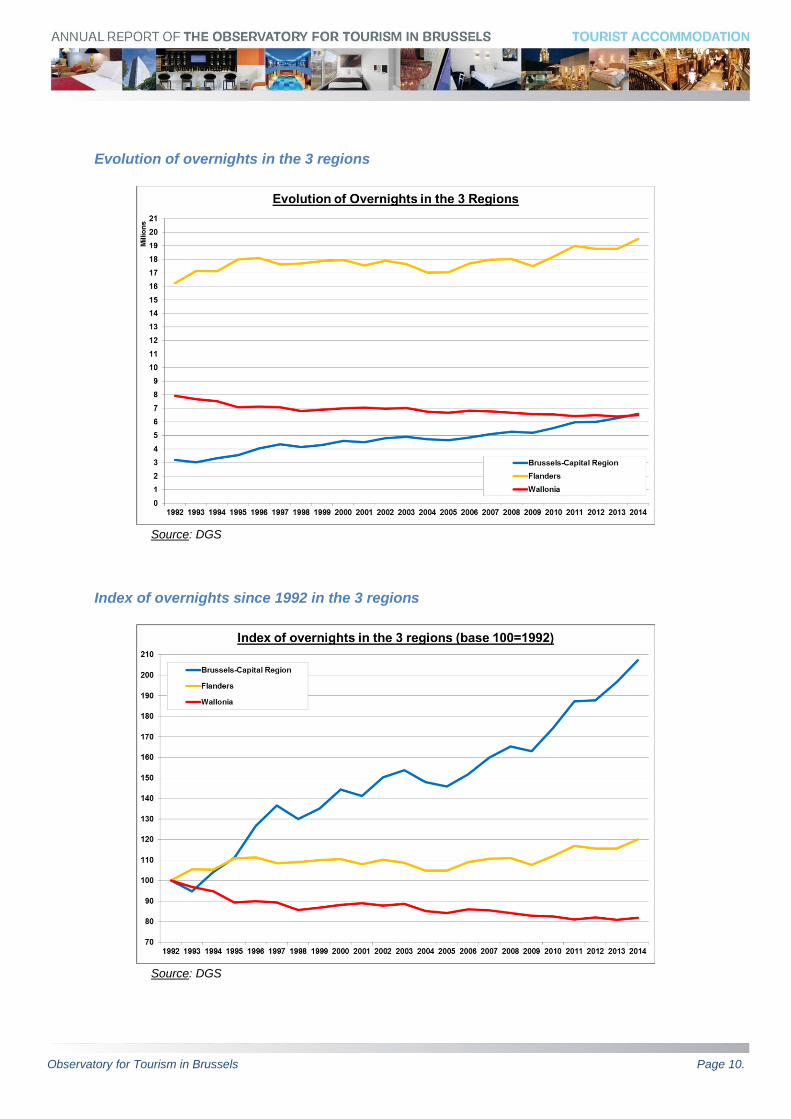
Evolution of overnights in the 3 regions
Source: DGS
Index of overnights since 1992 in the 3 regions
Source: DGS
Observatory for Tourism in Brussels Page 11.
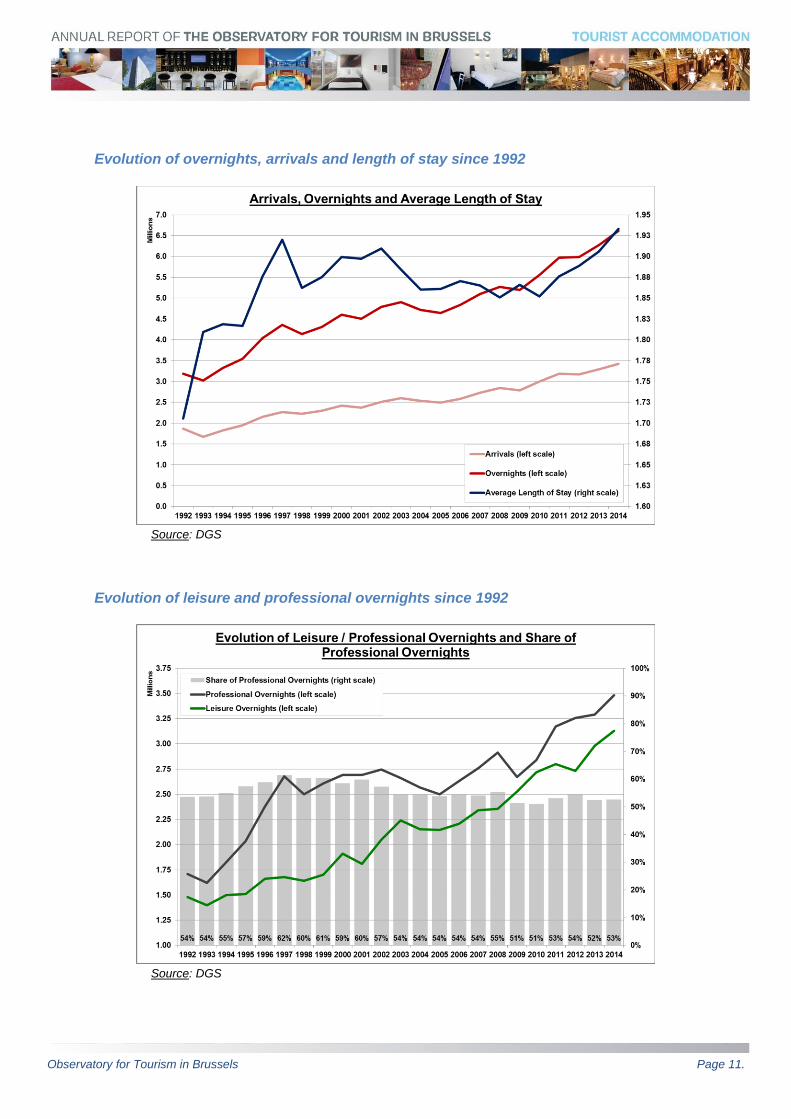
Evolution of overnights, arrivals and length of stay since 1992
Source: DGS
Evolution of leisure and professional overnights since 1992
Source: DGS
Observatory for Tourism in Brussels Page 12.
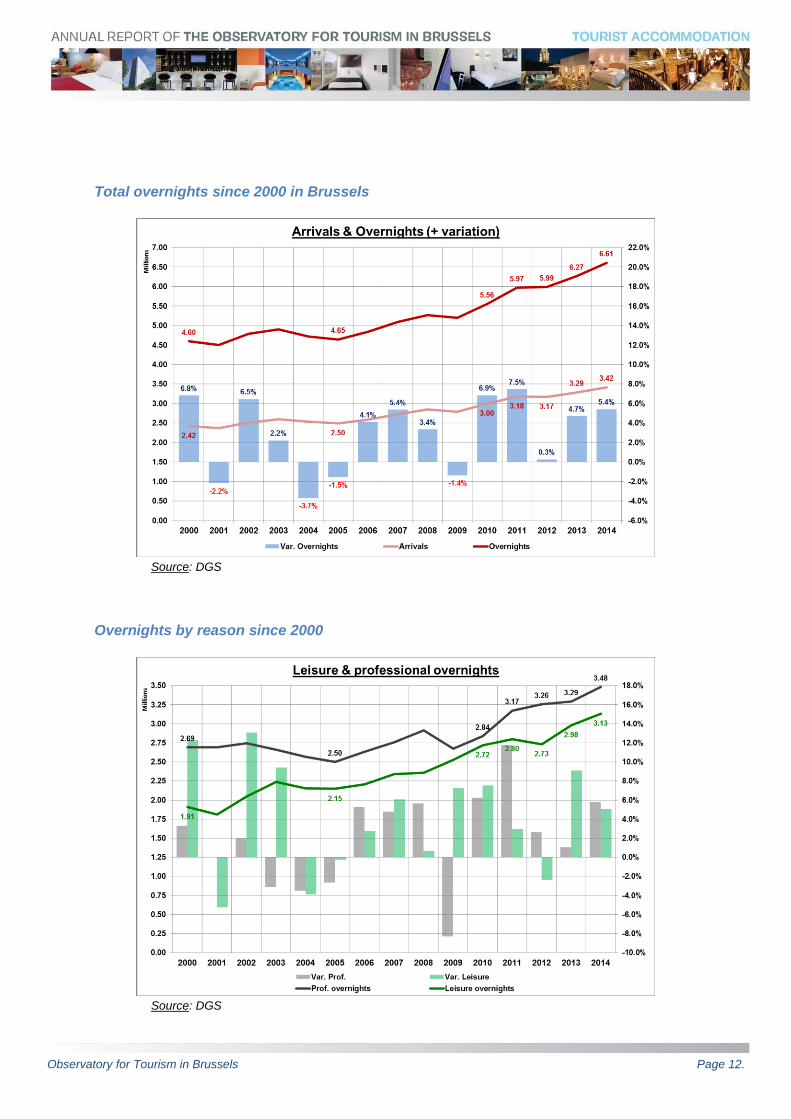
Total overnights since 2000 in Brussels
Source: DGS
Overnights by reason since 2000
Source: DGS
Observatory for Tourism in Brussels Page 13.
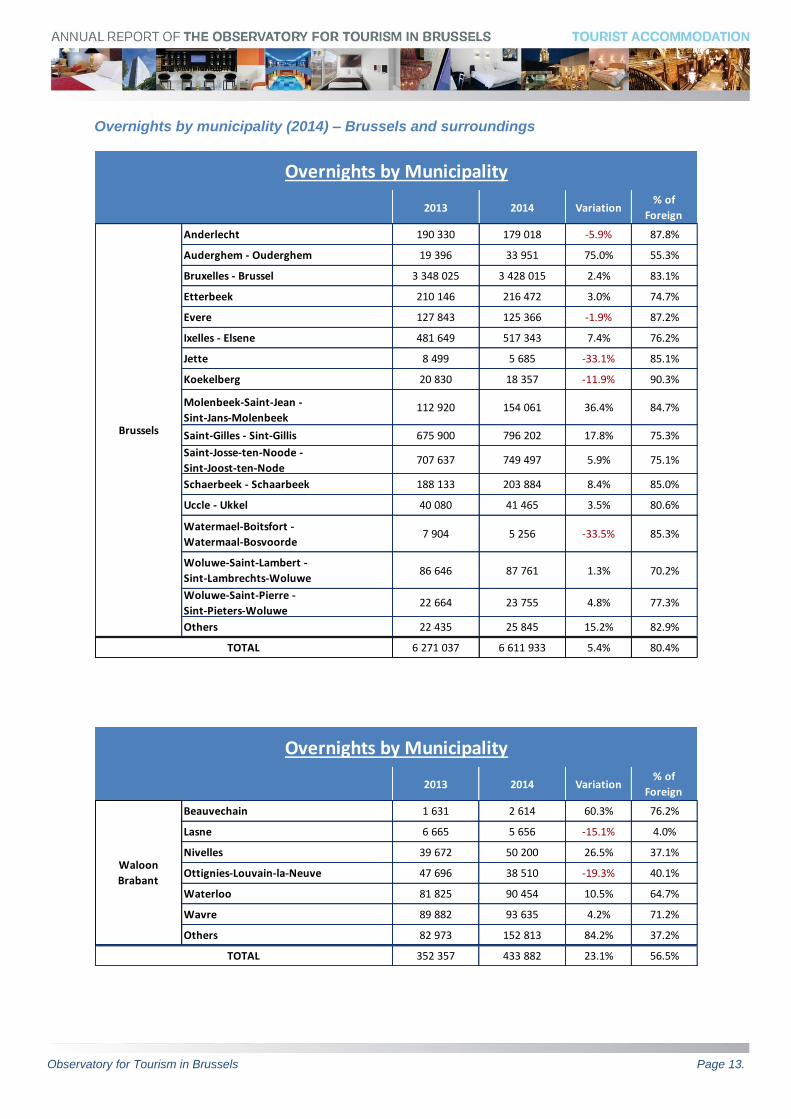
Overnights by municipality (2014) – Brussels and surroundings
2013 2014 Variation% of
Foreign
Anderlecht 190 330 179 018 -5.9% 87.8%
Auderghem - Ouderghem 19 396 33 951 75.0% 55.3%
Bruxelles - Brussel 3 348 025 3 428 015 2.4% 83.1%
Etterbeek 210 146 216 472 3.0% 74.7%
Evere 127 843 125 366 -1.9% 87.2%
Ixelles - Elsene 481 649 517 343 7.4% 76.2%
Jette 8 499 5 685 -33.1% 85.1%
Koekelberg 20 830 18 357 -11.9% 90.3%
Molenbeek-Saint-Jean -
Sint-Jans-Molenbeek112 920 154 061 36.4% 84.7%
Saint-Gilles - Sint-Gillis 675 900 796 202 17.8% 75.3%
Saint-Josse-ten-Noode -
Sint-Joost-ten-Node707 637 749 497 5.9% 75.1%
Schaerbeek - Schaarbeek 188 133 203 884 8.4% 85.0%
Uccle - Ukkel 40 080 41 465 3.5% 80.6%
Watermael-Boitsfort -
Watermaal-Bosvoorde7 904 5 256 -33.5% 85.3%
Woluwe-Saint-Lambert -
Sint-Lambrechts-Woluwe86 646 87 761 1.3% 70.2%
Woluwe-Saint-Pierre -
Sint-Pieters-Woluwe22 664 23 755 4.8% 77.3%
Others 22 435 25 845 15.2% 82.9%
6 271 037 6 611 933 5.4% 80.4%TOTAL
Brussels
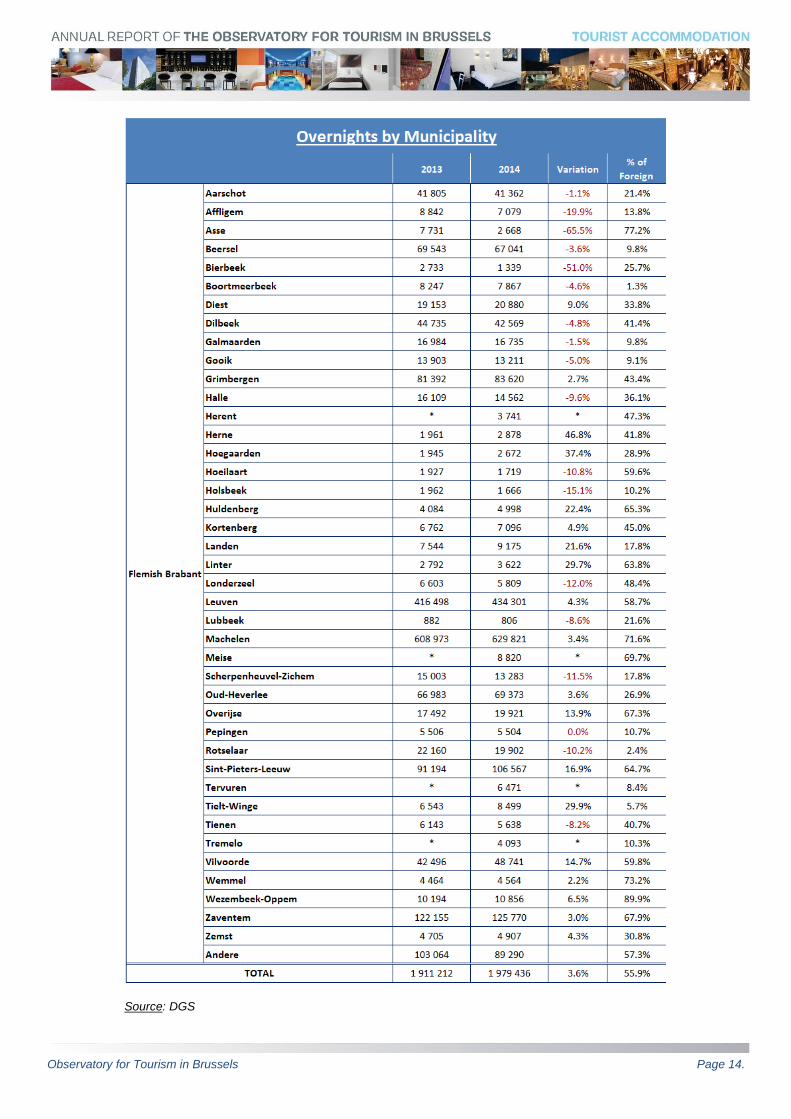
Overnights by Municipality
2013 2014 Variation% of
Foreign
Beauvechain 1 631 2 614 60.3% 76.2%
Lasne 6 665 5 656 -15.1% 4.0%
Nivelles 39 672 50 200 26.5% 37.1%
Ottignies-Louvain-la-Neuve 47 696 38 510 -19.3% 40.1%
Waterloo 81 825 90 454 10.5% 64.7%
Wavre 89 882 93 635 4.2% 71.2%
Others 82 973 152 813 84.2% 37.2%
352 357 433 882 23.1% 56.5%TOTAL
Overnights by Municipality
Waloon
Brabant
Observatory for Tourism in Brussels Page 14.
Source: DGS
Observatory for Tourism in Brussels Page 15.
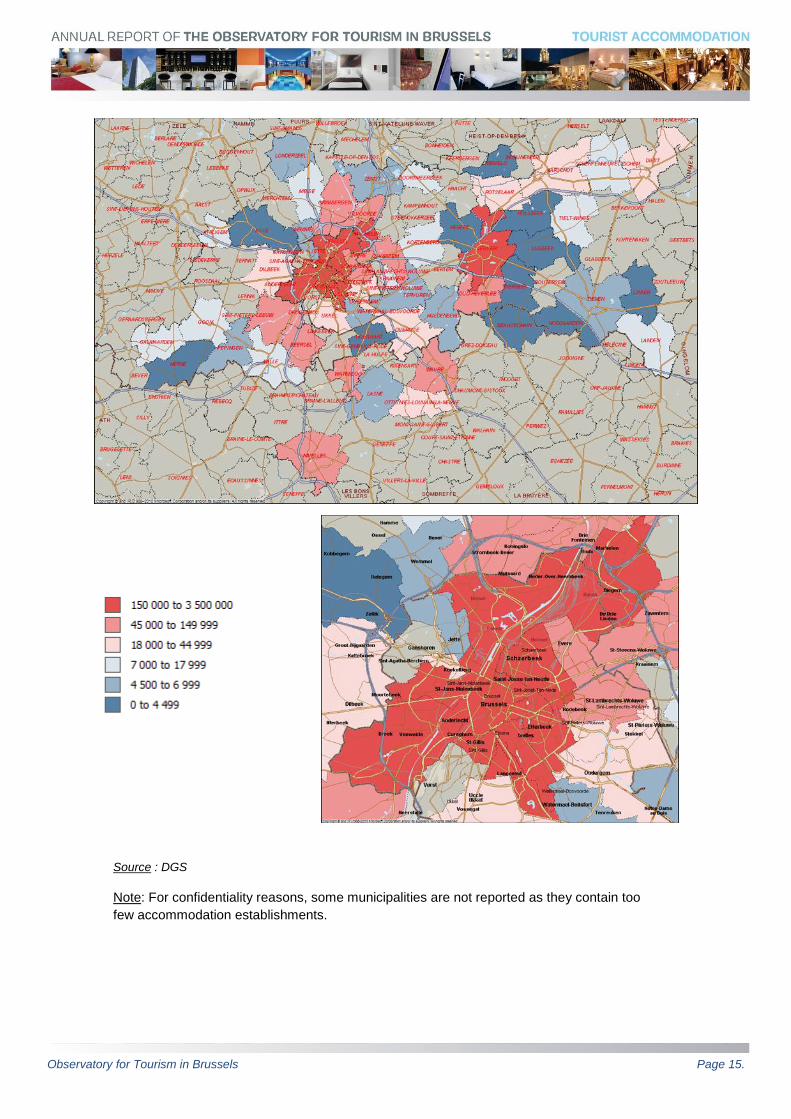
Source : DGS
Note: For confidentiality reasons, some municipalities are not reported as they contain too
few accommodation establishments.
Observatory for Tourism in Brussels Page 16.
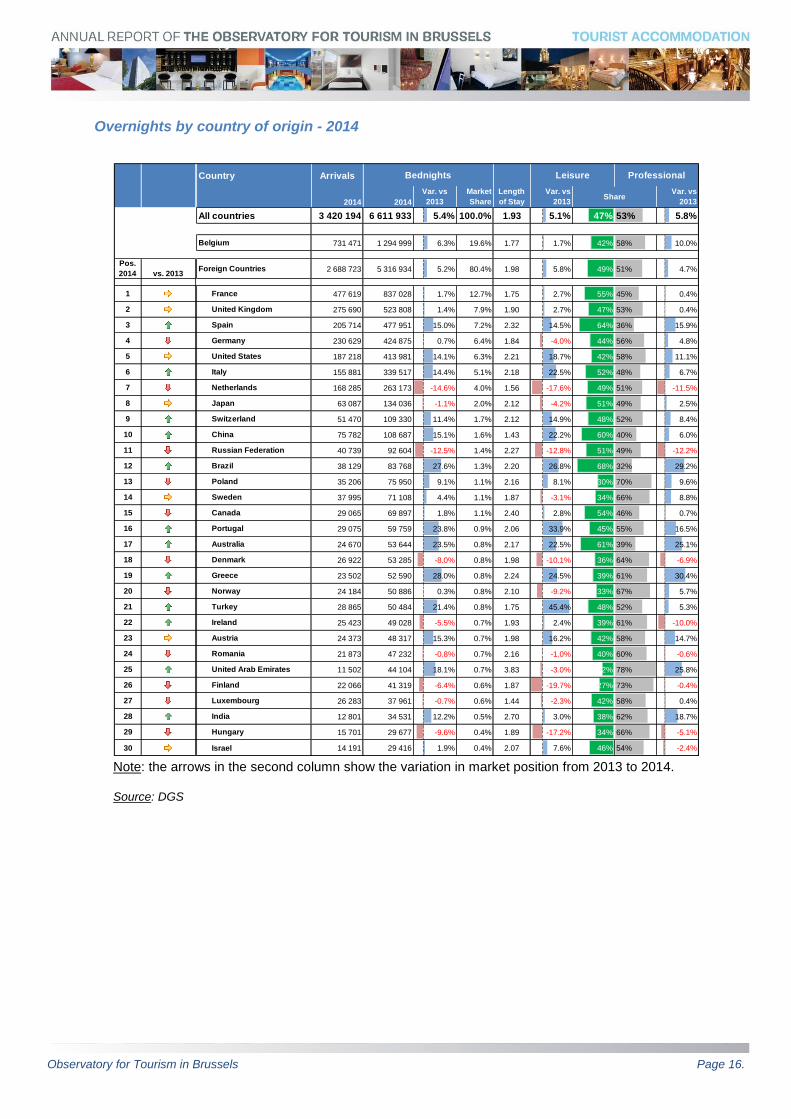
Overnights by country of origin - 2014
Note: the arrows in the second column show the variation in market position from 2013 to 2014.
Source: DGS
Country Arrivals
2014 2014
Var. vs
2013
Market
Share
Length
of Stay
Var. vs
2013
Var. vs
2013
_AllAll countries 3 420 194 6 611 933 5.4% 100.0% 1.93 5.1% 47% 53% 5.8%
BE-BelgiumBelgium 731 471 1 294 999 6.3% 19.6% 1.77 1.7% 42% 58% 10.0%
Pos.
2014 vs. 2013G_NRES-Non ResidentsForeign Countries 2 688 723 5 316 934 5.2% 80.4% 1.98 5.8% 49% 51% 4.7%
1 FR-FranceFrance 477 619 837 028 1.7% 12.7% 1.75 2.7% 55% 45% 0.4%
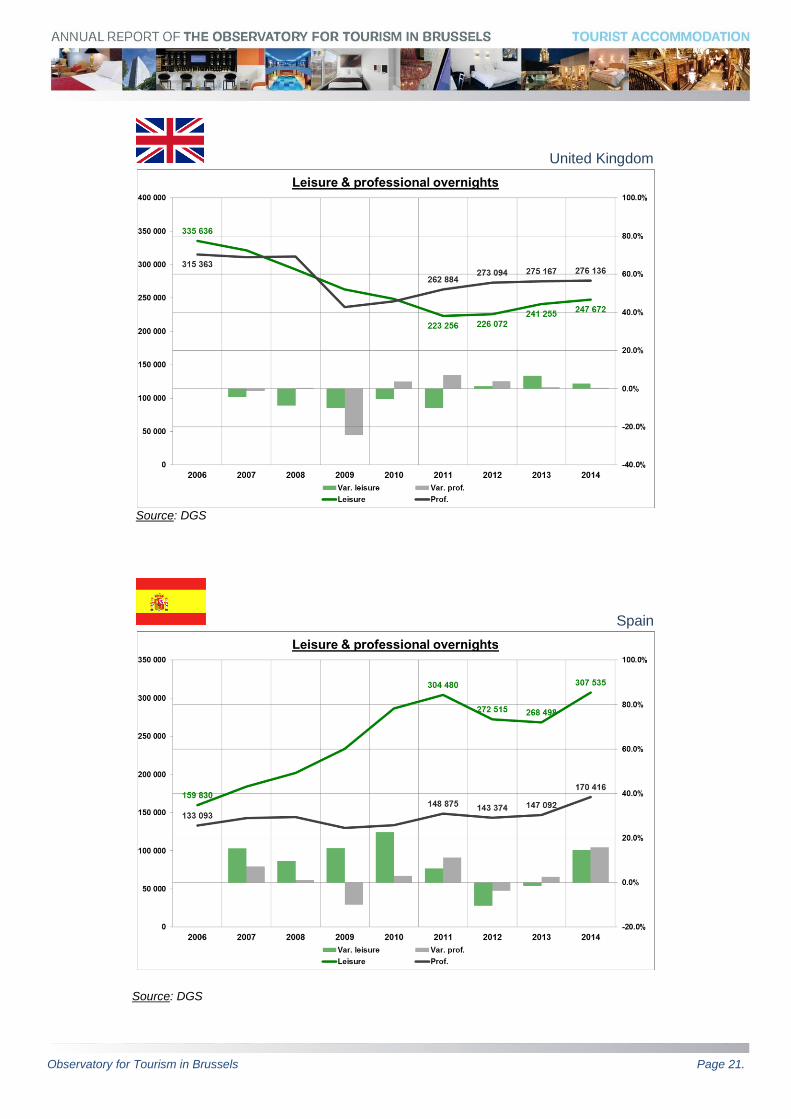
2 GB-United KingdomUnited Kingdom 275 690 523 808 1.4% 7.9% 1.90 2.7% 47% 53% 0.4%
3 ES-SpainSpain 205 714 477 951 15.0% 7.2% 2.32 14.5% 64% 36% 15.9%
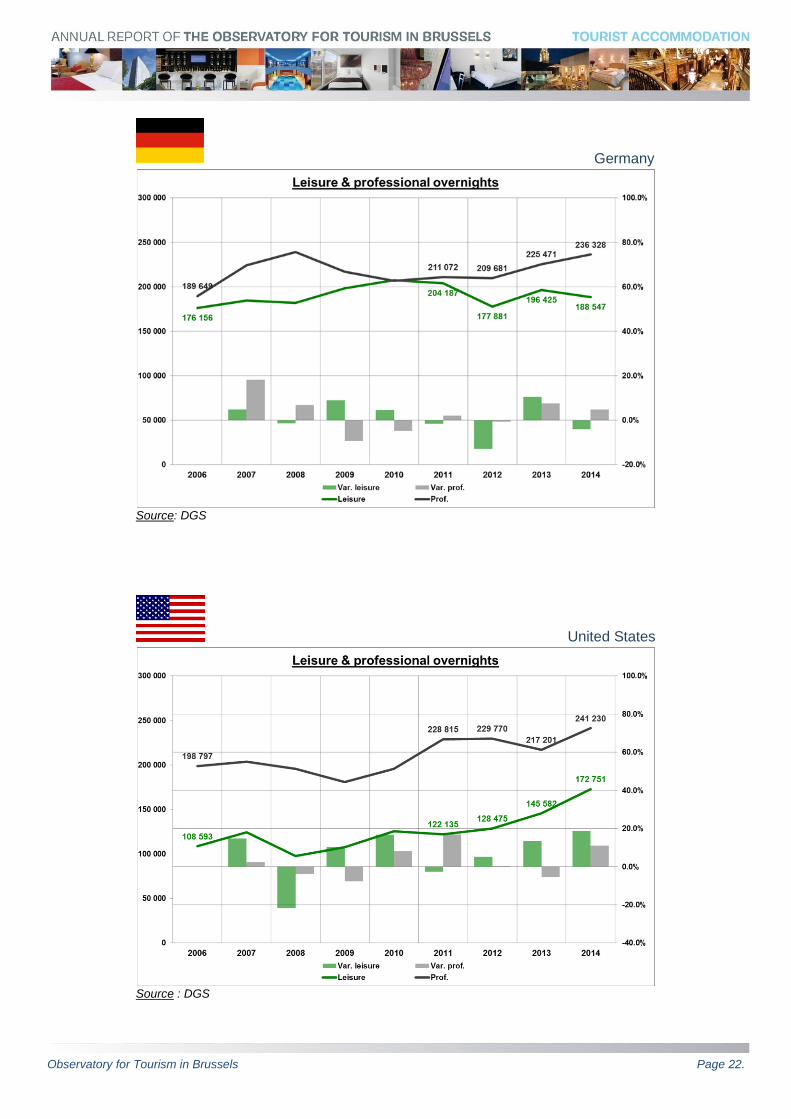
4 DE-GermanyGermany 230 629 424 875 0.7% 6.4% 1.84 -4.0% 44% 56% 4.8%
5 US-United StatesUnited States 187 218 413 981 14.1% 6.3% 2.21 18.7% 42% 58% 11.1%
6 IT-ItalyItaly 155 881 339 517 14.4% 5.1% 2.18 22.5% 52% 48% 6.7%
7 NL-NetherlandsNetherlands 168 285 263 173 -14.6% 4.0% 1.56 -17.6% 49% 51% -11.5%
8 JP-JapanJapan 63 087 134 036 -1.1% 2.0% 2.12 -4.2% 51% 49% 2.5%
9 CH-SwitzerlandSwitzerland 51 470 109 330 11.4% 1.7% 2.12 14.9% 48% 52% 8.4%
10 CN-ChinaChina 75 782 108 687 15.1% 1.6% 1.43 22.2% 60% 40% 6.0%
11 RU-Russian FederationRussian Federation 40 739 92 604 -12.5% 1.4% 2.27 -12.8% 51% 49% -12.2%
12 BR-BrazilBrazil 38 129 83 768 27.6% 1.3% 2.20 26.8% 68% 32% 29.2%
13 PL-PolandPoland 35 206 75 950 9.1% 1.1% 2.16 8.1% 30% 70% 9.6%
14 SE-SwedenSweden 37 995 71 108 4.4% 1.1% 1.87 -3.1% 34% 66% 8.8%
15 CA-CanadaCanada 29 065 69 897 1.8% 1.1% 2.40 2.8% 54% 46% 0.7%
16 PT-PortugalPortugal 29 075 59 759 23.8% 0.9% 2.06 33.9% 45% 55% 16.5%
17 AU-AustraliaAustralia 24 670 53 644 23.5% 0.8% 2.17 22.5% 61% 39% 25.1%
18 DK-DenmarkDenmark 26 922 53 285 -8.0% 0.8% 1.98 -10.1% 36% 64% -6.9%
19 GR-GreeceGreece 23 502 52 590 28.0% 0.8% 2.24 24.5% 39% 61% 30.4%
20 NO-NorwayNorway 24 184 50 886 0.3% 0.8% 2.10 -9.2% 33% 67% 5.7%
21 TR-TurkeyTurkey 28 865 50 484 21.4% 0.8% 1.75 45.4% 48% 52% 5.3%
22 IE-IrelandIreland 25 423 49 028 -5.5% 0.7% 1.93 2.4% 39% 61% -10.0%
23 AT-AustriaAustria 24 373 48 317 15.3% 0.7% 1.98 16.2% 42% 58% 14.7%
24 RO-RomaniaRomania 21 873 47 232 -0.8% 0.7% 2.16 -1.0% 40% 60% -0.6%
25 AE-United Arab EmiratesUnited Arab Emirates 11 502 44 104 18.1% 0.7% 3.83 -3.0% 22% 78% 25.8%
26 FI-FinlandFinland 22 066 41 319 -6.4% 0.6% 1.87 -19.7% 27% 73% -0.4%
27 LU-LuxembourgLuxembourg 26 283 37 961 -0.7% 0.6% 1.44 -2.3% 42% 58% 0.4%
28 IN-IndiaIndia 12 801 34 531 12.2% 0.5% 2.70 3.0% 38% 62% 18.7%
29 HU-HungaryHungary 15 701 29 677 -9.6% 0.4% 1.89 -17.2% 34% 66% -5.1%
30 IL-IsraelIsrael 14 191 29 416 1.9% 0.4% 2.07 7.6% 46% 54% -2.4%
Leisure ProfessionalBednights
Share
Observatory for Tourism in Brussels Page 17.
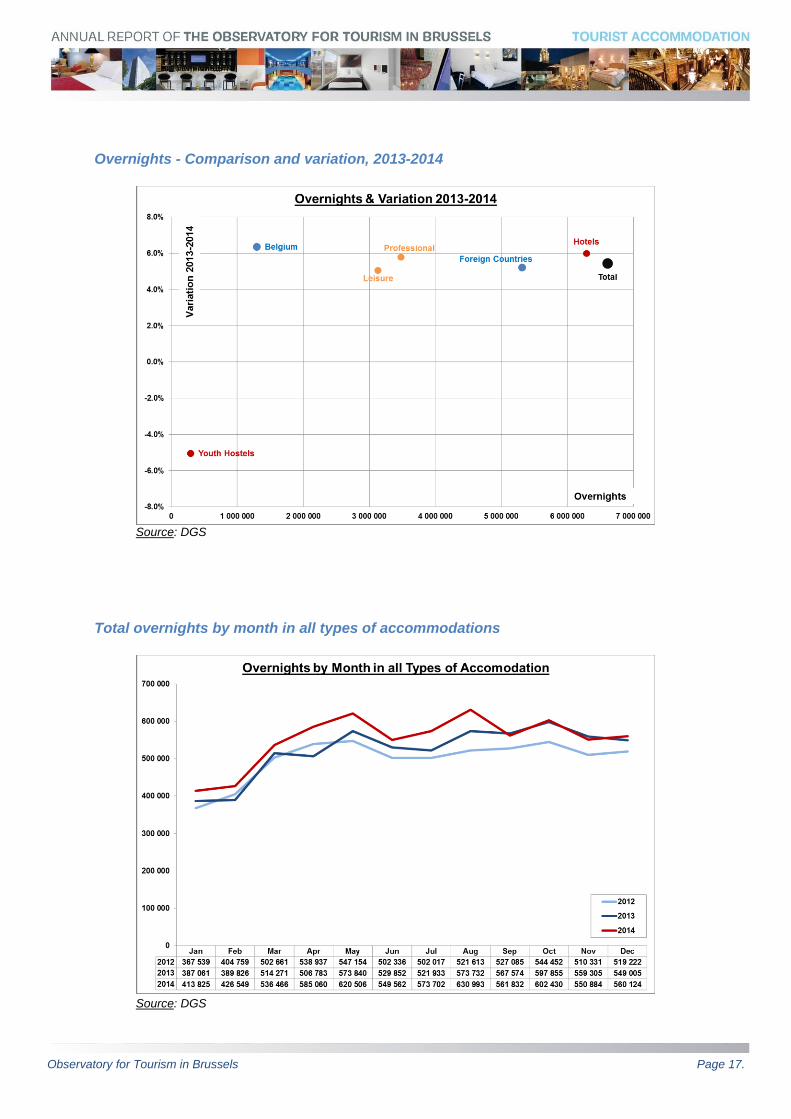
Overnights - Comparison and variation, 2013-2014
Source: DGS
Total overnights by month in all types of accommodations
Source: DGS
Observatory for Tourism in Brussels Page 18.
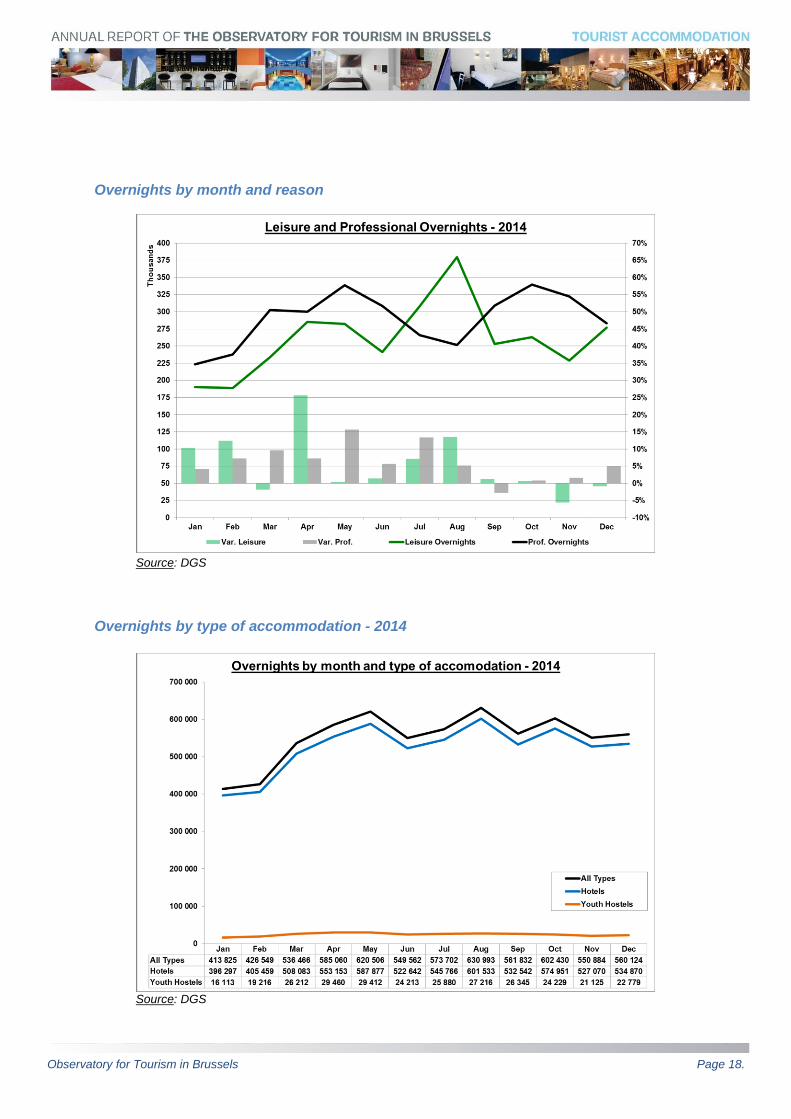
Overnights by month and reason
Source: DGS
Overnights by type of accommodation - 2014
Source: DGS
Observatory for Tourism in Brussels Page 19.
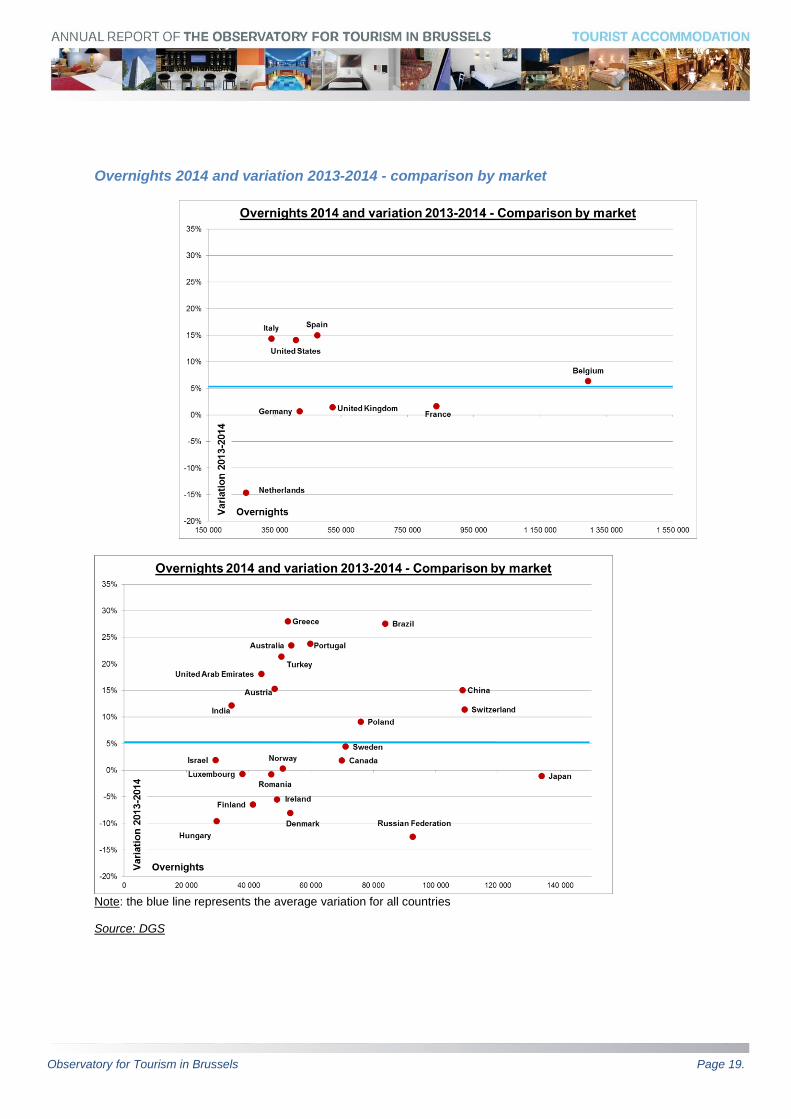
Overnights 2014 and variation 2013-2014 - comparison by market
Note: the blue line represents the average variation for all countries
Source: DGS
Observatory for Tourism in Brussels Page 20.
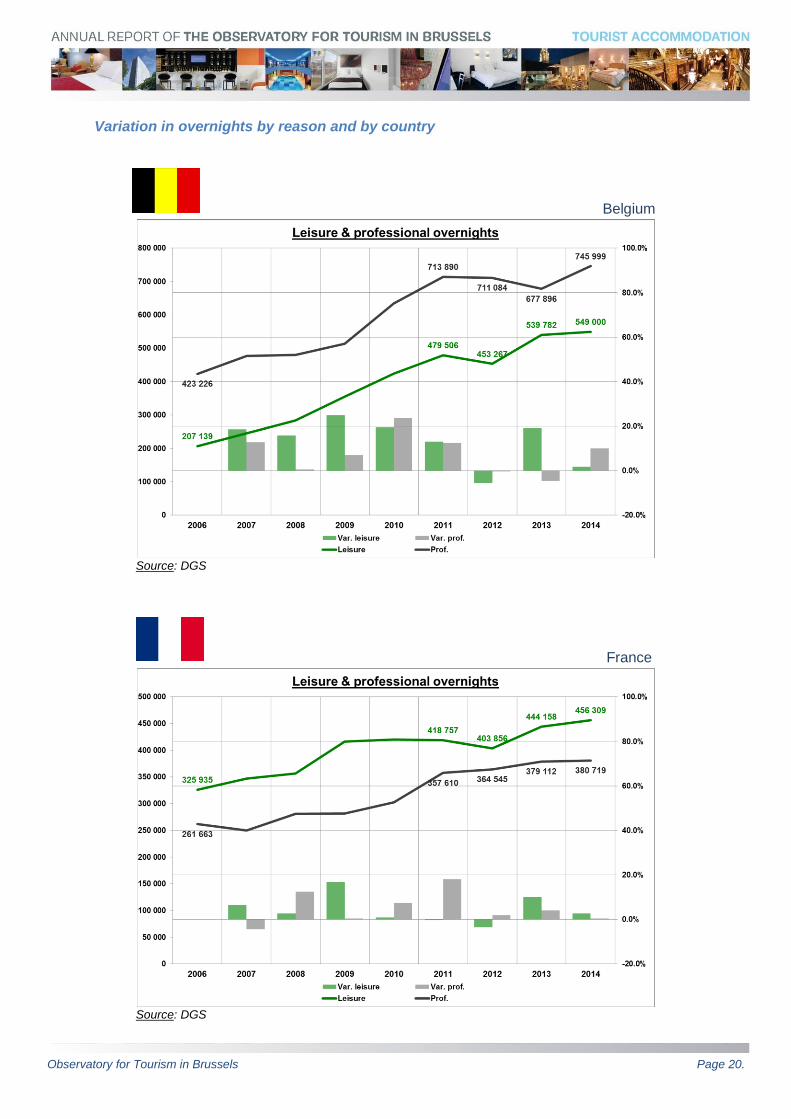
Variation in overnights by reason and by country
Belgium
Source: DGS
France
Source: DGS
Observatory for Tourism in Brussels Page 21.
United Kingdom
Source: DGS
Spain
Source: DGS
Observatory for Tourism in Brussels Page 22.
Germany
Source: DGS
United States
Source : DGS
Observatory for Tourism in Brussels Page 23.
Netherlands
Source: DGS
Italy
Source : DGS
Observatory for Tourism in Brussels Page 24.
BRIC Countries (Brazil, Russia, India and China)
Source: DGS
National comparison
Overnights in other Belgian cities
Source: DGS
Observatory for Tourism in Brussels Page 25.
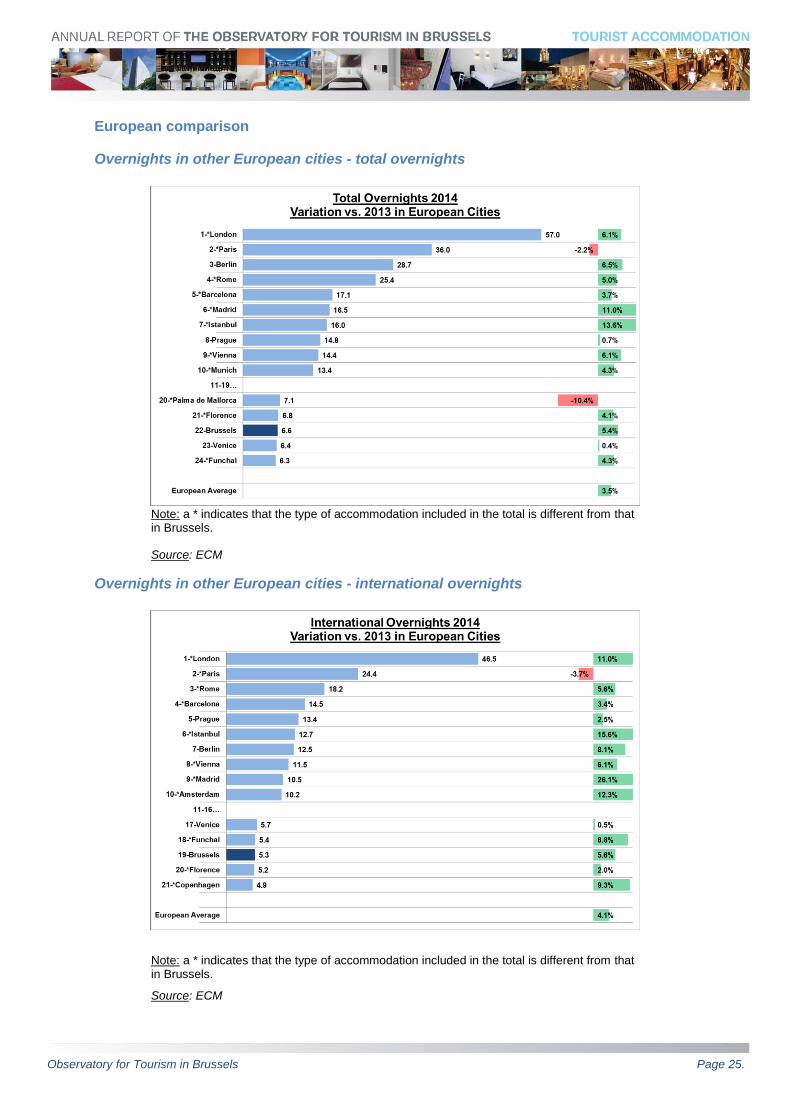
European comparison
Overnights in other European cities - total overnights
Note: a * indicates that the type of accommodation included in the total is different from that in Brussels.
Source: ECM
Overnights in other European cities - international overnights
Note: a * indicates that the type of accommodation included in the total is different from that in Brussels.
Source: ECM
Observatory for Tourism in Brussels Page 26.
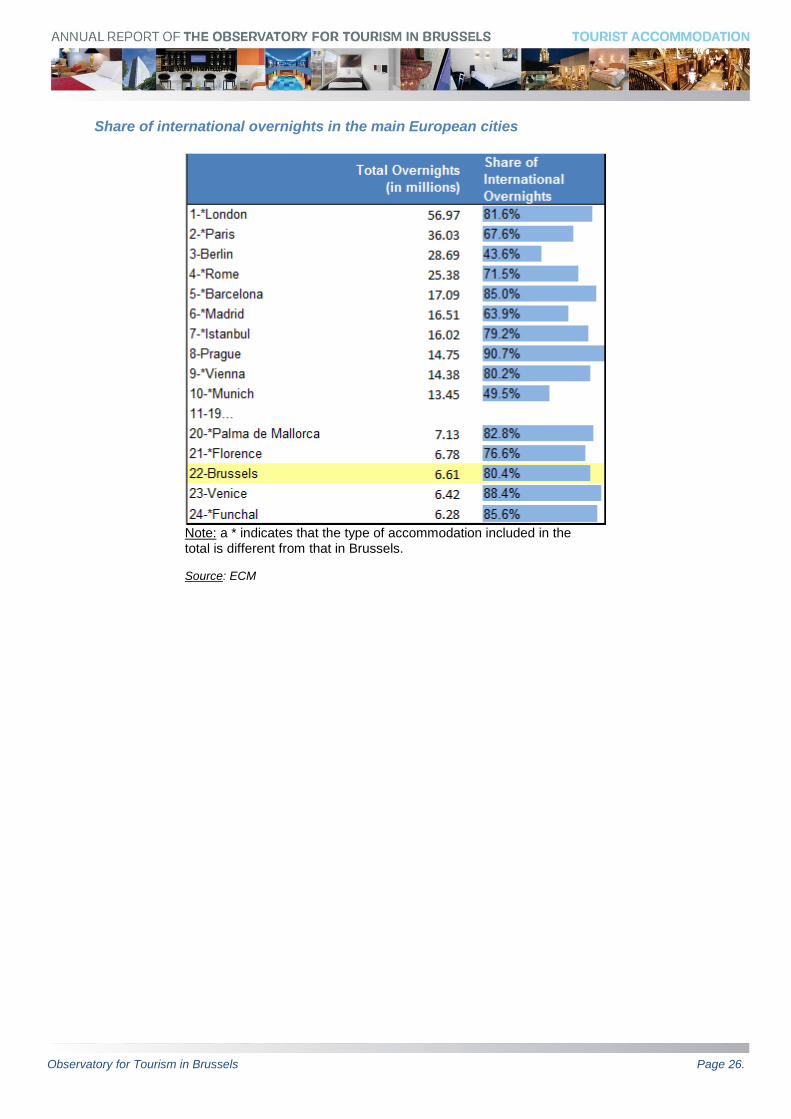
Share of international overnights in the main European cities
Note: a * indicates that the type of accommodation included in the total is different from that in Brussels.
Source: ECM
Observatory for Tourism in Brussels Page 27.
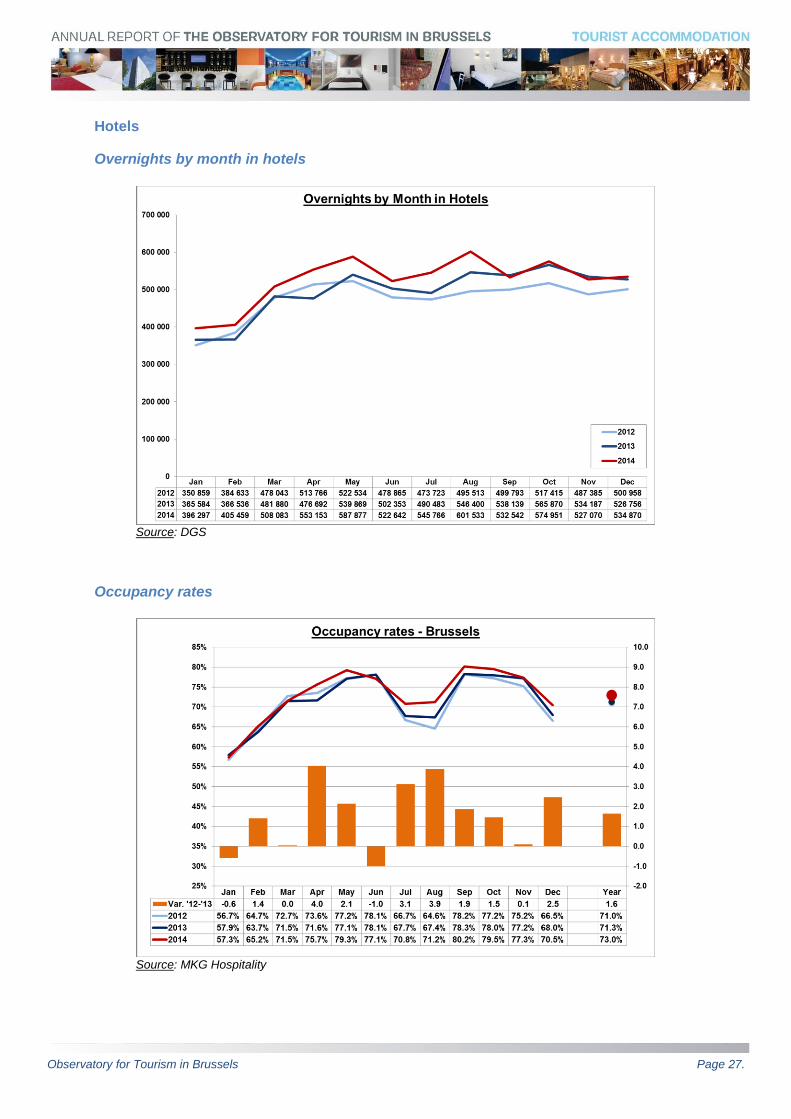
Hotels
Overnights by month in hotels
Source: DGS
Occupancy rates
Source: MKG Hospitality
Observatory for Tourism in Brussels Page 28.
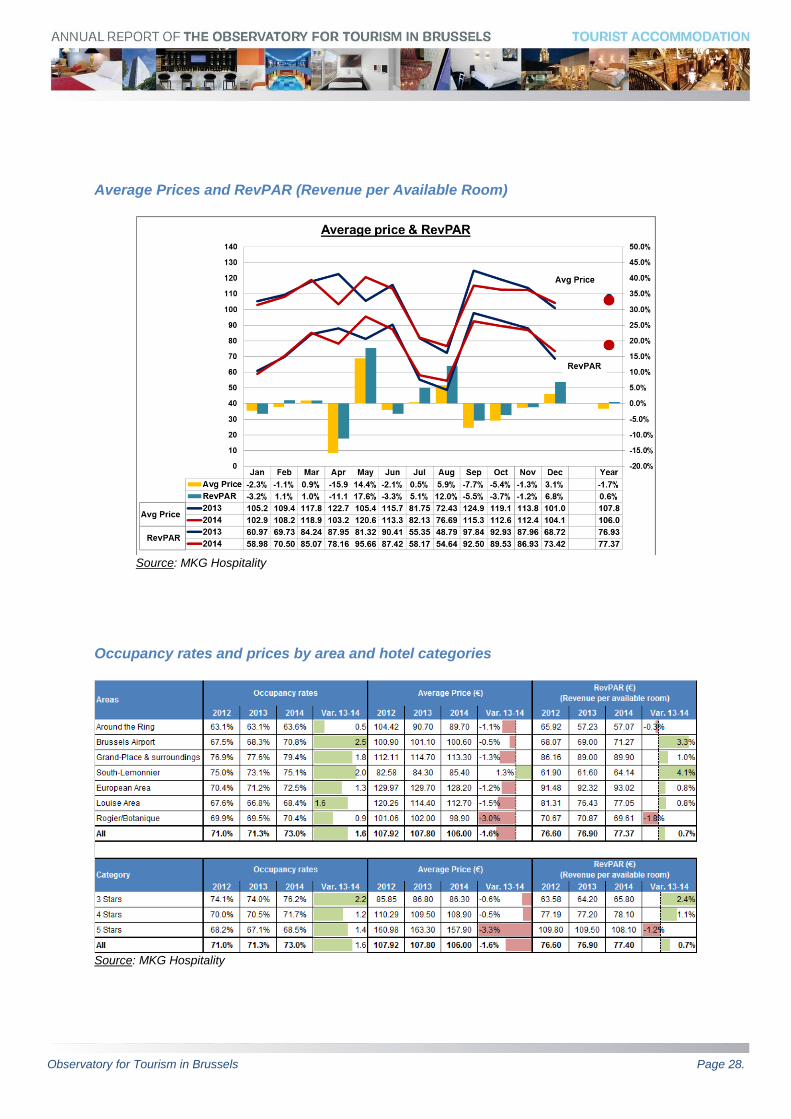
Average Prices and RevPAR (Revenue per Available Room)
Source: MKG Hospitality
Occupancy rates and prices by area and hotel categories
Source: MKG Hospitality
Observatory for Tourism in Brussels Page 29.
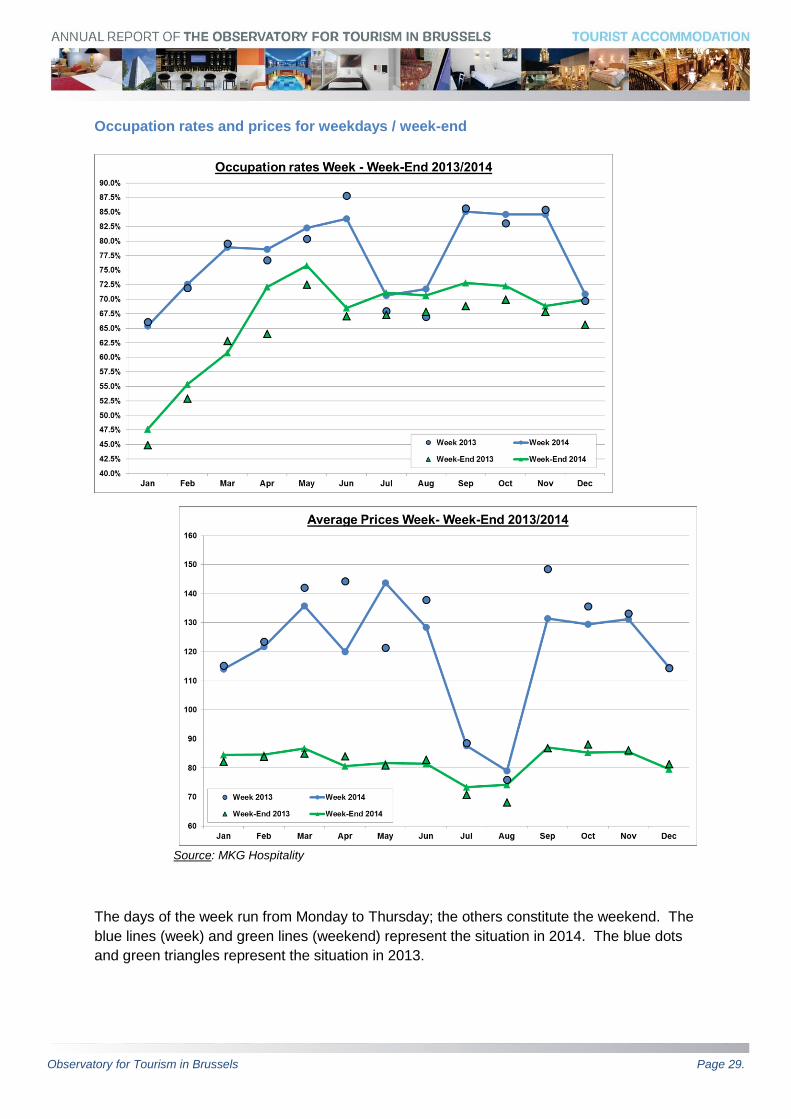
Occupation rates and prices for weekdays / week-end
Source: MKG Hospitality
The days of the week run from Monday to Thursday; the others constitute the weekend. The
blue lines (week) and green lines (weekend) represent the situation in 2014. The blue dots
and green triangles represent the situation in 2013.
Observatory for Tourism in Brussels Page 30.
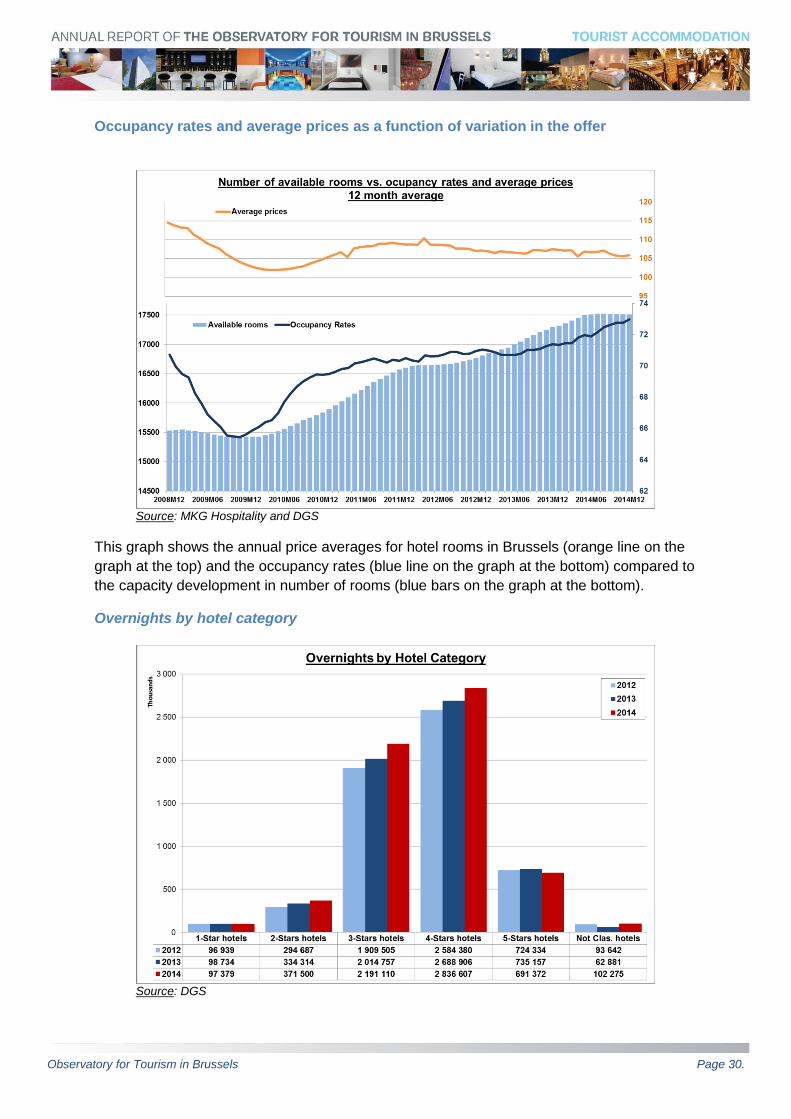
Occupancy rates and average prices as a function of variation in the offer
Source: MKG Hospitality and DGS
This graph shows the annual price averages for hotel rooms in Brussels (orange line on the
graph at the top) and the occupancy rates (blue line on the graph at the bottom) compared to
the capacity development in number of rooms (blue bars on the graph at the bottom).
Overnights by hotel category
Source: DGS
Observatory for Tourism in Brussels Page 31.
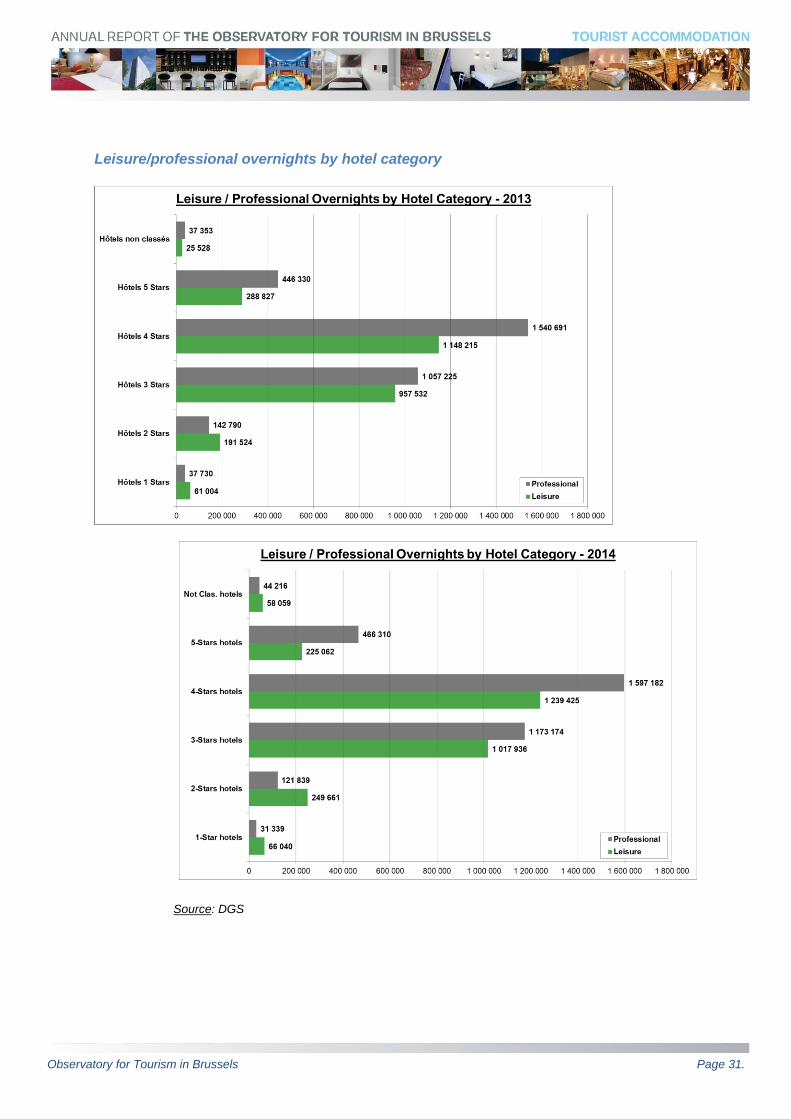
Leisure/professional overnights by hotel category
Source: DGS
Observatory for Tourism in Brussels Page 32.
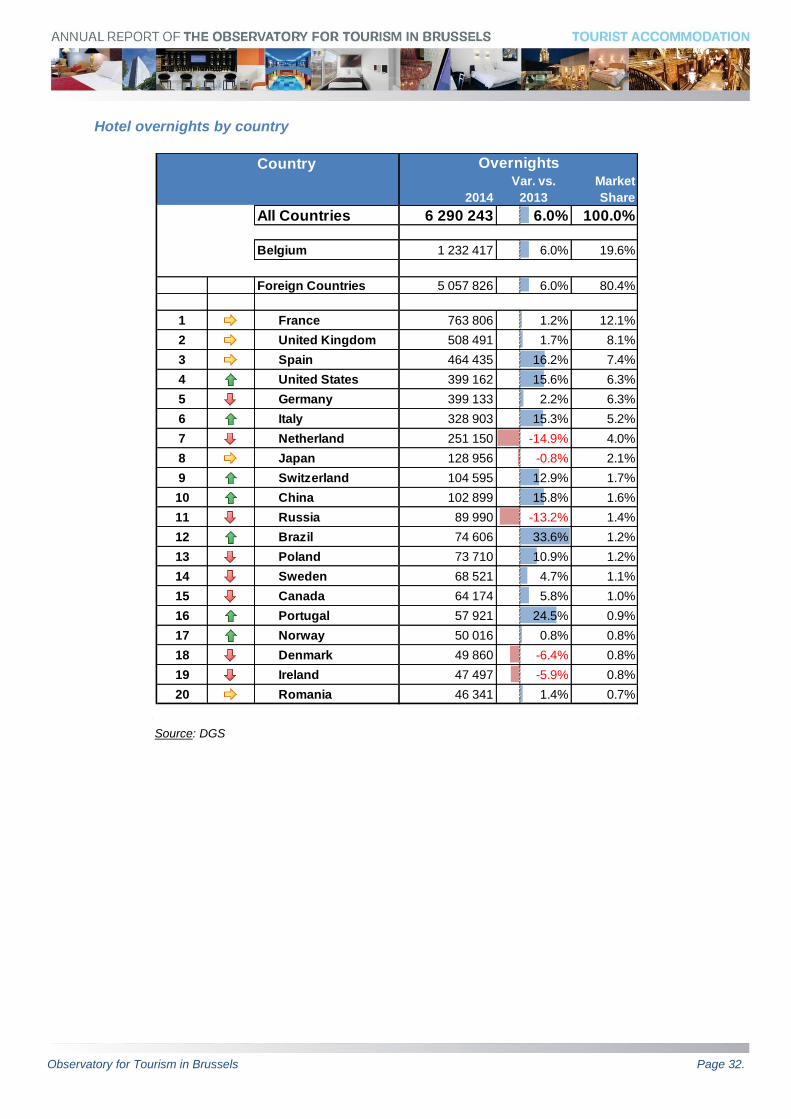
Hotel overnights by country
Source: DGS
Country
2014
Var. vs.
2013
Market
Share
All Countries 6 290 243 6.0% 100.0%
Belgium 1 232 417 6.0% 19.6%
Foreign Countries 5 057 826 6.0% 80.4%
1 France 763 806 1.2% 12.1%
2 United Kingdom 508 491 1.7% 8.1%
3 Spain 464 435 16.2% 7.4%
4 United States 399 162 15.6% 6.3%
5 Germany 399 133 2.2% 6.3%
6 Italy 328 903 15.3% 5.2%
7 Netherland 251 150 -14.9% 4.0%
8 Japan 128 956 -0.8% 2.1%
9 Switzerland 104 595 12.9% 1.7%
10 China 102 899 15.8% 1.6%
11 Russia 89 990 -13.2% 1.4%
12 Brazil 74 606 33.6% 1.2%
13 Poland 73 710 10.9% 1.2%
14 Sweden 68 521 4.7% 1.1%
15 Canada 64 174 5.8% 1.0%
16 Portugal 57 921 24.5% 0.9%
17 Norway 50 016 0.8% 0.8%
18 Denmark 49 860 -6.4% 0.8%
19 Ireland 47 497 -5.9% 0.8%
20 Romania 46 341 1.4% 0.7%
Overnights
Observatory for Tourism in Brussels Page 33.
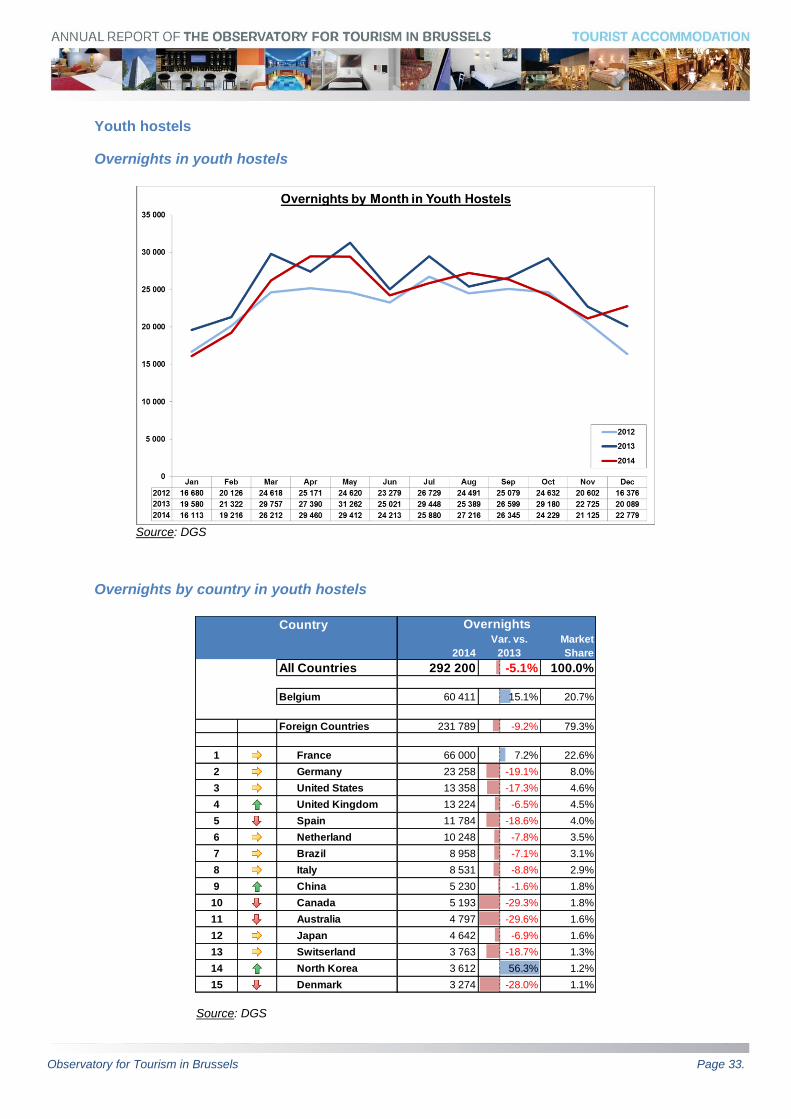
Youth hostels
Overnights in youth hostels
Source: DGS
Overnights by country in youth hostels
Source: DGS
Country
2014
Var. vs.
2013
Market
Share
All Countries 292 200 -5.1% 100.0%
Belgium 60 411 15.1% 20.7%
Foreign Countries 231 789 -9.2% 79.3%
1 France 66 000 7.2% 22.6%
2 Germany 23 258 -19.1% 8.0%
3 United States 13 358 -17.3% 4.6%
4 United Kingdom 13 224 -6.5% 4.5%
5 Spain 11 784 -18.6% 4.0%
6 Netherland 10 248 -7.8% 3.5%
7 Brazil 8 958 -7.1% 3.1%
8 Italy 8 531 -8.8% 2.9%
9 China 5 230 -1.6% 1.8%
10 Canada 5 193 -29.3% 1.8%
11 Australia 4 797 -29.6% 1.6%
12 Japan 4 642 -6.9% 1.6%
13 Switserland 3 763 -18.7% 1.3%
14 North Korea 3 612 56.3% 1.2%
15 Denmark 3 274 -28.0% 1.1%
Overnights
Observatory for Tourism in Brussels Page 34.
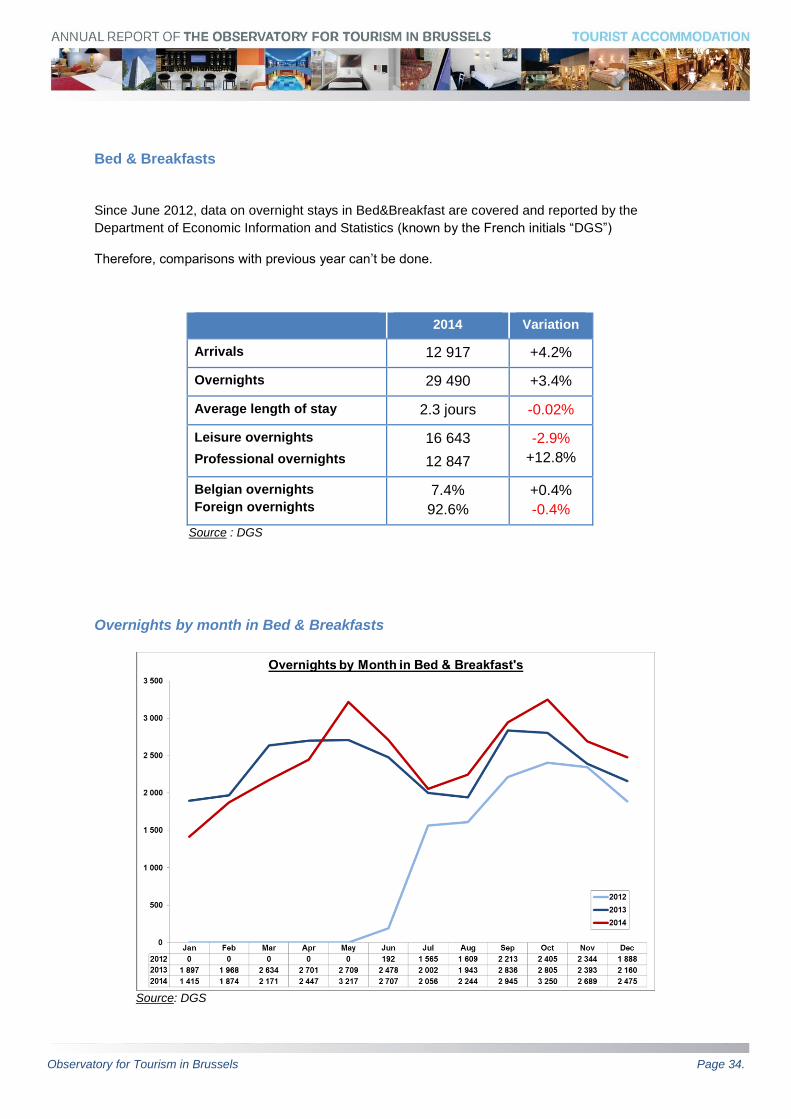
Bed & Breakfasts
Since June 2012, data on overnight stays in Bed&Breakfast are covered and reported by the
Department of Economic Information and Statistics (known by the French initials “DGS”)
Therefore, comparisons with previous year can’t be done.
2014 Variation
Arrivals 12 917 +4.2%
Overnights 29 490 +3.4%
Average length of stay 2.3 jours -0.02%
Leisure overnights
Professional overnights
16 643
12 847
-2.9%
+12.8%
Belgian overnights
Foreign overnights
7.4%
92.6%
+0.4%
-0.4%
Source : DGS
Overnights by month in Bed & Breakfasts
Source: DGS
Observatory for Tourism in Brussels Page 35.
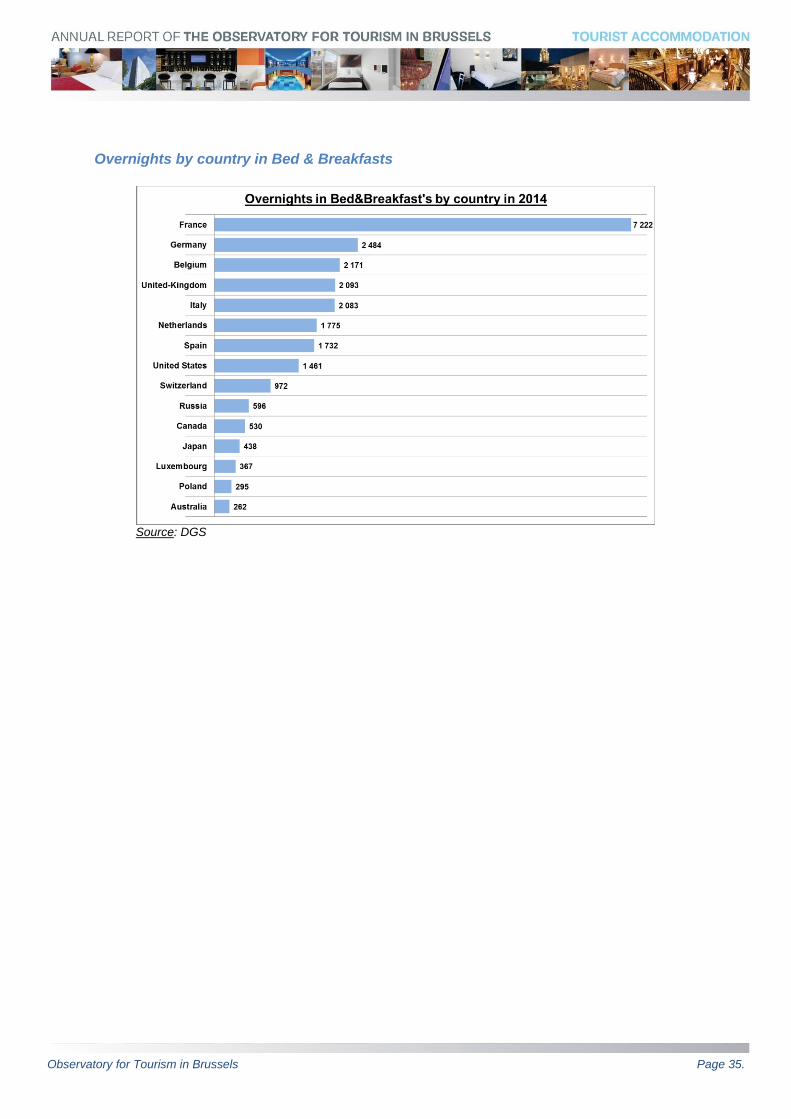
Overnights by country in Bed & Breakfasts
Source: DGS
Observatory for Tourism in Brussels Page 36.
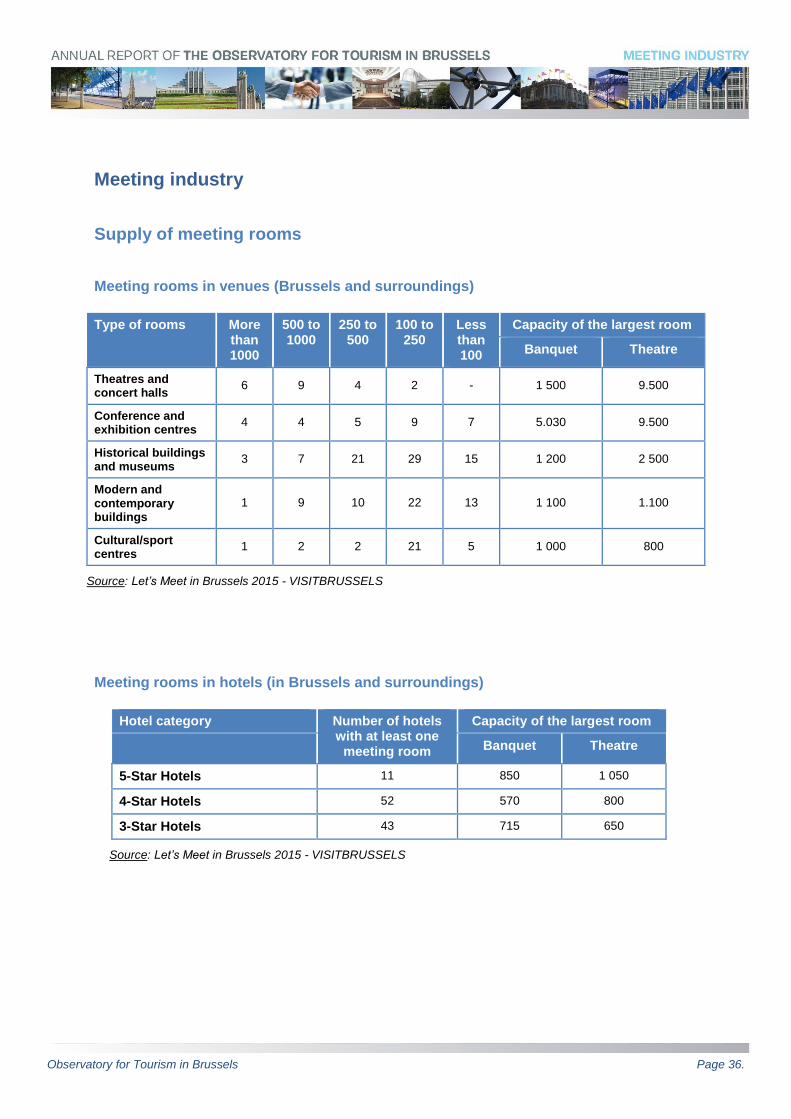
Meeting industry
Supply of meeting rooms
Meeting rooms in venues (Brussels and surroundings)
Type of rooms More than 1000
500 to 1000
250 to 500
100 to 250
Less than 100
Capacity of the largest room
Banquet Theatre
Theatres and concert halls
6 9 4 2 - 1 500 9.500
Conference and exhibition centres
4 4 5 9 7 5.030 9.500
Historical buildings and museums
3 7 21 29 15 1 200 2 500
Modern and contemporary buildings
1 9 10 22 13 1 100 1.100
Cultural/sport centres
1 2 2 21 5 1 000 800
Source: Let’s Meet in Brussels 2015 - VISITBRUSSELS
Meeting rooms in hotels (in Brussels and surroundings)
Hotel category Number of hotels with at least one
meeting room
Capacity of the largest room
Banquet Theatre
5-Star Hotels 11 850 1 050
4-Star Hotels 52 570 800
3-Star Hotels 43 715 650
Source: Let’s Meet in Brussels 2015 - VISITBRUSSELS
Observatory for Tourism in Brussels Page 37.
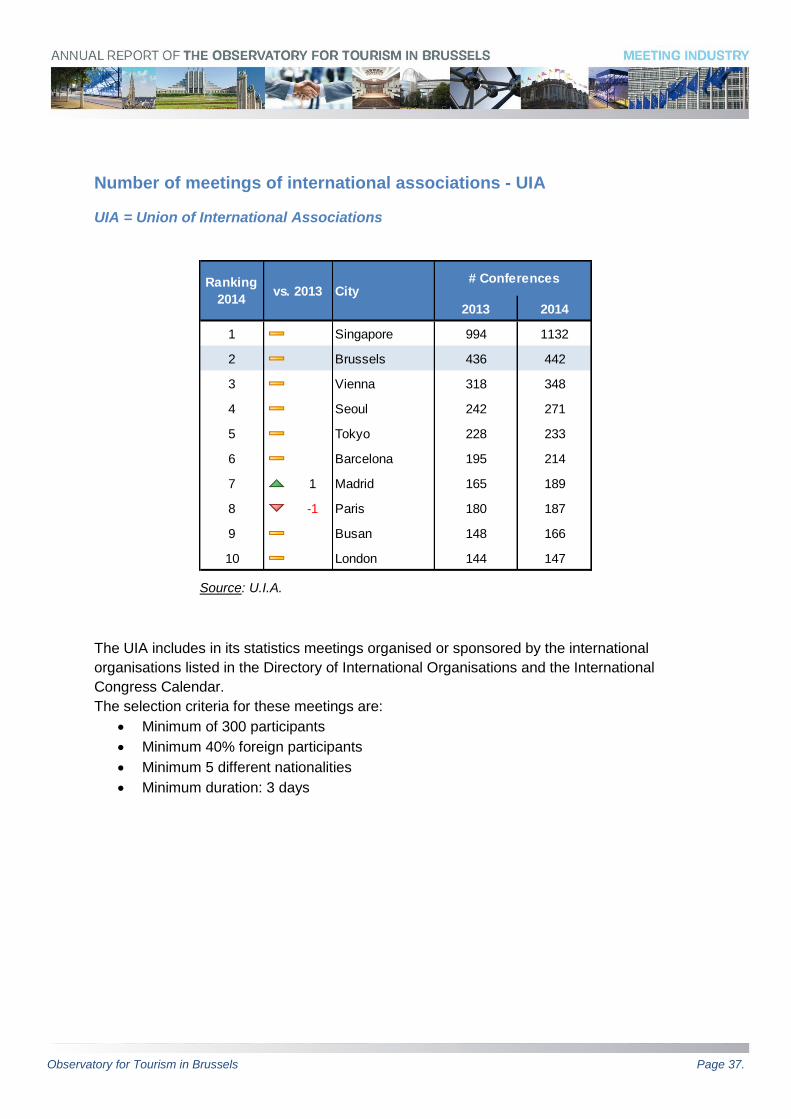
Number of meetings of international associations - UIA
UIA = Union of International Associations
Source: U.I.A.
The UIA includes in its statistics meetings organised or sponsored by the international
organisations listed in the Directory of International Organisations and the International
Congress Calendar.
The selection criteria for these meetings are:
Minimum of 300 participants
Minimum 40% foreign participants
Minimum 5 different nationalities
Minimum duration: 3 days
2013 2014
1 Singapore 994 1132
2 Brussels 436 442
3 Vienna 318 348
4 Seoul 242 271
5 Tokyo 228 233
6 Barcelona 195 214
7 1 Madrid 165 189
8 -1 Paris 180 187
9 Busan 148 166
10 London 144 147
Ranking
2014vs. 2013 City
# Conferences
Observatory for Tourism in Brussels Page 38.
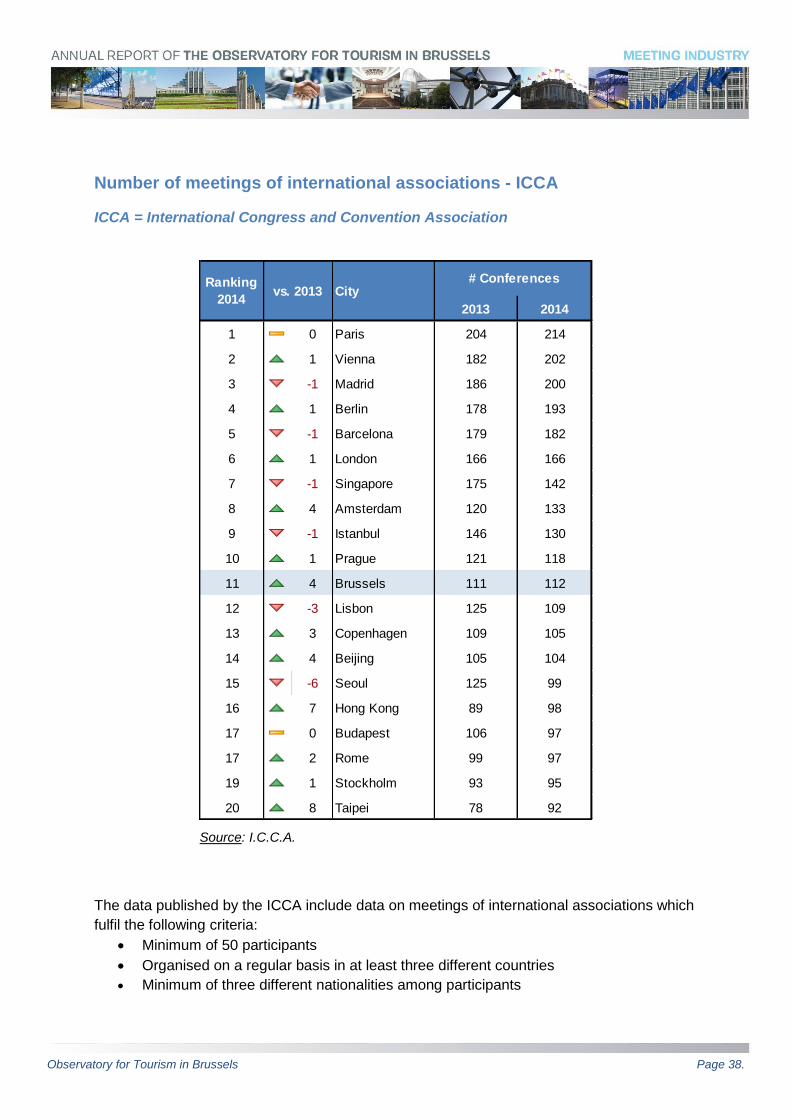
Number of meetings of international associations - ICCA
ICCA = International Congress and Convention Association
Source: I.C.C.A.
The data published by the ICCA include data on meetings of international associations which
fulfil the following criteria:
Minimum of 50 participants
Organised on a regular basis in at least three different countries
Minimum of three different nationalities among participants
2013 2014
1 0 Paris 204 214
2 1 Vienna 182 202
3 -1 Madrid 186 200
4 1 Berlin 178 193
5 -1 Barcelona 179 182
6 1 London 166 166
7 -1 Singapore 175 142
8 4 Amsterdam 120 133
9 -1 Istanbul 146 130
10 1 Prague 121 118
11 4 Brussels 111 112
12 -3 Lisbon 125 109
13 3 Copenhagen 109 105
14 4 Beijing 105 104
15 -6 Seoul 125 99
16 7 Hong Kong 89 98
17 0 Budapest 106 97
17 2 Rome 99 97
19 1 Stockholm 93 95
20 8 Taipei 78 92
Ranking
2014vs. 2013 City
# Conferences
Observatory for Tourism in Brussels Page 39.
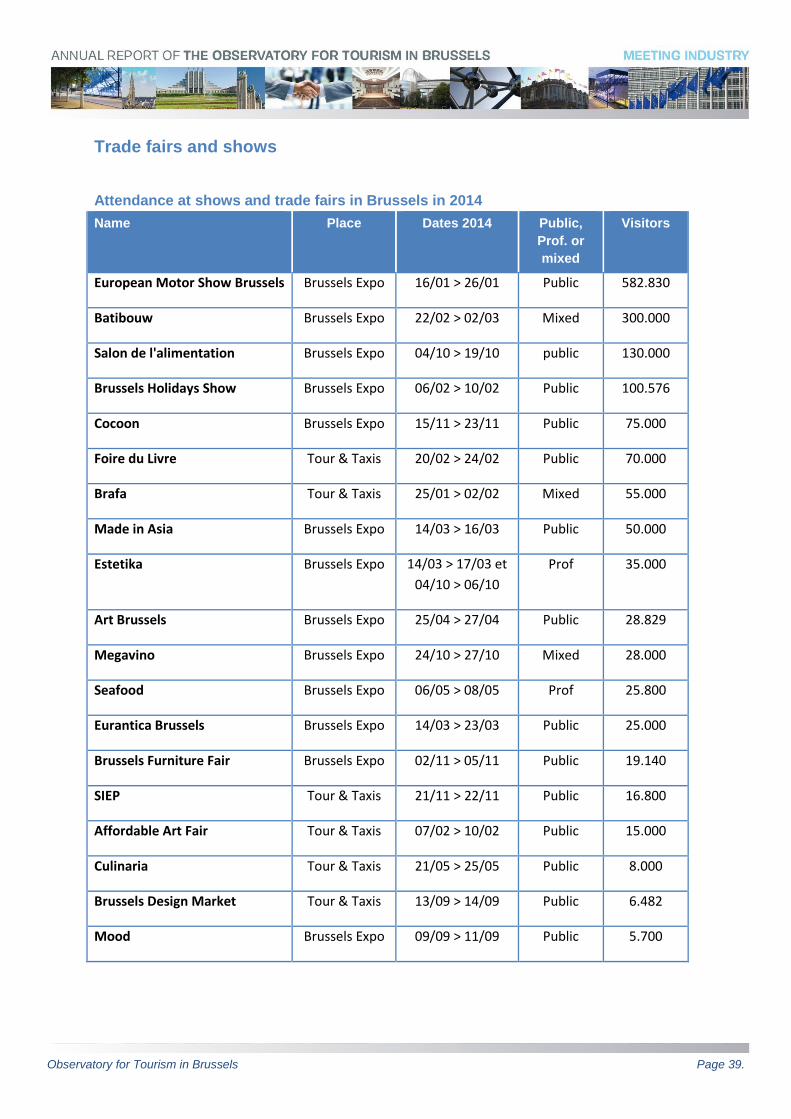
Trade fairs and shows
Attendance at shows and trade fairs in Brussels in 2014
Name Place Dates 2014 Public,
Prof. or
mixed
Visitors
European Motor Show Brussels Brussels Expo 16/01 > 26/01 Public 582.830
Batibouw Brussels Expo 22/02 > 02/03 Mixed 300.000
Salon de l'alimentation Brussels Expo 04/10 > 19/10 public 130.000
Brussels Holidays Show Brussels Expo 06/02 > 10/02 Public 100.576
Cocoon Brussels Expo 15/11 > 23/11 Public 75.000
Foire du Livre Tour & Taxis 20/02 > 24/02 Public 70.000
Brafa Tour & Taxis 25/01 > 02/02 Mixed 55.000
Made in Asia Brussels Expo 14/03 > 16/03 Public 50.000
Estetika Brussels Expo 14/03 > 17/03 et
04/10 > 06/10
Prof 35.000
Art Brussels Brussels Expo 25/04 > 27/04 Public 28.829
Megavino Brussels Expo 24/10 > 27/10 Mixed 28.000
Seafood Brussels Expo 06/05 > 08/05 Prof 25.800
Eurantica Brussels Brussels Expo 14/03 > 23/03 Public 25.000
Brussels Furniture Fair Brussels Expo 02/11 > 05/11 Public 19.140
SIEP Tour & Taxis 21/11 > 22/11 Public 16.800
Affordable Art Fair Tour & Taxis 07/02 > 10/02 Public 15.000
Culinaria Tour & Taxis 21/05 > 25/05 Public 8.000
Brussels Design Market Tour & Taxis 13/09 > 14/09 Public 6.482
Mood Brussels Expo 09/09 > 11/09 Public 5.700
Observatory for Tourism in Brussels Page 40.
Cultural tourist services
Cultural offer in museums and tourist attractions
In 2014, Brussels had 109 museums (opening of the Belgian Chocolate Village), four
attractions and one multicultural centre.
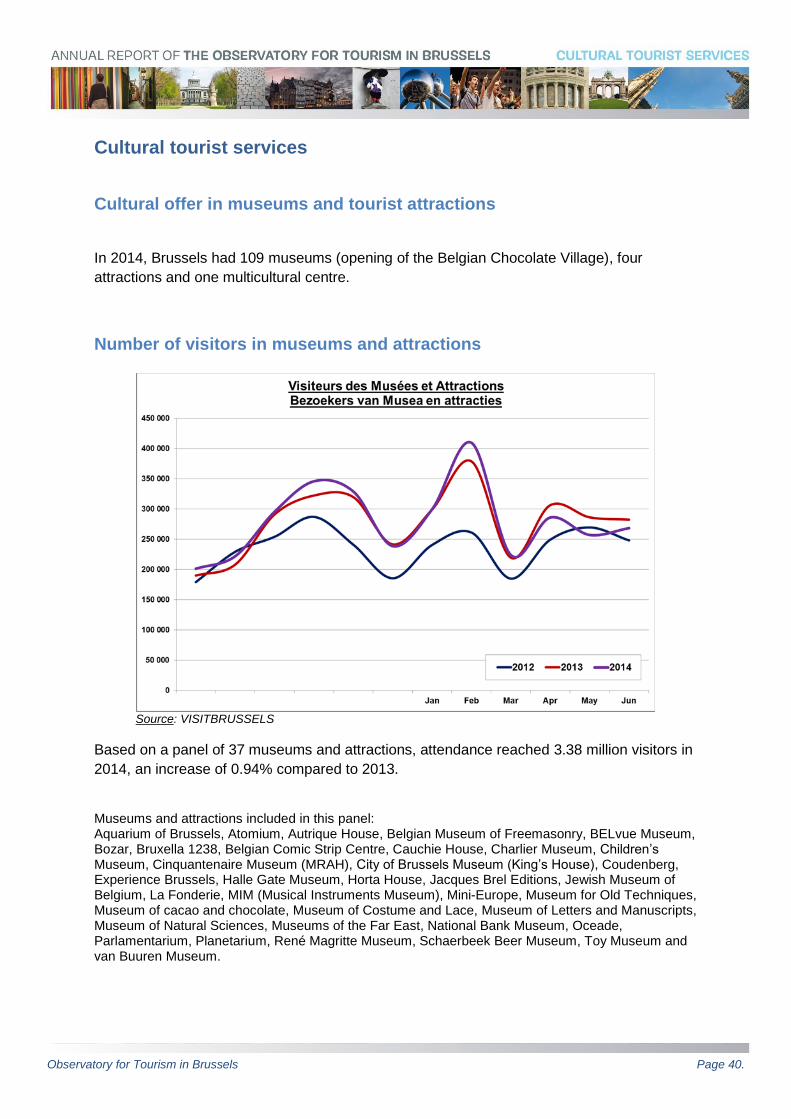
Number of visitors in museums and attractions
Source: VISITBRUSSELS
Based on a panel of 37 museums and attractions, attendance reached 3.38 million visitors in
2014, an increase of 0.94% compared to 2013.
Museums and attractions included in this panel: Aquarium of Brussels, Atomium, Autrique House, Belgian Museum of Freemasonry, BELvue Museum, Bozar, Bruxella 1238, Belgian Comic Strip Centre, Cauchie House, Charlier Museum, Children’s Museum, Cinquantenaire Museum (MRAH), City of Brussels Museum (King’s House), Coudenberg, Experience Brussels, Halle Gate Museum, Horta House, Jacques Brel Editions, Jewish Museum of Belgium, La Fonderie, MIM (Musical Instruments Museum), Mini-Europe, Museum for Old Techniques, Museum of cacao and chocolate, Museum of Costume and Lace, Museum of Letters and Manuscripts, Museum of Natural Sciences, Museums of the Far East, National Bank Museum, Oceade, Parlamentarium, Planetarium, René Magritte Museum, Schaerbeek Beer Museum, Toy Museum and van Buuren Museum.
Observatory for Tourism in Brussels Page 41.
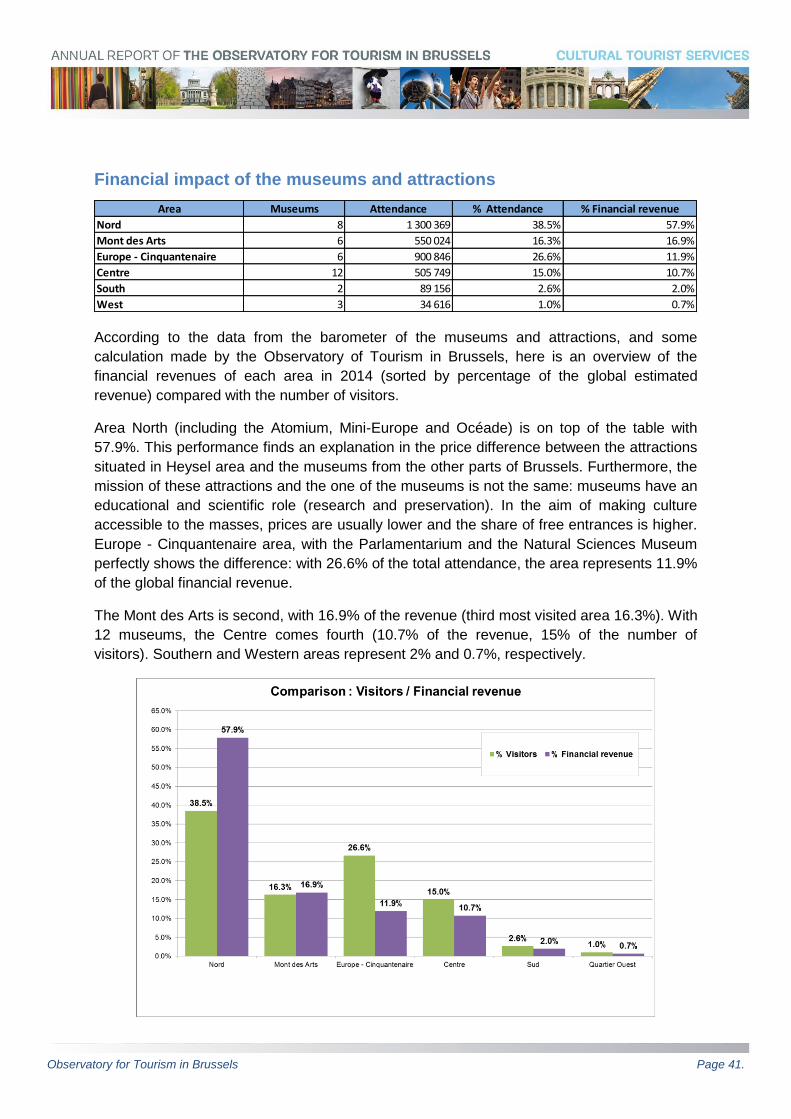
Financial impact of the museums and attractions
According to the data from the barometer of the museums and attractions, and some
calculation made by the Observatory of Tourism in Brussels, here is an overview of the
financial revenues of each area in 2014 (sorted by percentage of the global estimated
revenue) compared with the number of visitors.
Area North (including the Atomium, Mini-Europe and Océade) is on top of the table with
57.9%. This performance finds an explanation in the price difference between the attractions
situated in Heysel area and the museums from the other parts of Brussels. Furthermore, the
mission of these attractions and the one of the museums is not the same: museums have an
educational and scientific role (research and preservation). In the aim of making culture
accessible to the masses, prices are usually lower and the share of free entrances is higher.
Europe - Cinquantenaire area, with the Parlamentarium and the Natural Sciences Museum
perfectly shows the difference: with 26.6% of the total attendance, the area represents 11.9%
of the global financial revenue.
The Mont des Arts is second, with 16.9% of the revenue (third most visited area 16.3%). With
12 museums, the Centre comes fourth (10.7% of the revenue, 15% of the number of
visitors). Southern and Western areas represent 2% and 0.7%, respectively.
Area Museums Attendance % Attendance % Financial revenue
Nord 8 1 300 369 38.5% 57.9%
Mont des Arts 6 550 024 16.3% 16.9%
Europe - Cinquantenaire 6 900 846 26.6% 11.9%
Centre 12 505 749 15.0% 10.7%
South 2 89 156 2.6% 2.0%
West 3 34 616 1.0% 0.7%
Observatory for Tourism in Brussels Page 42.
Guided tours and Greeters
In 2011-2012, Charlotte Raymond, a student at IGEAT, conducted an in-depth study on the
guided tour sector in Brussels from a supply and demand perspective.
Here are the main conclusions:
- Seventy-two organisations offer guided tours in Brussels.
- Approximately 14,000 tours were conducted in 2011.
- These tours accommodated more than 290,000 people.
- Belgians were the most heavily represented (around 70%), followed by the French,
English, German and Dutch.
The Greeters are volunteer inhabitants who love Brussels and take the time to share with
visitors their favourite places, good plans and vision of Brussels. The Greeters help visitors
discover different facets of Brussels, ranging from the exploration of a neighbourhood to
trying a local beer, to green strolls or little known sites. The emphasis is on authenticity and
cultural exchange.
At the end of 2014, the Greeters’ network boasted some one hundred members capable of
welcoming visitors in 11 languages.
They welcomed 1,950 people on 824 occasions, up by 19% from 2013. The most important
markets were France (32%), Belgium (19%), Spain (12%), the United States (11%), Italy
(6%) and Germany (6%).
Observatory for Tourism in Brussels Page 43.
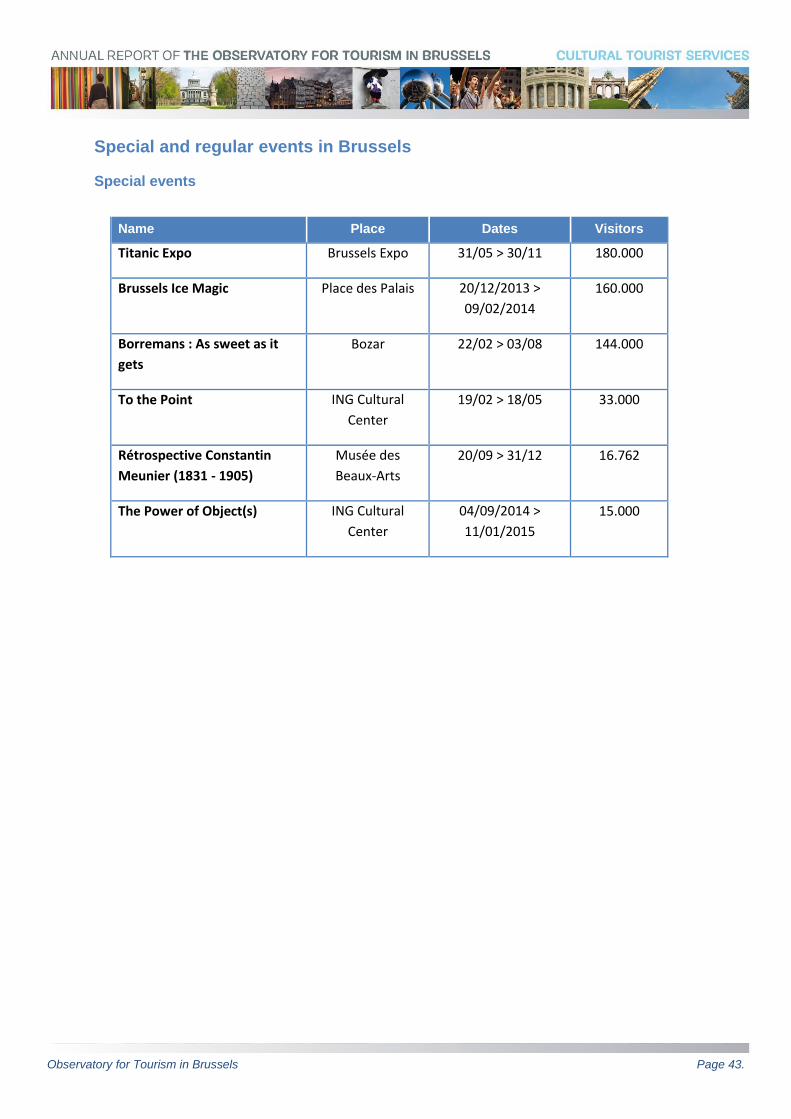
Special and regular events in Brussels
Special events
Name Place Dates Visitors
Titanic Expo Brussels Expo 31/05 > 30/11 180.000
Brussels Ice Magic Place des Palais 20/12/2013 >
09/02/2014
160.000
Borremans : As sweet as it
gets
Bozar 22/02 > 03/08 144.000
To the Point ING Cultural
Center
19/02 > 18/05 33.000
Rétrospective Constantin
Meunier (1831 - 1905)
Musée des
Beaux-Arts
20/09 > 31/12 16.762
The Power of Object(s) ING Cultural
Center
04/09/2014 >
11/01/2015
15.000
Observatory for Tourism in Brussels Page 44.
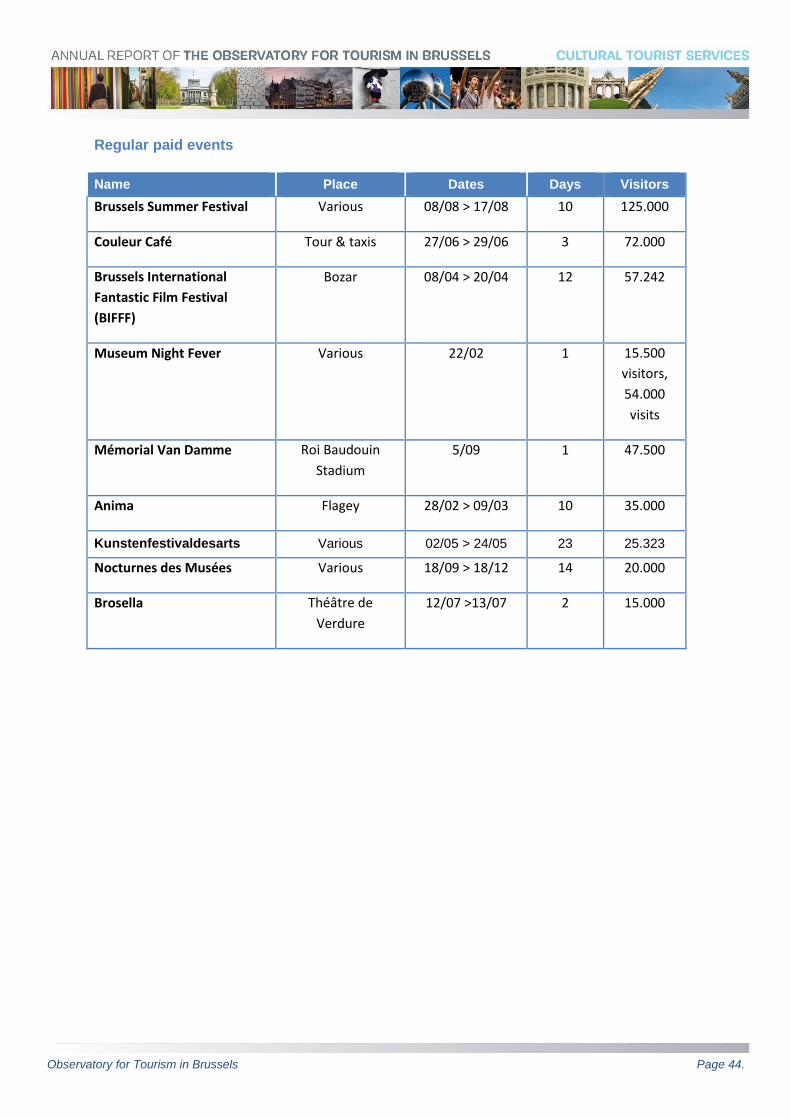
Regular paid events
Name Place Dates Days Visitors
Brussels Summer Festival Various 08/08 > 17/08 10 125.000
Couleur Café Tour & taxis 27/06 > 29/06 3 72.000
Brussels International
Fantastic Film Festival
(BIFFF)
Bozar 08/04 > 20/04 12 57.242
Museum Night Fever Various 22/02 1 15.500
visitors,
54.000
visits
Mémorial Van Damme Roi Baudouin
Stadium
5/09 1 47.500
Anima Flagey 28/02 > 09/03 10 35.000
Kunstenfestivaldesarts Various 02/05 > 24/05 23 25.323
Nocturnes des Musées Various 18/09 > 18/12 14 20.000
Brosella Théâtre de
Verdure
12/07 >13/07 2 15.000
Observatory for Tourism in Brussels Page 45.
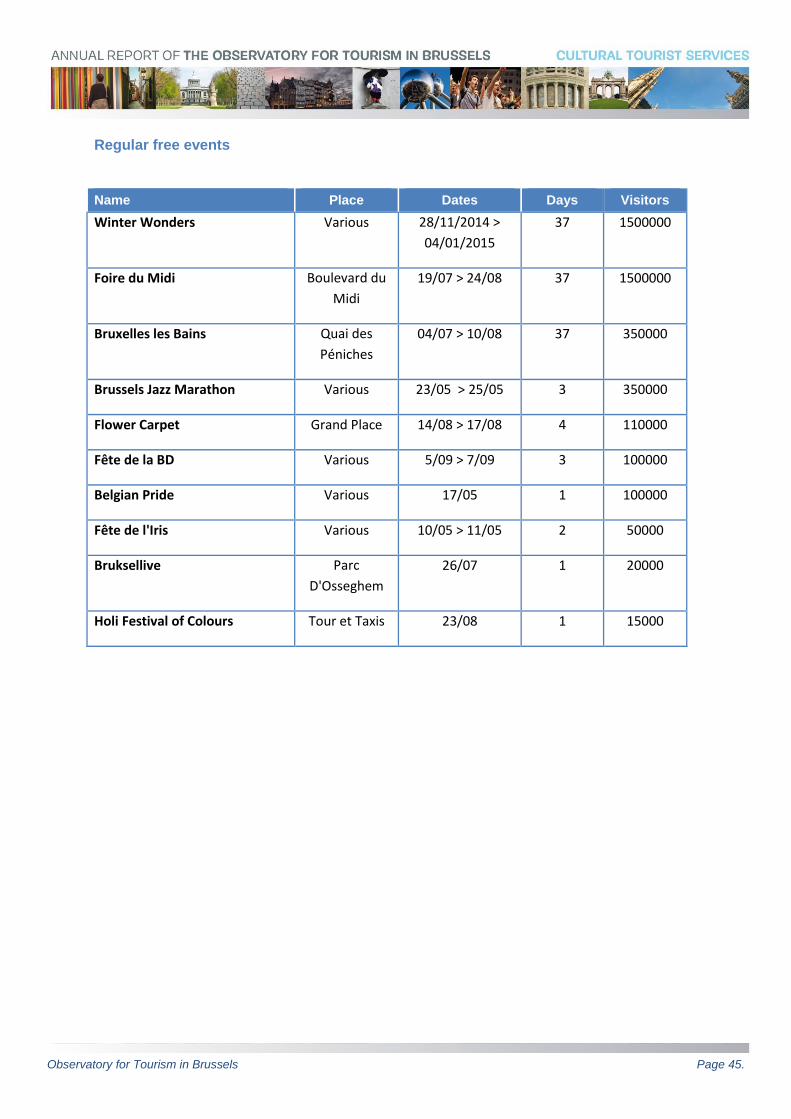
Regular free events
Name Place Dates Days Visitors
Winter Wonders Various 28/11/2014 >
04/01/2015
37 1500000
Foire du Midi Boulevard du
Midi
19/07 > 24/08 37 1500000
Bruxelles les Bains Quai des
Péniches
04/07 > 10/08 37 350000
Brussels Jazz Marathon Various 23/05 > 25/05 3 350000
Flower Carpet Grand Place 14/08 > 17/08 4 110000
Fête de la BD Various 5/09 > 7/09 3 100000
Belgian Pride Various 17/05 1 100000
Fête de l'Iris Various 10/05 > 11/05 2 50000
Bruksellive Parc
D'Osseghem
26/07 1 20000
Holi Festival of Colours Tour et Taxis 23/08 1 15000
Observatory for Tourism in Brussels Page 46.
Transport
Airports
Number of passengers in the airports
Source: Brussels Airport / Brussels South Charleroi Airport
Observatory for Tourism in Brussels Page 47.
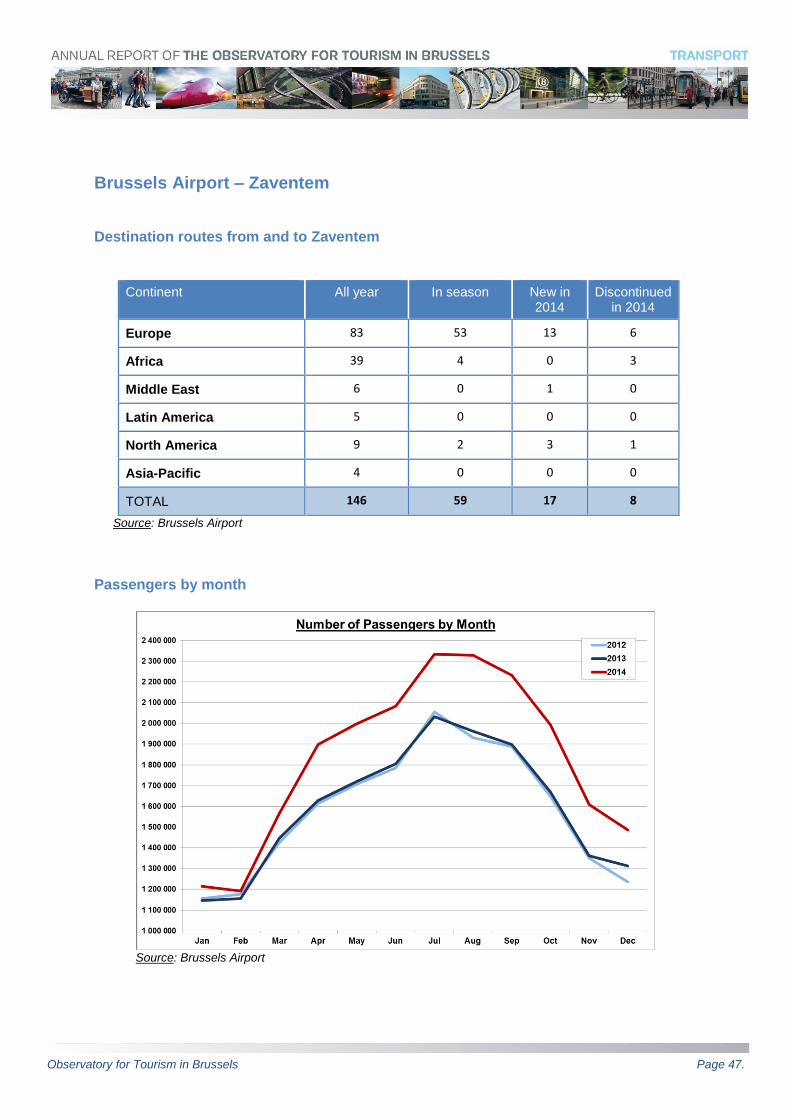
Brussels Airport – Zaventem
Destination routes from and to Zaventem
Continent All year In season New in 2014
Discontinued in 2014
Europe 83 53 13 6
Africa 39 4 0 3
Middle East 6 0 1 0
Latin America 5 0 0 0
North America 9 2 3 1
Asia-Pacific 4 0 0 0
TOTAL 146 59 17 8
Source: Brussels Airport
Passengers by month
Source: Brussels Airport
Observatory for Tourism in Brussels Page 48.
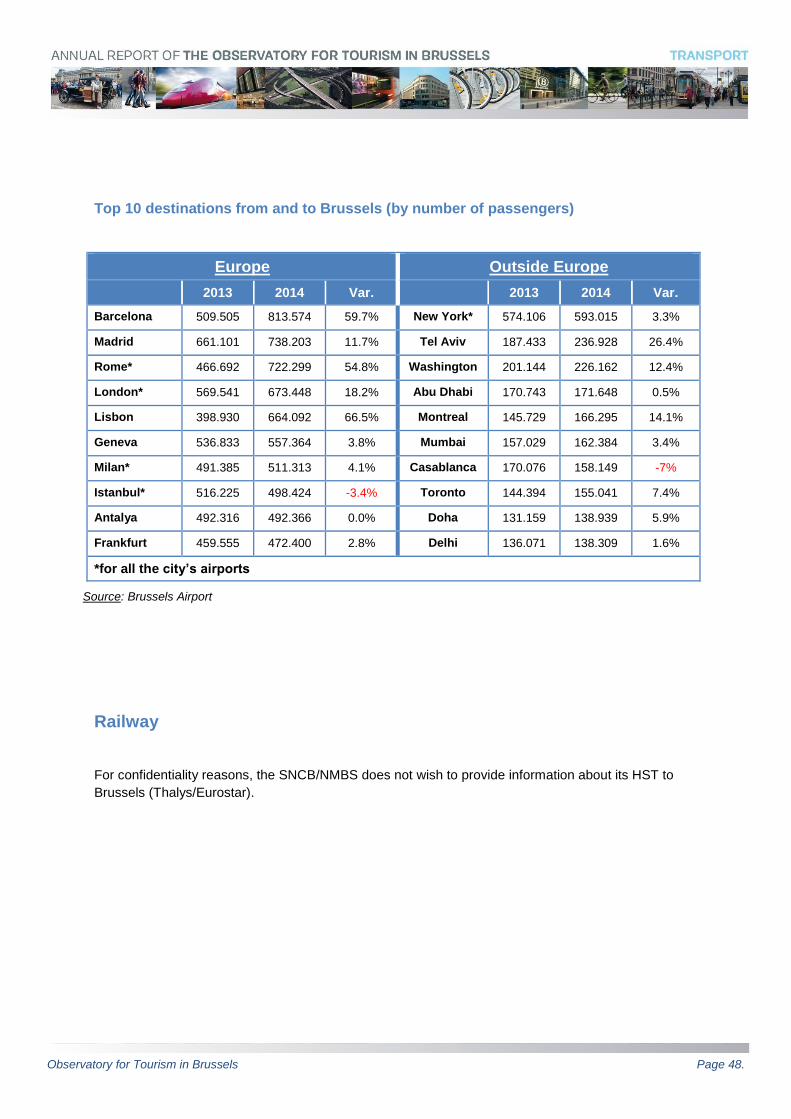
Top 10 destinations from and to Brussels (by number of passengers)
Europe Outside Europe
2013 2014 Var. 2013 2014 Var.
Barcelona 509.505 813.574 59.7% New York* 574.106 593.015 3.3%
Madrid 661.101 738.203 11.7% Tel Aviv 187.433 236.928 26.4%
Rome* 466.692 722.299 54.8% Washington 201.144 226.162 12.4%
London* 569.541 673.448 18.2% Abu Dhabi 170.743 171.648 0.5%
Lisbon 398.930 664.092 66.5% Montreal 145.729 166.295 14.1%
Geneva 536.833 557.364 3.8% Mumbai 157.029 162.384 3.4%
Milan* 491.385 511.313 4.1% Casablanca 170.076 158.149 -7%
Istanbul* 516.225 498.424 -3.4% Toronto 144.394 155.041 7.4%
Antalya 492.316 492.366 0.0% Doha 131.159 138.939 5.9%
Frankfurt 459.555 472.400 2.8% Delhi 136.071 138.309 1.6%
*for all the city’s airports
Source: Brussels Airport
Railway
For confidentiality reasons, the SNCB/NMBS does not wish to provide information about its HST to
Brussels (Thalys/Eurostar).
Observatory for Tourism in Brussels Page 49.
Sustainable tourism
The winning assets of Brussels on the sustainability front
• Density of high speed train and air links for international transport
• Recognition of establishments distinguished by the quality of their environmental
management (eco labels, environmental certification).
• Attention paid to participatory tourism.
• A city accessible to persons with reduced mobility: Brussels for All.
• A green Region: more than 8000 hectares of Green space.
• The constant and progressive greening of the Region initiated in the mid 1990s, with
the development of “green continuities” that integrate green areas and biological
corridors in the public space.
• Incentive policies for the greening of walls and roofs.
• Remarkable strolling spaces such as the 63-kilometre long “Green Promenade,”
Soignes Forest which covers some 5000 hectares, a constantly expanding network of
cycling paths, a network of Long Hiking trails, a plethora of parks, etc.
• Pioneering participation in the « Réseau Vert EuRopéen » (REVER) [European
Green Network], the “Réseau Véloroute [Cycling Network] and the Voie Verte [Green
Way].
• A rich biodiversity to preserve: nearly 800 species of plants and 45 mammals,
including 17 bats, 92 nesting birds, etc.
• A population of bees that is doing well and is making honey of excellent quality.
Observatory for Tourism in Brussels Page 50.
The Eco-Labels
Four types of eco labels are distinguished in the Observatory’s report:
The Green Key International Label
The “green Key” is an international eco-label chosen today by over 2100 tourism
infrastructures in 41 countries worldwide.
It is awarded annually to tourism facilities, hotels, bed and breakfasts, youth hotels,
camp sites, conference centres and attractions, based on evaluation criteria rating
overall environmental management, waste management, water, energy and green
open spaces, food, environmental education, mobility…
More information: www.greenkey-brussels.be
Eco-Dynamic Companies
Brussels-Capital Region runs a successful “ Eco-Dynamic Company” label that rewards
companies environmental dynamism and progress, particularly in key areas such as
waste management, the rational use of energy and raw materials and the management
of worker mobility.
Since few companies can excel in all environmental areas simultaneously (energy, air,
water, waste, mobility, soil, noise, green and un-built areas), the label has three
categories represented by stars corresponding to eco-management progress: 3 star
label, 2 star label, 1 star label.
More information : www.bruxellesenvironnement.be
Eco-Management and Audit Scheme (EMAS)
The EU Eco-Management and Audit Scheme (EMAS) is a management tool for
companies and other organizations to evaluate, report and improve their environmental
performance. The scheme has been available for participation by companies since
1995 and was originally restricted to companies in industrial sectors. Since 2001 EMAS
has been open to all economic sectors including public and private services.
More information : http://ec.europa.eu/environment/emas/index_en.htm
Observatory for Tourism in Brussels Page 51.
The Green Globe International Label
Green Globe is the global travel and tourism industries’ certification program for sustainable tourism. Green Globe members save energy and water resources, reduce operational costs, positively contribute to local communities and their environment and meet the high expectations of green leisure and business travellers.
The Green Globe Standard is a structured assessment of the sustainability performance of travel and tourism businesses and their supply chain partners. Businesses can monitor improvements and document achievements leading to certification of their enterprises’ sustainable operation and management.
The Green Globe Standards is a collection of 337 compliance indicators applied to 41 individual sustainability criteria. The applicable indicators vary by type of certification, geographical area as well as local factors.
More information: www.greenglobe.com
Observatory for Tourism in Brussels Page 52.
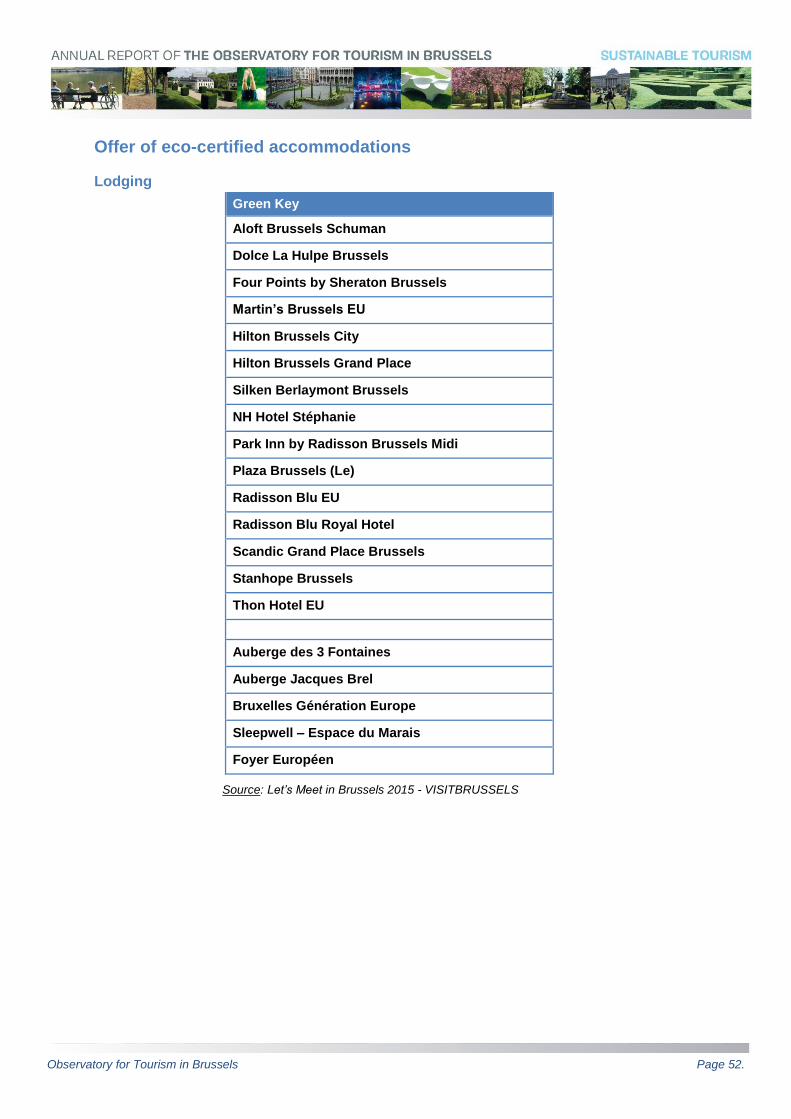
Offer of eco-certified accommodations
Lodging
Green Key
Aloft Brussels Schuman
Dolce La Hulpe Brussels
Four Points by Sheraton Brussels
Martin’s Brussels EU
Hilton Brussels City
Hilton Brussels Grand Place
Silken Berlaymont Brussels
NH Hotel Stéphanie
Park Inn by Radisson Brussels Midi
Plaza Brussels (Le)
Radisson Blu EU
Radisson Blu Royal Hotel
Scandic Grand Place Brussels
Stanhope Brussels
Thon Hotel EU
Auberge des 3 Fontaines
Auberge Jacques Brel
Bruxelles Génération Europe
Sleepwell – Espace du Marais
Foyer Européen
Source: Let’s Meet in Brussels 2015 - VISITBRUSSELS
Observatory for Tourism in Brussels Page 53.
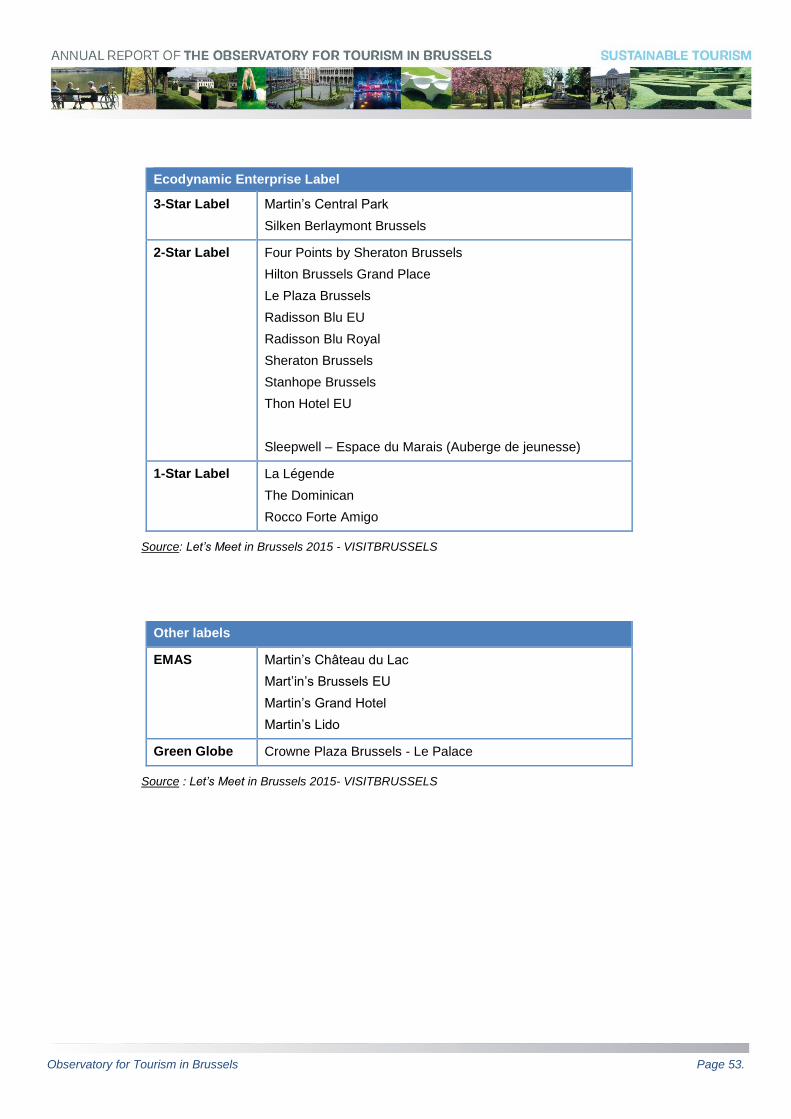
Ecodynamic Enterprise Label
3-Star Label Martin’s Central Park
Silken Berlaymont Brussels
2-Star Label Four Points by Sheraton Brussels
Hilton Brussels Grand Place
Le Plaza Brussels
Radisson Blu EU
Radisson Blu Royal
Sheraton Brussels
Stanhope Brussels
Thon Hotel EU
Sleepwell – Espace du Marais (Auberge de jeunesse)
1-Star Label La Légende
The Dominican
Rocco Forte Amigo
Source: Let’s Meet in Brussels 2015 - VISITBRUSSELS
Other labels
EMAS Martin’s Château du Lac
Mart’in’s Brussels EU
Martin’s Grand Hotel
Martin’s Lido
Green Globe Crowne Plaza Brussels - Le Palace
Source : Let’s Meet in Brussels 2015- VISITBRUSSELS
Observatory for Tourism in Brussels Page 54.
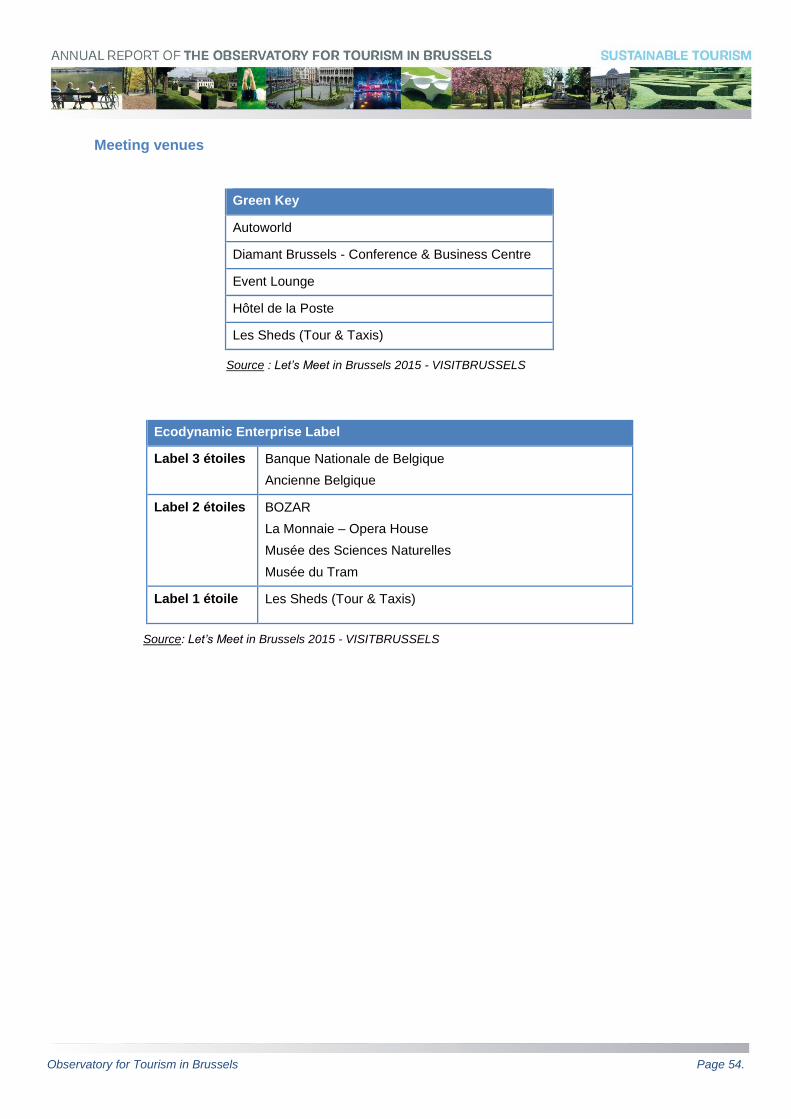
Meeting venues
Green Key
Autoworld
Diamant Brussels - Conference & Business Centre
Event Lounge
Hôtel de la Poste
Les Sheds (Tour & Taxis)
Source : Let’s Meet in Brussels 2015 - VISITBRUSSELS
Ecodynamic Enterprise Label
Label 3 étoiles Banque Nationale de Belgique
Ancienne Belgique
Label 2 étoiles BOZAR
La Monnaie – Opera House
Musée des Sciences Naturelles
Musée du Tram
Label 1 étoile Les Sheds (Tour & Taxis)
Source: Let’s Meet in Brussels 2015 - VISITBRUSSELS
Observatory for Tourism in Brussels Page 55.
The Green City Index
The Green City Index is an index that assesses the environmental policies of 30 European
cities from public statistics covering 30 indicators relating to eight major themes:
environmental governance, water management, land and waste management, energy
consumption, quality of buildings, transport, CO2 emissions and air quality. The figures are
interpreted from the specific context of each city and combined into a single index.
Sponsored by Siemens, the study is conducted by the Economist Intelligence Unit of The
Economist.
Out of 30 European capitals, Brussels ranks 9th, ahead of Paris and London, in the
European Green City Index* or ranking of sustainable cities.
In particular, Brussels comes joint top with Copenhagen when it comes to public
environmental policy.
More information: http://www.siemens.com/entry/cc/en/greencityindex.htm
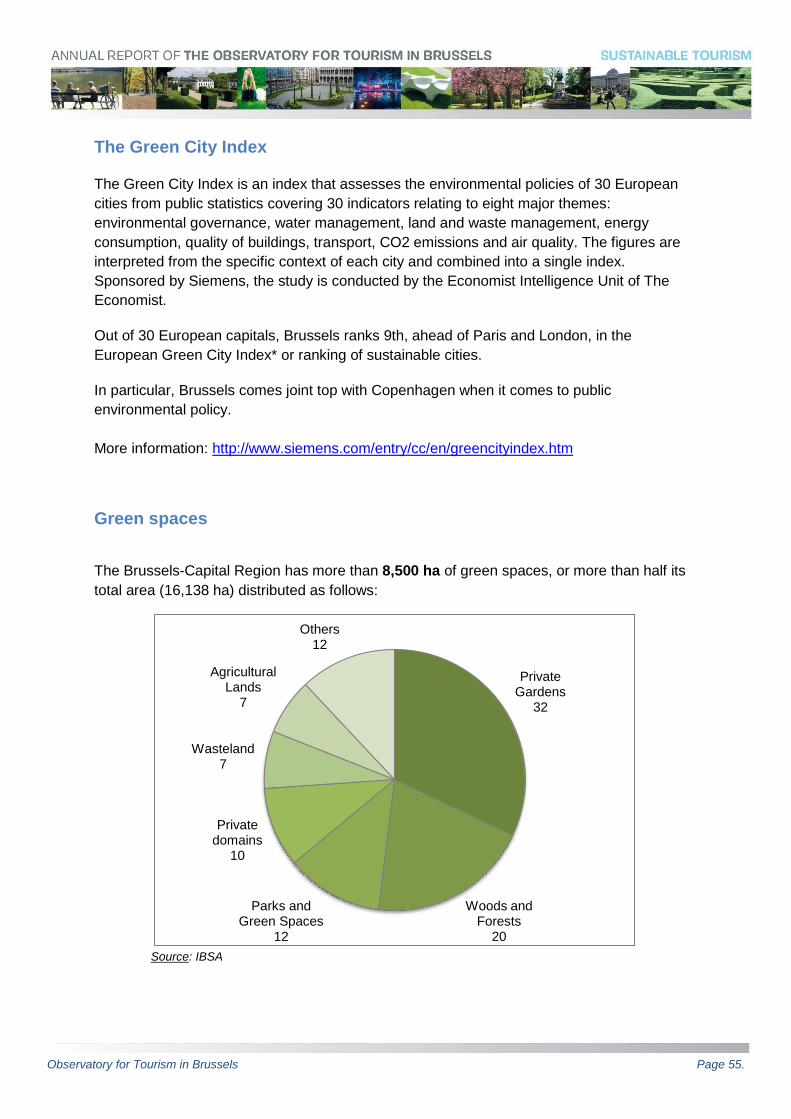
Green spaces
The Brussels-Capital Region has more than 8,500 ha of green spaces, or more than half its
total area (16,138 ha) distributed as follows:
Source: IBSA
Private Gardens
32
Woods and Forests
20
Parks and Green Spaces
12
Private domains
10
Wasteland 7
Agricultural Lands
7
Others 12
Observatory for Tourism in Brussels Page 56.
Reserves
With a view to protecting biodiversity in Brussels, 14 nature reserves (130 ha) and 2 forest
reserves (112 ha) have been designated within the Brussels-Capital Region.
Within the Brussels Region are three major types of nature reserves:
Nature reserves
The Moeraske
Ganshoren marshes
Jette marshes
Poelbos
Laerbeek wood
Zavelenberg
The reed beds of Parc des Sources
Kinsendael-Kriekenput
Rouge-Cloître nature reserve
Vallon des Enfants Noyés
Vallon du Vuylbeek
Vallon des Trois-Fontaines
Pinnebeek pond
Vogelzangbeek
Archaeological reserves
The archaeological reserve of the Tumuli
The archaeological reserve of ‘Boitsfort-Etang’
Forest reserves
The forest reserve of Rouge-Cloître
The forest reserve of Gripensdelle
Observatory for Tourism in Brussels Page 57.
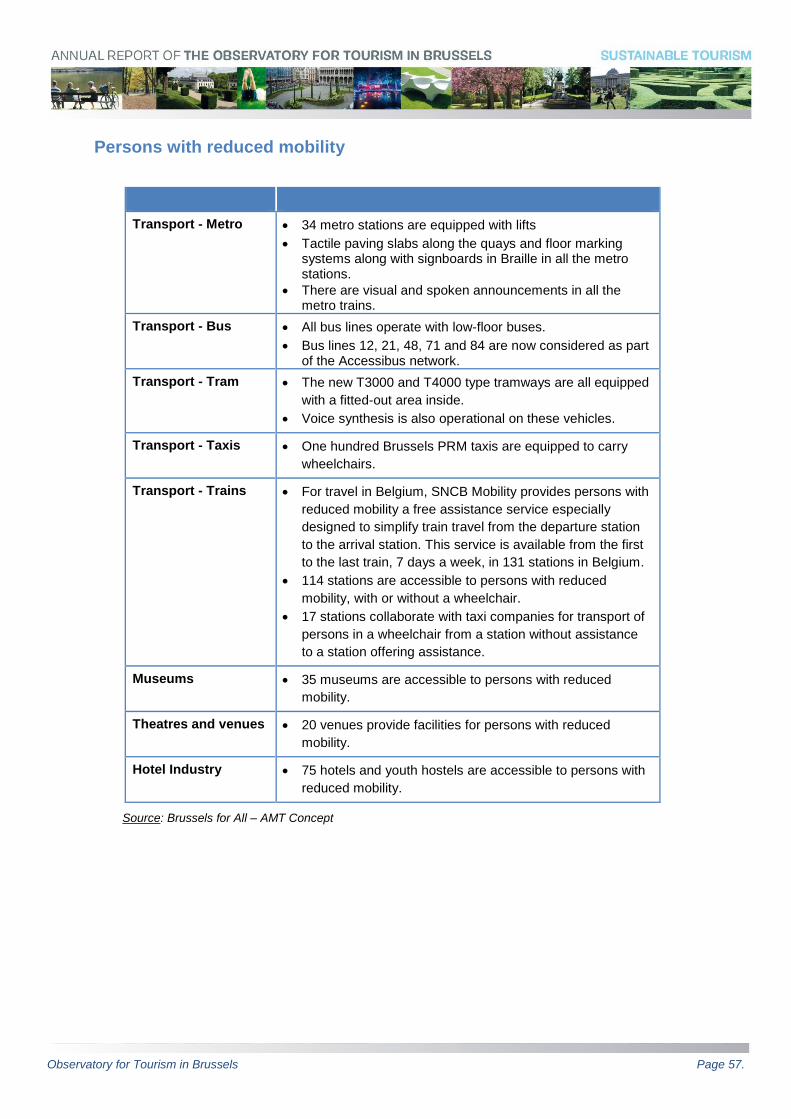
Persons with reduced mobility
Transport - Metro 34 metro stations are equipped with lifts
Tactile paving slabs along the quays and floor marking systems along with signboards in Braille in all the metro stations.
There are visual and spoken announcements in all the metro trains.
Transport - Bus All bus lines operate with low-floor buses.
Bus lines 12, 21, 48, 71 and 84 are now considered as part of the Accessibus network.
Transport - Tram The new T3000 and T4000 type tramways are all equipped
with a fitted-out area inside.
Voice synthesis is also operational on these vehicles.
Transport - Taxis One hundred Brussels PRM taxis are equipped to carry
wheelchairs.
Transport - Trains For travel in Belgium, SNCB Mobility provides persons with
reduced mobility a free assistance service especially
designed to simplify train travel from the departure station
to the arrival station. This service is available from the first
to the last train, 7 days a week, in 131 stations in Belgium.
114 stations are accessible to persons with reduced
mobility, with or without a wheelchair.
17 stations collaborate with taxi companies for transport of
persons in a wheelchair from a station without assistance
to a station offering assistance.
Museums 35 museums are accessible to persons with reduced
mobility.
Theatres and venues 20 venues provide facilities for persons with reduced
mobility.
Hotel Industry 75 hotels and youth hostels are accessible to persons with
reduced mobility.
Source: Brussels for All – AMT Concept