toward 2020 - understand the developing electricity market
TRANSCRIPT
October 2009: Copyright Oakley Greenwood – Not to be reproduced without permission
Toward 2020 - Understand the developingelectricity market drivers 2020
Jim Snow, Director
An Energy Market RevolutionDLA Phillips Fox

2Copyright Oakley Greenwood
Major Drivers of Change in the Energy Industry
Electricity System Load Factor Decline
– Price Impacts
– Air Conditioning driver
– Demand Response
– Load Forecasting
– Asset Utilisation
Carbon Pollution Reduction Scheme (CPRS)
– Greenhouse Intensity & Permit Trading and Importation
– Transport
– More Demand Response
– Funding Issues and Opportunities
National Renewable Energy Target (NRET)
– 5 fold increase – major impacts not really understood
3Copyright Oakley Greenwood
System Load Factor Decline
4Copyright Oakley Greenwood
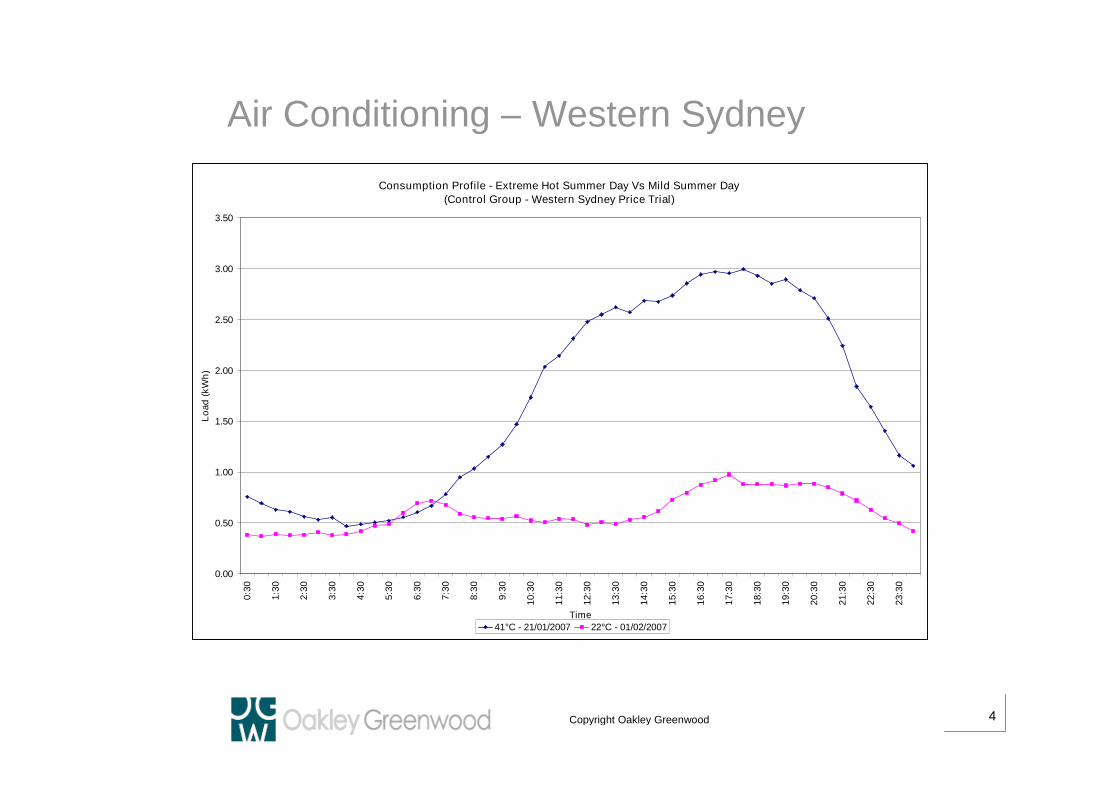
Air Conditioning – Western Sydney
Consumption Profile - Extreme Hot Summer Day Vs Mild Summer Day
(Control Group - Western Sydney Price Trial)
0.00
0.50
1.00
1.50
2.00
2.50
3.00
3.50
0:3
0
1:3
0
2:3
0
3:3
0
4:3
0
5:3
0
6:3
0
7:3
0
8:3
0
9:3
0
10:3
0
11:3
0
12:3
0
13:3
0
14:3
0
15:3
0
16:3
0
17:3
0
18:3
0
19:3
0
20:3
0
21:3
0
22:3
0
23:3
0
Time
Lo
ad
(kW
h)
41°C - 21/01/2007 22°C - 01/02/2007

5Copyright Oakley Greenwood
Extreme Temperature Impacts Growing
-
500
1,000
1,500
2,000
2,500
3,000
3,500
4,000
0:3
0
1:3
0
2:3
0
3:3
0
4:3
0
5:3
0
6:3
0
7:3
0
8:3
0
9:3
0
10
:30
11
:30
12
:30
13
:30
14
:30
15
:30
16
:30
17
:30
18
:30
19
:30
20
:30
21
:30
22
:30
23
:30
Time of Day
Sy
ste
mL
oa
d(M
W)
Total System Load - Mild day Domestic & GS Non-TOU contribution to Hot day Total System Load - Hot day
Domestic &GS Non-Tou 1,169 MW
Medium & large business152 MW
System Load - MILD Summer Day
System Load - HOT Summer Day
Capacity Utilisation is Extremely Low forPeak Assets
6Copyright Oakley Greenwood
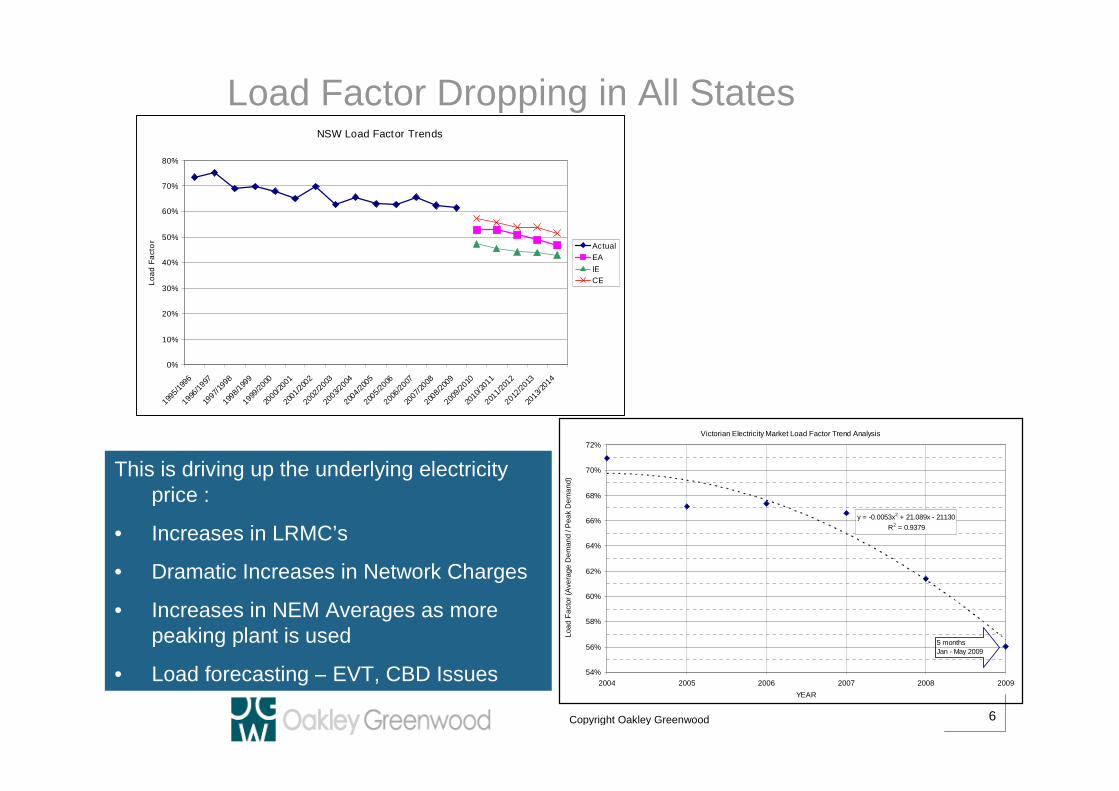
Load Factor Dropping in All States
This is driving up the underlying electricityprice :
• Increases in LRMC’s
• Dramatic Increases in Network Charges
• Increases in NEM Averages as morepeaking plant is used
• Load forecasting – EVT, CBD Issues
NSW Load Factor Trends
0%
10%
20%
30%
40%
50%
60%
70%
80%
1995/1
996
1996/1
997
1997/
1998
1998/
1999
1999
/200
0
2000/
2001
2001/
2002
2002
/200
3
2003/
2004
2004/2
005
2005/2
006
2006/2
007
2007/
2008
2008/2
009
2009/2
010
2010
/2011
2011/2
012
2012/2
013
2013
/2014
Lo
ad
Fa
cto
r
Actual
EA
IE
CE
Victorian Electricity Market Load Factor Trend Analysis
y = -0.0053x2 + 21.089x - 21130
R2 = 0.9379
54%
56%
58%
60%
62%
64%
66%
68%
70%
72%
2004 2005 2006 2007 2008 2009
YEAR
Loa
dF
acto
r(A
ve
rag
eD
em
an
d/P
ea
kD
em
an
d)
5 months
Jan - May 2009
7Copyright Oakley Greenwood
Rush to Peaking Plant – Gas Fired
Many firms are building large gas fired peaking plant – OCGT’s
Retailers are vertically integrating for peak insurance >$300/MWh
– Origin are using their own gas and contracting plant output – lot toprotect as volatility rises
– TRU and AGL doing the same – major rush on with something like 2 to3,000 MW+ under way
BUT this is not a greenhouse response…not yet anyway
– A renewable energy peaker would be ideal and if it can be scheduledeven better – solar has a chance but needs right support?
– AND drive for renewables expected to make the situation worsebecause it “free rides” on the system (or maybe it won’t?) they are notfirm or able to be scheduled in most cases and competes with otherbase load generation while still requiring power stations that can bescheduled to cover when not available
– The “wind issue” which will be covered later
8Copyright Oakley Greenwood
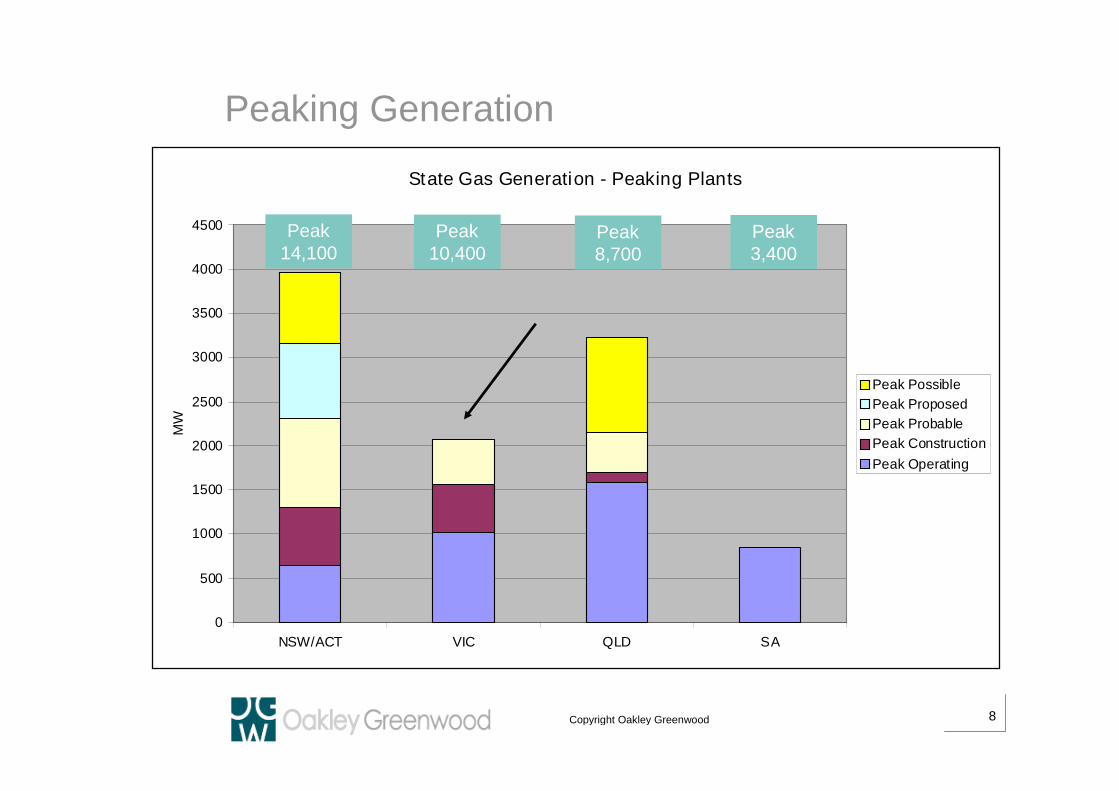
Peaking Generation
State Gas Generation - Peaking Plants
0
500
1000
1500
2000
2500
3000
3500
4000
4500
NSW/ACT VIC QLD SA
MW
Peak Possible
Peak Proposed
Peak Probable
Peak Construction
Peak Operating
Peak14,100
Peak10,400
Peak8,700
Peak3,400

9Copyright Oakley Greenwood
Base Load Gas
State Gas Generation - Base Load
0
500
1000
1500
2000
2500
3000
3500
4000
4500
NSW/ACT VIC QLD SA
MW
Base Possible
Base Proposed
Base Probable
Base Construction
Base Operating
Peak10,400
Peak3,400
Peak8,700
Peak14,100

10Copyright Oakley Greenwood
Wholesale Power - A Rising Market?
11Copyright Oakley Greenwood
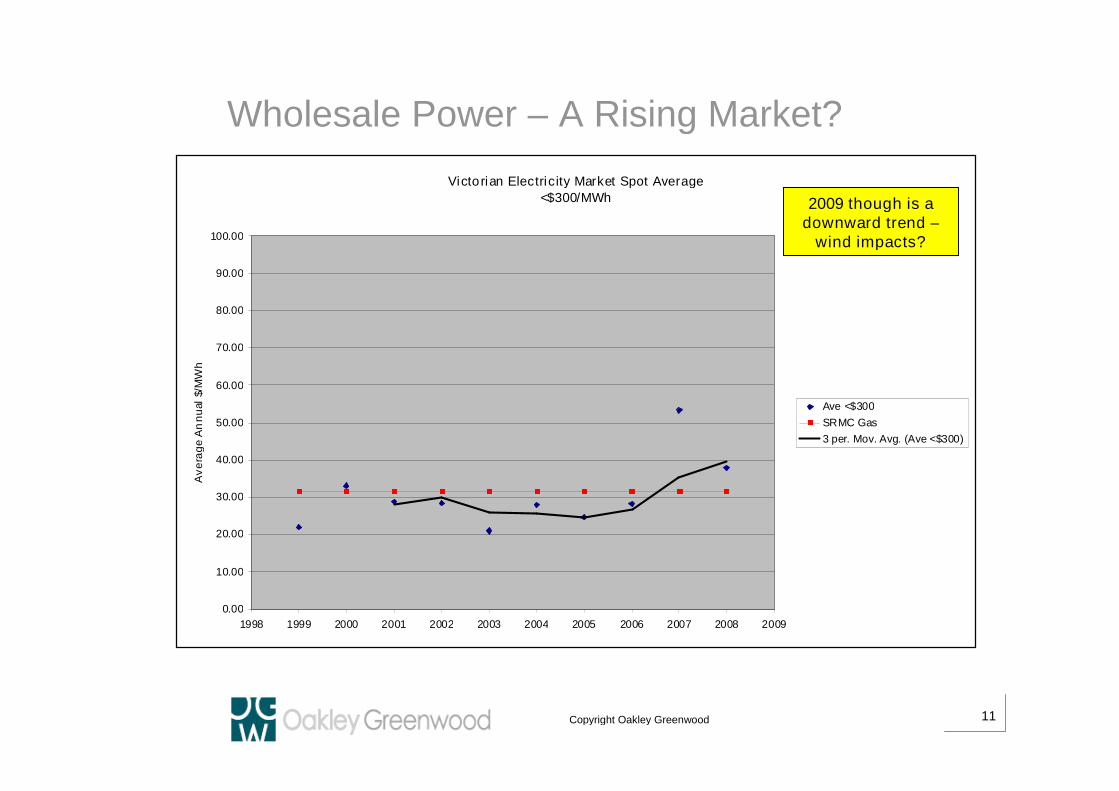
Wholesale Power – A Rising Market?
Victorian Electricity Market Spot Average
<$300/MWh
0.00
10.00
20.00
30.00
40.00
50.00
60.00
70.00
80.00
90.00
100.00
1998 1999 2000 2001 2002 2003 2004 2005 2006 2007 2008 2009
Av
era
ge
An
nu
al
$/M
Wh
Ave <$300
SRMC Gas
3 per. Mov. Avg. (Ave <$300)
2009 though is adownward trend –
wind impacts?

12Copyright Oakley Greenwood
Demand Elasticity?
Economics says market demand will reduce if the supply price increases
– The basis of much of the ETS – Garnaut
Elasticities estimates do exist for Australia (NEMMCO)
– -0.25 for Residential, -0.38 for Business
– 25% increase in price – 6% to 10% decrease in volume
– EnergyAustralia forecast 65% increase………and GFC fallout
BUT peak demand growth trend unlikely to change for a while
– Hence why we have a decreasing load factor
– This inevitably drives up retail prices and will become is becoming a
major political and commercial issue (“death spiral”), and
– Peak forecasting becomes highly uncertain – latent air conditioning load?
– EVT Issue - Melbourne summer outages, Sydney, Brisbane?
– High prices, falling volumes and uncertain outcomes on hot days?
13Copyright Oakley Greenwood
CPRS Issues (Power)
Will inevitably ALSO increase the price of electricity – may double it?
Will change the merit order of generation plants
– Lot of gas peaking plant being constructed but CCGT is risky
– Free permits are not enough to stop major change occurring unlessoffered for long periods (what is the point otherwise?)
– Will really need to ask the Banks (and Equity) – they hold the key
– Hazelwood wants to be paid to shut down - recent AGL announcementwalking away from Loy Yang stake – no certainty yet?
Major modelling Issues – be really careful here
– Assumptions on gas availability and price are generally wrong –MAJOR ISSUE?
– Debt Providers and Impairment Impacts?
– Demand Side Assumptions?
– Retailer Assumptions – Greenhouse Intensity Issues?
14Copyright Oakley Greenwood
CPRS Issues (Power)
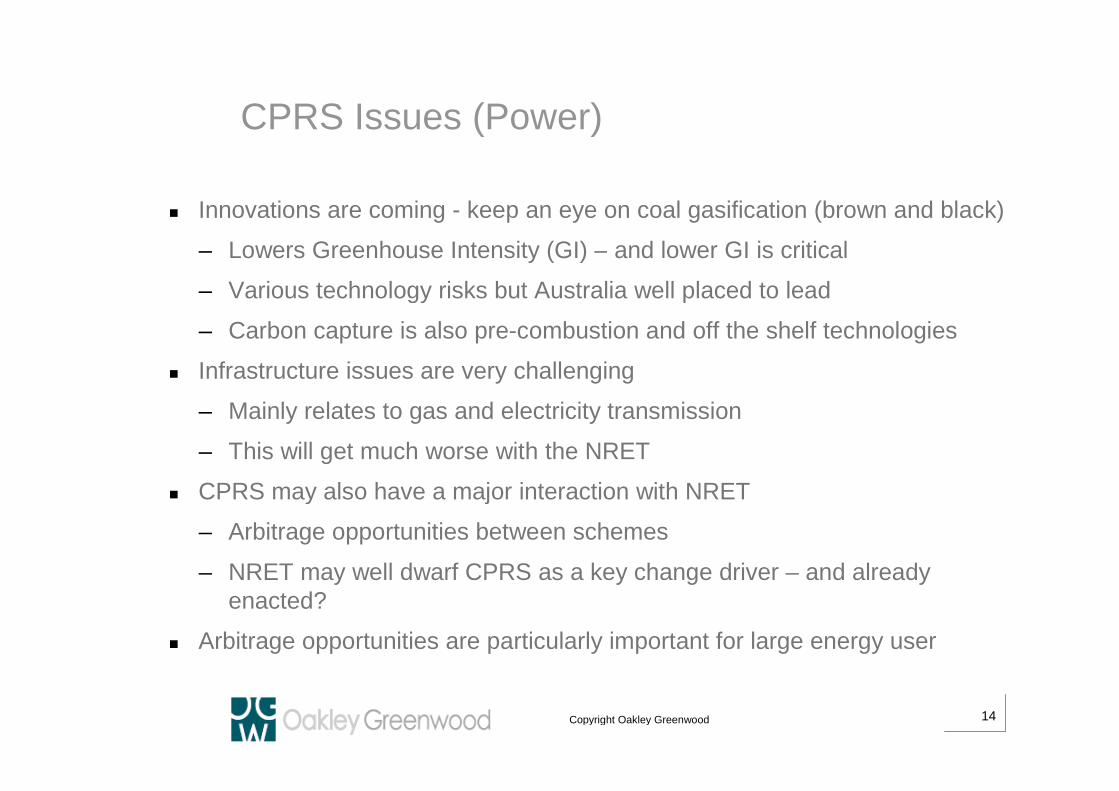
Innovations are coming - keep an eye on coal gasification (brown and black)
– Lowers Greenhouse Intensity (GI) – and lower GI is critical
– Various technology risks but Australia well placed to lead
– Carbon capture is also pre-combustion and off the shelf technologies
Infrastructure issues are very challenging
– Mainly relates to gas and electricity transmission
– This will get much worse with the NRET
CPRS may also have a major interaction with NRET
– Arbitrage opportunities between schemes
– NRET may well dwarf CPRS as a key change driver – and alreadyenacted?
Arbitrage opportunities are particularly important for large energy user
15Copyright Oakley Greenwood
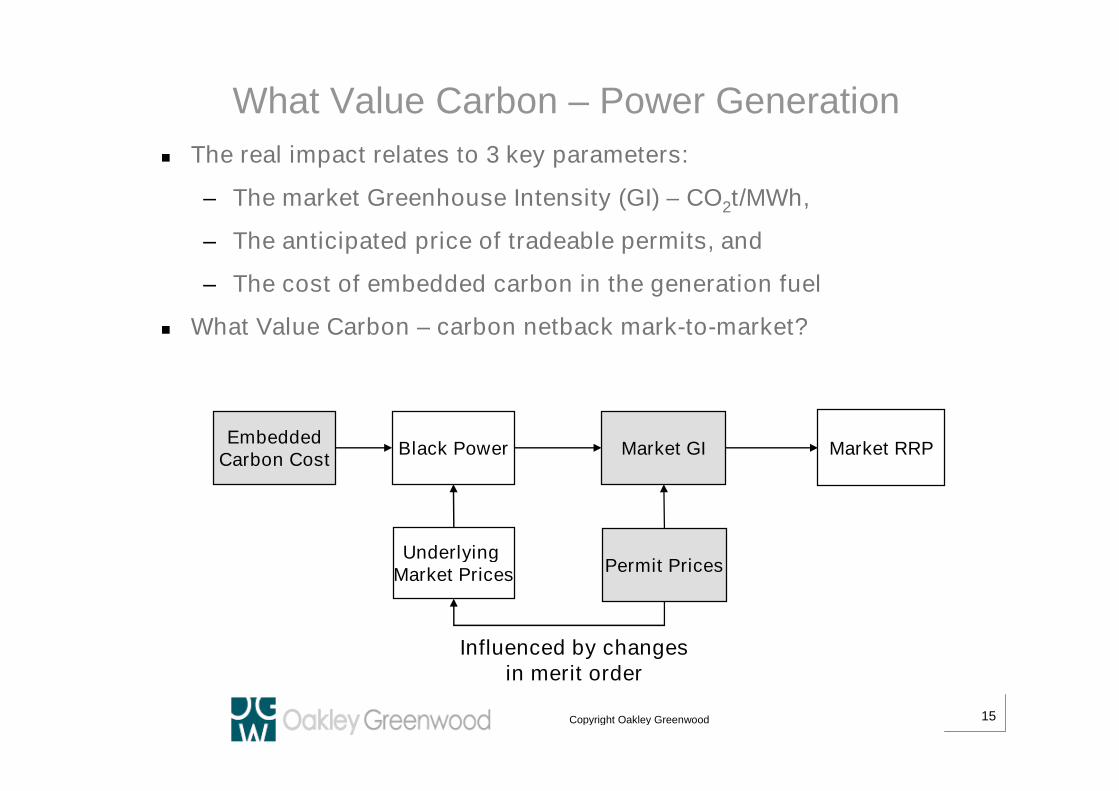
What Value Carbon – Power Generation
The real impact relates to 3 key parameters:
– The market Greenhouse Intensity (GI) – CO2t/MWh,
– The anticipated price of tradeable permits, and
– The cost of embedded carbon in the generation fuel
What Value Carbon – carbon netback mark-to-market?
Black Power Market GI
UnderlyingMarket Prices Permit Prices
Market RRP
Influenced by changesin merit order
EmbeddedCarbon Cost
16Copyright Oakley Greenwood
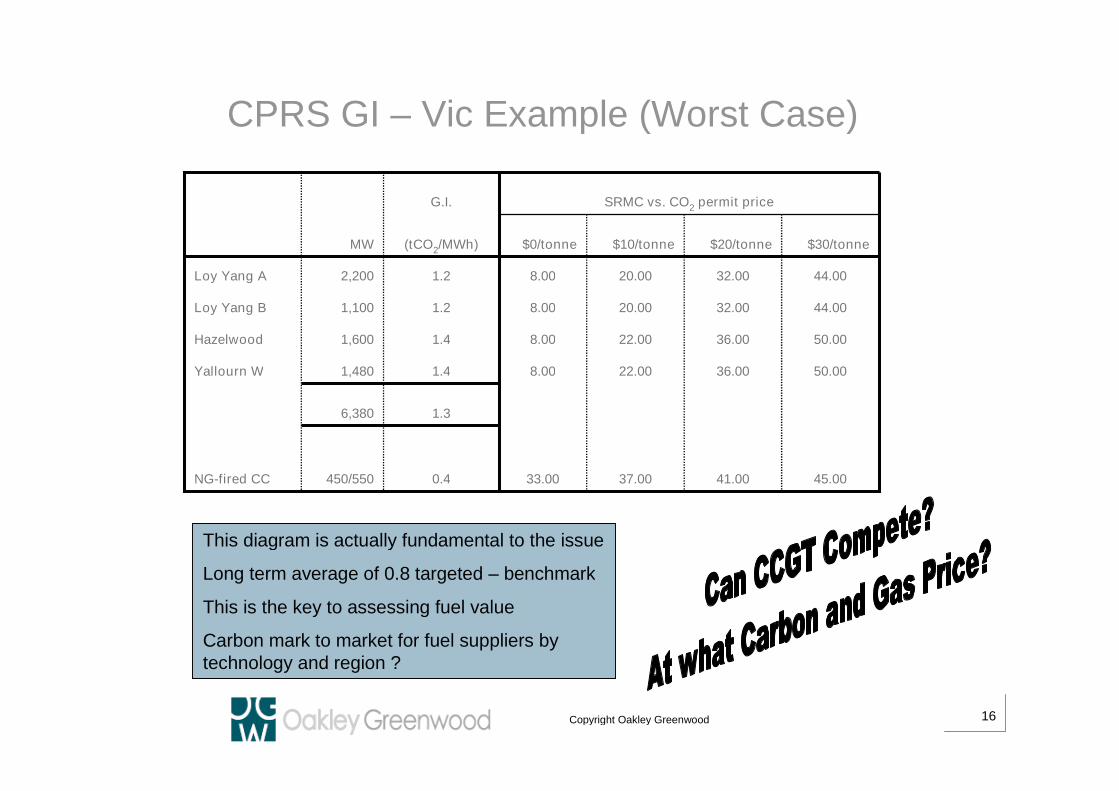
CPRS GI – Vic Example (Worst Case)
45.0041.0037.0033.000.4450/550NG-fired CC
1.36,380
50.0036.0022.008.001.41,480Yallourn W
50.0036.0022.008.001.41,600Hazelwood
44.0032.0020.008.001.21,100Loy Yang B
44.0032.0020.008.001.22,200Loy Yang A
$30/tonne$20/tonne$10/tonne$0/tonne(tCO2/MWh)MW
SRMC vs. CO2 permit priceG.I.
This diagram is actually fundamental to the issue
Long term average of 0.8 targeted – benchmark
This is the key to assessing fuel value
Carbon mark to market for fuel suppliers bytechnology and region ?
17Copyright Oakley Greenwood
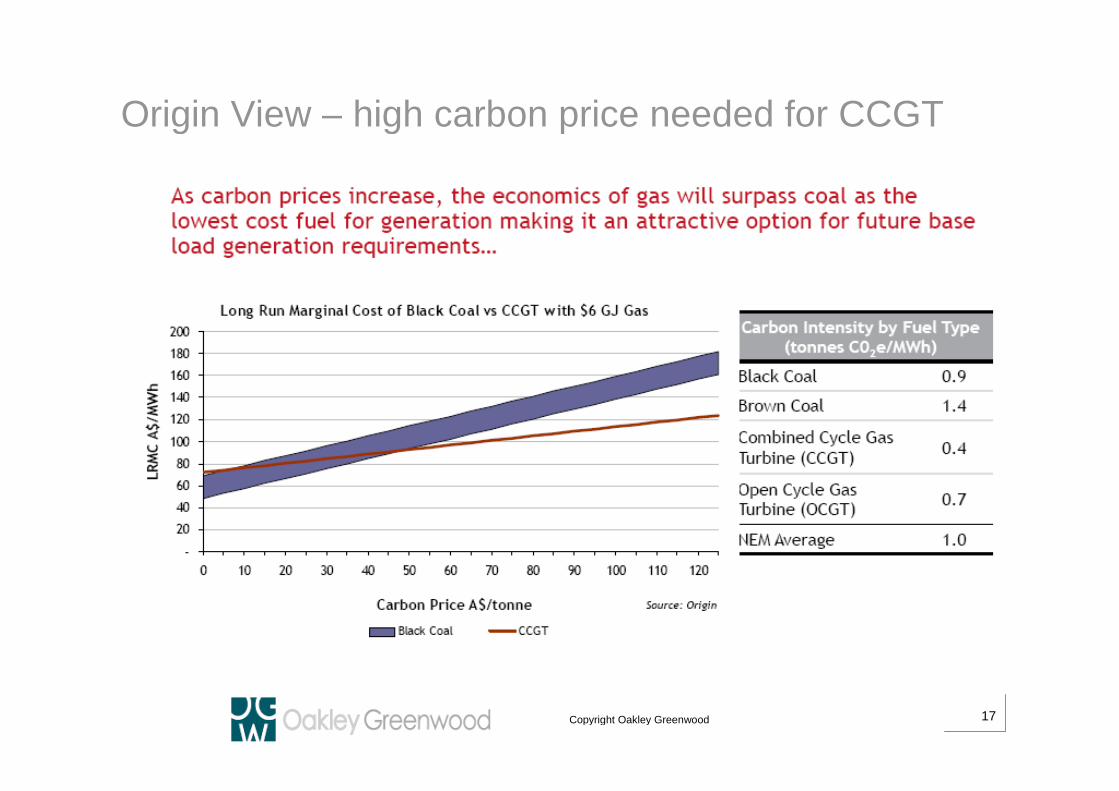
Origin View – high carbon price needed for CCGT
18Copyright Oakley Greenwood
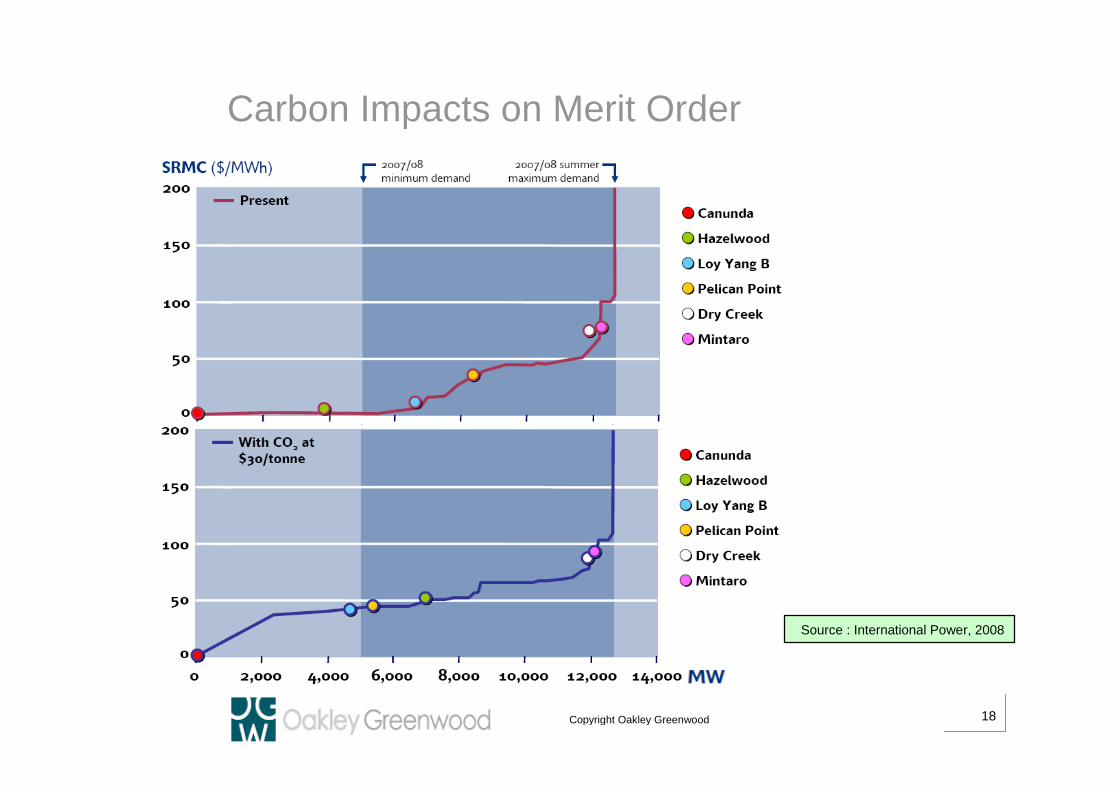
Carbon Impacts on Merit Order
Source : International Power, 2008

19Copyright Oakley Greenwood
More Demand Response?
The demand side will exhibit the price based response outlined, but
Firms that are directly covered will also have to for the first time
manage their own greenhouse emissions legally and commercially
They will have compulsory reporting with associated governance
requirements,
Have to lodge plans to reduce emissions, and
Buy and acquit permits
This is a massive behavioural change
Potentially restructure of industry as well – close, out-compete?
Big driver for self generation using gas or renewables or any other
low GI fuel
20Copyright Oakley Greenwood
Funding Issues Also Abound
Impairment of existing assets
– Banks the real deciders on who plays and who pays
Debt is scarce – may not last but very hard to get right now
It is the time to have equity and any good banking lines
Who has the money for this market – key issue now?
– Cash generators like Origin, AGL, etc.
– Chinese – some money flowing
– Some large energy consumers?

21Copyright Oakley Greenwood
NRET
The targets are ambitious by any measure
– 20% by 2020/30
– 45,000 GWh vs. 9,500 GWh - 60,000 in total
– Phase out by 2030 - CPRS?
– Now a $65/MWh Penalty level
What will make up this mix - wind, solar, biomass, geothermal?
How will it be funded?
Can it all even been built – 30% LF = 15,000 MW + by 2020/30?
Lets get this into perspective – on a windy day we will see thousands of MW of
generation hit the market as price takers – unscheduled?
If this was new coal generation we would see decades of price crashes, people
going broke and shutting down and huge value destruction
– So why do people think wind will not have a similar effect?
22Copyright Oakley Greenwood
NRET
We are told – there are major opportunities here for new players, but
– Can they find the money to participate – can they bank their projects
without off take arrangements?
– It really is a buyers/funders market and highly bankable contracts
needed
– As outlined – ask who has the money – and who has the liability?
– Surprise - AGL say they are going big here,
– Origin also building up but also talking up solar and geothermal
(which they have made major investments in)
– After NSW Retail sale how many counter parties will there be – and
will TRUenergy get taken out?

23Copyright Oakley Greenwood
NRET
Major issue will be ability to arbitrage CPRS market
– REC’s plus market price for the “black” – this is a major “market distortion”
– Large element of double dipping – if this is allowed but seems to be what will
happen
Lot will also “free ride” as price takers
– Wind for example is not dispatched and will eat into base load and cause
major changes to the market if it becomes as big as anticipated
– Evidence is this build up crashing/will crash NEM prices – for a while, then
– Progressively will need fast response plants if wind takes the lions share of
the NRET (as expected) – OCGT – guess who owns these?, and
– May also see wind being constrained off by AEMO for supply stability?
– May give rise to new price pressures from “ancillary” support
– Whole scenario may even spook “independent” wind investment
24Copyright Oakley Greenwood
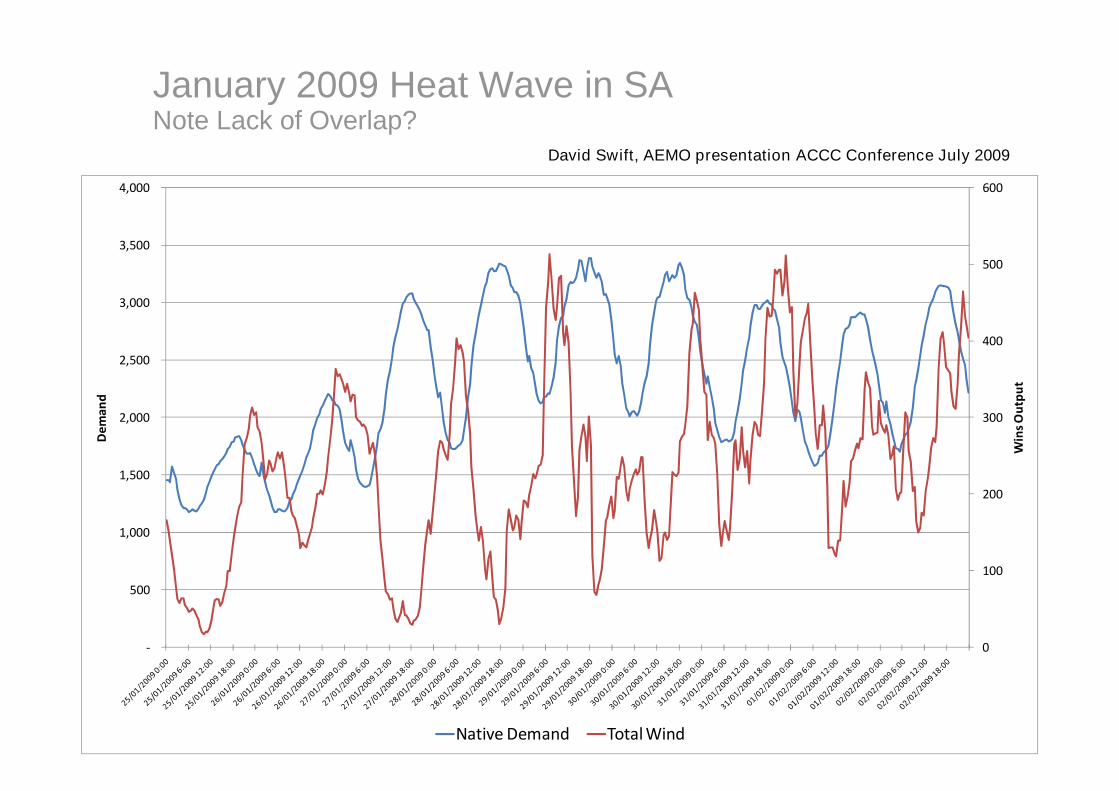
January 2009 Heat Wave in SANote Lack of Overlap?
0
100
200
300
400
500
600
-
500
1,000
1,500
2,000
2,500
3,000
3,500
4,000
Win
sO
utp
ut
De
man
d
Native Demand Total Wind
David Swift, AEMO presentation ACCC Conference July 2009

25Copyright Oakley Greenwood
5000MW Example (modelled)SA and Vic Wind farms - Note degree of overlap?
0
500
1000
1500
2000
2500
3000
3500
4000
4500
500001
/Sep
02/S
ep
03/S
ep
04/S
ep
05/S
ep
06/S
ep
07/S
ep
08/S
ep
09/S
ep
10/S
ep
11/S
ep
12/S
ep
13/S
ep
14/S
ep
15/S
ep
16/S
ep
17/S
ep
18/S
ep
19/S
ep
20/S
ep
21/S
ep
22/S
ep
23/S
ep
24/S
ep
25/S
ep
26/S
ep
27/S
ep
28/S
ep
29/S
ep
30/S
ep
MW
SA Wind Farms Vic Wind Farms
David Swift, AEMO presentation ACCC Conference July 2009
26Copyright Oakley Greenwood
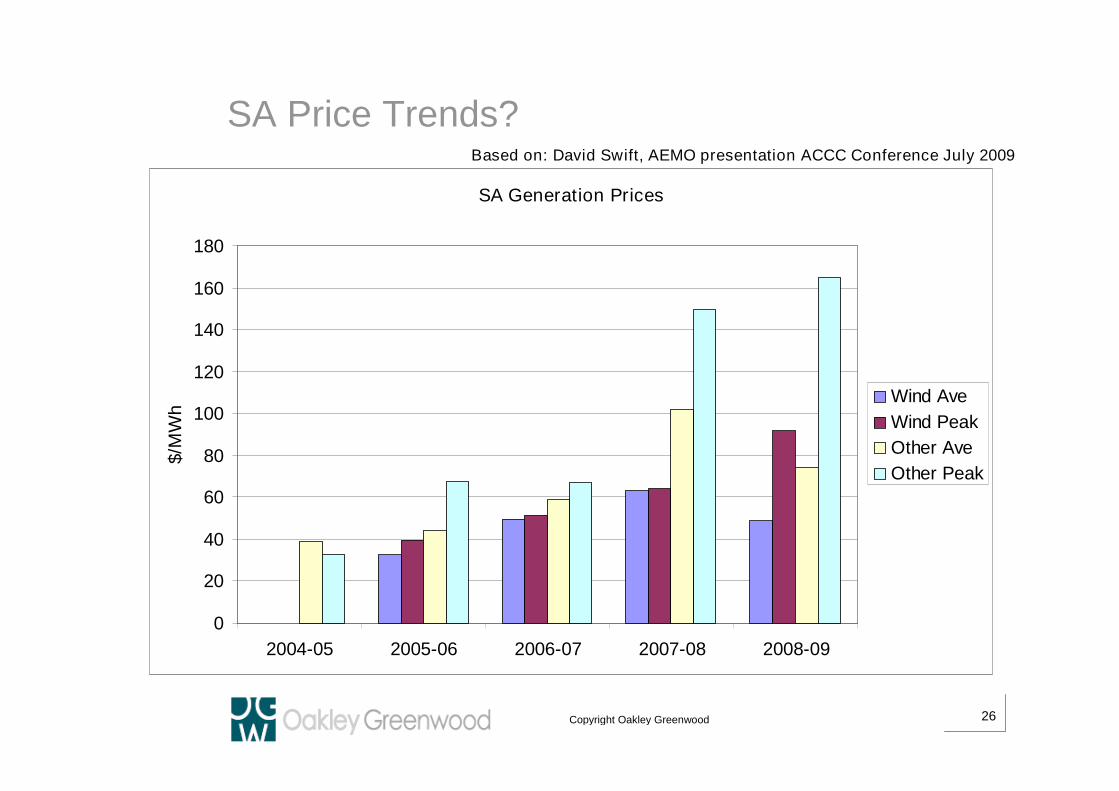
SA Price Trends?
SA Generation Prices
0
20
40
60
80
100
120
140
160
180
2004-05 2005-06 2006-07 2007-08 2008-09
$/M
Wh
Wind Ave
Wind Peak
Other Ave
Other Peak
Based on: David Swift, AEMO presentation ACCC Conference July 2009
27Copyright Oakley Greenwood
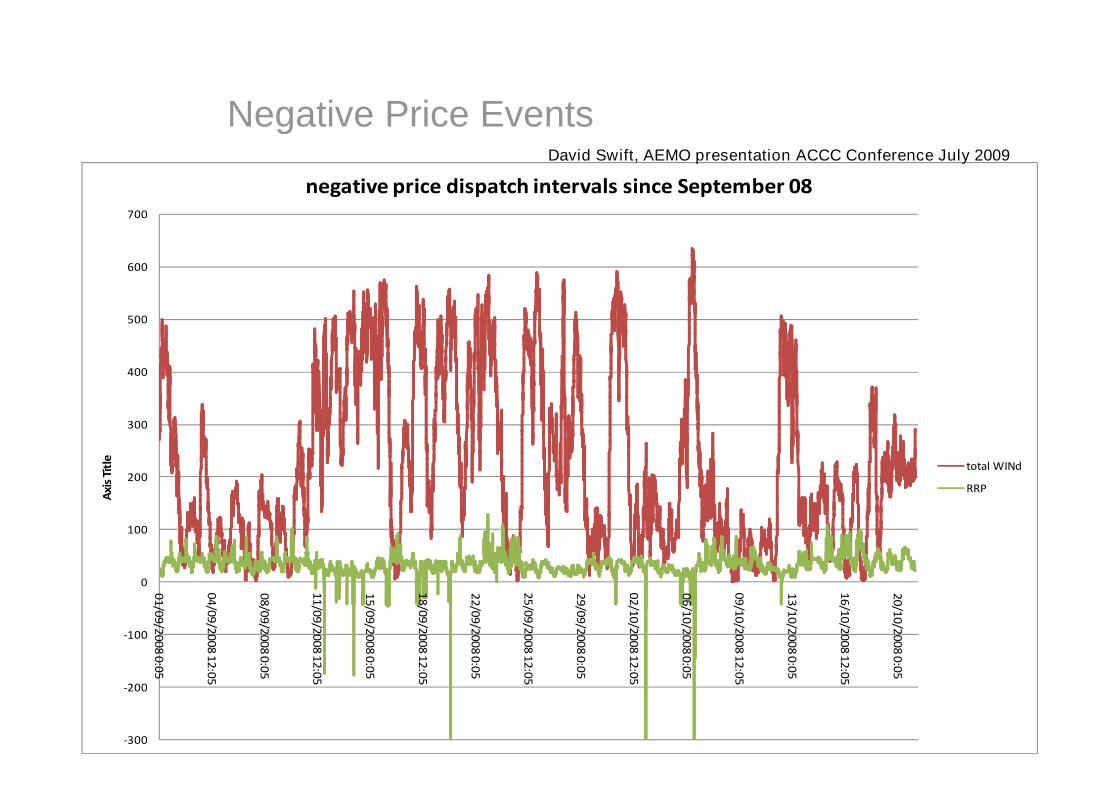
Negative Price Events
-300
-200
-100
0
100
200
300
400
500
600
700
01
/09
/20
08
0:0
5
04
/09
/20
08
12
:05
08
/09
/20
08
0:0
5
11
/09
/20
08
12
:05
15
/09
/20
08
0:0
5
18
/09
/20
08
12
:05
22
/09
/20
08
0:0
5
25
/09
/20
08
12
:05
29
/09
/20
08
0:0
5
02
/10
/20
08
12
:05
06
/10
/20
08
0:0
5
09
/10
/20
08
12
:05
13
/10
/20
08
0:0
5
16
/10
/20
08
12
:05
20
/10
/20
08
0:0
5
Axi
sTi
tle
negative price dispatch intervals since September 08
total WINd
RRP
David Swift, AEMO presentation ACCC Conference July 2009

28Copyright Oakley Greenwood
Over-speed Event in SA on 30June

29Copyright Oakley Greenwood
Relevance to Gas for Power Generation
It is generally accepted that gas fired plant are the best at managing load
fluctuations
But will we see the OCGT plant used for more reasons than simply market price
caps – auxiliary supply, more medium running because of wind and eventual
market mitigation (even domination) by the large Retailers
And the question remains can CCGT’s compete in the market anyway?
– Is the gas price stable enough or can it be linked to power markets, and
– Can gas be purchased long term to back a CCGT plant at all now?
– What about the LNG stampede – gas bankers, oil price links?
– Advent of Retailers with equity gas - how will this play out?
– Do we have the pipelines to cope?
30Copyright Oakley Greenwood
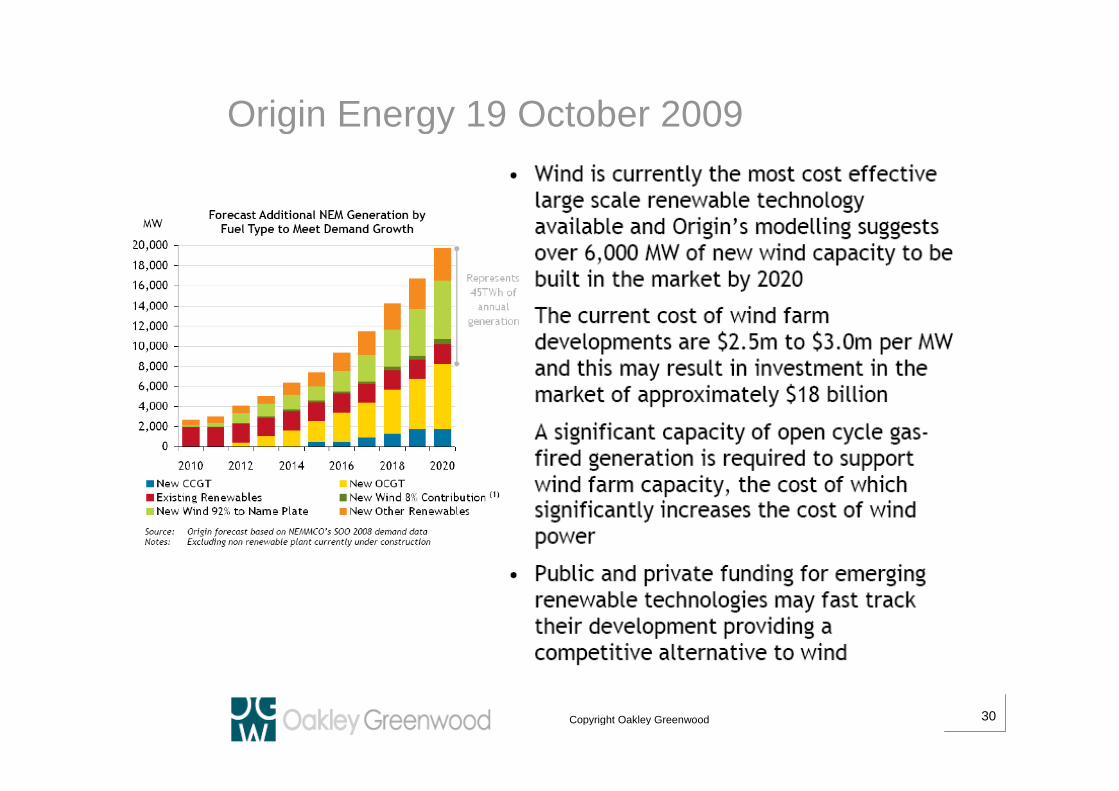
Origin Energy 19 October 2009
31Copyright Oakley Greenwood
Gas Availability on the East Coast?
Eastern Australia currently has gas “limitations” for power generation that are
becoming apparent
– Santos has gas but no power gen deals being announced – is though
permitting Shaw River Power Station (1,500 MW CCGT) using own gas (and
now looking for a partner?) – is 2P on books enough to support in south east
– need circa 1,300PJ for SRPS? Cooper Basin? Gunnedah? Queensland?
– Origin is very short in the south – focused on peaking plant to cover retail
positions with OCGT and to gain from “wind issue” – move onto mid merits
and CCGT later – do they have the gas (economically) – have announced
capability to draw 60PJ/year from Queensland via SA (major strategic move)
– forgoing LNG value – drilling more offshore SA and Vic?
– Bass Strait has 2,000 PJ of 2P left for sale but again no longer term deals
announced – everyone selling short?

32Copyright Oakley Greenwood
Gas Availability on the East Coast?
– Price Arbitrage issues abound and as of today no old style CPI linked long
term contracts being sold (to underpin a CCGT project for example)
– Now that was not in the modelling assumptions and has interesting
implications
– Work being done on gas/power long term commodity linked hedge (with
LNG link just for fun) – but hard yards
– Power netback deals – Arrow in Queensland,
– The truth is equity gas arrangements are the real push – Origin and AGL and
Santos the leaders
– Understandable – no downside from this strategy and lots of upside
– New entrants will need liquidity of supply, well priced and long term deals –
but from whom – not many choices highly illiquid market?

33Copyright Oakley Greenwood
Gas Availability But we have all this CSG I hear you say?
– In Queensland most of it is currently earmarked for LNG developments –
Origin has some to export interstate – but otherwise none to be had
– Everyone busy doing 2P reserve proving – billions $ being spent
– Claim could be 250,000 PJ – 10 x Bass Strait – may be a timing issue?
How much LNG?
– Each train of 3.5 mtpa requires about 6,000PJ of reserves
– Origin/Conoco Phillips – 14m tonnes/year - needs a 1,000 PJ/year pipeline
(48 inch) and 24,000 PJ of reserves
– Santos/Petronas – GLNG – 10 mtpa – another say 17,000 PJ
– BG/QGC/AGL – 12 to 15 mtpa – another say 24,000 PJ
– LNG Ltd (Golar/Brand/Arrow) – 1.5 mtpa – 1,200 PJ
Yep – circa 50,000 PJ……no wonder they are busy?

34Copyright Oakley Greenwood
Gas Availability NSW CSG?
– Eastern Star Gas, Santos and AGL (Sydney gas) in NSW – Santos alsohave ownership in ESG
– ESG 19.9% Santos, Santos have 1/3 of the field as well?
– The key issues here are proving reserves and the distance to marketswithout any pipelines – reserves come with markets
– ESG Has announced MOU’s up to 1,300 PJ and busy trying to provethis up by years end
– How much gas in NSW that is useable – 6,000 PJ C3 ESG, 17 TCF,more?
– Pipelines?
– LNG development at Newcastle?
– LNG prices?
35Copyright Oakley Greenwood
LNG Prices Crash – but from very high values
LNG Outlook
Henry Hub now not trending with WTI – last 6 months?

36Copyright Oakley Greenwood
Will CSG make power?
Economic theory says we will eventually have a clearing price that is more
rational for the LNG market
– Recent prices driven by lack of supply/excess demand
– But international “gas bankers” playing the long game
Power netback prices may though be attractive in the end
BUT long term GSA’s are tight at the moment – and the game is changing
with groups who are happy to sit on reserves and lock them up for LNG long
term – and paid BIG money ($1.78/GJ 3P)
AND major issue with grid infrastructure
– Pipelines will be required to get to southern markets – and pipeline
businesses risk adverse with GFC – Retailer backed investments?
– Electricity transmission may get the gig as it is a “common good” – market
pays – but this is also a raging argument – especially for wind plants –
another nation building investment?

37Copyright Oakley Greenwood
OCGT vs. CCGT
OCGT plant developments are tolerant to higher gas prices if aimed at a cap market
– Fuel price capped by distillate and carbon prices have little real impact, and
– They are not as sensitive to price resets which makes gas contracting easier
CCGT’s are very sensitive to both gas and carbon permit prices – affected more by
well head sensitivities to markets and to new haulage pipeline costs, and
– Very difficult to garner a long term bankable gas supply agreement at this time –
this may well change but 15 year deals are hard to nail for large volumes
– Retailer equity gas is also a new advent, and
– There may end up issues about market concentration of upstream “basin”
ownerships (retailer equity gas may well be a response to this)
– Ongoing tension between large LNG sales and gas for domestic markets – will the
east coast end up like WA in this regard?
– Coal may well be very competitive to CCGT – wind may mean coal competes
38Copyright Oakley Greenwood
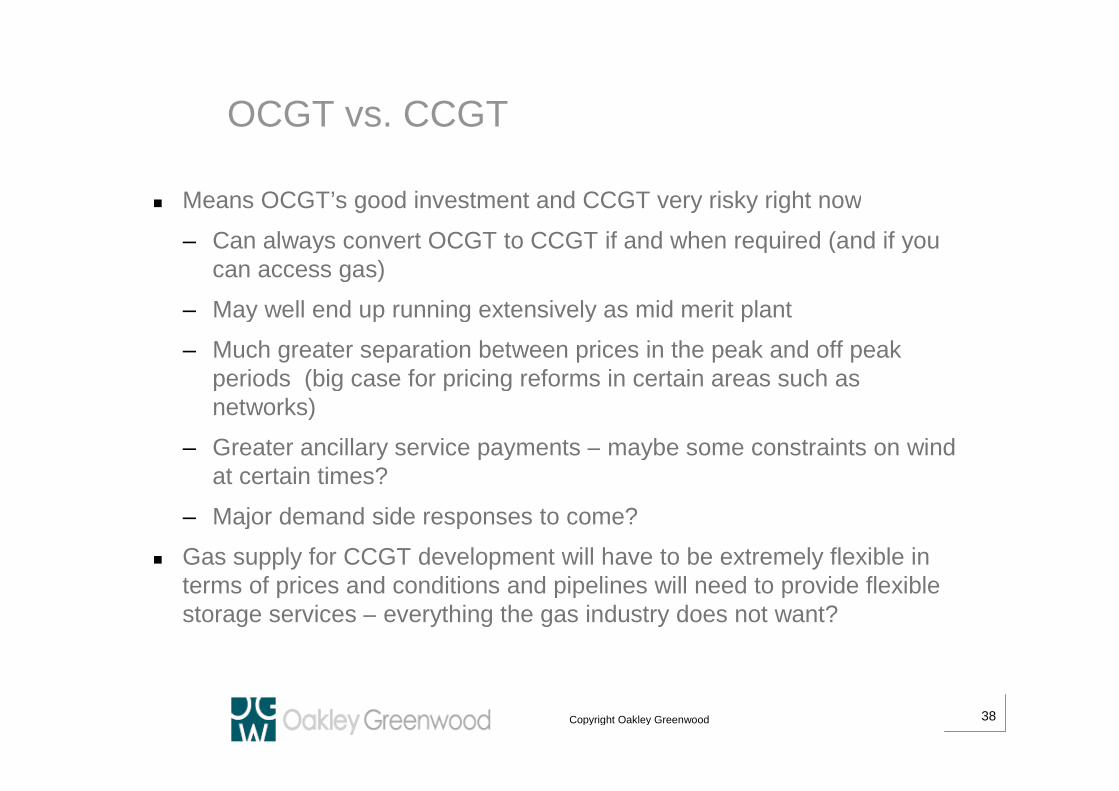
OCGT vs. CCGT
Means OCGT’s good investment and CCGT very risky right now
– Can always convert OCGT to CCGT if and when required (and if youcan access gas)
– May well end up running extensively as mid merit plant
– Much greater separation between prices in the peak and off peakperiods (big case for pricing reforms in certain areas such asnetworks)
– Greater ancillary service payments – maybe some constraints on windat certain times?
– Major demand side responses to come?
Gas supply for CCGT development will have to be extremely flexible interms of prices and conditions and pipelines will need to provide flexiblestorage services – everything the gas industry does not want?
39Copyright Oakley Greenwood
National Retail Vision Work – this time 2 years ago?
“A national energy industry with increasing nationaleconomic and policy impact and stringent nationalwatchdogs for its financial, economic and competitiveperformance……...providing fertile ground for innovationand change”
Jim Snow
40Copyright Oakley Greenwood
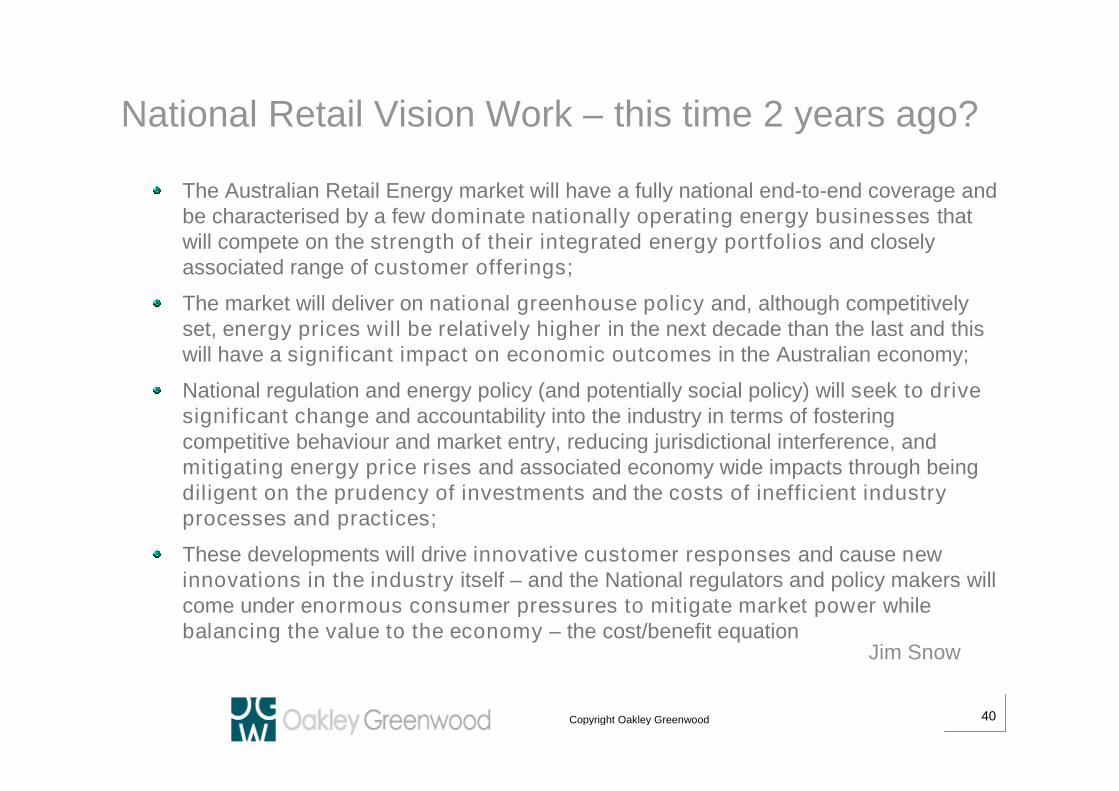
The Australian Retail Energy market will have a fully national end-to-end coverage andbe characterised by a few dominate nationally operating energy businesses thatwill compete on the strength of their integrated energy portfolios and closelyassociated range of customer offerings;
The market will deliver on national greenhouse policy and, although competitivelyset, energy prices will be relatively higher in the next decade than the last and thiswill have a significant impact on economic outcomes in the Australian economy;
National regulation and energy policy (and potentially social policy) will seek to drivesignificant change and accountability into the industry in terms of fosteringcompetitive behaviour and market entry, reducing jurisdictional interference, andmitigating energy price rises and associated economy wide impacts through beingdiligent on the prudency of investments and the costs of inefficient industryprocesses and practices;
These developments will drive innovative customer responses and cause newinnovations in the industry itself – and the National regulators and policy makers willcome under enormous consumer pressures to mitigate market power whilebalancing the value to the economy – the cost/benefit equation
National Retail Vision Work – this time 2 years ago?
Jim Snow

41Copyright Oakley Greenwood
Summary Peakiness will grow with weather effects and demand response – air conditioning
and LRMC key issues driving up prices anyway as we have seen
RET will have major impact if wind is built in the quantities indicated – but will
anyway as huge uplift in generation and volatility no matter what
CPRS delays are causing gross paralysis and early exit strategies and will
magnify RET impacts when implemented fully – especially on base load coal – but
this depends a lot on what it looks like in the end
This all provides major opportunities for key retailers that have good balance
sheets and equity gas positions – taking dominant market positions
Gas is unlikely to be major energy base for power in medium term unless things
change or retailers (or producers) use their equity gas positions – but will be very
large for peaking and intermediate and maybe base load in the longer term?
Likelihood of more major Government intervention must be extremely high –
starting to see input cost effects of energy industry as a national issue – politics of
energy at the Jurisdictional level should not be underestimated?

42Copyright Oakley Greenwood
Oakley Greenwood – Thank You
Brisbane
Jim Snow
Business Strategy
Gas industry experience
Energy project
development
Network regulation
Energy Marketing
Demand side
Industry Restructuring
Wellington, NZ
Andrew Shelley
Regulatory economics
Model development
Competition matters
Melbourne
Alan Rattray
Energy trading and riskmanagement
Strategy advice
Analysis
Lance HochGas and electricity network andretail
Demand side expertiseincluding energy efficiency
Climate change impact analysis
Stephen Thompson
Stuart James
NEM Modelling
Gas & Electricity Trading
LNG
Gas haulage agreements
Power generation matters
Adelaide
Greg Thorpe
Market policy, marketdesign and regulation
Market analysis andmarket modelling
Climate change impactanalysis
Transmission /Generation interactions
Gas/electricityinteractions
Jim Snow, Phone: 32637612,
Mob: 0417775893
www.oakleygreenwood.com.au
Jim Mcdonald & JohnWallace
Senior Consultants toOGW