toward determining systemic importance - q group · pdf filetoward determining systemic...
TRANSCRIPT
1
Toward Determining Systemic Importance
This Version: March 23, 2012
William B. Kinlaw State Street Associates / State Street Global Markets
Mark Kritzman Windham Capital Management, LLC
and MIT Sloan School
David Turkington
State Street Associates / State Street Global Markets [email protected]
The views expressed in this article are the views solely of the authors and do not necessarily represent the views of, and should not be attributed to, MIT Sloan School, State Street Corporation, or Windham Capital Management.
Abstract
We introduce a methodology for measuring systemic importance. Investors care about systemic importance because this knowledge may enable them to assess their portfolio’s vulnerability to particular events and, if warranted, to pursue defensive strategies. Policymakers also need this information to ensure that policies and regulations target the appropriate entities and to engage in preventive or corrective measures more effectively when circumstances warrant intervention. The absorption ratio, introduced by Kritzman et al. [2011], provides an implied measure of systemic risk based on principal components analysis. We extend this methodology to determine an entity’s centrality. Our centrality measure captures an entity’s vulnerability to failure, its connectivity to other entities, and the risk of the entities to which it is connected. We convert this measure of centrality into a measure of systemic importance by conditioning it on periods of high systemic risk.

2
Toward Determining Systemic Importance
Introduction
Systemic risk is the risk that a relatively narrow shock, such as the failure of a particular
company, will propagate quickly and broadly throughout the financial system and to the real
economy. It is the opposite of systematic risk, which measures the extent to which movement of
a broad market or economic factor imparts risk to a narrow entity such as an individual company.
For many decades, investors have focused more on systematic risk as they sought to design
efficient portfolios and to avoid uncompensated risks. In the wake of the global financial crisis,
however, investors, as well as policymakers, have shifted their attention to systemic risk, and
with good reason. It is now abundantly clear that narrow events such as Lehman Brothers’
default can cause the global stock market to crash, paralyze the financial system, and cast the
world economy into a deep and long recession.
Much of the recent research on systemic risk has focused on the linkages between
institutions.1 However, it is notoriously difficult—if not impossible—to observe all of these
linkages directly due to opacity, private transacting, accounting manipulations, and other
complicating factors. We therefore employ an alternative approach to measuring systemic risk
known as the absorption ratio, which was introduced by Kritzman et al. [2011]. The absorption
ratio infers whether systemic risk is high or low from the behavior of asset prices. Our goal is to
extend the absorption ratio methodology to determine the systemic importance of a particular
entity.
1 See, for example, Billio et al. [2010] and Haldane [2009].
3
Investors care about systemic importance because this knowledge may enable them to
assess their portfolio’s vulnerability to particular events and, if warranted, to pursue defensive
strategies. Policymakers also need this information to ensure that policies and regulations target
the appropriate entities and to engage in preventive or corrective measures more effectively
when circumstances warrant intervention. We apply our methodology to a sample of industry
returns for the U.S. stock market and for company returns within the U.S and global financial
sectors, and we rank the systemic importance of various entities. We conclude with a summary.
The Absorption Ratio as a Measure of Systemic Risk
The absorption ratio, introduced by Kritzman, Li, Page, and Rigobon [2011; henceforth
KLPR], equals the fraction of the total variance of a set of asset returns explained or “absorbed”
by a fixed number of eigenvectors, as shown in equation 1.
𝐴𝑅= i=1nσEi2 j=1NσAj2 (1)
where,
AR = Absorption ratio
N = number of assets
N = number of eigenvectors in numerator of absorption ratio
σEi2 = variance of the i-th eigenvector
σAj2 = variance of the j-th asset
4
KLPR provide the following intuition regarding the absorption ratio:
[The absorption ratio] captures the extent to which markets are unified or tightly
coupled. When markets are tightly coupled, they are fragile in the sense that
negative shocks travel more quickly and broadly than when markets are loosely
linked. When the absorption ratio is low, markets are more resilient to shocks
and less likely to exhibit a system wide response to bad news.2
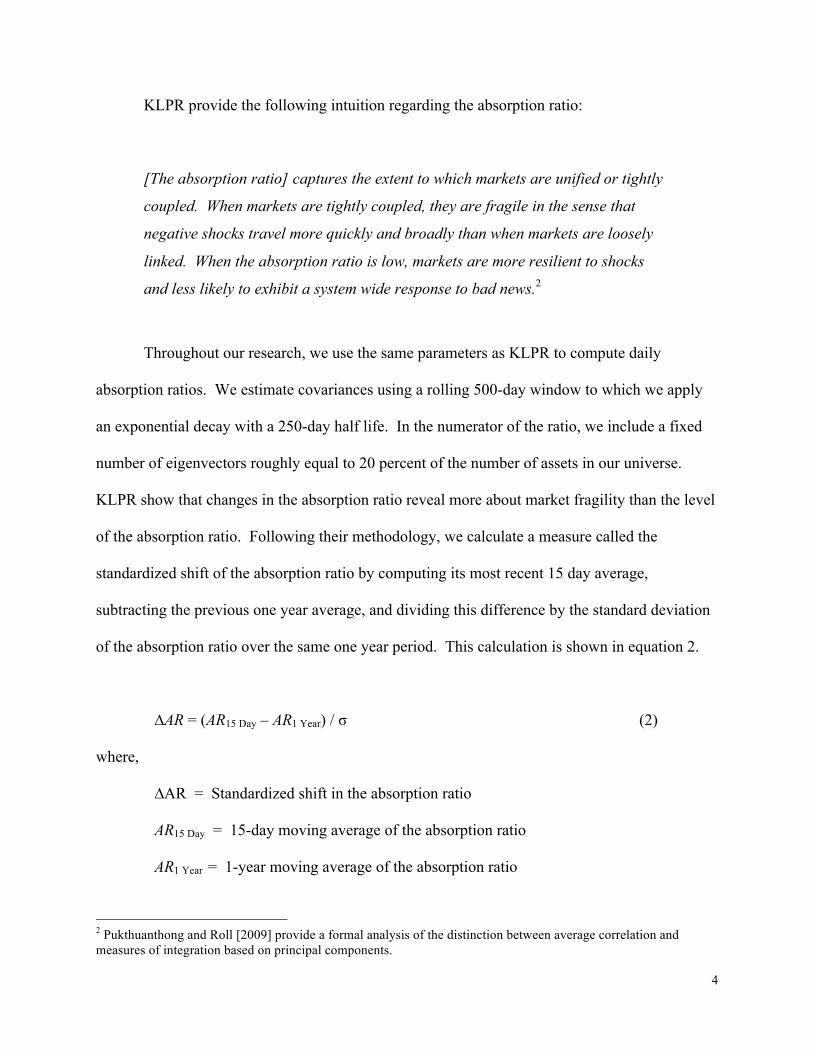
Throughout our research, we use the same parameters as KLPR to compute daily
absorption ratios. We estimate covariances using a rolling 500-day window to which we apply
an exponential decay with a 250-day half life. In the numerator of the ratio, we include a fixed
number of eigenvectors roughly equal to 20 percent of the number of assets in our universe.
KLPR show that changes in the absorption ratio reveal more about market fragility than the level
of the absorption ratio. Following their methodology, we calculate a measure called the
standardized shift of the absorption ratio by computing its most recent 15 day average,
subtracting the previous one year average, and dividing this difference by the standard deviation
of the absorption ratio over the same one year period. This calculation is shown in equation 2.
∆AR = (AR15 Day – AR1 Year) / σ (2)
where,
∆AR = Standardized shift in the absorption ratio
AR15 Day = 15-day moving average of the absorption ratio
AR1 Year = 1-year moving average of the absorption ratio
2 Pukthuanthong and Roll [2009] provide a formal analysis of the distinction between average correlation and measures of integration based on principal components.
5
σ = standard deviation of the absorption ratio over the 1-year period
The absorption ratio may be interpreted as a measure of market fragility. KLPR show
that all of the worst 1% monthly drawdowns in U.S. equities from 1998 through 2010 were
preceded by a standardized shift in the absorption ratio greater than one. The authors are quick
to point out that fragility by itself is not sufficient to cause market losses; however, they do find
that on average stock market returns are substantially negative following absorption ratio
increases and positive following absorption ratio decreases.
We performed a similar test which links the MSCI U.S. industry absorption ratio to the
probability of large losses in the aggregate MSCI U.S. index. Exhibit 2 contrasts the conditional
left tail of equity returns following an indication of low systemic risk with the conditional left tail
following an indication of high systemic risk. The curved line shows the 10th percentile left tail,
assuming normality and given the empirical mean and standard deviation of the full sample of
the U.S. equity returns from January 1998 through June 2011.

6
Exhibit 2: Realized left tail of one-week U.S. equity returns following high and low systemic risk
* Approximately 10 percent of the full sample empirical distribution lies below -3.0 percent.
We next show how to extend the absorption ratio to determine systemic importance.
An Algorithm for Measuring Systemic Importance
To capture an asset’s systemic importance, we begin by constructing a measure of centrality,
which takes into account three features:
1. It captures the asset’s vulnerability to failure.3
2. It captures how broadly and deeply an asset is connected to other assets in the system.4
3. It captures the riskiness of the other assets to which it is connected.
3 We use volatility as a proxy for vulnerability to failure. 4 By broad we mean the number of assets to which it is correlated, and by deep we mean the strength of its correlations.

7
In our view, none of these features by itself is a particularly effective measure of systemic
importance. For example, if a company is vulnerable to failure but not well connected, or well
connected but unlikely to fail, or even vulnerable to failure and well connected, but only to
companies that are themselves safe, then there is little reason to fear the failure of such a
company. But collectively, these features may offer the best observable indication of systemic
importance.
Here is how we proceed. We begin by noting a given asset’s weight (as an absolute
value) in each of the eigenvectors that comprise the subset of the most important eigenvectors
(those in the numerator of the absorption ratio). We then multiply the asset’s weight in each
eigenvector by the relative importance of the eigenvector, which we measure as the percentage
of variation explained by that eigenvector divided by the sum of the percentage of variation
explained by all of the eigenvectors comprising the subset of the most important ones. This
gives a measure of centrality, which is defined in equation 3.
(3)
where,
CSi = asset centrality score
ARj = absorption ratio of the j-th eigenvector
EVij = absolute value of the exposure of the i-th asset within the j-th eigenvector
∑
∑ ∑
=
= =
⎟ ⎟ ⎟ ⎟
⎠
⎞
⎜ ⎜ ⎜ ⎜
⎝
⎛
⋅
= n
j
j
n
j N
k
j k
j i j
i AR
EV
EV AR
CS
1
1 1

8
n = number of eigenvectors in the numerator of the absorption ratio
N = total number of assets
We must also account for the relative size of each asset, because this information is not
adequately reflected in securities returns. Before computing the absorption ratio or the centrality
scores, we adjust the weights of the assets in our sample by multiplying each historical return by
the square root of that asset’s market weight from the previous day. We use the square root of
market weights because large industries or companies are likely to be more connected, but at
some point connectivity reaches a saturation level; hence, we assume this relationship is non-
linear.5
In order to lend some intuition to the centrality metric, it might be helpful to think about
this computation using only the first eigenvector as the numerator in the absorption ratio. This
special case would be very similar to the technique used in Google’s PageRank algorithm (see
Brin and Page [1998]). Think of each security as a “node” on a map. By defining an
“importance score” as the sum of all of its neighbors’ importance scores (times some constant),
that score would equal precisely the weight of the asset in the first eigenvector.6 We instead use
several eigenvectors in the numerator of the absorption ratio because most of the time several
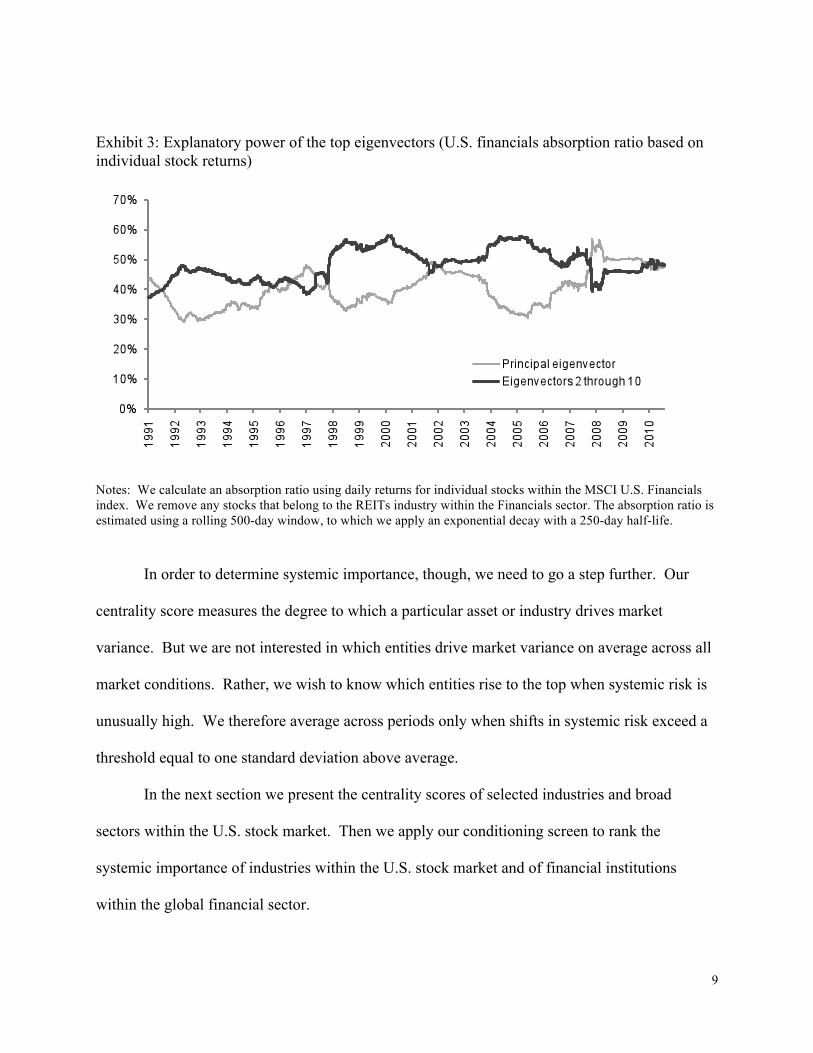
factors contribute importantly to market variance. For example, Exhibit 3 shows the explanatory
power of the principal eigenvector compared to the collective explanatory power of the second
through the tenth eigenvectors.
5 Others may prefer to use a different adjustment factor for market capitalization weights. Our findings are not highly sensitive to this choice. Other market weighting methodologies produced similar results. Furthermore, market capitalization is only one factor influencing centrality, and the centrality scores we derive are very different from capitalization weights. For example, the rank correlation of the centrality scores for the 25 largest firms in our global financial sector analysis with their respective capitalization weights is only 0.08. 6 For additional discussion of eigenvector centrality, see Bonacich [1972].
9
Exhibit 3: Explanatory power of the top eigenvectors (U.S. financials absorption ratio based on individual stock returns)
Notes: We calculate an absorption ratio using daily returns for individual stocks within the MSCI U.S. Financials index. We remove any stocks that belong to the REITs industry within the Financials sector. The absorption ratio is estimated using a rolling 500-day window, to which we apply an exponential decay with a 250-day half-life.
In order to determine systemic importance, though, we need to go a step further. Our
centrality score measures the degree to which a particular asset or industry drives market
variance. But we are not interested in which entities drive market variance on average across all
market conditions. Rather, we wish to know which entities rise to the top when systemic risk is
unusually high. We therefore average across periods only when shifts in systemic risk exceed a
threshold equal to one standard deviation above average.
In the next section we present the centrality scores of selected industries and broad
sectors within the U.S. stock market. Then we apply our conditioning screen to rank the
systemic importance of industries within the U.S. stock market and of financial institutions
within the global financial sector.

10
Results
We begin by applying the methodology to the MSCI U.S. GICS level 3 industries.
Exhibit 4 shows the centrality rank through time of three selected industries: commercial banks,
construction materials, and oil and gas. For ease of interpretation, we compute the percentile
rank of each industry relative to all other industries for which centrality scores were available at
that point in time.
Exhibit 4: Percentile rank of centrality score for selected U.S. industries
Notes: We calculate centrality scores using daily returns for MSCI U.S. GICS level 3 industries within the MSCI U.S. index. We use a rolling 500-day window, to which we apply an exponential decay with a 250-day half-life.
These results provide comfort that our methodology for determining centrality is sensible.
It shows that a sharp rise in the centrality of the construction materials industry during the
housing bubble, and it shows that oil and gas stocks have been a primary contributor to market
11
variance since 2006. Finally, it shows that commercial banks drove variance during the financial
crisis of the late 1990s and the more recent global financial crisis.
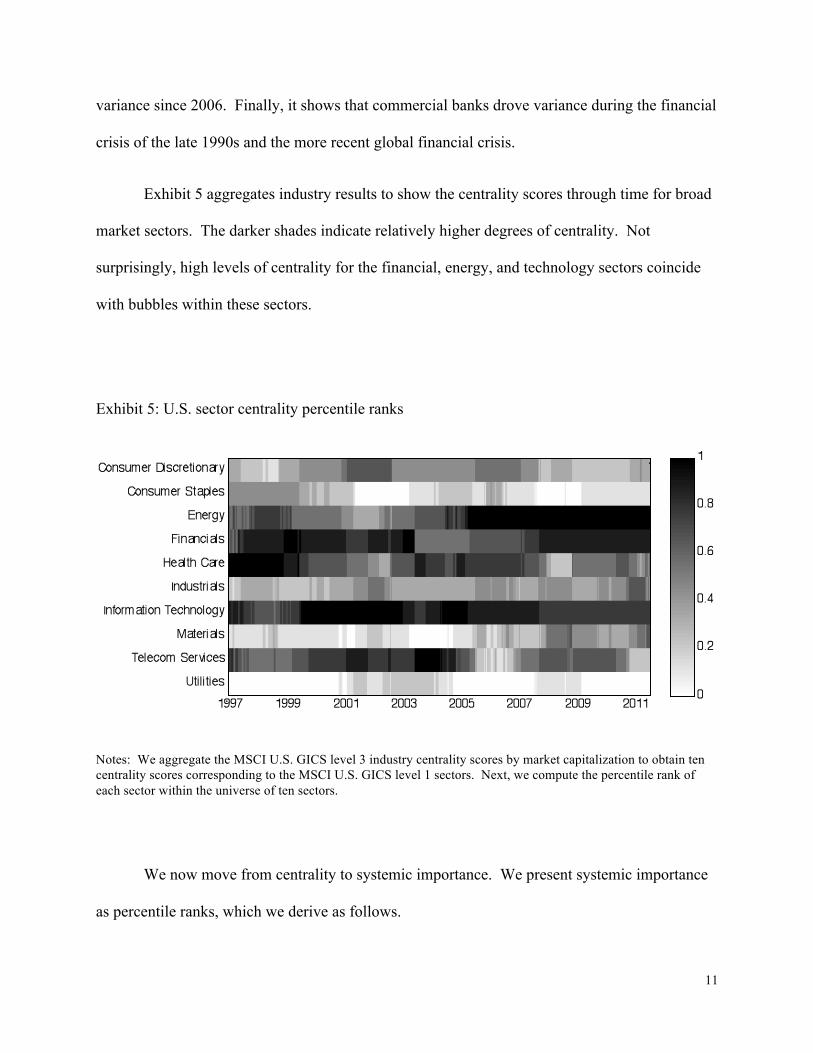
Exhibit 5 aggregates industry results to show the centrality scores through time for broad
market sectors. The darker shades indicate relatively higher degrees of centrality. Not
surprisingly, high levels of centrality for the financial, energy, and technology sectors coincide
with bubbles within these sectors.
Exhibit 5: U.S. sector centrality percentile ranks
Notes: We aggregate the MSCI U.S. GICS level 3 industry centrality scores by market capitalization to obtain ten centrality scores corresponding to the MSCI U.S. GICS level 1 sectors. Next, we compute the percentile rank of each sector within the universe of ten sectors.
We now move from centrality to systemic importance. We present systemic importance
as percentile ranks, which we derive as follows.
12
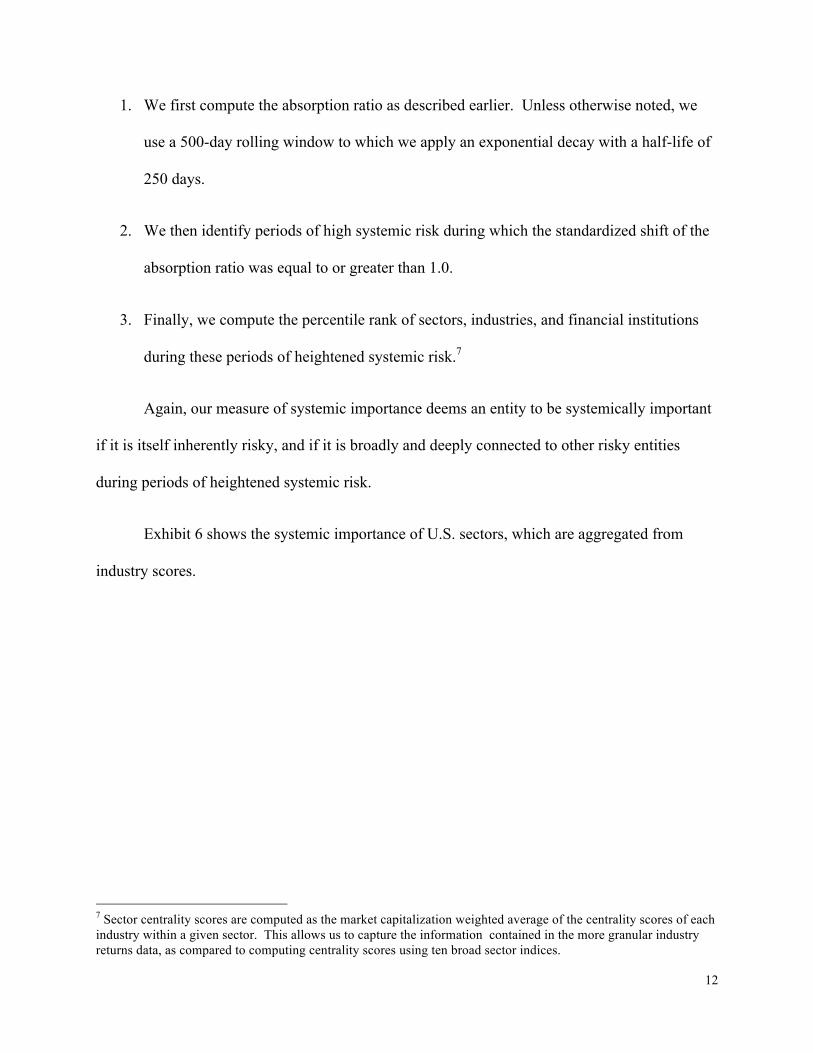
1. We first compute the absorption ratio as described earlier. Unless otherwise noted, we
use a 500-day rolling window to which we apply an exponential decay with a half-life of
250 days.
2. We then identify periods of high systemic risk during which the standardized shift of the
absorption ratio was equal to or greater than 1.0.
3. Finally, we compute the percentile rank of sectors, industries, and financial institutions
during these periods of heightened systemic risk.7
Again, our measure of systemic importance deems an entity to be systemically important
if it is itself inherently risky, and if it is broadly and deeply connected to other risky entities
during periods of heightened systemic risk.
Exhibit 6 shows the systemic importance of U.S. sectors, which are aggregated from
industry scores.
7 Sector centrality scores are computed as the market capitalization weighted average of the centrality scores of each industry within a given sector. This allows us to capture the information contained in the more granular industry returns data, as compared to computing centrality scores using ten broad sector indices.
13
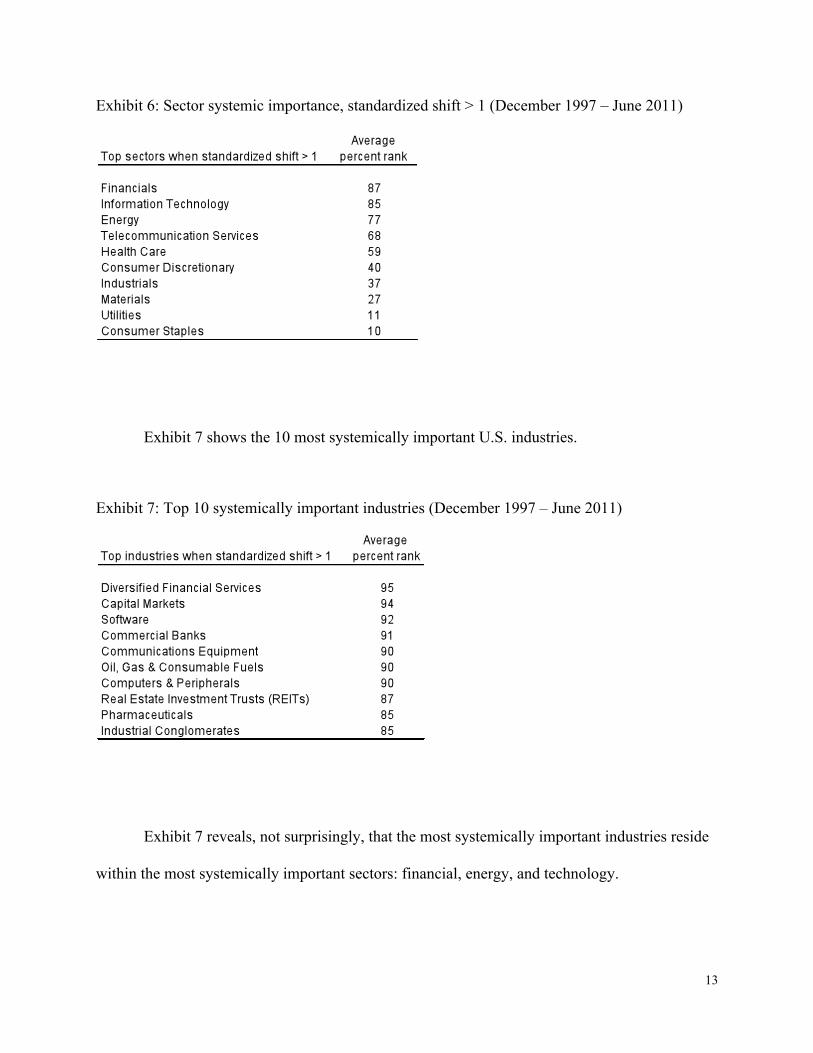
Exhibit 6: Sector systemic importance, standardized shift > 1 (December 1997 – June 2011)
Exhibit 7 shows the 10 most systemically important U.S. industries.
Exhibit 7: Top 10 systemically important industries (December 1997 – June 2011)
Exhibit 7 reveals, not surprisingly, that the most systemically important industries reside
within the most systemically important sectors: financial, energy, and technology.
14
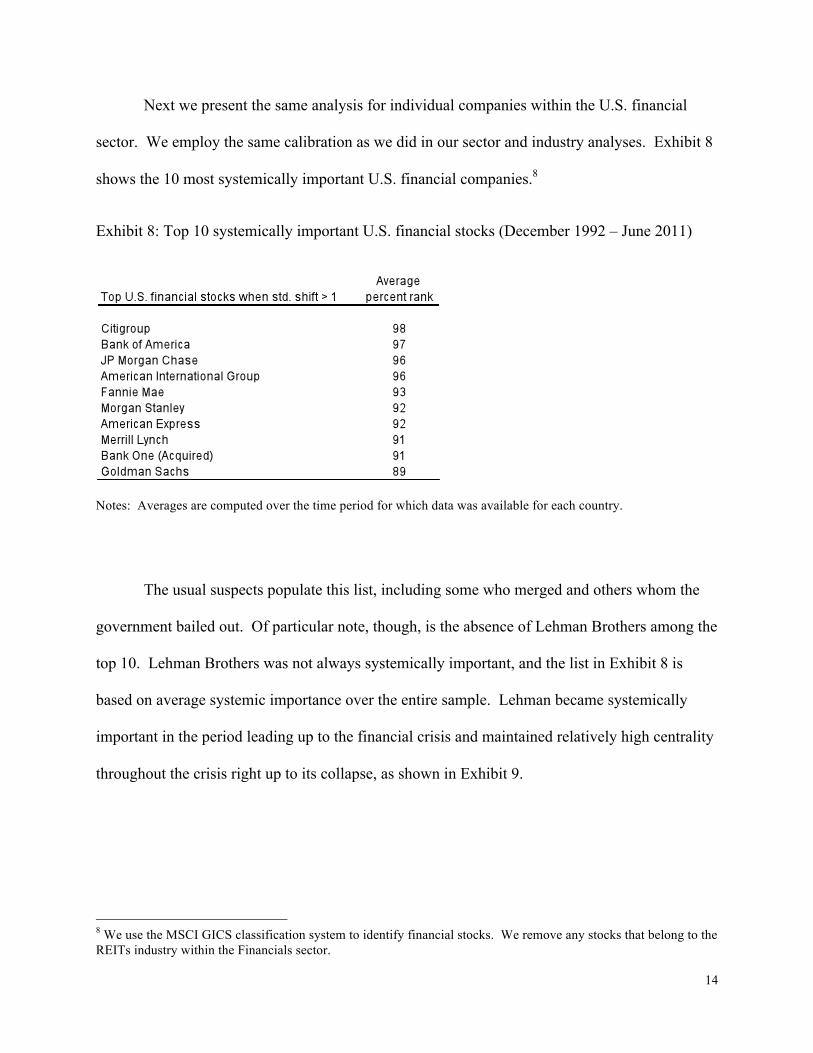
Next we present the same analysis for individual companies within the U.S. financial
sector. We employ the same calibration as we did in our sector and industry analyses. Exhibit 8
shows the 10 most systemically important U.S. financial companies.8
Exhibit 8: Top 10 systemically important U.S. financial stocks (December 1992 – June 2011)
Notes: Averages are computed over the time period for which data was available for each country.
The usual suspects populate this list, including some who merged and others whom the
government bailed out. Of particular note, though, is the absence of Lehman Brothers among the
top 10. Lehman Brothers was not always systemically important, and the list in Exhibit 8 is
based on average systemic importance over the entire sample. Lehman became systemically
important in the period leading up to the financial crisis and maintained relatively high centrality
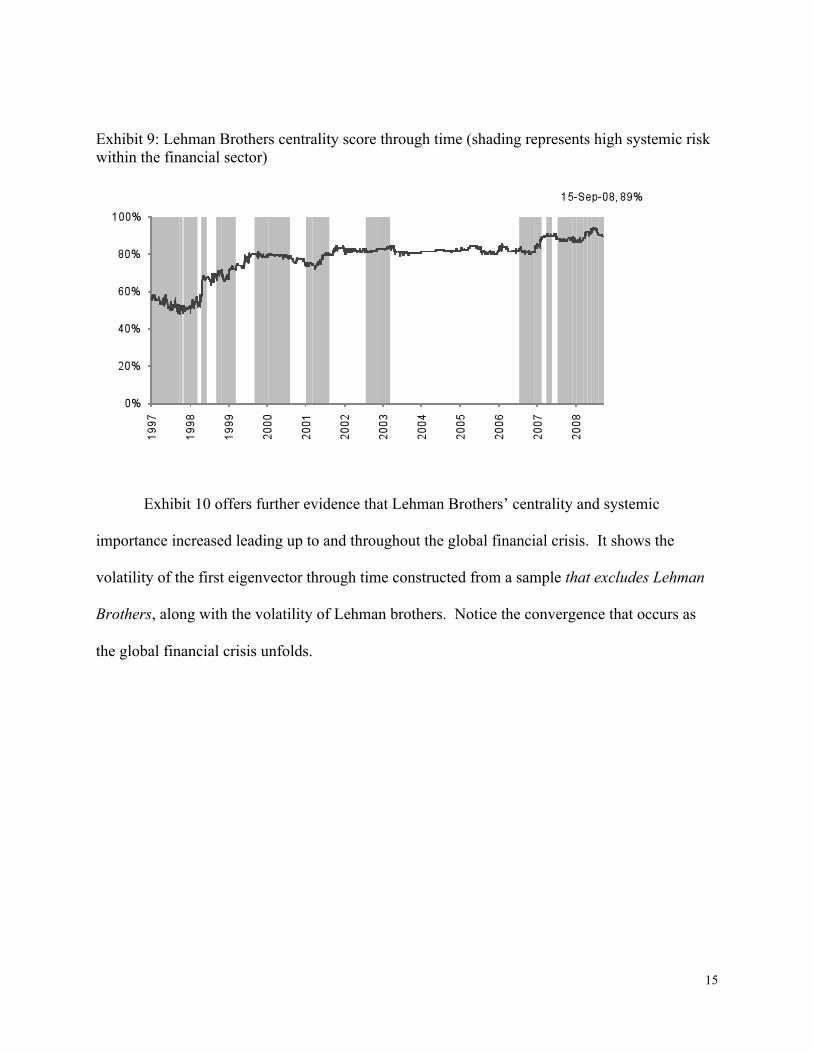
throughout the crisis right up to its collapse, as shown in Exhibit 9.
8 We use the MSCI GICS classification system to identify financial stocks. We remove any stocks that belong to the REITs industry within the Financials sector.
15
Exhibit 9: Lehman Brothers centrality score through time (shading represents high systemic risk within the financial sector)
Exhibit 10 offers further evidence that Lehman Brothers’ centrality and systemic
importance increased leading up to and throughout the global financial crisis. It shows the
volatility of the first eigenvector through time constructed from a sample that excludes Lehman
Brothers, along with the volatility of Lehman brothers. Notice the convergence that occurs as
the global financial crisis unfolds.

16
Exhibit 10: Daily volatility over the preceding two years
Notes: Both the eigenvector volatility and Lehman Brothers volatility are computed using the same parameters as before, including the 500-day rolling window with exponential weighting.
Next we apply our methodology to a global universe of financial stocks to measure each
company’s linkages with foreign firms in addition to domestic firms.9 In this setting we use
locally denominated returns to avoid introducing currency-related distortions. We also use
weekly returns to mitigate the problem of asynchronous market close times across time zones.10
9 Specifically, we look at stocks comprising the MSCI World Financials index as of November 2011, excluding REITs. 10 In order to obtain a sample of sufficient size, we use five years of weekly returns to compute covariances. We apply an exponential decay with a half life of one year. Our study covers 227 stocks. One might ask whether a sample size of 260 weekly returns is adequate to estimate eigenvectors reliably. We believe our results are robust for two reasons. First, our calculation is based exclusively on information contained in the top 20 percent of eigenvectors. These eigenvectors represent precisely the most important and stable part of the covariance matrix. In fact, a common technique for correcting poorly conditioned covariance matrices involves re-constituting the matrix based only on the most important eigenvectors. Second, we re-ran the global centrality scores while restricting our analysis to a subset of only the 50 largest stocks in our universe, which allows for a greater ratio of historical data points to number of assets. The results were nearly identical to those based on 227 stocks, with a rank correlation of 0.99.
17
Our approach to measuring systemic importance relies solely on the behavior of asset
prices, which gives it two virtues. It is simple and thus easily updated, and it captures risks and
linkages that may not be otherwise observable. It is limited, though, because it fails to consider
fundamental factors that may not be embedded in security prices.
On November 4, 2011, the global Financial Stability Board (FSB) released their list of 29
global systemically important financial institutions. The FSB study is based on data as of the
end of 2009, and seeks to identify “financial institutions whose distress or disorderly failure,
because of their size, complexity and systemic interconnectedness, would cause significant
disruption to the wider financial system and economic activity.” 11 They use a detailed
methodology designed by the Basel Committee on Banking Supervision, which involves
aggregating each institution’s scores across 12 fundamental indicators.12 Exhibit 11 highlights
the differences between our methodology and the FSB’s methodology.
11 Quotation is from the document Policy Measures to Address Systemically Important Financial Institutions, by the Financial Stability Board (FSB) on November 4, 2011. 12 See document by Basel Committee on Banking Supervision, 2011 (listed in references).

18
Exhibit 11: Comparison to the Financial Stability Board Methodology
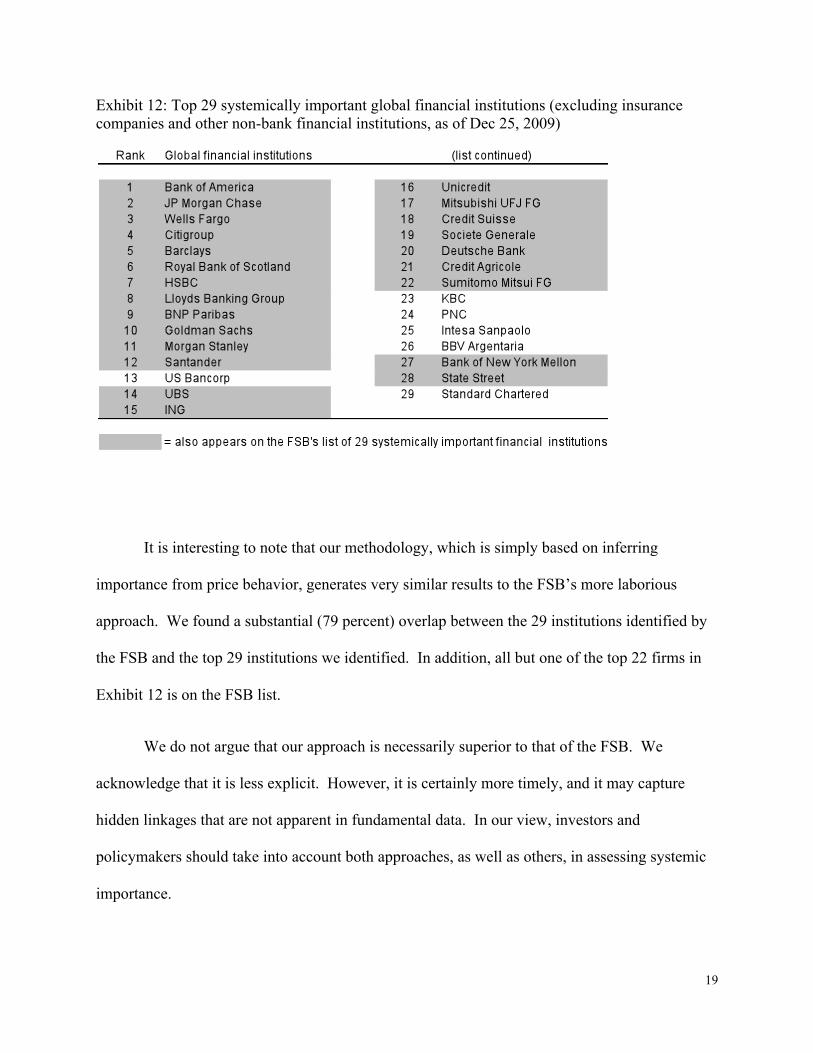
Exhibit 12 shows the top 29 systemically important global financial institutions using our
methodology. We use data as of the end of 2009, and we remove insurance companies and other
non-bank financial institutions, to facilitate comparison with the FSB’s list.
19
Exhibit 12: Top 29 systemically important global financial institutions (excluding insurance companies and other non-bank financial institutions, as of Dec 25, 2009)
It is interesting to note that our methodology, which is simply based on inferring
importance from price behavior, generates very similar results to the FSB’s more laborious
approach. We found a substantial (79 percent) overlap between the 29 institutions identified by
the FSB and the top 29 institutions we identified. In addition, all but one of the top 22 firms in
Exhibit 12 is on the FSB list.
We do not argue that our approach is necessarily superior to that of the FSB. We
acknowledge that it is less explicit. However, it is certainly more timely, and it may capture
hidden linkages that are not apparent in fundamental data. In our view, investors and
policymakers should take into account both approaches, as well as others, in assessing systemic
importance.
20
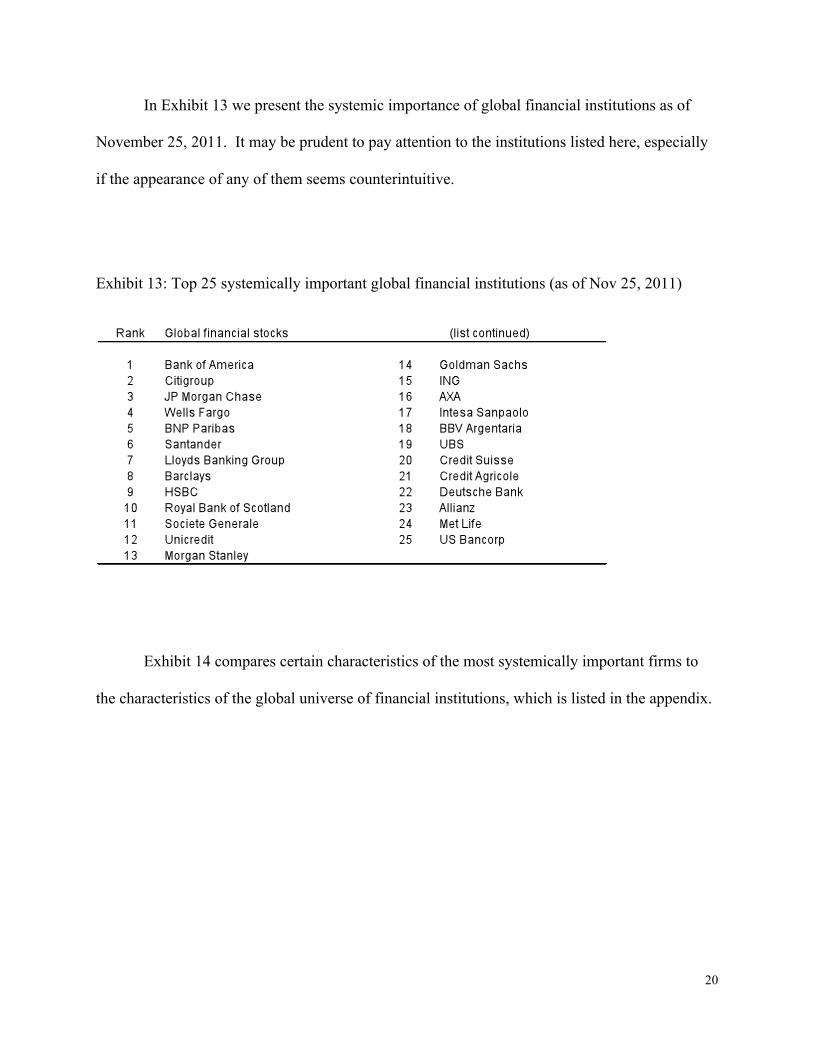
In Exhibit 13 we present the systemic importance of global financial institutions as of
November 25, 2011. It may be prudent to pay attention to the institutions listed here, especially
if the appearance of any of them seems counterintuitive.
Exhibit 13: Top 25 systemically important global financial institutions (as of Nov 25, 2011)
Exhibit 14 compares certain characteristics of the most systemically important firms to
the characteristics of the global universe of financial institutions, which is listed in the appendix.
21
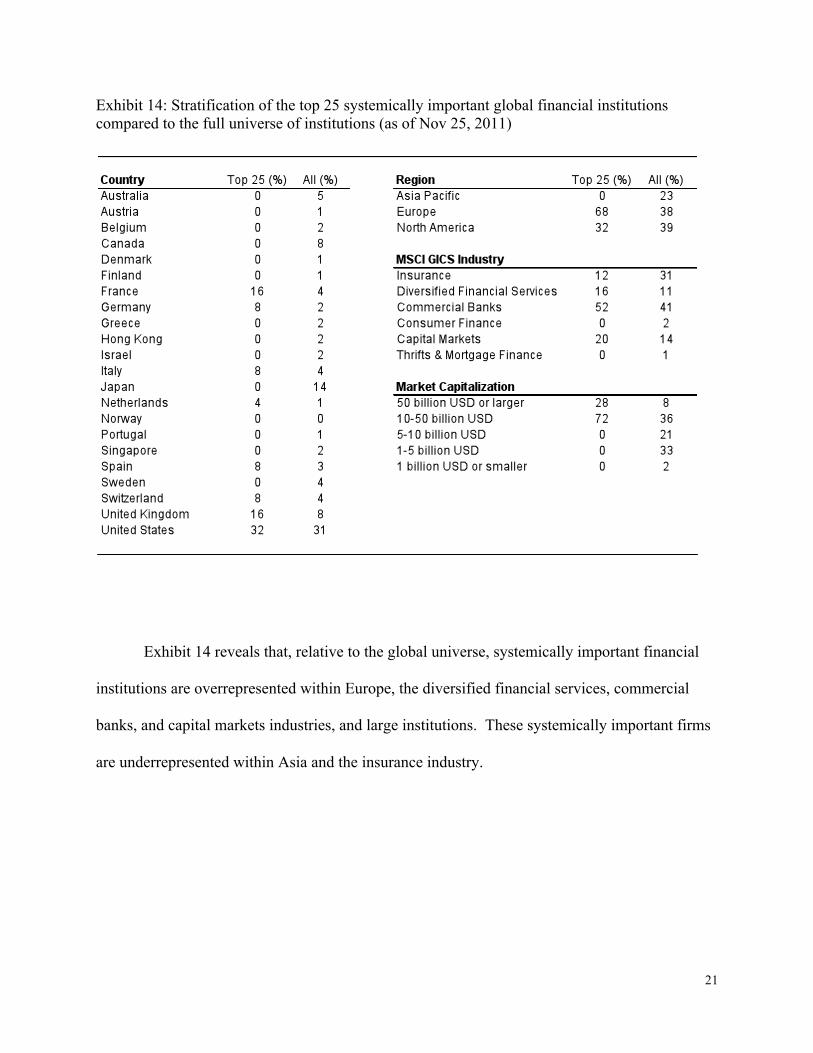
Exhibit 14: Stratification of the top 25 systemically important global financial institutions compared to the full universe of institutions (as of Nov 25, 2011)
Exhibit 14 reveals that, relative to the global universe, systemically important financial
institutions are overrepresented within Europe, the diversified financial services, commercial
banks, and capital markets industries, and large institutions. These systemically important firms
are underrepresented within Asia and the insurance industry.

22
Conclusion
We introduce a methodology for determining systemic importance that captures an
asset’s riskiness and connectivity to other risky assets during periods of high systemic risk.
Our empirical findings suggest, not surprisingly, that entities associated with finance,
energy, and technology are the most systemically important. We also show, what is obvious by
hindsight, that Lehman Brothers was one of the most systemically important financial
institutions leading up to the global financial crisis. Our methodology, however, would have
revealed the increasing systemic importance of Lehman Brothers nearly two years before it
collapsed.
Our final analysis ranks the systemic importance of global financial institutions as of
November 2011. We urge readers to heed these results, but to interpret them with due
circumspection. Our measure is not an indication of an entity’s financial strength or weakness,
nor is it a gauge of creditworthiness or a predictor of investment performance. It is a statistical
representation of an entity’s vulnerability to failure and connectivity to other risky entities,
derived solely from historical returns and ignoring current fundamental information.
23
References
Basel Committee on Banking Supervision. 2011. “Global systemically important banks: Assessment methodology and the additional loss absorbency requirement.” Bank for International Settlements, Consultative Document (October).
Billio, M., M. Getmansky, A. Lo and L. Pelizzon. 2010. “Measuring Systemic Risk in the Finance and Insurance Sectors.” MIT Sloan School Working Paper 4774-10 (March 17).
Bonacich, P. 1972. “Factoring and Weighting Approaches to Status Scores and Clique Identification.” Journal of Mathematical Sociology, 2:113-120.
Brin, S. and L. Page. 1998. “The anatomy of a large-scale hypertextual Web search engine.” Computer Networks and ISDN Systems, 33:107-17.
Financial Stability Board. 2011. “Policy Measures to Address Systemically Important Financial Institutions,” (4 November).
Haldane, A. 2009. “Rethinking the financial network.” Speech delivered at the Financial Student Association, Amsterdam. (April).
Kritzman, M., Y. Li, S. Page and R. Rigobon. 2011. “Principal Components as a Measure of Systemic Risk.” The Journal of Portfolio Management, vol. 37, no. 4 (summer):112-126.
Pukthuanthong, K. and R. Roll. 2009. “Global Market Integration: An Alternative Measure and Its Application.” Journal of Financial Economics, vol. 94:214-232.
24
Appendix
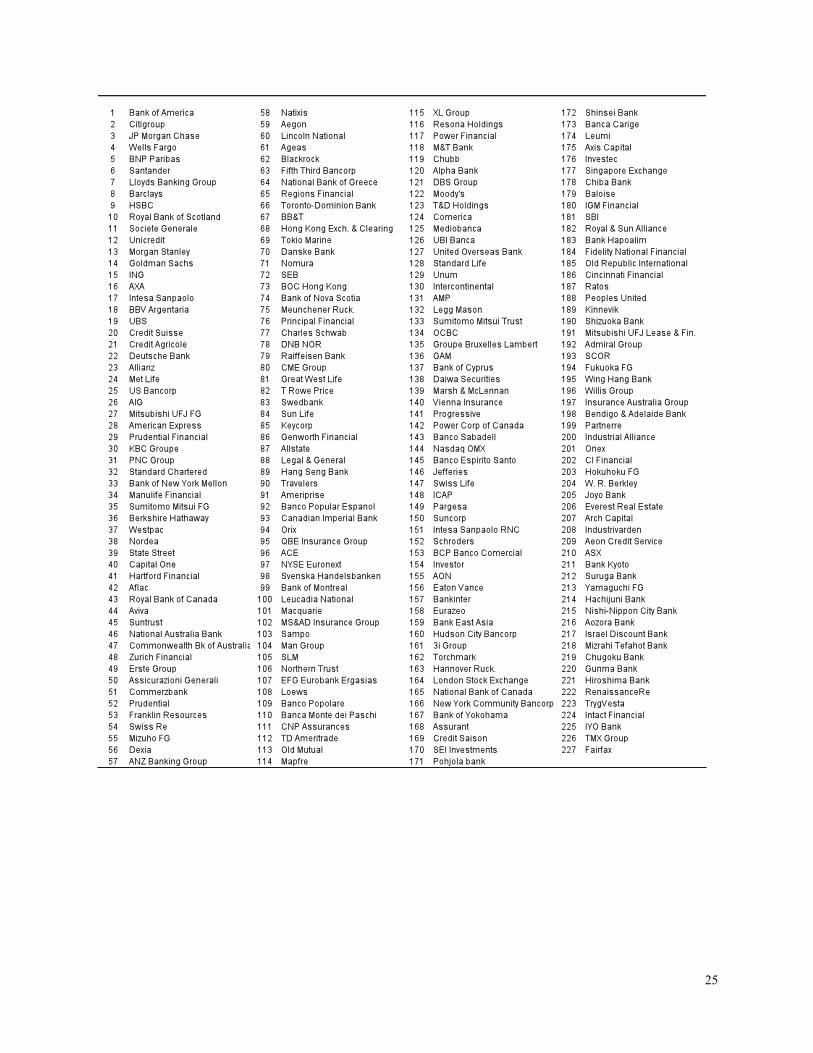
Exhibit A1 extends Exhibit 13 to show the rankings of all global financial institutions
included in our analysis, as of November 25, 2011.
Exhibit A1: Ranked systemically important global financial institutions (as of Nov 25, 2011)
25