toward nutrition education for adults: a systematic approach
TRANSCRIPT

University of WollongongResearch Online
Faculty of Health and Behavioural Sciences - Papers(Archive) Faculty of Science, Medicine and Health
2007
Toward nutrition education for adults: A systematicapproach to the interface design of an online dietaryassessment toolY. C. ProbstUniversity of Wollongong, [email protected]
L. LockyerUniversity of Wollongong, [email protected]
Linda C. TapsellUniversity of Wollongong, [email protected]
D. SteelUniversity of Wollongong, [email protected]
O. McKerrowUniversity of Wollongong, [email protected]
See next page for additional authors
Research Online is the open access institutional repository for the University of Wollongong. For further information contact the UOW Library:[email protected]
Publication DetailsThis article was originally published as Probst, YC, Lockyer, L, Tapsell, LC, Steel, D, McKerrow, O and Bare, M, Toward nutritioneducation for adults: A systematic approach to the interface design of an online dietary assessment tool, International Journal ofLearning Technology, 3(1), 2007, 32-50.

Toward nutrition education for adults: A systematic approach to theinterface design of an online dietary assessment tool
AbstractTo support nutrition-related behavioural change, a dietitian can offer tailored educational programmes basedon patients’ specific dietary behaviours. A model has been developed to integrate learning technologies intothis process. This tool allows patients to self-report their dietary intake, creating awareness, and to receiveindividually tailored dietary advice from their General Practitioner (GP) via a dietitian, to assist with change.This article examines how a step-wise approach to the interface design has allowed a multidisciplinaryapproach to automated dietary assessment to be undertaken. Concentrating on the identification of corefoods and on the questionnaire format using an outline of the diet history interview, the design features of theprogramme used focus groups with end users and in-depth discussion between the multidisciplinary team.The development of an online self-administered dietary assessment programme must ensure outcome goalsare met whilst upholding the simplicity of the interface design to allow a larger number of patients access tothe programme. Original journal article available here
Keywordsnutrition education, evaluation studies, software design and development, primary health care, behaviourchange, dietary assessment
DisciplinesArts and Humanities | Life Sciences | Medicine and Health Sciences | Social and Behavioral Sciences
Publication DetailsThis article was originally published as Probst, YC, Lockyer, L, Tapsell, LC, Steel, D, McKerrow, O and Bare,M, Toward nutrition education for adults: A systematic approach to the interface design of an online dietaryassessment tool, International Journal of Learning Technology, 3(1), 2007, 32-50.
AuthorsY. C. Probst, L. Lockyer, Linda C. Tapsell, D. Steel, O. McKerrow, and M. Bare
This journal article is available at Research Online: http://ro.uow.edu.au/hbspapers/118

1
Toward nutrition education for adults: A systematic approach to the
interface design of an online dietary assessment tool
Ms Yasmine C Probst BSc, MSc, APD
PhD Candidate, Smart Foods Centre, University of Wollongong, NSW 2522, Australia
Phone: (02) 4221 5302, Fax: (02) 4221 4844, Email: [email protected]
Dr Lori Lockyer BA(Hons), MLIS, PhD
Director Digital Media Centre, Senior Lecturer, Faculty of Education, University of
Wollongong, NSW 2522, Australia.
Phone: +612 4221 5511, Fax: +612 4221 4321, Email: [email protected]
Prof Linda C Tapsell BSc, DipNutDiet, MHPEd, PhD, APD
Director, National Centre of Excellence in Functional Foods, University of Wollongong,
NSW 2522, Australia. Phone: +612 4221 5302, Fax: +612 4221 4844, Email:
Prof David Steel BSc, MSc, PhD
Director, Centre for Statistical and Survey Methodology, University of Wollongong, NSW
2522, Australia. Phone +612 4221 3823, Fax: +612 4221 4845, Email: [email protected]

2
Mr Owen McKerrow BCompSc, BCA
Webmaster, Educational Media Laboratory, University of Wollongong, NSW 2522,
Australia.
Phone: +612 4221 5517, Fax: +612 4221 4321, Email: [email protected]
Ms Marian Baré BSc(Hons), MSc
Research Assistant, Human Nutrition Unit, School of Molecular & Microbial Sciences,
University of Sydney, NSW 2006, Australia. Phone: +61 2 9351 2235 Fax: +61 2 9351 4726,
Email: [email protected]
Corresponding author: Yasmine C Probst
Biographical notes:
� Yasmine Probst is a PhD Candidate of the Smart Foods Centre, Australia. Her
thesis is set in the area of automated dietary assessment and its implications on
the patient.
� Lori Lockyer is Head, Division of Educational Development, Graduate School of
Medicine, Director of the Digital Media Centre and Senior Lecturer in
Information Technology in Education. She has been involved in designing,
developing, implementing and researching impact of technology-based health
and professional education.

3
� Linda Tapsell is director of the National Centre of Excellence in Functional
foods and is involved in both theoretical and practical research in the area of
nutrition and dietetics.
� David Steel is the director of the Centre for Statistical and Survey Methodology
with a research focus in survey methodology, sample survey design and analysis
methods for complex social and economic data.
� Owen McKerrow is the webmaster of the Educational Media Centre. He leads
the development of online solutions for the faculty, liaising with clients as well
as overseeing the web development process
� Marian Baré is a research assistant of the Human Nutrition Unit. She is involved
in the testing of the glycaemic index of food items.

4
Abstract
Background. Many lifestyle diseases can be managed by diet. To support nutrition-
related behaviour change, a dietitian can offer tailored educational programs based on
patients’ specific dietary behaviours. Patients however value their GPs advice about
nutrition. Therefore increased involvement of the GP in the area of nutrition is vital. A
model has been developed to integrate learning technologies into this process. For this
online for self-administered dietary assessment application, the GP refers the patient to
the system, a dietitian compiles a dietary prescription from the patients’ electronic data
and send it to the GP. This allows for a greater number of patients with lifestyle diseases
to receive individualised dietary advice.
Objectives. To report on the key components of interface development, including the
identification of core reference foods using statistical analyses, the assessment of face
validity and the multimedia questionnaire design from comments by academic personnel
and from focus group discussion sessions with potential users.
Methods. Key components of interface development for software set in the primary
healthcare setting were described. Concentrating on the identification of core foods and
questionnaire format using an outline of the diet history interview, the design features of
the program were attended to through in-depth discussion between the multidisciplinary
team.
Results. Outcomes of focus group discussion sessions saw a modification from a
desktop-based to online interface. The core foods were collapsed from the 106 of the
Australian Bureau of Statistics National Nutrition Survey, down to 98 groups via

5
statistical analysis. Food group names were changed to simplify the visual interface
design, to allow identification of foods by the layperson user and to reduce the time
required for completion of the dietary assessment by reducing the amount of reading
involved.
Conclusion. Development of an online self-administered dietary assessment program
must ensure outcome needs are met whilst upholding simplicity of the interface design.
This will allow a broader number of patients access to the program as it will be suited to
all levels of computer experience.
Key Words. Nutrition education, evaluation studies, software design and development,
primary health care, behaviour change, dietary assessment.

6
Introduction
For people with type 2 diabetes, a critical issue is managing their health behaviours
particularly in terms of exercise and nutrition. In terms of patient education to support
nutrition-related behaviour change, a dietitian can offer tailored programs based on
patients’ specific dietary behaviours. However, despite the growing number of
dietitians, the general public still has more confidence in the nutrition-related advice
given by their general practitioner (GP).1, 2
Yet, doctors often feel that they cannot
always provide the information and thus educational intervention that is required.1, 3
Factors contributing to this perspective include time restrictions for patient encounters,
lack of confidence2, 4
and the limited nutrition-related training obtained during their
medical school and continuing education programs.1 This translates to only 15-17% of
doctors reporting an interest in the area of nutrition.4 Attempts are being made to
educate GPs about nutrition issues for their patients. However, limited time available
for professional development and the vast number of topic areas means such programs
cannot always address all nutrition issues or those specificity related to disease and
patient profiles. GPs are also able to spend significantly less time being involved in
patient education activities.5 The average consultation in Australian general practice is
14.6 minutes and in the United States of America it is 8 minutes.6 This timeframe does
not allow for assessment of the dietary intake and in-depth discussion about food and
nutrient interactions for disease management. Length of consultation is also the primary
reason why many doctors opt for medical, rather than educational, intervention for their

7
patients.7-10
Therefore, incorporating nutrition education into the patient consultations
appears to be a challenge.
When GPs do engage in nutrition counselling, they often provide generic dietary advice
to their patients. This disregards the opportunity for patients to further learn about the
implications of what they eat upon their health. Although many patients may be referred
by their GP to see a dietitian, practical limitations exist when considering this step in the
management of their disease. The large number of patients presenting to a GP may not
always wish to pay to see a dietitian.11, 12
Dietitians and GPs are rarely co-located and
thus time and transportation become considerations. Further, the process of undertaking
a diet history is time consuming - often ranging from 45-60 minutes.
The study reported here sought to overcome these limitations and facilitate a clinical
nutrition education partnership. The study sought to explore how learning technologies
might facilitate this partnership. The intervention involves GP referral of patients to a
progrm which includes online collection of dietary intake data via computer in the GP
surgery (or another location convenient to the patient). Data are analysed by a dietitian
who a tailors a dietary prescription which is in turn communicated to and followed up
with the patient through their GP.
While online diet assessment and advice applications are available, they have limited
capacity to provide individualised dietary and nutrition behaviour prescriptions.13
Computer-based dietary intake data collection brings with it advantages and
8
disadvantages.14
Advantages include less missing data, standardisation of the interview
(reduced interviewer bias), provision of a stimulating interactive environment, and speed
of processing. Limitations due to computer literacy and typing skills, rigidity of the
interview and initial costs are disadvantages. These issues need to be taken into account
when structuring systems and designing the related interface for collecting a person’s
dietary information. Thus, potential users are best placed to inform the design of such
systems.
Computer-based nutrition programs available to patients focus on either the dietary
assessment process or nutrition education -- very few are able to combine the two
adequately. A patient’s awareness of their diet needs to be generated before educational
interventions can be meaningful. This requires the dietitian having the full picture of the
patient’s dietary habits.
This is difficult with currently available programs that use closed questioning schemes 13
and assess the actual intake of the patient. Few programs use open-ended questioning,15
an area for further exploration in the area of dietary assessment. For example, an initial
attempt at using computer technology for the dietetic interview in the 1970’s, where
simple one word responses were required found that subjects felt they could not express
themselves completely and could not explain additional aspects of their diets, even the
though the program took longer (25-110min, average 63.6min) than the face-to-face
interview with the dietitian.16
One of the lessons from this exercise may be that the
9
computer program should not be required to collect all aspects of data and that staged
completion of the dietary assessment may be less burdensome.
Automating the process of dietary assessment involves the identification of the type of
assessment method to be utilised and then mapping the steps to be taken to obtain the
required dietary information associated with the chosen method. A number of
assessment methods exist:
• the food record involves a patient recording exactly what and how much has
been eaten for a select period of days;17
• the food frequency questionnaire involves a dietitian asking a range of
questions relating to specific foods to obtain a spectrum of the patient’s intake
over a select period of time;18
• in the 24-hour recall interview the patient is asked to report on the last 24 hours
of food (types and amounts) eaten; and,
• during the diet history interview the patient is asked to recall of their usual diet
including details on foods, amounts and frequency of consumption over a period
of time (e.g., one week, two weeks, or one month).19
The diet history interview allows the interviewer to capture a picture of the eating
patterns of the patient. Capturing the usual intake of a person through the diet history
creates awareness of the intake and allows for the development of individualised dietary
advice. By tailoring advice to the specific intakes of the person, there is an increased
chance of dietary change.20, 21
Patients may learn about the food choices that are not
benefiting their health and will have the ability to change these choices accordingly. By

10
tailoring to the individual, chances of long-term behavioural modifications are also
increased.22
Limitations for change will, however, depend upon the individual’s current
position in the Stages of Change Model.23
This will primarily influence their
willingness to accept and act upon the recommendations given. If a patient is currently
in the contemplation stage, individualised advice may be the trigger for the patient to
progress to the action stage. This relationship has been identified in many dietary
studies in relation to fat,24, 25
fibre,26
and alcohol intakes.
The aim of this article is to describe the systematic approach undertaken in the design of
an online dietary intake data collection tool aimed at being an initial and key step toward
implementing a nutritional education program involving general practitioners, dietitians
and patients with metabolic syndrome – a condition which comprises of type 2 diabetes
mellitus, impaired glucose tolerance, overweight/obesity, hypercholesterolemia and/or
hypertension.27
This software tool should allow patients to self-report their dietary
intake, creating awareness, and receive individually tailored dietary advice from their
GP via a dietitian, to assist with change.
Methods
In order to design a software tool which allows automation of a dietary assessment
process, many stages must be undertaken. All design features of the program were
addressed through a progressive review of the program by the multidisciplinary study
team which included statisticians, dietitians, computer technicians, instructional

11
designers, graphic designers, web designers, general practitioners, patients and survey
analysts. The reviews took the form of formal meetings and trial interactions with the
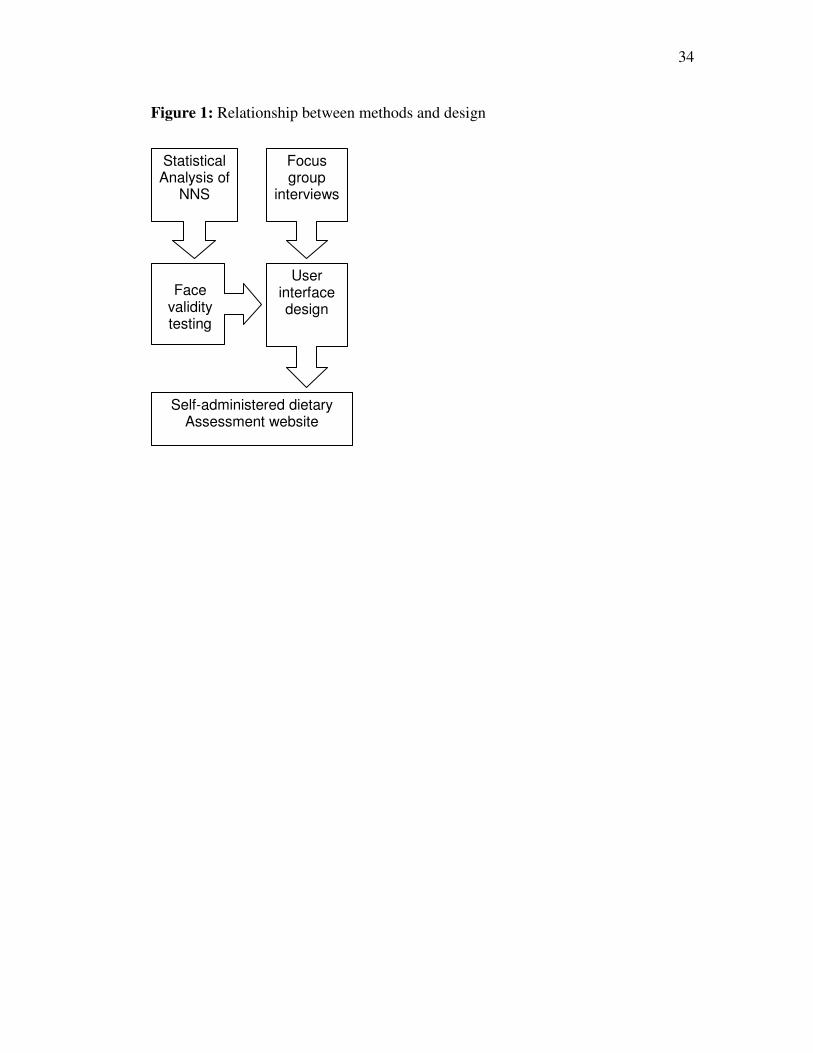
potential software layouts at each stage of its design. These stages included:
• conceptualisation of the design concept;
• focus group discussion sessions with potential users;
• the identification of core reference foods using statistical analyses of the
Australian Bureau of Statistics (ABS) National Nutrition Survey (NNS) data;
• the assessment of face validity of these foods; and,
• the multimedia questionnaire design for the user interface.
Figure 1 illustrates the steps within this systematic approach. Ethics approval for the
study was provided by the host institution’s human research ethics committee.
[INSERT FIGURE 1]
Conceptualisation of design
Automation of the dietary assessment process has been considered,13
but is primarily
used to address actual (daily) rather than usual (average) dietary intake of a person. The
usual dietary intake has only been automated in a few cases. And, these have been
limited by the complexity of the normal face-to-face interview such as the use of food
models and utensils as cognitive guides28
and the communication abilities of a
professional interviewer.29
Collection of dietary intake data is further complicated by
tendencies of patients to over- or under-report their food intake,30-32
It has been
identified that the use of a self-administered technique, whether pen-and-paper or
computerised, decreases the patient bias when responding to questions, especially those
12
of a socially-undesirable nature, when an interviewer is not present.14, 33
Therefore,
allowing the patient to enter their own dietary data into a computer system may result in
a decreased bias in responses when compared with those of the face-to-face dietary
interview. Where involvement of the dietitian is vital to the process is in the advice-
giving stage such that nutritional education can be tailored to each patient.
This method of individualised dietary management is vital for the increasing number of
patients in the population with metabolic syndrome, a lifestyle related condition that can
be managed by dietary intervention.34
Focus group discussion sessions
Before design and development of the online tool began, potential users were recruited
for focus group discussions. These sessions allowed the research team to identify issues
of interface design and system functionality preferred by the population group and also
refine the initial idea to suit the lifestyles and levels of computer experience of the target
population. Focus groups were held at the host institution and details of the preferred
design concepts are reported in detail elsewhere.35
Potential users are persons who have been diagnosed with metabolic syndrome (and/or
self-identified as being 40 years of age or older and overweight). For these focus group
sessions, participants were recruited from volunteers of another dietary intervention trial
involving patients with type 2 diabetes mellitus. All participants had consented to
further contact. Participants were asked to take part in a multi-option telephone

13
questionnaire and focus group discussion session. The questionnaire was used to
determine demographic information such as age, gender, level of education, computer
experience and a brief medical background. The focus groups addressed the participant
preferences for involving their GP in the nutrition management of their diabetes and
their thoughts on putting a computer in the GP practice waiting rooms for dietary
assessment. Five focus groups of 6-8 participants were formed. All focus groups were
recorded using micro-cassette recorders.
The data obtained from the telephone questionnaires was numerically coded and
analysed to determine the proportion of responses per question. Focus group data was
transcribed verbatim and all transcripts were check for accuracy by an external assistant
before coding of the data. A framework for thematic grouping was developed prior to
coding in NVivo qualitative analysis software (QSR International, v2.0.161). Data was
sorted based on computer use, software features, nutrition programs and dietary
analysis. This paper reports on the involvement of the GP in the area of nutrition, a topic
which was coded under the dietary analysis theme.
Statistical analysis & core food group development
To provide the theoretical framework for the program, existing Australian food data was
analysed. Theoretical framework, or food hierarchy, for the design of this program
would include the food and nutrient database from which the assessment will be drawn.
Data from the National Nutrition Survey (NNS) of 1995 36
is a key indicator of dietary
intake within the Australian population. The dietary survey was conducted on over

14
13000 people within the Australian population and used a hierarchical system of
categorising all of the food items reported. As the NNS is the most recent nationwide
survey of dietary intake, this was used as the basis for theoretically developing the food
hierarchy This food hierarchy would become the underlying key to the program around
which all food intake questions were based. The difference between the hierarchy
described in this paper and that of the NNS is the stage at which the hierarchy was
developed. The current hierarchy was developed before the food data has been obtained,
whereas the NNS hierarchy was developed after all food data was collected.
The original NNS data was assessed for errors which may effect the reporting of dietary
data. This was aimed to determine the minimum number of food groups that were
needed to be able to capture a reasonable ‘picture’ of a person’s usual dietary intake.
Commonly consumed foods of the NNS population were then identified using a cut-off
at 99% of the population. These foods could all be grouped into meals as NNS had
coded each of the items accordingly. Food associations were then analysed for those
foods which were commonly eaten together. If food A was eaten with food B more than
50% of the time it was said to be associated. For example tea was identified to be
commonly consumed with milk and sugar. Cluster analysis using the Ward method,
average linkage and complete linkage method 37
to determine the similarities in nutrient
composition of the NNS food groupings were employed to re-arrange the NNS food
groups based on a nutritional foundation. These cluster analyses were performed for all
macronutrients (total energy, protein, carbohydrate, saturated fat, monounsaturated fat
and polyunsaturated fat). Initially all 497 groups (the entire data set) were clustered

15
based on their macronutrient similarities. This cluster analysis saw groups of foods
formed including foods such as custard and pasta due to their similar carbohydrate
content. These foods are however not conceptually similar for the layperson and
therefore separate subcategories of the NNS underwent cluster analysis.
User interface design
The theoretical data from the food hierarchy developed through statistical analysis
needed to be applied to the practical aspects of the diet history interview for the
interface design of the online tool. Using an outline of a traditional diet history
interview,29
the meal questions such as ‘Do you eat breakfast?’ and ‘How often do you
eat breakfast?’ were mapped out based on foods consumed at breakfast, between
breakfast and lunch, lunch, between lunch and dinner, dinner and after dinner. Sections
of the food hierarchy could then be allocated to questions on each meal depending on
regularity of intake per meal.
The final phase of the development of the food hierarchy would require face validity
testing and the renaming of food groupings to suit the target population. This involved
five dietitians and was undertaken prior to interface design initiation. These dietitians
created an outline of foods they believed to be important within the diet history
interview. Foods from this list were systematically merged with the statistically
developed food hierarchy using a consensus method to ensure foods commonly reported
in a diet history interview had been included. For example if spaghetti bolognaise was
identified by the dietitians it could be included under pasta with a meat-based sauce.

16
Renaming of food categories was necessary as the NNS groups were created for data
analysts to sort foods rather than for the layperson to find a food. To ensure persons
with minimal nutrition knowledge would be able to identify the group into which a
reported food might fall, the dietitians again used a consensus method to form new
group names. For example ‘Coffee, made with milk, from ground, decaffeinated, NS as
to strength’ in the NNS could become ‘Coffee’ with the option to add milk in the food
hierarchy. This is important as the program would be used by patients and not dietitians
or GPs.
Results
Conceptualisation of design
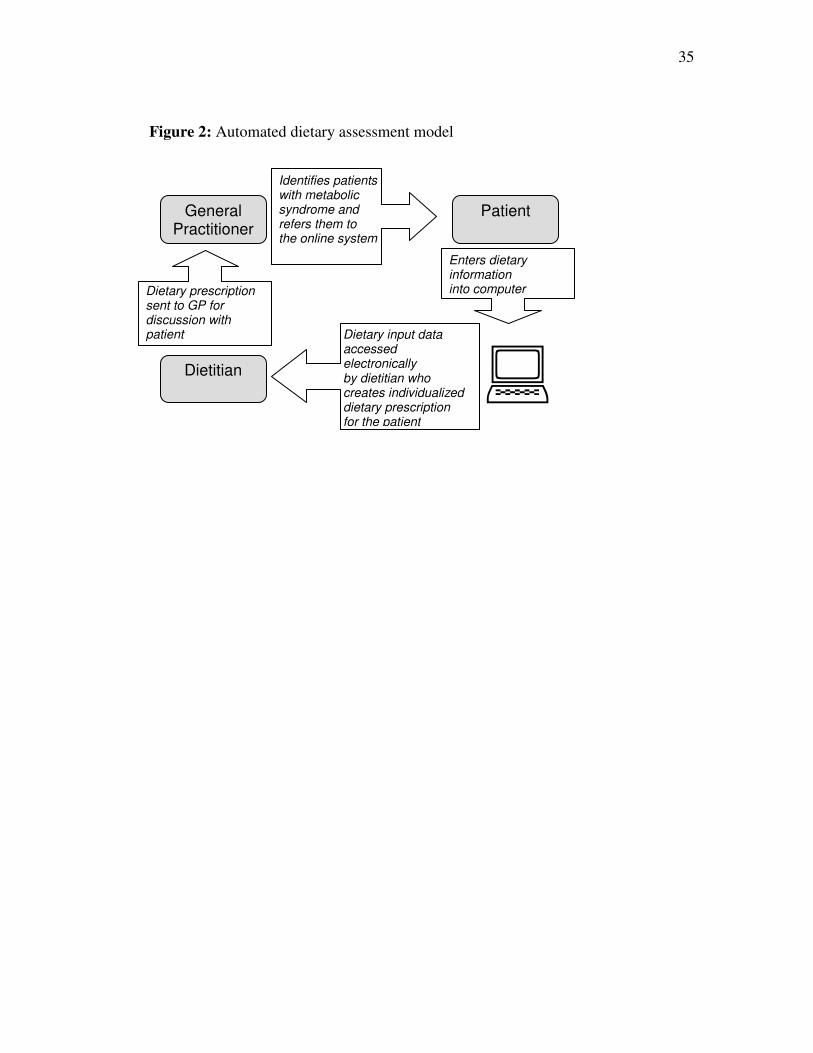
In this study, design and development of an online application for patient self-reporting
of usual dietary intake (diet history) in the primary healthcare setting was chosen.
Access to the automated dietary assessment self-reporting tool was to be facilitated by
General Practitioners. Patient data would then be accessible by a dietitian for
formulation of dietary advice, which in turn would be sent to the GP for discussion with
the patient, figure 2. [INSERT FIGURE 2]
In this model, the importance of the dietitian has not been de-emphasised. Rather, by
patients entering their dietary information into the online system, the data is transferred
electronically to the dietitian who can focus on analysis of the food intake data and
development of dietary advice. This advice can then be sent to the relevant GP allowing
17
the GP to also have a greater involvement in the nutritional education and health of their
patients. This advice is detailed enough to allow the GP to understand key concepts and
is planned to be the primary focus of a repeat visit of the patient. No other studies have
been identified to date addressing these concepts.
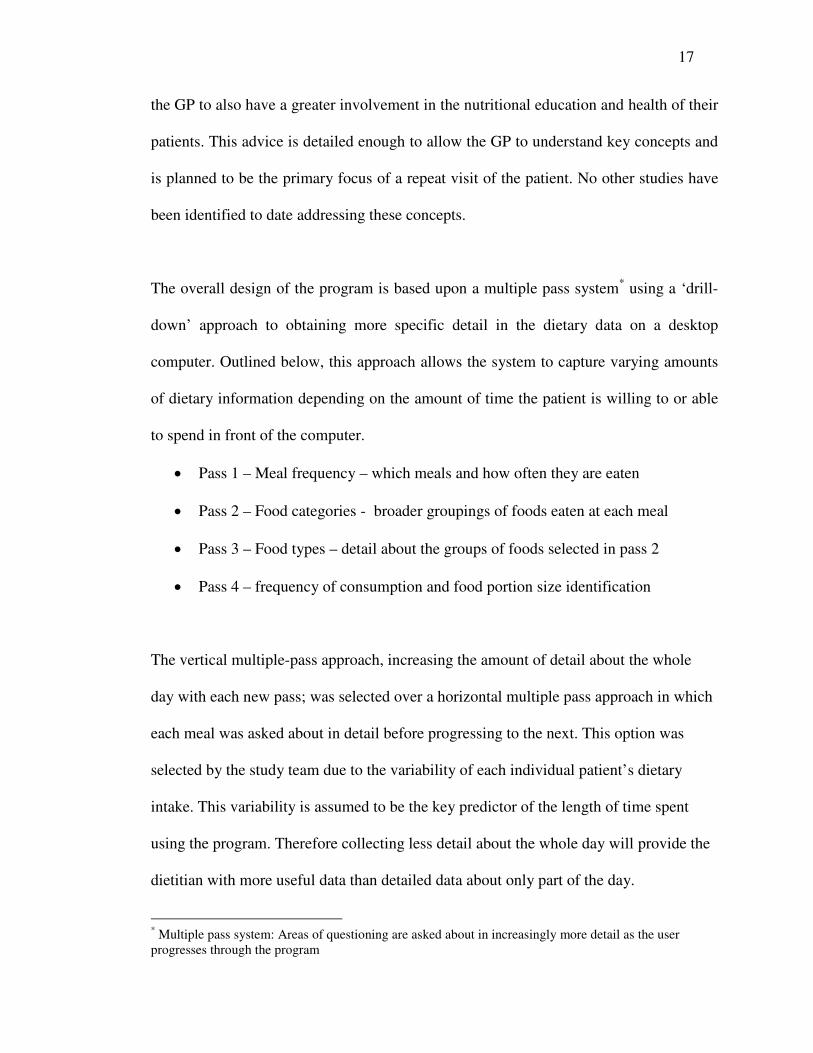
The overall design of the program is based upon a multiple pass system* using a ‘drill-
down’ approach to obtaining more specific detail in the dietary data on a desktop
computer. Outlined below, this approach allows the system to capture varying amounts
of dietary information depending on the amount of time the patient is willing to or able
to spend in front of the computer.
• Pass 1 – Meal frequency – which meals and how often they are eaten
• Pass 2 – Food categories - broader groupings of foods eaten at each meal
• Pass 3 – Food types – detail about the groups of foods selected in pass 2
• Pass 4 – frequency of consumption and food portion size identification
The vertical multiple-pass approach, increasing the amount of detail about the whole
day with each new pass; was selected over a horizontal multiple pass approach in which
each meal was asked about in detail before progressing to the next. This option was
selected by the study team due to the variability of each individual patient’s dietary
intake. This variability is assumed to be the key predictor of the length of time spent
using the program. Therefore collecting less detail about the whole day will provide the
dietitian with more useful data than detailed data about only part of the day.
* Multiple pass system: Areas of questioning are asked about in increasingly more detail as the user
progresses through the program

18
Focus group discussion sessions
Thirty-seven participants agreed to take part in the study. Of this 36 (97%), completed
the telephone questionnaire and 33 (89%) completed the focus group discussion
sessions. Twenty-four males and 12 females with an average age of 60 years (41-
77years) and a BMI of 29.6kg/m² (23.4-35.7 kg/m²) took part in the focus group
discussion. The level of computer experience was variable. 35
The few non-computer
users from the focus groups had features representative of that reported in the literature
and allowed for standard interface development to be followed.38
The use of an online system accessible in both the office of a health professional and in
the participants’ home was preferred over the desktop program that could only be
accessible in the GP’s office. One participant’s comment was illustrative of this
preference, "… doesn’t matter whether it’s in my doctor’s surgery or here, everyone
connected to the Internet can log into that".
For those who did not have a computer at home or did not have Internet access at
home, suggested places to use the tool included the local library, diabetes
centres, pharmacies or universities. Participants did not like the idea of having
to go to their doctors or other health professional’s office more often than the
few visits per year required for their diabetes management. Participants reported
that the GP surgery as a location for the program was not ideal due to the number
of persons with illnesses that would be around them. Privacy of the location was
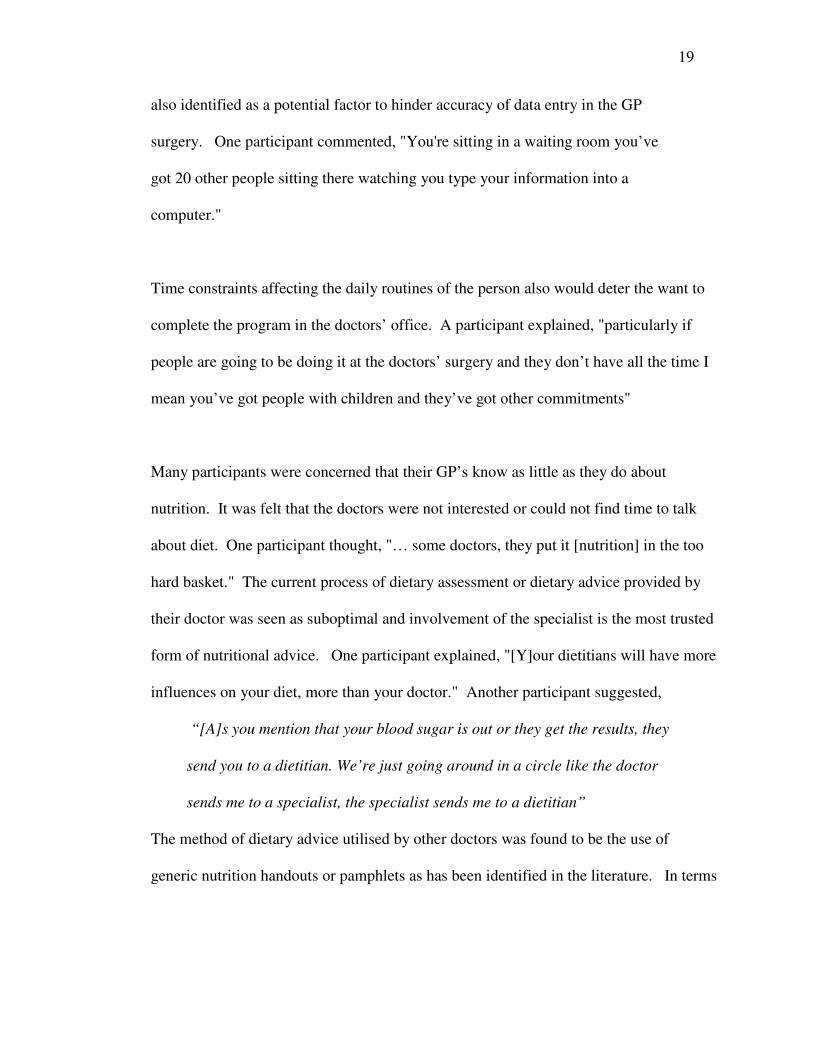
19
also identified as a potential factor to hinder accuracy of data entry in the GP
surgery. One participant commented, "You're sitting in a waiting room you’ve
got 20 other people sitting there watching you type your information into a
computer."
Time constraints affecting the daily routines of the person also would deter the want to
complete the program in the doctors’ office. A participant explained, "particularly if
people are going to be doing it at the doctors’ surgery and they don’t have all the time I
mean you’ve got people with children and they’ve got other commitments"
Many participants were concerned that their GP’s know as little as they do about
nutrition. It was felt that the doctors were not interested or could not find time to talk
about diet. One participant thought, "… some doctors, they put it [nutrition] in the too
hard basket." The current process of dietary assessment or dietary advice provided by
their doctor was seen as suboptimal and involvement of the specialist is the most trusted
form of nutritional advice. One participant explained, "[Y]our dietitians will have more
influences on your diet, more than your doctor." Another participant suggested,
“[A]s you mention that your blood sugar is out or they get the results, they
send you to a dietitian. We’re just going around in a circle like the doctor
sends me to a specialist, the specialist sends me to a dietitian”
The method of dietary advice utilised by other doctors was found to be the use of
generic nutrition handouts or pamphlets as has been identified in the literature. In terms

20
of usefulness, one participant commented,“[T]he pamphlets that they just give you, they
just proliferate and, there’s nothing really specific in them.”
Therefore, it was evident that the program design would need to cater for the online
preference to ensure patients did not need to spend more time than needed in the GP
practice. Beyond, the specifics of the interface, the intervention as a whole would also
need to consider how the doctor would ultimately be involved in providing the dietary
prescriptions provided to the patient.
Statistical analysis & core food group development
Each of the foods in the total NNS food list was given a unique identification code
allowing it to be placed within one of the ABS food groups shown in table 1. The
highest-level grouping (least detail) contained 2 digit codes followed by a sub category
with 3 digit food codes and finally a 4-digit code for the lowest level of grouping. The
level of a food item corresponds to an 8-digit code. A total of 497 food groupings
existed. The foods eaten and recalled in the NNS were all coded through the use of meal
categories from which commonly consumed food items could be drawn. [INSERT
TABLE 1]
Bias calculations determined the minimum number of food groups needed and the level
of error associated. When compared with the level of error of a traditional diet history
interview with a dietitian, the computer would only need to ask about groups of foods
rather than individual food items to achieve a similar result. The most commonly

21
consumed food item was milk followed by bread and potatoes. Associated foods saw
milk and sugar in tea and coffee as commonly linked food items. Cluster analysis
resulted in a separation of many of the NNS food groups based on fat content resulting
overall in a larger number of groups in total.
User interface design
Focus group results saw a change in the initial design of the program from a desktop
application to that of a web-based tool due to the ease of accessibility by a larger
number of patients. The design need to cater for considerations that the potential users
would likely be over forty years, at varying degrees of health, and each with varied
levels of computer experience. The navigation needed to be intuitive and a large amount
of information fitted into single screens. Therefore organisation and clarity of the screen
display was vital as was identified in the focus group sessions.35
Initial prototypes
determined that the number of food groups again needed to be re-evaluated such that
large groups of foods need to be divided into smaller numbers to allow for optimal
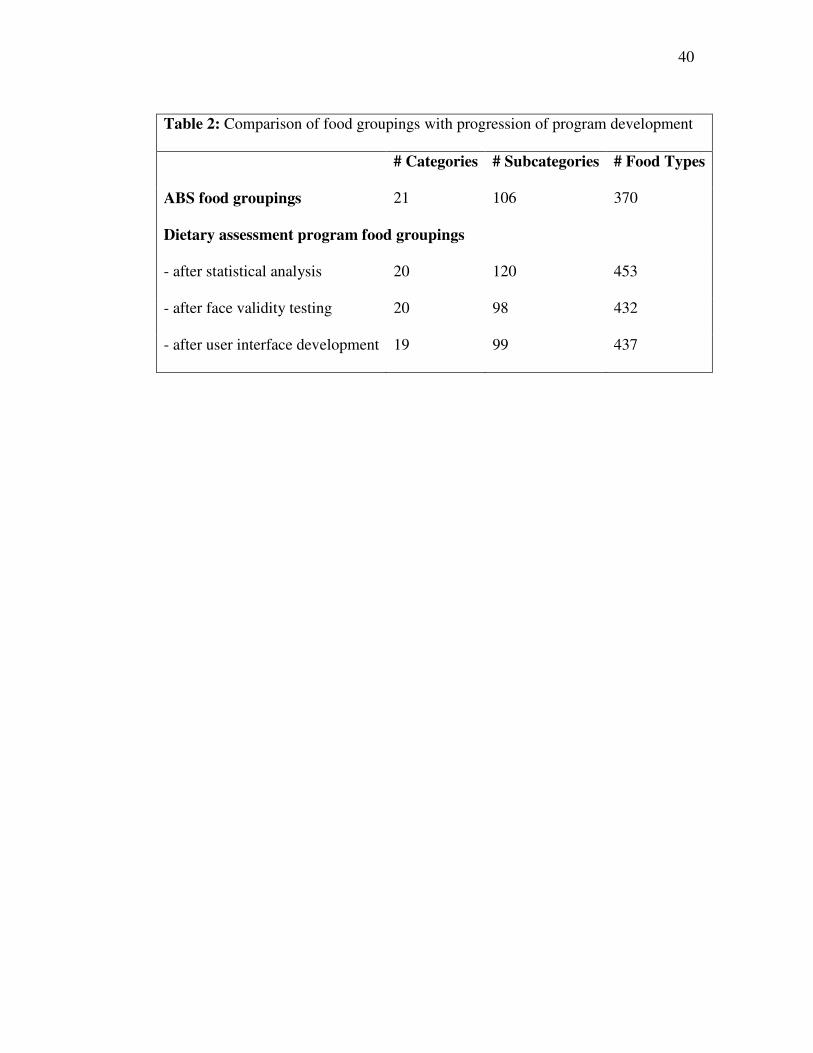
screen displays. Table 2 gives an outline of the changes to the core food group numbers
throughout the program development. The large variations seen between the original
ABS food groupings and those of the current study were due to the need to differentiate
between foods delivering different types of fatty acids (determined by the statistical
analysis) and the need for names of group foods to be based on the food knowledge of
the layperson rather than the trained professional (changed during face-validity testing
and interface design) in the NNS. [INSERT TABLE 2]

22
The user interface needed to include the theoretically developed food hierarchy and yet
also be understandable and user-friendly. Due to the age of the end-user the literature
identifies a need to maintain user interest 39
. A cognitive cue illustrates for the user
their level of completion of the dietary intake tool, figure 3. Changes in colours
corresponding with those of the navigation bar were included in the menus. Upon
completion of a section the colours would change to maintain interest. For example
breakfast – orange, morning tea - blue, lunch – yellow, afternoon tea – aqua, dinner –
red, supper – dark blue and beverages – green. The challenge of using an open vs.
closed questioning scheme was overcome by allowing free text entry in areas of the
website where further detail may be required. Primarily however the food related
questions were closed. [INSERT FIGURE 3]
Challenges in the design and functionality of menu and the layout, due to the dynamic
nature of the survey, were also encountered. All users would have different diets
therefore the system would need to be designed in such a way that it would adapt to
each user. Designing the system so that a user could select only the meals they eat
would save the patients needing to read through potentially unnecessary questions. The
menu and navigation system could then change to reflect the choices of the patient. The
interface needed to be designed so that a broad overview of a one week’s food intake
would be captured and as the user progressed further through the questionnaire, the level
of detail about the foods eaten increased. One week was selected as it would provide a
snapshot of a person’s intake without making a patient recall all foods eaten and
potentially spend hours sitting in front of a computer screen. This technique was also

23
thought to be useful if a user logged out part way through the questionnaire. An example
of one possible layout of the user interface is given in figure 4. [INSERT FIGURE 4]
Rather than using a separate help manual, instructions are given to the user at the
beginning of the program including sample questions, figure 5, and visual displays of
the navigation tools as requested by the focus group participants. If a user logged out
and returned the following day, their data would be saved and upon returning to the
website they would be taken back to the place at which they left the survey. The design
allows segments of the interface to be ‘switched off’ at any time and therefore be
excluded from questioning. This can be possible due to the inclusion of two different
applications, one for the user survey and one for administrative management of data.
Advantages of such an approach allow modification of the administrative application
without disturbing the users of the patient application. Similarly the data is not static, it
will be constantly changing and be refined allowing the team to quickly and easily
modify the food hierarchy. These modifications will be instantly seen by anyone using
the website. [INSERT FIGURE 5]

24
Discussion
A step-wise approach to the interface design has allowed a multidisciplinary approach to
automated dietary assessment to be undertaken. The entire team was involved in the
review process of each stage, followed by groups of team members from similar areas
working in their specialist field to develop key components of the design.
The original conceptual model for the assessment of having a desktop program located
on a computer in the GPs waiting area was not found to be the preferred method of
delivery for the automated diet history. This design was decided as it has been common
practice for health assessment programs. An online tool allows for a broader range of
patients to have access to the automated diet history. The outcomes of this study will
allow for the development of an online self-assessment nutrition program and allow for
greater participation of the GP in the area of nutrition. Employment of the internet as the
medium for the program allows an increased number of patients access to the
assessment tool. This will not only shorten the burdensome process of face-to-face diet
history assessment for the dietitian, allowing more time to be spent on dietary advice,
but it will also allow for the doctors to focus on the patients who are in need of dietary
intervention and do not traditionally receive any due to time restrictions.
The use of a computer-assisted interview for the assessment of dietary intake will not
only aid in the time efficiency of the dietitian, it will also allow for the initial assessment
process to be standardized allowing for greater depth of individualised advice for the
25
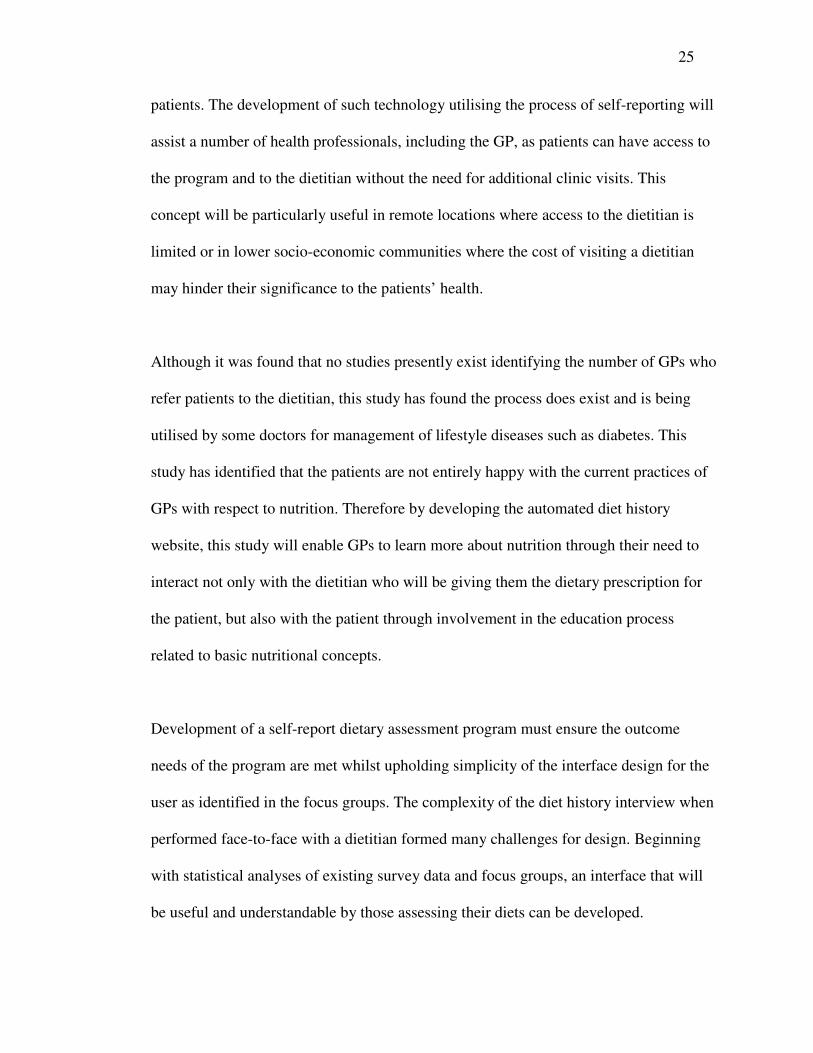
patients. The development of such technology utilising the process of self-reporting will
assist a number of health professionals, including the GP, as patients can have access to
the program and to the dietitian without the need for additional clinic visits. This
concept will be particularly useful in remote locations where access to the dietitian is
limited or in lower socio-economic communities where the cost of visiting a dietitian
may hinder their significance to the patients’ health.
Although it was found that no studies presently exist identifying the number of GPs who
refer patients to the dietitian, this study has found the process does exist and is being
utilised by some doctors for management of lifestyle diseases such as diabetes. This
study has identified that the patients are not entirely happy with the current practices of
GPs with respect to nutrition. Therefore by developing the automated diet history
website, this study will enable GPs to learn more about nutrition through their need to
interact not only with the dietitian who will be giving them the dietary prescription for
the patient, but also with the patient through involvement in the education process
related to basic nutritional concepts.
Development of a self-report dietary assessment program must ensure the outcome
needs of the program are met whilst upholding simplicity of the interface design for the
user as identified in the focus groups. The complexity of the diet history interview when
performed face-to-face with a dietitian formed many challenges for design. Beginning
with statistical analyses of existing survey data and focus groups, an interface that will
be useful and understandable by those assessing their diets can be developed.

26
The website is currently undergoing laboratory testing with potential users to evaluate
the interaction of the user with the computer interface and questioning sequence.
Questions and food groups will then be modified as needed (construct validity).
Following testing, an interface for the dietitians will be designed to analyse the output
data from this patient user interface. Dietary advice protocols will also be developed to
standardise the process through which the dietary advice is generated. Upon completion
of the two key interfaces the program can then be implemented in the GP practices to
examine the model involving the GP, patient and dietitian. This final phase will allow
the program to be validated against a traditional form of dietary assessment (criterion-
related validity).

27
Acknowledgements
This project is a component of an ARC linkage grant between the University of
Wollongong, Illawarra Division of General Practice and Xyris Software. Funding and
support has been provided by each of the above mentioned parties. Thank you to Sandy
Burden for the endless amounts of statistical analysis performed for the development of
the food hierarchy. To Chester Goodsell, Therese O’Sullivan and Pieta Autenzio for
their development of food lists used for validation of the food groupings and to Rachael
Cavanagh for your assistance during the re-naming and formatting of the food groups.
Conflict of Interest
There is no conflict of interest to declare for this study.

28
Abbreviations
GP – General Practitioner
NNS – National Nutrition Survey
ABS – Australian Bureau of Statistics
References
1. Maiburg HJ, Hiddink GJ, vant Hof MA, Rethans JJ, van Ree JW. The
NECTAR-study: development of nutrition modules for general practice vocational
training; determinants of nutrition guidance practices of GP-trainees. Nutrition
Education by Computerized Training And Research. European Journal of Clinical
Nutrition 1999;53(Suppl 2):S83-8.
2. Truswell AS. Family physicians and patients: is effective nutrition interaction
possible? American Journal of Clinical Nutrition 2000;71(1):6-12.
3. Brug J. Dutch research into the development and impact of computer-tailored
nutrition education. European Journal of Clinical Nutrition 1999;53 Suppl 2:S78-82.
4. Helman A. Nutrition and general practice: an Australian perspective. American
Journal of Clinical Nutrition 1997;65(6):1939S-1942.
5. Truswell AS, Hiddink GJ, Blom J. Nutrition guidance by family doctors in a
changing world: problems, opportunities, and future possibilities. American Journal of
Clinical Nutrition 2003;77(4):1089S-1092.
29
6. Nicholas LG, Pond CD, Roberts DC. Dietitian-general practitioner interface: a
pilot study on what influences the provision of effective nutrition management.
American Journal of Clinical Nutrition 2003;77(4 Suppl):1039S-1042S.
7. Crossen K, Scott RS, McGeoch GR, George PM. Implementation of evidence
based cardiovascular risk treatments by general practitioners. New Zealand Medical
Journal 2001;114(1133):260-2.
8. von Ferber L, Koster I, Pruss U. Patient variables associated with expectations
for prescriptions and general practitioners' prescribing behaviour: an observational
study. Pharmacoepidemiology & Drug Safety 2002;11(4):291-9.
9. Mant D. Effectiveness of dietary intervention in general practice. American
Journal of Clinical Nutrition 1997;65(6):1933S-1938.
10. van Binsbergen JJ, Delaney BC, van Weel C. Nutrition in primary care: scope
and relevance of output from the Cochrane Collaboration. American Journal of Clinical
Nutrition 2003;77(4 Suppl):1083S-1088S.
11. Brug J, Campbell M, van Assema P. The application and impact of computer-
generated personalized nutrition education: A review of the literature. Patient Education
and Counseling 1999;36(2):145-156.
12. Nicholas L, Roberts DC, Pond D. The role of the general practitioner and the
dietitian in patient nutrition management. Asia Pacific Journal of Clinical Nutrition
2003;12(1):3-8.
13. Probst YC, Tapsell LC. An Overview of Computerized Dietary Programs for
Research and Practice in Nutrition. Journal of Nutrition Education and Behavior
2005;37(1):20-26.
30
14. de Leeuw E, Nicholls W. Technological Innovations in Data Collection:
Acceptance, Data Quality and Costs. Sociology Research. 1(4). In: Sociology Research
[serial online]. Vol 1 (4) ed; 1996.
15. Medlin C, Skinner J. Individual dietary intake methodology: A 50-year review of
progress. Journal of the American Dietetic Association 1998;88(10):1250-1257.
16. Hsu N, Gormican A. The computer in retrieving dietary history data. II.
Retrieving information by summary generation. Journal of the American Dietetic
Association 1973;63(4):402-7.
17. Rebro SM, Patterson RE, Kristal AR, Cheney CL. The effect of keeping food
records on eating patterns. J Am Diet Assoc 1998;98(10):1163-1165.
18. Caan BJ, Lanza E, Schatzkin A, Coates AO, Brewer BK, Slattery ML, et al.
Does nutritionist review of a self-administered food frequency questionnaire improve
data quality? Public Health Nutrition 1999(2):4.
19. Sasaki S, Yanagibori R, Amano K. Self-administered diet history questionnaire
developed for health education: a relative validation of the test-version by comparison
with 3-day diet record in women. Journal of Epidemiology 1998;8(4):203-15.
20. Campbell L, Barth, R, Gosper, JK, Judd, JJ, Simons, LA, Chisholm, DJ. Impact
of Intensive Educational Approach to Dietary Change in NIDDM. Diabetes Care
1990;13(8):841--847.
21. Campbell MK, DeVellis BM, Strecher VJ, Ammerman AS, al e. Improving
dietary behavior: The effectiveness of tailored messages in primary care settings.
American Journal of Public Health 1994;84(5):783.

31
22. De Looy A, Auty, PL, Coates, CA. Is our dietary advice effective? Proceedings
of the Nutrition Society 1992;51:63-69.
23. Greene GW, Rossi SR, Rossi JS, Velicer WF, Fava JL, Prochaska JO. Dietary
applications of the stages of change model. Journal of the American Dietetic
Association 1999;99(6):673-678.
24. Hargreaves MK, Schlundt DG, Buchowski MS, Hardy RE, Rossi SR, Rossi JS.
Stages of change and the intake of dietary fat in African-American women: improving
stage assignment using the Eating Styles Questionnaire. Journal of the American
Dietetic Association 1999;99(11):1392-1399.
25. Greene GW, Rossi SR, Reed GR, Willey C, Prochaska JO. Stages of change for
reducing dietary fat to 30% of energy or less. J Am Diet Assoc 1994;94(10):1105-10;
quiz 1111-2.
26. Glanz K, Patterson RE, Kristal AR, DiClemente CC, Heimendinger J, Linnan L,
et al. Stages of change in adopting healthy diets: fat, fiber, and correlates of nutrient
intake [published erratum appears in Health Educ Q 1995 May;22(2):261]. Health Educ
Q 1994;21(4):499-519.
27. Shaw JE, Chisholm DJ. MJA Practice Essentials 1: Epidemiology and
prevention of type 2 diabetes and the metabolic syndrome. Medical Journal of Australia
2003;179(7):379-383.
28. Elmstahl S, Gullberg B, Riboli E, Saracci R, Lindgarde F. The Malmo Food
Study: the reproducibility of a novel diet history method and an extensive food
frequency questionnaire. European Journal of Clinical Nutrition 1996;50(3):134-142.

32
29. Tapsell L, Pettengell K, Denmeade S. Assessment of a narrative approach to the
diet history. Public Health Nutrition 1999;2(1):61-7.
30. Bathalon GP, Tucker KL, Hays NP, Vinken AG, Greenberg AS, McCrory MA,
et al. Psychological measures of eating behavior and the accuracy of three common
dietary assessment methods in healthy postmenopausal women. Am J Clin Nutr
2000;71:739-745.
31. Black AE, Cole TJ. Biased over- or under-reporting is characteristic of
individuals whether over time or by different assessment methods. Journal of the
American Dietetic Association 2001;101(1):70-80.
32. Johansson L, Solvoll K, Bjorneboe GE, Drevon CA. Under- and overreporting of
energy intake related to weight status and lifestyle in a nationwide sample. American
Journal of Clinical Nutrition 1998;68:266-274.
33. Tourangeau R, Rips L, Rasinski KA. The psychology of survey response.
Cambridge: Cambridge University Press; 2000.
34. Roth JL, Mobarhan S, Clohisy M. The Metabolic Syndrome: where are we and
where do we go? Nutrition Reviews. 2002;60(10 Pt 1):335-7.
35. Probst Y, Krnavek C, Lockyer L, Tapsell L. Developing a self-administered
computer assisted dietary assessment tool for use in primary healthcare practice:
Perceptions of nutrition and computers in older adults with T2DM. Australian Journal of
Primary Health Accepted.
36. McLennan W, Podger A. National Nutrition Survey. Nutrient intakes and
physical measurements. ABS Cat No 4805.0. Canberra: Australian Bureau of Statistics;
1998.

33
37. Johnson RA, Wichern DW. Applied multivariate statistical analysis. 5th ed.
Upper Saddle River, New Jersey: Prentice Hall; 2002.
38. Kressig RW, Echt KV. Exercise prescribing: Computer application in older
adults. The Gerontologist 2002;42(2):273-277.
39. Kushniruk AW, Patel VL, Cimino JJ. Usability testing in medical informatics:
cognitive approaches to evaluation of information systems and user interfaces.
Proceedings of the American Medical Informatics Association Annual Fall Symposium
1997:218-22.
34
Figure 1: Relationship between methods and design
Statistical Analysis of
NNS
User interface design
Self-administered dietary Assessment website
Focus group
interviews
Face validity testing
35
Patient
Dietitian
General Practitioner
Identifies patients with metabolic syndrome and refers them to the online system
�
Enters dietary information into computer
Dietary input data accessed electronically by dietitian who creates individualized dietary prescription for the patient
Dietary prescription sent to GP for discussion with patient
Figure 2: Automated dietary assessment model

36
Figure 3 Example navigation bar for the user interface

37
Figure 4 Sample user interface for breakfast

38
Figure 5 Sample question layout included in instructions

39
Table 1: National Nutrition Survey (NNS) food grouping structure
Names Categories # Subcategories # Food types 1. Non Alcoholic Beverages 6 30
2. Cereals and Cereal Products 8 32
3. Cereal-Based Products and Dishes 6 34
4. Fats and Oils 5 22
5. Fish and Seafood Products and Dishes 6 18
6. Fruit Products and Dishes 9 16
7. Egg Products and Dishes 3 7
8. Meat, Poultry & Game Products and Dishes 9 40
9. Milk Products and Dishes 8 47
10. Soup 3 11
11. Seed and Nut Products and Dishes 2 4
12. Savoury Sauces and Condiments 4 17
13. Vegetable Products and Dishes 9 19
14. Legume and Pulse Products and Dishes 2 5
15. Snack Foods 4 6
16. Sugar Products and Dishes 3 9
17. Confectionary and Health Bars 3 9
18. Alcoholic Beverages 4 13
19. Special Dietary Foods 2 6
20. Miscellaneous 6 12
21. Infant Formulae and Foods 4 13
SUBTOTAL: 21 106 370
TOTAL: 497 Groups
40
Table 2: Comparison of food groupings with progression of program development
# Categories # Subcategories # Food Types
ABS food groupings 21 106 370
Dietary assessment program food groupings
- after statistical analysis 20 120 453
- after face validity testing 20 98 432
- after user interface development 19 99 437