towards an automated weight lifting coach: a thesis
TRANSCRIPT

TOWARDS AN AUTOMATED WEIGHT LIFTING COACH:
INTRODUCING LIFT
A Thesis
presented to
the Faculty of California Polytechnic State University
San Luis Obispo
In Partial Fulfillment
of the Requirements for the Degree
Master of Science in Computer Science
by
Michael Lady
June 2014

c© 2014
Michael Lady
ALL RIGHTS RESERVED
ii

COMMITTEE MEMBERSHIP
TITLE: Towards an automated weight lifting
coach: introducing LIFT
AUTHOR: Michael Lady
DATE SUBMITTED: June 2014
COMMITTEE CHAIR: Christopher Lupo, Ph.D.
Assistant Professor of Computer Science
COMMITTEE MEMBER: Alexander Dekhtyar, Ph.D.
Professor of Computer Science
COMMITTEE MEMBER: Lynne Slivovsky, Ph.D.
Professor of Electrical Engineering
iii
ABSTRACT
Towards an automated weight lifting coach: introducing LIFT
Michael Lady
The fitness device market is young and rapidly growing. More people than ever
before take count of how many steps they walk, how many calories they burn,
their heart rate over time, and even their quality of sleep. New, and as of yet,
unreleased fitness devices have promised the next evolution of functionality with
exercise technique analysis. These next generation of fitness devices have wrist
and armband style form factors, which may not be optimal for barbell exercises
such as back squat, bench press, and overhead press where a sensor on one arm
may not provide the most relevant data about a lift.
Barbell path analysis is a well-known visual tool to help diagnose weightlift-
ing technique deficiencies, but requires a camera pointed at the athlete that is
integrated with motion-tracking software. This camera set up is not available at
most gyms, so this motivates the use of a small, unobtrusive sensor to obtain
data about an athlete’s weightlifting technique. Researchers have shown that
an accelerometer attached to a barbell while the athlete is lifting yields just as
accurate acceleration information as a camera [96]. The LIFT (Leveraging In-
formation For Training) automated weight lifting coach attempts to implement
a simple, unobtrusive system for analyzing and providing feedback on barbell
weight lifting technique.
iv

ACKNOWLEDGMENTS
First off, a very special thank you to the Cal Poly Athletic Weight Room and
Cal Poly ASI Recreation Center for allowing me to conduct my experiment in
their state-of-the-art facilities. The staff were very welcoming and open to the
idea of incorporating technology into the weight room. Cameron Van Wye of the
Athletic Weight Room in particular has been an invaluable resource for recruiting
healthy Cal Poly athletes to be test subjects to provide real-world, hard-fought,
yet safely executed exercise data.
Thank you to my lead thesis adviser, Dr. Lupo for consistently giving me
feedback on my progress and being there to bounce ideas off of. Thank you to
my other thesis committee members, Dr. Dekhtyar, and Dr. Slivovsky. Without
taking Dr. Dekhtyar’s class in data mining, I would not have had the background
necessary to successfully execute this project. Dr. Slivovsky’s domain expertise
in her hobby of powerlifting was invaluable in receiving feedback for this project.
Thank you to my Mom, Dad, and brother. They have supported me through-
out my college career and patiently listened to me drone on about technology
ever since I could use a computer.
Thank you to my friends, most of whom are either technically proficient in
writing software or Brazilian jiu-jitsu. You guys have been my extended family
and have made me feel at home while away from home.
v

TABLE OF CONTENTS
List of Tables ix
List of Figures x
1 Introduction 1
1.1 Contributions . . . . . . . . . . . . . . . . . . . . . . . . . . . . . 1
1.2 Outline . . . . . . . . . . . . . . . . . . . . . . . . . . . . . . . . . 2
2 Domain Background 3
2.1 Benefits of compound exercise . . . . . . . . . . . . . . . . . . . . 3
2.2 Benefits of barbell exercise . . . . . . . . . . . . . . . . . . . . . . 4
2.3 Benefits of compound barbell exercise . . . . . . . . . . . . . . . . 5
2.4 Weight lifting technique . . . . . . . . . . . . . . . . . . . . . . . 7
2.4.1 Back Squat . . . . . . . . . . . . . . . . . . . . . . . . . . 9
2.4.1.1 Correct technique . . . . . . . . . . . . . . . . . . 10
2.4.1.2 Incorrect technique . . . . . . . . . . . . . . . . . 11
2.4.2 Bench Press . . . . . . . . . . . . . . . . . . . . . . . . . . 15
2.4.2.1 Correct technique . . . . . . . . . . . . . . . . . . 16
2.4.2.2 Incorrect technique . . . . . . . . . . . . . . . . . 17
2.4.3 Overhead Press . . . . . . . . . . . . . . . . . . . . . . . . 20
2.4.3.1 Correct technique . . . . . . . . . . . . . . . . . . 20
2.4.3.2 Incorrect technique . . . . . . . . . . . . . . . . . 20
2.5 Weight lifting technique feedback . . . . . . . . . . . . . . . . . . 23
2.5.1 Visual feedback . . . . . . . . . . . . . . . . . . . . . . . . 24
2.5.2 Wearable devices . . . . . . . . . . . . . . . . . . . . . . . 26
3 Technical Background 30
3.1 How device sensors work . . . . . . . . . . . . . . . . . . . . . . . 30
3.1.1 Accelerometer . . . . . . . . . . . . . . . . . . . . . . . . . 30
vi

3.1.2 Gyroscope . . . . . . . . . . . . . . . . . . . . . . . . . . . 33
3.1.3 Magnetometer . . . . . . . . . . . . . . . . . . . . . . . . . 35
3.2 Combining sensor data together . . . . . . . . . . . . . . . . . . . 36
3.3 How data classification systems work . . . . . . . . . . . . . . . . 39
3.3.1 Decision tree . . . . . . . . . . . . . . . . . . . . . . . . . 40
3.3.1.1 Decision Tree Algorithm . . . . . . . . . . . . . . 41
3.3.1.2 Classifier Evaluation . . . . . . . . . . . . . . . . 43
3.3.2 Random forest . . . . . . . . . . . . . . . . . . . . . . . . 44
3.3.3 Extra-tress . . . . . . . . . . . . . . . . . . . . . . . . . . 45
4 Related Work 48
4.1 General motion tracking systems . . . . . . . . . . . . . . . . . . 48
4.2 Systems used to augment healthcare . . . . . . . . . . . . . . . . 49
4.3 Systems used to augment general exercise performance . . . . . . 50
4.4 Systems used to augment weight lifting performance . . . . . . . . 51
5 Methodology 54
5.1 Barbell Lifts . . . . . . . . . . . . . . . . . . . . . . . . . . . . . . 54
5.2 Subject testing . . . . . . . . . . . . . . . . . . . . . . . . . . . . 55
5.2.1 Profile of subjects . . . . . . . . . . . . . . . . . . . . . . . 55
5.2.2 Realistic technique deficiencies . . . . . . . . . . . . . . . . 56
6 Implementation 57
6.1 Data collection . . . . . . . . . . . . . . . . . . . . . . . . . . . . 57
6.2 Technique classification . . . . . . . . . . . . . . . . . . . . . . . . 60
6.3 Automated weight lifting coach . . . . . . . . . . . . . . . . . . . 63
7 Experimental Framework 65
7.1 Research protocol . . . . . . . . . . . . . . . . . . . . . . . . . . . 65
7.2 Validation . . . . . . . . . . . . . . . . . . . . . . . . . . . . . . . 66
8 Results 67
8.1 Squat results . . . . . . . . . . . . . . . . . . . . . . . . . . . . . 68
8.2 Bench press results . . . . . . . . . . . . . . . . . . . . . . . . . . 72
8.3 Overhead press results . . . . . . . . . . . . . . . . . . . . . . . . 76
vii

9 Analysis 85
9.1 Research study bias and error . . . . . . . . . . . . . . . . . . . . 85
9.2 Athlete bias . . . . . . . . . . . . . . . . . . . . . . . . . . . . . . 85
9.3 Technique deficiency challenges . . . . . . . . . . . . . . . . . . . 86
9.4 Researcher error . . . . . . . . . . . . . . . . . . . . . . . . . . . . 86
9.5 Overcoming research study bias and error . . . . . . . . . . . . . 87
9.6 Technical error considerations . . . . . . . . . . . . . . . . . . . . 87
9.6.1 Orientation taring . . . . . . . . . . . . . . . . . . . . . . . 87
9.6.2 Magnetometer effects . . . . . . . . . . . . . . . . . . . . . 88
9.6.3 Euler angles and Gimbal lock . . . . . . . . . . . . . . . . 90
9.6.4 Data collection rate . . . . . . . . . . . . . . . . . . . . . . 91
9.6.5 Exercise technique deficiency ambiguity . . . . . . . . . . . 92
10 Conclusions 93
11 Future Work 94
11.1 Visual feedback . . . . . . . . . . . . . . . . . . . . . . . . . . . . 94
11.2 Repetition detection . . . . . . . . . . . . . . . . . . . . . . . . . 95
11.3 Sensor compatibility . . . . . . . . . . . . . . . . . . . . . . . . . 95
11.4 Body type clustering . . . . . . . . . . . . . . . . . . . . . . . . . 96
11.5 Female study . . . . . . . . . . . . . . . . . . . . . . . . . . . . . 96
11.6 Alternative ways to provide weight lifting feedback . . . . . . . . 97
Bibliography 98
viii

LIST OF TABLES
3.1 How quickly error can accrue over time due to incorrect initialorientation calculations [26] . . . . . . . . . . . . . . . . . . . . . 33
8.1 Comparison of squat measures between v1 and v2 . . . . . . . . . 71
8.2 Squat label number table . . . . . . . . . . . . . . . . . . . . . . . 72
8.3 Comparison of bench press measures between v1 and v2 . . . . . 77
8.4 Bench press label numbers . . . . . . . . . . . . . . . . . . . . . . 78
8.5 Comparison of overhead press measures between v1 and v2 . . . . 80
8.6 Overhead press v1 label numbers . . . . . . . . . . . . . . . . . . 82
ix

LIST OF FIGURES
2.1 How the body gets stronger [102] . . . . . . . . . . . . . . . . . . 5
2.2 Training complexity over time [90] . . . . . . . . . . . . . . . . . . 6
2.3 Socrates’ perspective on fitness [50] . . . . . . . . . . . . . . . . . 7
2.4 How the body is balanced during standing barbell exercises [90] . 9
2.5 The correct way to squat [90] . . . . . . . . . . . . . . . . . . . . 10
2.6 The correct way to bench press [90] . . . . . . . . . . . . . . . . . 16
2.7 Anatomy of a bench press with elbows at 45 degrees on the leftand 90 degrees on the right. [90] . . . . . . . . . . . . . . . . . . . 19
2.8 The correct way to overhead press [90] . . . . . . . . . . . . . . . 21
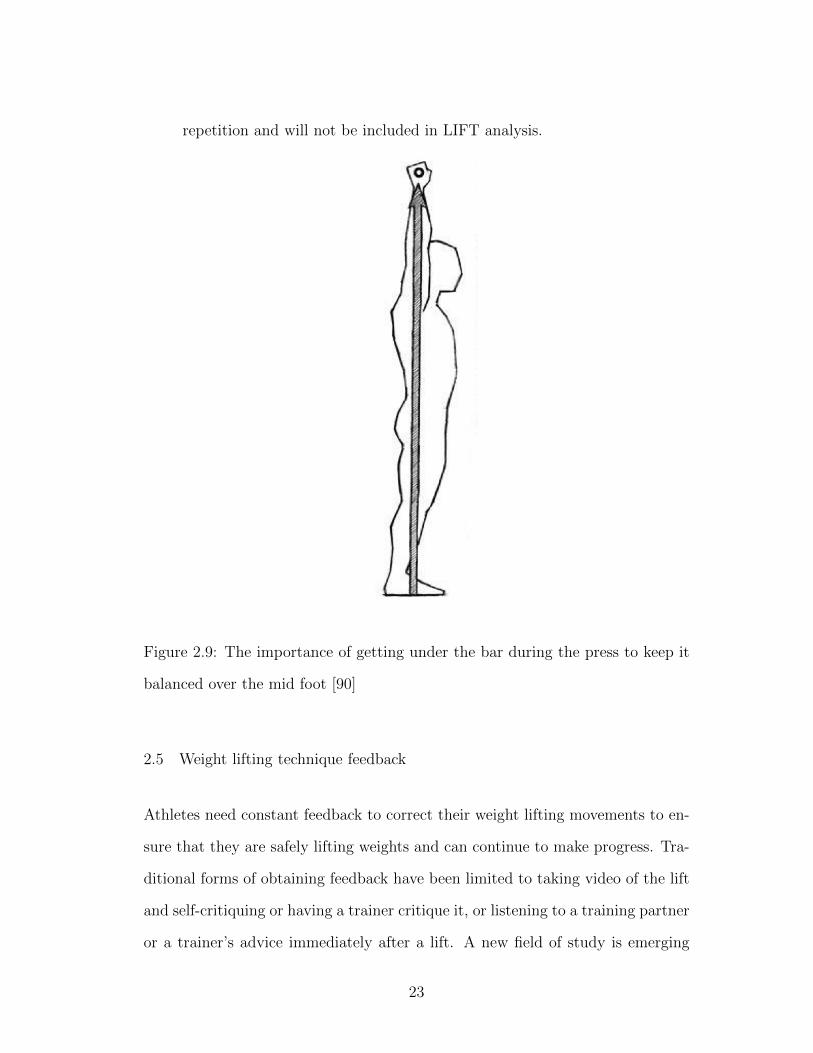
2.9 The importance of getting under the bar during the press to keepit balanced over the mid foot [90] . . . . . . . . . . . . . . . . . . 23
2.10 Keeping wrists straight to avoid wasting energy [90] . . . . . . . . 24
2.11 Using an inefficient bar path for the press [90] . . . . . . . . . . . 25
2.12 Visual bar path feedback [61] . . . . . . . . . . . . . . . . . . . . 26
2.13 A snapshot of the wearable device market [60] . . . . . . . . . . . 27
2.14 Training feedback device competitors [2, 3, 11,16] . . . . . . . . . . 29
3.1 A model of how an accelerometer measures acceleration [93] . . . 32
3.2 A model of how a gyroscope measures angular velocity [46] . . . . 34
3.3 A model of how a magnetometer measures the magnetic field [35] 36
3.4 An example of how the magnetic field can be altered by a ferrousmetal [25] . . . . . . . . . . . . . . . . . . . . . . . . . . . . . . . 36
3.5 An example of the output of a Kalman filter given accelerometerand gyroscope signals [27] . . . . . . . . . . . . . . . . . . . . . . 38
3.6 Verbal example of a decision tree [89] . . . . . . . . . . . . . . . . 40
3.7 C4.5 algorithm for decision tree induction [41] . . . . . . . . . . . 41
x

3.8 selectSplittingAttribute() functions using information gain and in-formation gain ratio measures. [41] . . . . . . . . . . . . . . . . . 42
3.9 A visual example of a decision tree [113] . . . . . . . . . . . . . . 43
3.10 Random Forest Pseudocode [65] . . . . . . . . . . . . . . . . . . . 45
3.11 Extra-Trees splitting algorithm [47] . . . . . . . . . . . . . . . . . 46
6.1 A system diagram of the YEI IMU [21] . . . . . . . . . . . . . . . 58
6.2 A system diagram of the data collection phase of LIFT . . . . . . 59
6.3 The axes of the YEI IMU when placed on a barbell . . . . . . . . 61
6.4 A system diagram of the technique learning phase of LIFT . . . . 62
6.5 A system diagram of LIFT’s future automated technique feedbackloop . . . . . . . . . . . . . . . . . . . . . . . . . . . . . . . . . . 64
8.1 Full normalized confusion matrix for v1 squat . . . . . . . . . . . 71
8.2 Simple normalized confusion matrix for v1 squat . . . . . . . . . 73
8.3 Full normalized confusion matrix for v2 squat . . . . . . . . . . . 74
8.4 Simple normalized confusion matrix for v2 squat . . . . . . . . . . 75
8.5 Full normalized confusion matrix for v1 bench press . . . . . . . 77
8.6 Simple normalized confusion matrix for v1 bench press . . . . . . 79
8.7 Full normalized confusion matrix for v2 bench press . . . . . . . 80
8.8 Simple normalized confusion matrix for v2 bench press . . . . . . 81
8.9 Full normalized confusion matrix for v1 overhead press . . . . . . 83
8.10 Simple normalized confusion matrix for v1 overhead press . . . . 84
9.1 The second design of LIFT’s sensor packaging . . . . . . . . . . . 90
9.2 The ambiguity between the yaw (pink) and roll (green) degrees offreedom [39] . . . . . . . . . . . . . . . . . . . . . . . . . . . . . . 91
11.1 Magnetometer measurements (bottom) correlates nicely with whenrepetitons occured . . . . . . . . . . . . . . . . . . . . . . . . . . 95
xi
CHAPTER 1
Introduction
The Quantified Self (QS) movement [114] is a rapidly growing trend that aims
to help people keep track of various aspects of their lives to facilitate personal
development. One of the hot areas of QS is health and fitness [17,19]. Technology
that counts how many steps users walk and calories they burn used to be limited
to specialized pedometer devices, but since accelerometers and gyroscopes have
become cheaper in recent years due to manufacturing improvements [108, 112]
to keep up with the demand in the smartphone industry, the technology is now
ubiquitous. The fitness industry is now saturated with these tracking devices
in many different form factors. New fitness devices are on the horizon to reveal
even more detailed information about a user’s health by giving the user feedback
about how they are performing specific exercises.
1.1 Contributions
The LIFT automated weight lifting coach proposed in this paper aims to be an
open-source, barbell-centric analysis system that is a complement to proprietary,
on-body fitness devices. The LIFT weight lifting coach is modular and extensible
enough to be compatible with future fitness devices and their enhanced motion-
tracking capabilities.
1

1.2 Outline
The paper is laid out as follows: Chapter 2 covers the necessary domain-specific
background information; Chapter 3 covers the technical background information;
Chapter 4 covers related movement tracking system research; Chapter 5 covers
the methodology of the LIFT automated weight lifting coach; Chapter 6 covers
the implementation of the LIFT automated weight lifting coach; Chapter 7 covers
an experimental user study framework for the LIFT automated weight lifting
coach; Chapter 8 covers the results of the user study; Chapter 9 covers the
conclusions about the current capabilities of the LIFT automated weight lifting
coach; Chapter 10 looks forward to future work to be done on the LIFT automated
weight lifting coach.
2

CHAPTER 2
Domain Background
Barbell weight lifting is a very effective method for increasing overall strength in
athletes, which in turn, will increase their performance and decrease risk of injury
in their particular sport [44,63,90]. Mark Rippetoe is a well-known strength and
conditioning coach, and author of one of the most well-regarded and technically
thorough manuals on barbell training, Starting Strength [42, 56, 90]. Rippetoe
states that all people can benefit from becoming stronger due to a simple fact of
life that stronger people live longer [40,90]. Rippetoe’s thesis is that the simplest
way one can increase physical strength is to progressively add weight to compound
barbell exercises [90].
2.1 Benefits of compound exercise
Compound exercises are exercises that involve more than one joint and muscle
group, such as squat, bench press, and overhead press [90]. This is opposed to
isolation exercises that only involve one joint and muscle group, such as bicep
curls and leg extension machines [90]. The compound type of exercise forces
many muscle groups to work together to complete a given movement [90].
“Real world” strength-oriented tasks, such as lifting a couch or carrying a
box, are multi-joint, or “compound”, dynamic movements. Dynamic movements
involve contracting muscles in a continuous eccentric and concentric fashion [54].
3

Virtually all athletic, sport-specific movements are compound, dynamic move-
ments [90]. Therefore, training in this same compound, dynamic fashion will
best prepare a trainee, weekend warrior and athlete alike, for the real world and
sport-specific activity [90].
2.2 Benefits of barbell exercise
The advantage of training with barbells is that they can be gradually loaded
as a trainee’s strength progresses. Dumbbells, kettle bells, and other resistance
training implements do not have as fine of granularity of progress as barbells do.
Barbells have plates that can load as little as 0.25 lbs, whereas individual
dumbbells traditionally only increase in weight 5 lbs at a time [73]. For bilateral
exercises (where both sides of the body are used at the same time), such as the
bench press, this 5 lbs increase for dumbbells is actually realized by both limbs
as a total of 10 lbs increase in weight when compared to bench pressing with a
barbell. This is a significant jump (10%) for a novice male trainee whose bench
press 1 repetition maximum may only be 100 lbs. The corresponding smallest
increase in weight for a barbell would only be 0.5 lbs, which is only a 0.5% more
than their previous best lift and is much more attainable workout-to-workout
progress [71].
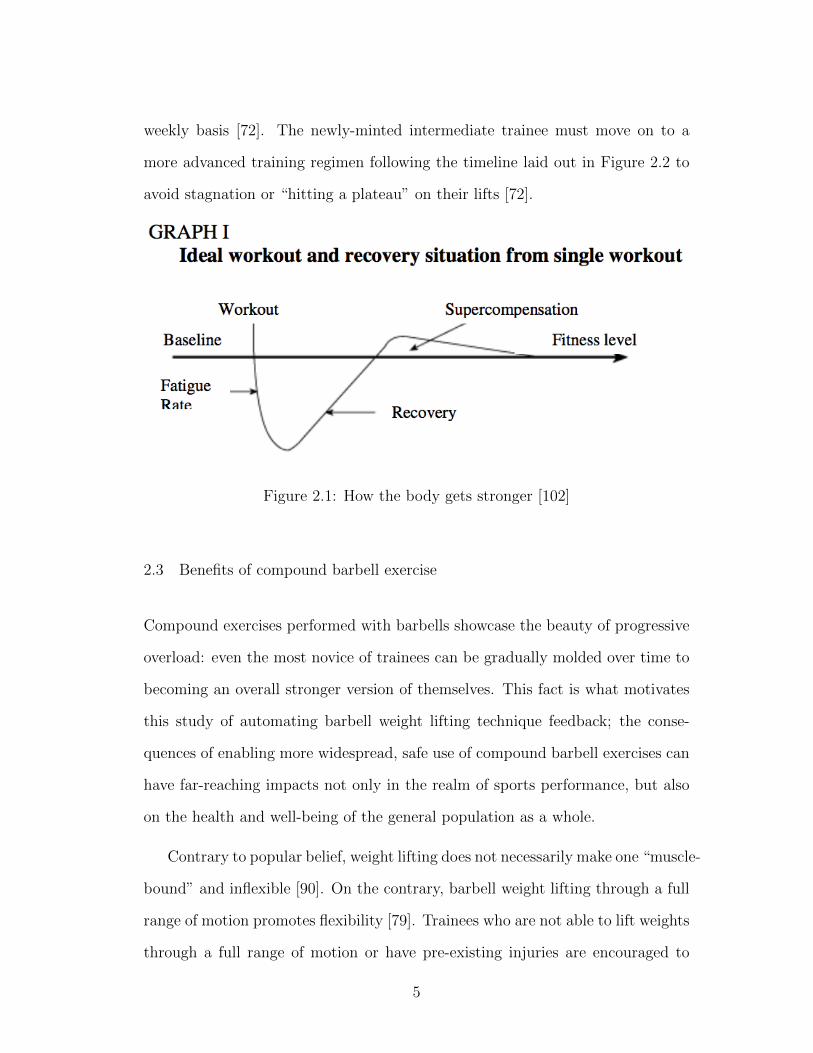
A novice trainee can sustain this gradual increase in workout-to-workout
weight, or “progressive overload” for a relatively long period of time [72]. This is
because their body is able to recover from the physiological stress of the loaded
exercise and “supercompensate” for the next time the load will be encountered,
as seen in Figure 2.1 [102]. The trainee is no longer considered to be a novice
when they are unable to consistently add incremental weight to their lifts on a
4
weekly basis [72]. The newly-minted intermediate trainee must move on to a
more advanced training regimen following the timeline laid out in Figure 2.2 to
avoid stagnation or “hitting a plateau” on their lifts [72].
Figure 2.1: How the body gets stronger [102]
2.3 Benefits of compound barbell exercise
Compound exercises performed with barbells showcase the beauty of progressive
overload: even the most novice of trainees can be gradually molded over time to
becoming an overall stronger version of themselves. This fact is what motivates
this study of automating barbell weight lifting technique feedback; the conse-
quences of enabling more widespread, safe use of compound barbell exercises can
have far-reaching impacts not only in the realm of sports performance, but also
on the health and well-being of the general population as a whole.
Contrary to popular belief, weight lifting does not necessarily make one “muscle-
bound” and inflexible [90]. On the contrary, barbell weight lifting through a full
range of motion promotes flexibility [79]. Trainees who are not able to lift weights
through a full range of motion or have pre-existing injuries are encouraged to
5
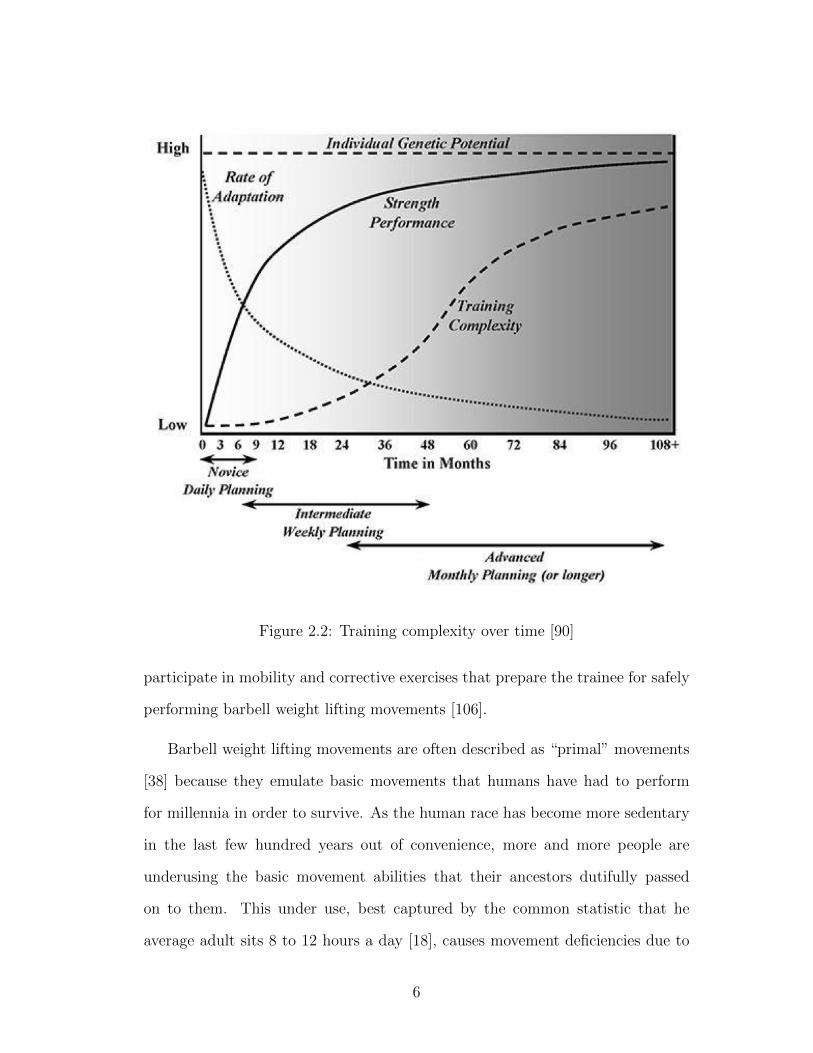
Figure 2.2: Training complexity over time [90]
participate in mobility and corrective exercises that prepare the trainee for safely
performing barbell weight lifting movements [106].
Barbell weight lifting movements are often described as “primal” movements
[38] because they emulate basic movements that humans have had to perform
for millennia in order to survive. As the human race has become more sedentary
in the last few hundred years out of convenience, more and more people are
underusing the basic movement abilities that their ancestors dutifully passed
on to them. This under use, best captured by the common statistic that he
average adult sits 8 to 12 hours a day [18], causes movement deficiencies due to
6

the atrophying and stiffening of muscles. Properly and consistently practicing
moving in these primal movement patterns is to fully express what the human
body is capable of, as Socrates alludes to in Figure 2.3. Rippetoe, a couple
of thousand years later, poetically describes properly performed barbell weight
lifting exercises as, “essentially the functional expression of human skeletal and
muscular anatomy under a load” [90]. In order to express the how the human
body moves, a trainee must first re-learn how to move their body with proper
technique.
Figure 2.3: Socrates’ perspective on fitness [50]
2.4 Weight lifting technique
To get a better understanding of how to automate barbell weight lifting technique
feedback, we will need to be familiar with what correct and incorrect technique
look like and the associated coaching cues for each exercise. The following section
describes in detail the correct and incorrect ways to perform the particular barbell
weight lifting techniques used in this study: the back squat, bench press, and
strict overhead press.
7
Naively, from studying physics or even from just lifting anything heavy, the
most efficient path for a barbell to take when being lifted, minimizing the amount
of work done to the barbell, is a straight, vertical line that is parallel to the force
of gravity. This naive assumption holds true with the overhead press, where the
trainee must “move their body around the bar” to achieve the optimal bar path
[90]. This assumption is invalid for other lifts when studying optimal squat and
bench press biomechanics: a small amount of horizontal movement is typically
necessary to perform these exercises safely [90]. This small horizontal movement
should be subtle and controlled enough by the trainee to be distinguished from
a major bar path technique error.
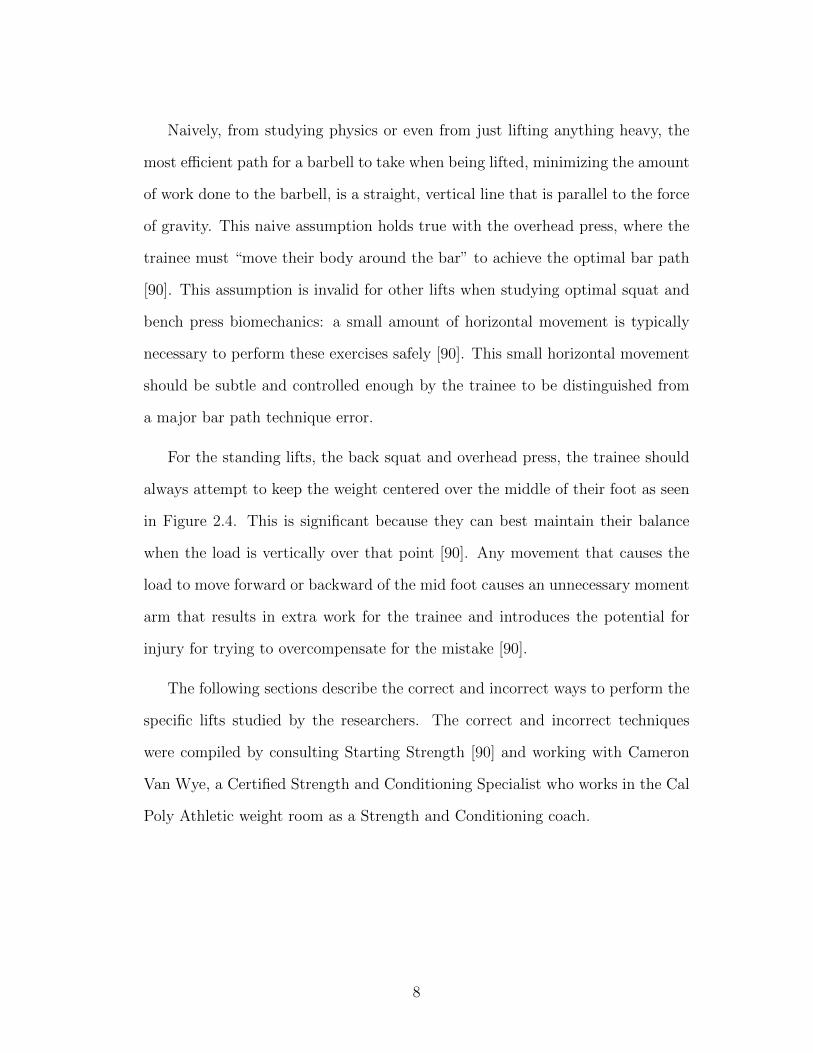
For the standing lifts, the back squat and overhead press, the trainee should
always attempt to keep the weight centered over the middle of their foot as seen
in Figure 2.4. This is significant because they can best maintain their balance
when the load is vertically over that point [90]. Any movement that causes the
load to move forward or backward of the mid foot causes an unnecessary moment
arm that results in extra work for the trainee and introduces the potential for
injury for trying to overcompensate for the mistake [90].
The following sections describe the correct and incorrect ways to perform the
specific lifts studied by the researchers. The correct and incorrect techniques
were compiled by consulting Starting Strength [90] and working with Cameron
Van Wye, a Certified Strength and Conditioning Specialist who works in the Cal
Poly Athletic weight room as a Strength and Conditioning coach.
8
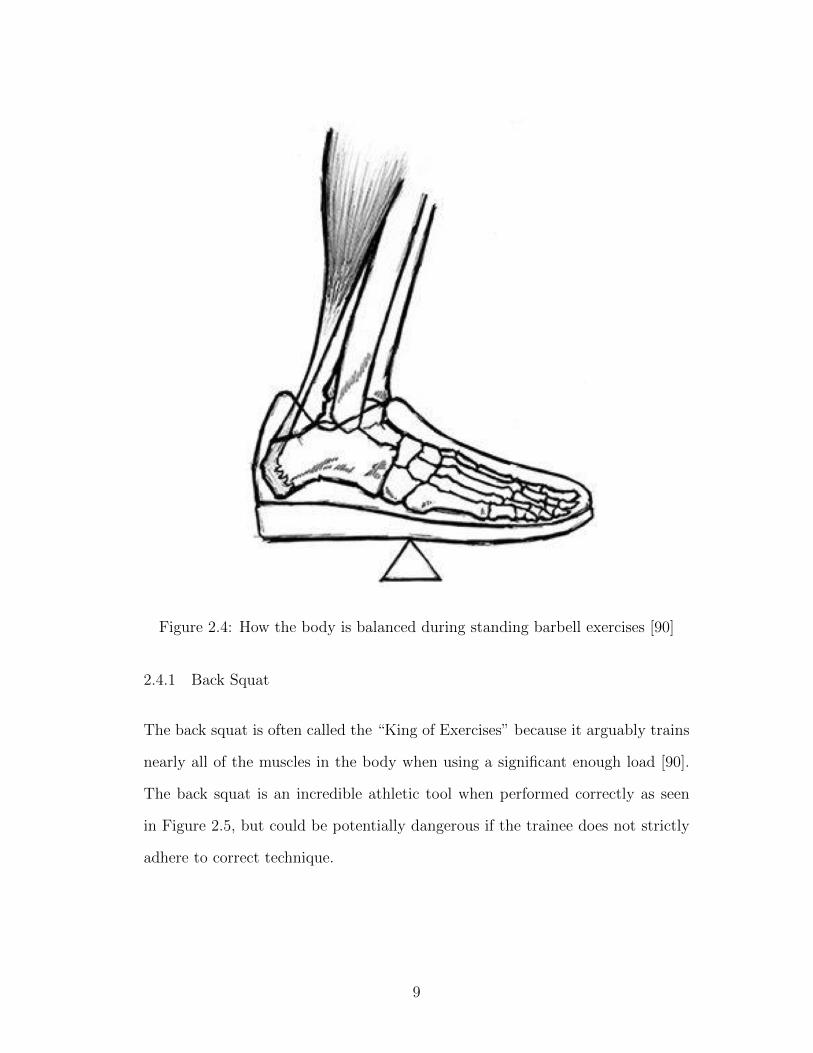
Figure 2.4: How the body is balanced during standing barbell exercises [90]
2.4.1 Back Squat
The back squat is often called the “King of Exercises” because it arguably trains
nearly all of the muscles in the body when using a significant enough load [90].
The back squat is an incredible athletic tool when performed correctly as seen
in Figure 2.5, but could be potentially dangerous if the trainee does not strictly
adhere to correct technique.
9

Figure 2.5: The correct way to squat [90]
2.4.1.1 Correct technique
1. Use thumbless grip wider than shoulder width
2. Tighten back by pulling elbows up and place the bar on the ”shelf” that
Trapezius muscles create
3. Keep head neutral with spine and tuck chin as if to hold a tennis ball
between chin and chest
4. Feet are shoulder width apart
5. Toes are pointed out at a 30 degree angle
10

6. Unrack bar in same position as squatting
7. Knees track over the toes
8. Perform the Valsalva maneuver by breathing in and bracing core with a
tight weight belt if possible which helps create more internal pressure to
stabilize the trunk
9. When crease of hip is lower than the knee, visualize pushing up with lower
back to activate hamstrings
10. Be mindful of the “master cue”, which is to try to track the bar over the
middle of the foot as seen in 2.5
2.4.1.2 Incorrect technique
The technique deficiencies recorded and labeled for the back squat were:
1. Head not looking forward
The head position of the trainee is critical for setting the spine for proper
positioning under a load. A common adage in weight lifting is “where you
look is where your body will go”. One may take away “don’t look down,
look up” from that advice when performing the squat. This is not strictly
correct because too much looking up can, at the very least be disorienting
for the trainee, at worst, unsafe according to Rippetoe, due to “placing the
cervical spine in extreme over extension and then placing a heavy weight on
the trapezius muscles directly underneath it” [90]. Unfortunately, looking
up is how squatting is taught in high school weight rooms all across the
country [90]. Improper head positioning may prevent proper hip drive from
happening by not allowing the trainee’s spine to be neutral throughout the
lift as well as loss of balance due to not having a close reference point to look
at [90], so the sensor may pick this up as a forward or backward translation
11

in the X-Z plane.
2. Upper back rounding
The upper back position of the trainee is critical for spine stability and
therefore safety. The trainee’s upper back and chest may not be flexible
enough to stay in thoracic extension, so the trainee may need to do mobility
exercises to correct this muscular imbalance. The upper back should be held
in a neutral position for the duration of the lift. This technique deficiency
could be characterized by a falling pitch and/or forward translation of the
sensor in the X-Z plane due to the shoulders coming forward and down
during the lift.
3. Lower back rounding
Lower back rounding most likely will occur at the bottom of the squat due
to the inflexibility of the trainee’s hamstrings. The hamstrings are stretched
to their maximum length above a parallel squatting position, so the trainee
will attempt to get to parallel by allowing their pelvis to posteriorly tilt
and their lower back to round. Rounding the back increases the shear
stress on the vertebrae of the lower back and makes them more prone to
injuries. Much like upper back rounding, having the lower back staying
in a neutral position is critical for safety and successfully completing the
lift. This is because the lower back is what connects the power-producing
hips and legs to the load-bearing portion of the body. Keeping the lower
back rigid helps facilitate the force produced by the hip and leg drive to be
applied to the load across the shoulders. The trainee can perform various
hamstring stretches and mobility exercises to practice getting to parallel
without rounding their lower back. This technique deficiency could be
characterized by a falling pitch and/or forward translation of the sensor in
12

the X-Z plane.
4. Back overextended / too vertical
Trainees can get the mental model of performing a back squat like a front
squat. The front squat is performed with a much more upright torso, which
is appropriate for where the load is for that exercise, because that is how
the trainee can keep the load over the middle of the foot. which is the point
where the trainee can maintain the best balance. Having a vertical torso for
the back squat is not appropriate, however, because the load is on the back
of the trainee. If the torso is too vertical, then the load will be behind the
mid-foot line and the trainee will be off balance. This technique deficiency
could be characterized by a rising pitch and/or backward translation of the
sensor in the X-Z plane.
5. Hips come too far out / chase with back
At the bottom of the squat, instead of pushing up against an “invisible
weight” with the lower back as Rippetoe suggests [90], the trainee will
move their hips back and up instead of forward and up. Moving the hips
back greatly reduces the load on the trainee’s hamstrings and instead shifts
the load to the lower back. This is not optimal because now the ham-
strings are not contributing to moving the load and the lower back is put
into a potentially injurious situation. The trainee should concentrate on
coming directly up, vertically translating their hips and torso at the same
time, out of the squat as they are lowering themselves down. This tech-
nique deficiency could be characterized by a lowering pitch and/or forward
translation of the sensor.
6. Hips roll under spine at top of repetition
As a trainee reaches the top of a squat, they mistakenly tilt their pelvis
13
posteriorly to get a sense of a hip thrust. Performing a hip thrust at the
top of a squat is unnecessary and tilting their pelvis in this fashion is much
like rounding their lower back at the bottom of the squat; posteriorly tilting
the pelvis increases the shear stress experienced by the lower back vertebrae
and increases the likelihood of injury. This technique deficiency could be
characterized by a lowering pitch and/or forward translation of the sensor.
7. Did not reach parallel
The trainee’s hip crease does not pass the top of their knee, so they are
not experiencing the full range of motion of the exercise, which is optimal
for increasing athletic performance as well as safety. The trainee should
work on flexibility and mobility if they are unable to reach the parallel
squatting position. This technique deficiency could be characterized by a
jerky, abrupt change in the linear acceleration signal from the sensor at the
bottom of the squat.
8. Did not stand up all the way
The trainee does not fully stand up out of the squat, but instead starts to
go back down when they are most of the way up. The trainee does not
experience the full range of motion for each repetition and are missing out
on the athletic and safety benefits of performing the full range of motion for
this exercise. This technique deficiency could be characterized by a jerky,
abrupt change in the linear acceleration signal from the sensor at the top
of the squat caused by the ends of the bar flexing.
9. Knees not spread out
The trainee’s knees do not track over their toes. Most likely, their knees cave
in to provide a “better” support structure for standing up out of a squat.
The lateral movement under a heavy load can increase the risk of injury
14

for the several knee ligaments and cartilage. This technique deficiency
could be characterized by a grinding type of repetition resulting in a linear
acceleration signal from the sensor that is closer to zero than the average
signal.
10. Heels coming off of the ground
Heels coming off of the ground is indicative that the trainee is out of balance
and the load is no longer over the mid-foot where they can achieve the
best balance. A way to solve this is to have the trainee curl their toes in
their shoes to force them to center their weight on the middle of their foot.
This technique deficiency could be characterized by a lowering pitch and/or
forward translation of the sensor due to the trainee becoming out of balance
and creating more work.
11. Wrists roll forward or backwards during lift
The trainee may want to adjust the bar position during a lift because their
initial set up was off. This extra movement wastes energy and potentially
could move the bar out of balance from the middle of the foot, creating more
work for the trainee to do. This technique deficiency could be characterized
by a changing pitch of the sensor.
12. Did not complete repetition
The trainee had to be spotted or otherwise did not complete this recorded
repetition and will not be included in the technique training set.
2.4.2 Bench Press
The Bench Press is one of the most common exercises performed for strength
gain. A trainee’s bench press is often the only metric other trainees ask about
to gauge their overall strength. Many trainees do not perform the bench press
15

optimally and could be lifting more with the correct technique, as seen in Figure
2.6.
Figure 2.6: The correct way to bench press [90]
2.4.2.1 Correct technique
1. Contract upper back to give stable points of contact on bench
2. Grip the bar with a thumb over grips about shoulder width apart
16

3. “Break the bar”. Contract lats to keep elbows at approximately 45 degrees.
4. Firmly plant feet on ground and use legs to “drive” power during set to
upper body. Do not change foot position during set
5. Engage glutes to protect lower back from over extension
6. Inhale and exhale at the top of the repetition. Holding air in while per-
forming repetition increases stability.
2.4.2.2 Incorrect technique
The technique deficiencies recorded and labeled for bench press were:
1. Upper back not tight
The upper back is not contracted and is not providing the trainee increased
stability on the bench.
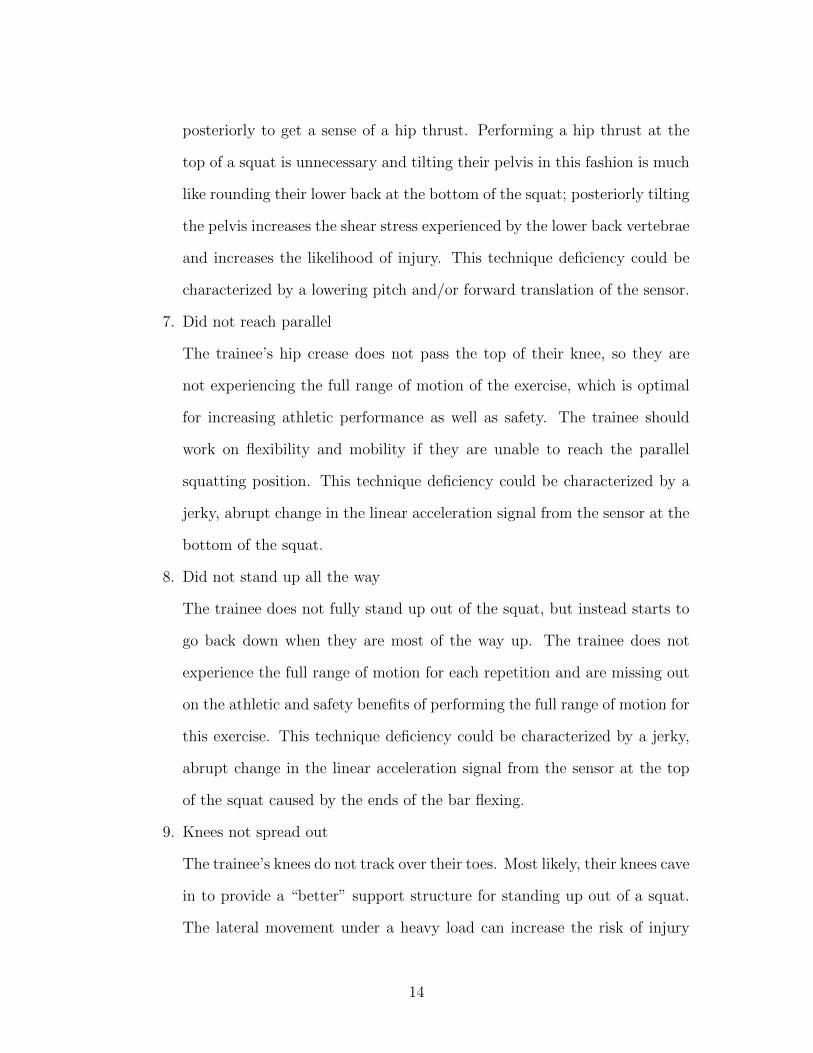
2. Elbows out
The trainee is not engaging their lats, therefore not pulling their elbows in
to a safer angle. Shoulder impingement is more likely with elbows closer
to 90 degrees away from trunk, as seen on the right side of Figure 2.7 Bar
path efficiency is compromised for safer forces on the shoulder joint [90].
This technique deficiency could be characterized by minimal translation in
the X-Z plane.
3. Glutes not engaged
The trainee is not using their glutes to help facilitate transfer of leg drive
to the upper body and are not protecting their lower back vertebrate from
shear stress caused by over extension. The glutes also give a solid point of
stability on the bench. This technique deficiency could be characterized by
instability in the orientation of the bar.
4. Excessive lower back arch
17

The trainee is arching lower back such that their glutes are no longer on the
bench. This is a dangerous position for the lower back because it applies a
larger than average shear stress to the vertebrae.
5. Bounce off of chest
The trainee is not performing the repetition in a controlled manner. The
bounce helps the trainee bench more weight, but does not necessarily fa-
cilitate strength gains. This could be detected by LIFT as a significantly
higher maximum acceleration than other repetitions.
6. Does not touch chest
The trainee does not lower bar to chest to achieve full range of motion at
the bottom of the repetition. Full range of motion is important for getting
the most work out of a repetition. This could be detected by LIFT as an
absence of noise from when the athlete would have touched their chest or
a significantly lower maximum acceleration for the feature set as a whole.
7. Does not lock out
The trainee does not go through full range of motion at the top of the
exercise. The triceps are not being contracted as much as they could be if
they were paused at the top of the bench press. This could be detected by
LIFT as a sudden change in acceleration as the weights usually clink at the
top of these type of repetitions.
8. Wrists roll forward or backwards during lift
The trainee is wasting energy by rolling their wrists because they did not
set up properly. This could be detected by LIFT due to the change in
orientation of the bar.
9. Left/right side comes up before other
Trainee is either laying crooked on bench press or they have a muscular
18
imbalance that should be corrected. This could be detected by LIFT due
to the change in orientation of the bar.
10. Jerky repetition
The repetition is very uncontrolled in general. The trainee may be under
trained or is trying to push the bar up as fast as they can. This could
be detected by LIFT due to the high variability in linear acceleration and
orientation.
11. Did not complete repetition
The trainee had to be spotted or otherwise did not complete this recorded
repetition and will not be included in LIFT analysis.
Figure 2.7: Anatomy of a bench press with elbows at 45 degrees on the left and
90 degrees on the right. [90]
19

2.4.3 Overhead Press
The overhead press hearkens back to intuitively what a person would do with a
barbell right after they picked it up off of the ground. As Rippetoe says “When
you press a barbell overhead, you celebrate the spirit of weight training” [90].
Overhead press is a very useful lift to complement bench press in building
upper body pushing strength. This is because a properly performed overhead
press, as seen in Figure 2.8, can help develop a stronger bench press by developing
stronger shoulder and tricep muscles, but the other way around is not necessarily
true [90].
2.4.3.1 Correct technique
1. Grips on bar should be shoulder width apart
2. Elbows and chest should be up and upper back contracted to support the
bar
3. Elbows should stay in and not flare out to maximize movement efficiency
and reduce risk of shoulder injury
4. Bar path should pass right in front of face, as soon as bar clears head,
contract glutes and move torso under bar to keep the bar balanced over
mid foot.
2.4.3.2 Incorrect technique
The technique deficiencies recorded and labeled for strict overhead press were:
1. Chest/Shoulders/Elbows down
The trainee’s upper body can get fatigued and start to round forward with
20
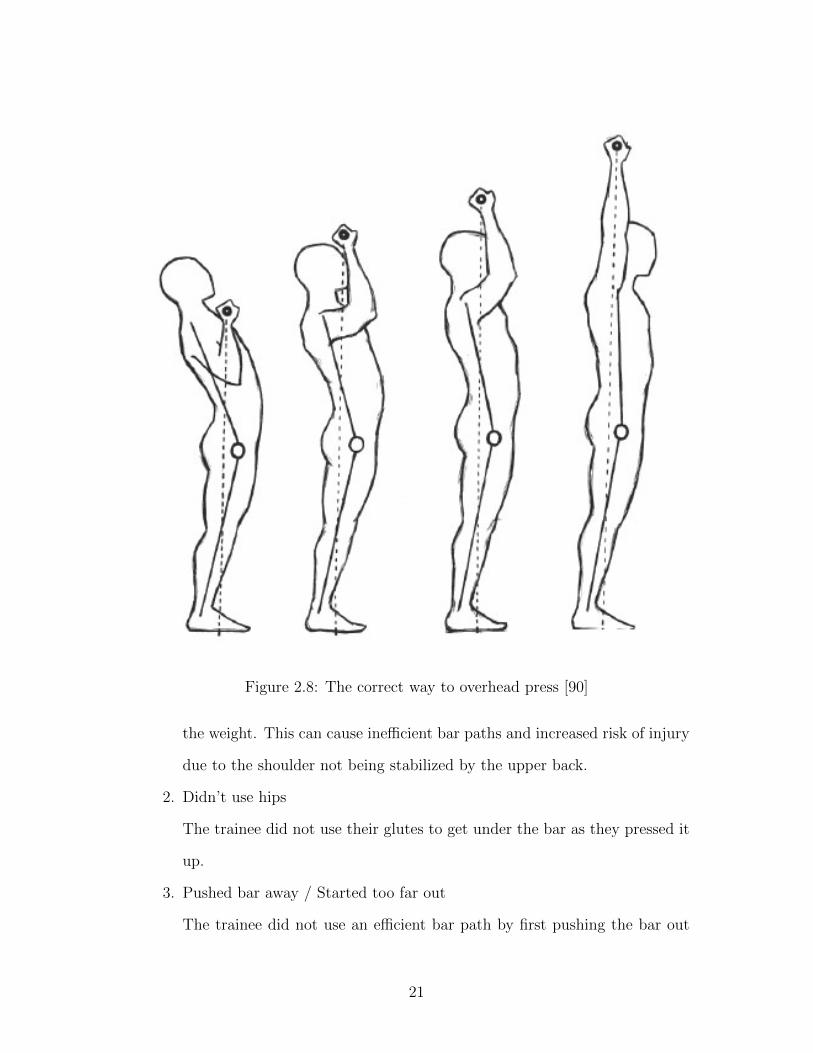
Figure 2.8: The correct way to overhead press [90]
the weight. This can cause inefficient bar paths and increased risk of injury
due to the shoulder not being stabilized by the upper back.
2. Didn’t use hips
The trainee did not use their glutes to get under the bar as they pressed it
up.
3. Pushed bar away / Started too far out
The trainee did not use an efficient bar path by first pushing the bar out
21

instead of straight up. This path inefficiency can also occur when the trainee
start with the bar too far away from their body. These errors cause more
overall work because it moves the bar out of balance with the mid foot, as
seen in Figure 2.11.
4. Didn’t get under bar
The trainee did not move their torso forward under the bar to help keep
the bar over the middle of the foot as seen in Figure 2.9.
5. Too much layback
The trainee leaned back too much in the process of pressing the bar. This
movement puts unecessary shear stress on the lower back vertebrate and
can increase the potential for injury.
6. Wrists roll forward or backwards during lift
The trainee wastes energy rolling their wrists as they move through a lift
as seen in Figure 2.10. Moving the wrists under a load could increase risk
of injury as well.
7. Left/right side goes up before the other
The trainee either started in an unbalanced grip position or they have a
muscular imbalance that needs to be corrected.
8. Jerky, uncontrolled rep
The trainee performed generally uncontrolled repetitions that are poten-
tially dangerous to their shoulder health.
9. Elbows out
The trainee flared their elbows out, resulting in an inefficient bar path and
subjecting their shoulders to potentially injurious positions.
10. Did not complete repetition
The trainee had to be spotted or otherwise did not complete this recorded
22
repetition and will not be included in LIFT analysis.
Figure 2.9: The importance of getting under the bar during the press to keep it
balanced over the mid foot [90]
2.5 Weight lifting technique feedback
Athletes need constant feedback to correct their weight lifting movements to en-
sure that they are safely lifting weights and can continue to make progress. Tra-
ditional forms of obtaining feedback have been limited to taking video of the lift
and self-critiquing or having a trainer critique it, or listening to a training partner
or a trainer’s advice immediately after a lift. A new field of study is emerging
23
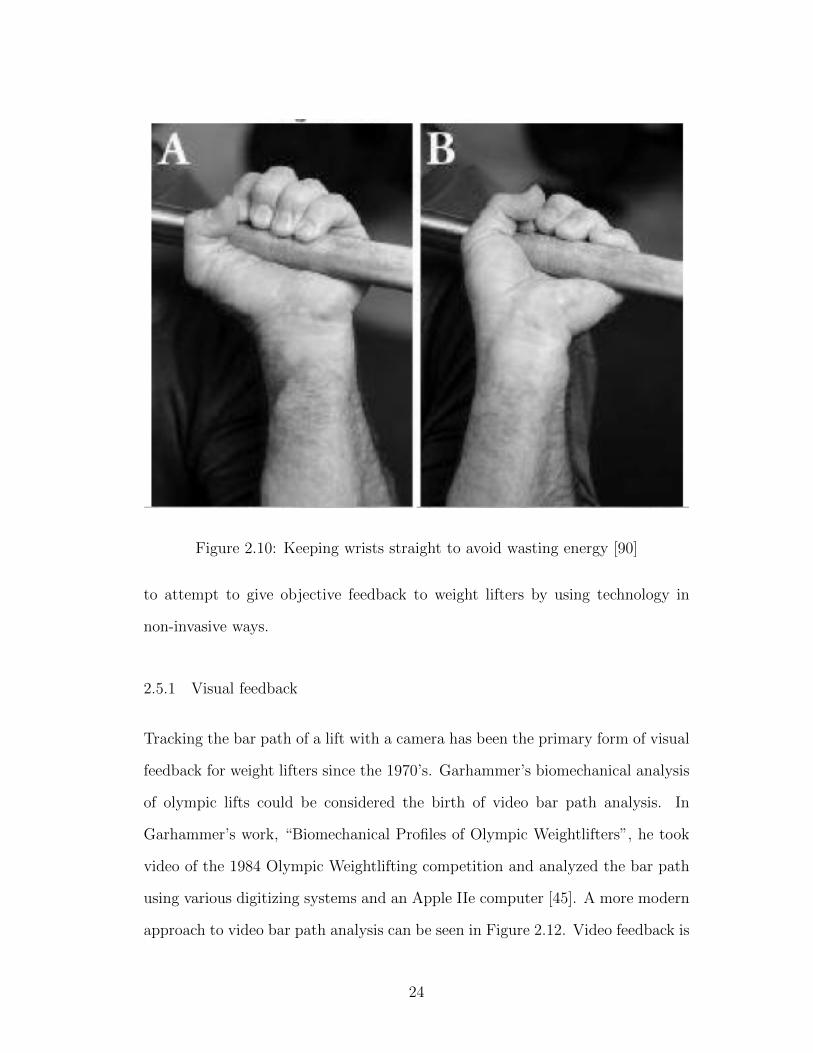
Figure 2.10: Keeping wrists straight to avoid wasting energy [90]
to attempt to give objective feedback to weight lifters by using technology in
non-invasive ways.
2.5.1 Visual feedback
Tracking the bar path of a lift with a camera has been the primary form of visual
feedback for weight lifters since the 1970’s. Garhammer’s biomechanical analysis
of olympic lifts could be considered the birth of video bar path analysis. In
Garhammer’s work, “Biomechanical Profiles of Olympic Weightlifters”, he took
video of the 1984 Olympic Weightlifting competition and analyzed the bar path
using various digitizing systems and an Apple IIe computer [45]. A more modern
approach to video bar path analysis can be seen in Figure 2.12. Video feedback is
24
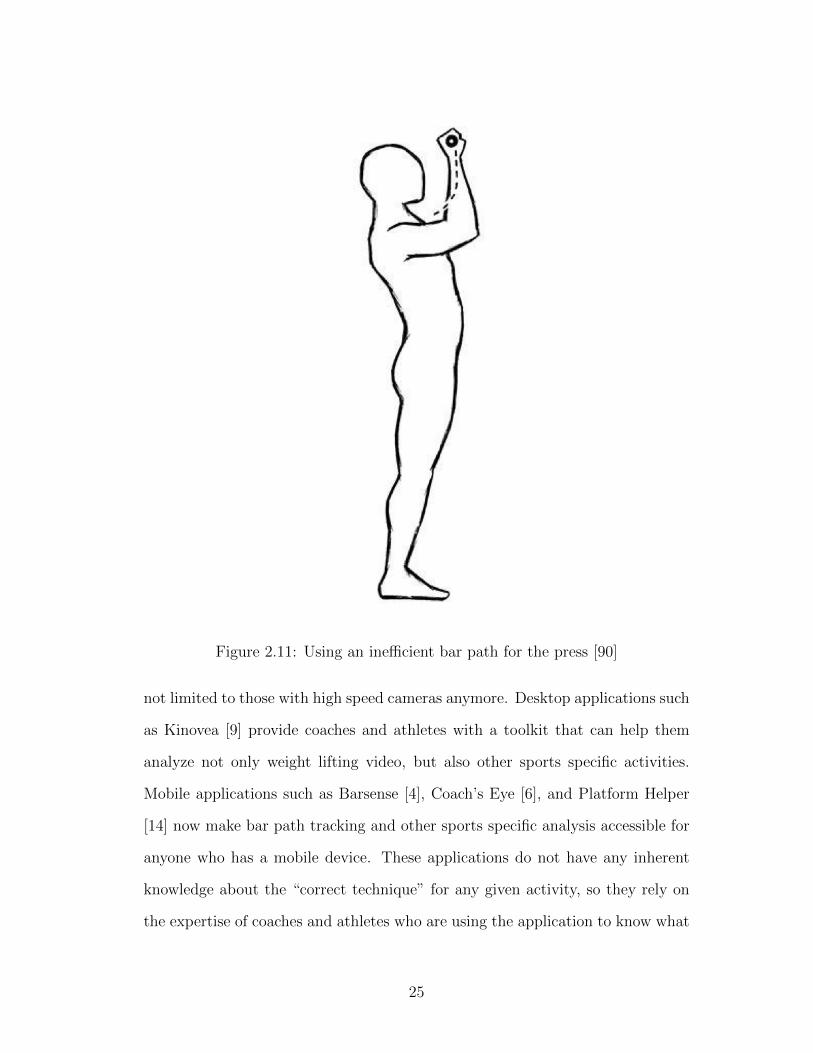
Figure 2.11: Using an inefficient bar path for the press [90]
not limited to those with high speed cameras anymore. Desktop applications such
as Kinovea [9] provide coaches and athletes with a toolkit that can help them
analyze not only weight lifting video, but also other sports specific activities.
Mobile applications such as Barsense [4], Coach’s Eye [6], and Platform Helper
[14] now make bar path tracking and other sports specific analysis accessible for
anyone who has a mobile device. These applications do not have any inherent
knowledge about the “correct technique” for any given activity, so they rely on
the expertise of coaches and athletes who are using the application to know what
25
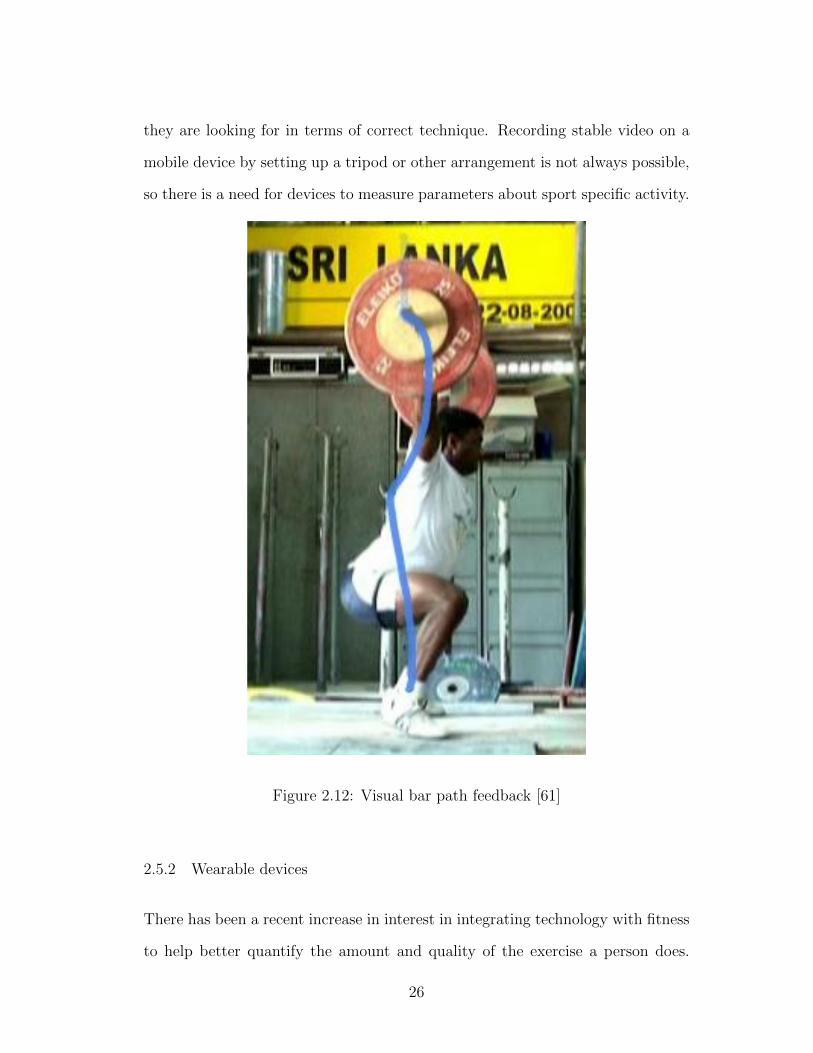
they are looking for in terms of correct technique. Recording stable video on a
mobile device by setting up a tripod or other arrangement is not always possible,
so there is a need for devices to measure parameters about sport specific activity.
Figure 2.12: Visual bar path feedback [61]
2.5.2 Wearable devices
There has been a recent increase in interest in integrating technology with fitness
to help better quantify the amount and quality of the exercise a person does.
26
The reason for this spike in interest is twofold. First, motion-tracking sensors
(accelerometers, gyroscopes, etc) have become smaller and cheaper [108, 112],
thus more viable for mass commercial production and adoption in many devices.
This new generation of sensors is able to be integrated into devices such as smart
phones [92], wristbands [1,5,7,8,13,20], arm bands [16], clothing [2], and running
shoes [12]. The second reason interest in fitness technology has increased is
because logging, attractively presenting, and holding users accountable with data
can help motivate a user to continue with an exercise program that will help lead
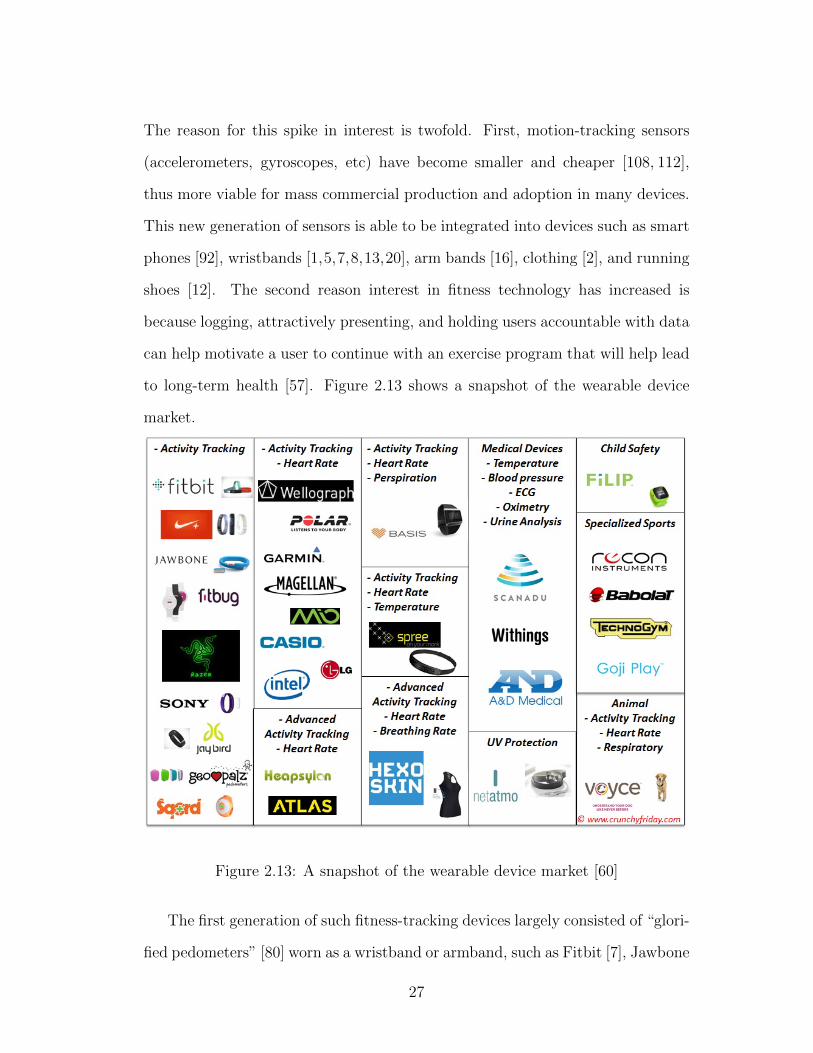
to long-term health [57]. Figure 2.13 shows a snapshot of the wearable device
market.
Figure 2.13: A snapshot of the wearable device market [60]
The first generation of such fitness-tracking devices largely consisted of “glori-
fied pedometers” [80] worn as a wristband or armband, such as Fitbit [7], Jawbone
27
Up [8], and Nike+ [13]. These devices were largely limited to currently estimat-
ing how many calories a trainee is burning, and distance walked or ran. The
second generation fitness devices introduced by the incumbents as well as new
competitors, such as Amiigo [1], Basis [5], Polar Flow [15] and Withings [20]
started to add in new features, such as sleep tracking and heart rate monitoring
to up the ante in the increasingly competitive health and fitness device mar-
ket. In late 2013 to early 2014, several next-generation fitness trackers were
announced in what can only be described as a tour de force in one-upmanship
or complete coincidence. Athos [2], Atlas [3], Moov [11], and PUSH [16] were
announced within weeks of each other. On the surface, each device will attempt
to track an athlete’s performance in terms of exercise-specific metrics, such as
how many repetitions and sets were completed as well how much force the ath-
lete produced. The seemingly more advanced Atlas and Moov also claim to be
able to do technique analysis on exercises, which can decrease an athlete’s risk of
injury [3,11]. All of these next-generation fitness devices, as seen in Figure 2.14,
are crowd-funded business ventures that, as of this writing, have not shipped to
customers yet. The main differentiator between these devices seems to be form
factor (armband vs. wristband, etc) and the algorithms that power them. The
features claimed by these consumer-level devices far exceed features offered by
current academic researchers. It is suspected that due to the lucrative opportuni-
ties by taking a fitness device to market, a would-be researcher is understandably
hesitant to divulge valuable intellectual property in an academic research paper.
The LIFT analysis system intends to become an open-source complement to these
proprietary fitness devices.
One way LIFT can leverage integration with future fitness tracking devices
such as the Moov is that it would benefit from improved sensors and software
28

Figure 2.14: Training feedback device competitors [2, 3, 11,16]
API support. The Moov is built specifically for sport technique feedback, so the
hardware design takes this into account, whereas the YEI IMU currently used
by LIFT is just a general-purpose IMU. The Moov API could include native
support for position, velocity, and repetition tracking which would be much more
useful application-specific information than general acceleration, gyroscope, and
magnetometer data. The Moov has demonstrated an intriguing level of position
tracking already via a developer demo where the Moov seemingly is able to display
the 3D modeled position of punches thrown in real time [10]. This powerful
position determination would be able to plug into LIFT as soon as the SDK
becomes available. The only concern would be its performance around metallic
objects, as seen in the first version of LIFT and discussed in Section 9.6.2.
29

CHAPTER 3
Technical Background
This chapter will go into detail about the basic inner workings of how mobile
devices record and analyze data.
3.1 How device sensors work
There are three basic sensors that are used in mobile devices everywhere today:
the accelerometer, gyroscope, and magnetometer. These sensors generate data for
mobile devices to process and interpret their own movement through space. The
next sections will describe what each sensor measures and how they conceptually
do so.
3.1.1 Accelerometer
The accelerometer measures the acceleration felt by the device over time. Harking
back to basic physics, acceleration is the derivative of velocity over time as seen
in Figure 3.1.1. Velocity, in turn, is the integral of acceleration over time (as
seen in Figure 3.1.1) and the derivative of displacement over time (as seen in
Figure 3.1.1. In other words: acceleration contains information about the change
in velocity over time for the device.
Acceleration is defined as:
30

−→a =d−→vdt
Velocity is defined as:
−→v =
∫−→a dt
Displacement is defined as:
−→d =
∫−→v dt
Weight lifting movements, almost by definition by virtue of being performed
by humans (as opposed to machines) will have a non-constant velocity, which
means that an accelerometer will measure a non-zero acceleration (it wouldn’t
measure exactly 0 for reasons explained soon).
The main reason why this non-zero acceleration data is useful to measure is
because of the Newton’s Third Law of Motion, where “to every action there is
always opposed an equal reaction” [85]. This law shows that as the trainee moves
the mass of the bar through space, they are providing a normal, or opposing, force
against the force of gravity. Reviewing Newton’s Second Law of Motion in Figure
3.1.1 to define “force”:
F = ma
where F is force, m is mass, and a is acceleration.
What is interesting about accelerometers however is that both the trainee’s
applied normal force’s acceleration (also called linear acceleration) vector and the
normal force due to gravity’s acceleration vector are measured [93].
31

−→F =
−−−−→Fapplied +
−−−−−−−−−→FnormalGravity
The reason for the accelerometer measuring the normal force due to gravity
requires a deeper look into how accelerometers are modeled.
Accelerometers measure the forces felt much like a mass on springs in a box
as seen in Figure 3.1. The sensor if left resting on a surface, will measure an
upwards normal force of 1g (g is the acceleration due to gravity, 9.8m/s2) because
the model mass is being supported by the normal force supplied by the box to
equally oppose gravity and causes the mass to stay still as seen in the first case
in Figure 3.1. In free fall, the accelerometer will measure 0g because both the
mass and box with the attached springs will be accelerating at the same rate, so
no difference will be measured as in the second case in Figure 3.1. The common
accelerometer measurement will have both the normal force due to gravity as well
as any movement forces applied to the sensor combined into the same output
acceleration vector as seen in the fourth case of Figure 3.1.
Figure 3.1: A model of how an accelerometer measures acceleration [93]
Therefore, to obtain the linear acceleration vector, the normal force due to
gravity vector must be subtracted from the accelerometer’s output acceleration
32

vector. This is a non-trivial task, because the device must have a very good
idea of what orientation is with respect to the Earth, or else this could introduce
large amounts of error as seen in Table 3.1. We will cover a solution that the
researchers use to do this later in Section 3.2.
Table 3.1: How quickly error can accrue over time due to incorrect initial orien-
tation calculations [26]
A weakness of the accelerometer is that it is a very noise-prone sensor [93].
It can be very accurate to measure patterns over the long term, but there can be
very wide range of minima and maxima even within a single second as seen in
the green signal in Figure 3.5. This noisiness will be compensated for in Section
3.2.
3.1.2 Gyroscope
The gyroscope measures the angular velocity felt by the device over time [93]. It
has a very quick, accurate short-term response as opposed to accelerometers, but
is prone to long term drift inaccuracies [93]. The gyroscope is able to measure
angular velocity by using a constantly rotating platform with a oscillating mass as
33
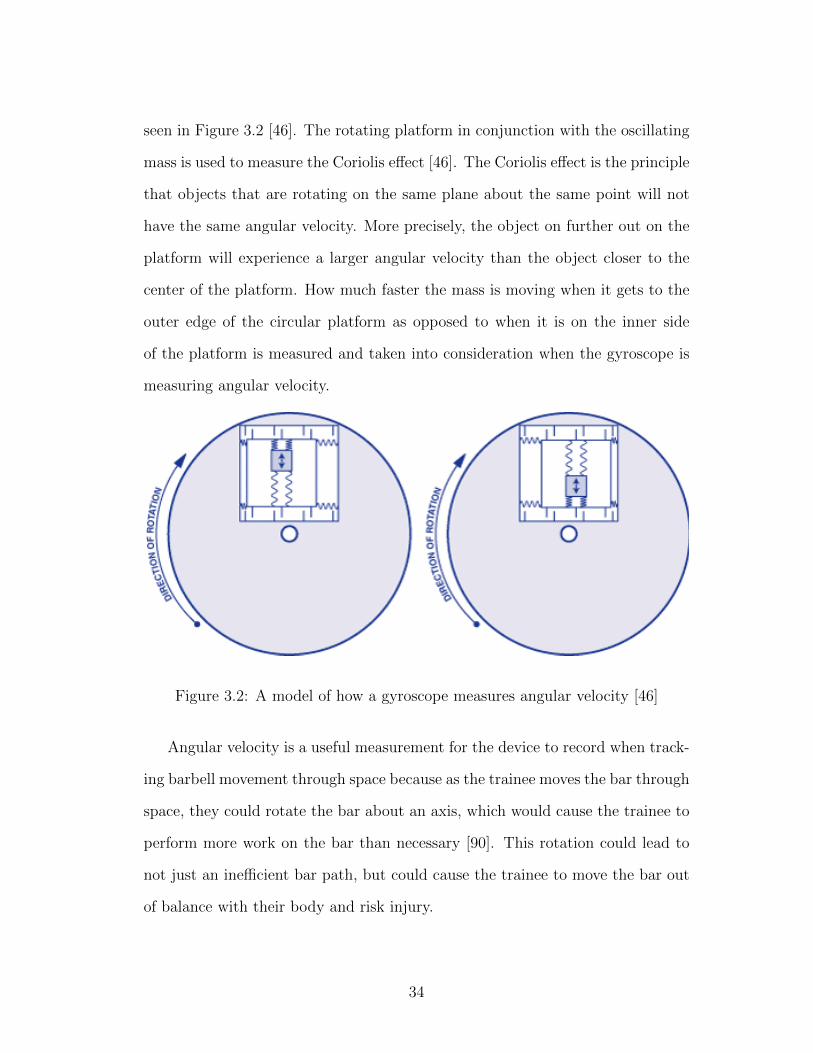
seen in Figure 3.2 [46]. The rotating platform in conjunction with the oscillating
mass is used to measure the Coriolis effect [46]. The Coriolis effect is the principle
that objects that are rotating on the same plane about the same point will not
have the same angular velocity. More precisely, the object on further out on the
platform will experience a larger angular velocity than the object closer to the
center of the platform. How much faster the mass is moving when it gets to the
outer edge of the circular platform as opposed to when it is on the inner side
of the platform is measured and taken into consideration when the gyroscope is
measuring angular velocity.
Figure 3.2: A model of how a gyroscope measures angular velocity [46]
Angular velocity is a useful measurement for the device to record when track-
ing barbell movement through space because as the trainee moves the bar through
space, they could rotate the bar about an axis, which would cause the trainee to
perform more work on the bar than necessary [90]. This rotation could lead to
not just an inefficient bar path, but could cause the trainee to move the bar out
of balance with their body and risk injury.
34

3.1.3 Magnetometer
The magnetometer measures the strength and direction of the surrounding mag-
netic field over time. The magnetic field detected by a magnetometer can either
represent the Earth’s magnetic field or the resultant magnetic field interactions
with ferrous metals or other sources of electromagnetic activity in the magne-
tometer’s environment. A basic, non-MEMS magnetometer measures the mag-
netic field by the Hall effect, which works by “detecting a voltage across a metallic
surface in response to a magnetic field that is perpendicular to the metallic sur-
face” [35], as seen in Figure 3.3. The voltage that is seen across the metallic
surface is called the Hall voltage, and can be used to infer how strong the mag-
netic field is in a given direction. A naive way to make a compass that measures
the magnetic field in three dimensions would be to align three magnetometers all
perpendicular to each other and turn the resultant vector of Hall voltages into a
magnetic field magnitudes. Newer MEMS-based magnetometers use the Lorentz
force and other more advanced methods to determine the magnetic field [107],
but all that is needed to be gathered from this background is the intuition that
the Earth’s magnetic field is always in play and can be measured by electronic
equipment, hence the term “electromagnetic” field.
The main weakness of the magnetometer in this application is that it can be
influenced by localized ferrous metals as seen in Figure 3.4. This is a problem that
will affect LIFT as it is close to ferrous metals such as barbells and plates, but
can be remedied by putting space between LIFT’s sensor and any surrounding
ferrous metals.
35
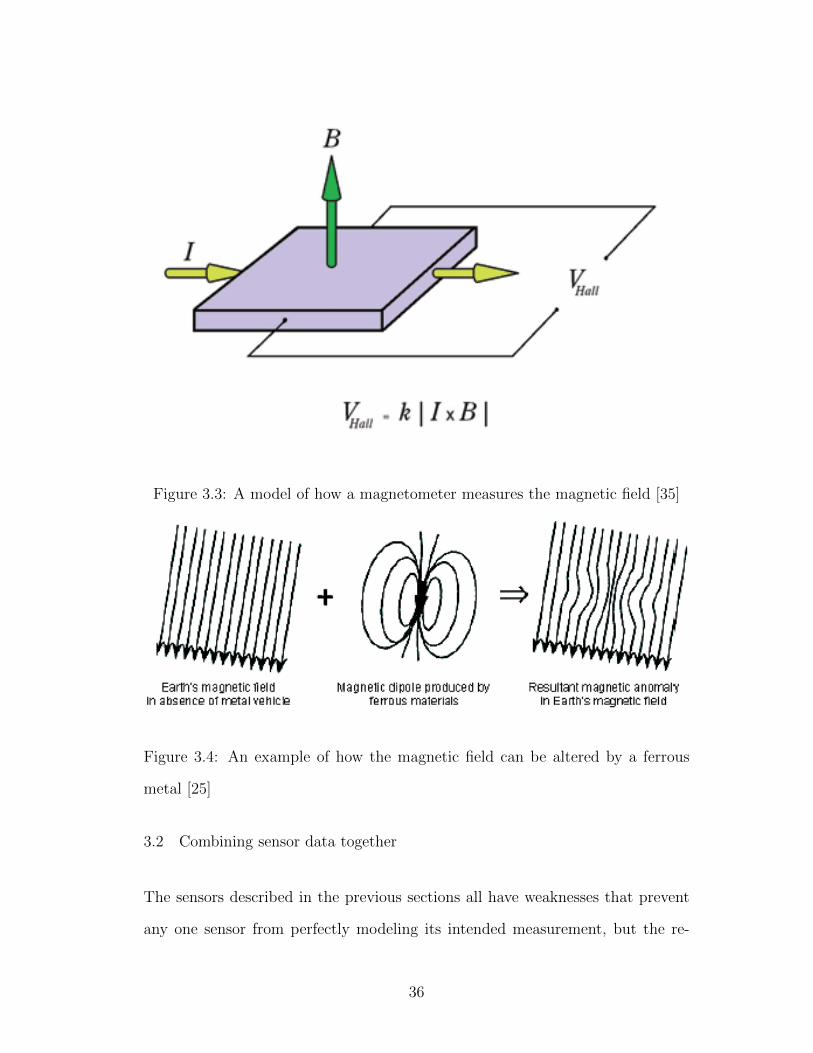
Figure 3.3: A model of how a magnetometer measures the magnetic field [35]
Figure 3.4: An example of how the magnetic field can be altered by a ferrous
metal [25]
3.2 Combining sensor data together
The sensors described in the previous sections all have weaknesses that prevent
any one sensor from perfectly modeling its intended measurement, but the re-
36

sults from all three of these sensors can be combined together in such a way to
compensate for each sensor’s weakness and produce more accurate data values to
be analyzed.
An online real-time Kalman filter is used on the YEI 3-Space Bluetooth Sensor
to accomplish this goal of mutual sensor compensation [21]. The Kalman filter is
a linear estimator, which means that its output is made from a linear system of
equations and best models systems that have linear behavior [24]. The Kalman
filter also assumes that any noise in the system has a gaussian distribution [24].
The filter works by first making a prediction of the future state of the sensor,
linAcct, by taking a prior state, acct−1, and adding any compensatory terms
to it, such as gyroscope data, gyrot, when determining the orientation of the
device [24]. These terms are multiplied respectively by appropriate governing
equations and weights, A and B, for each type of sensor [24]. Noise cannot be
completely avoided when reading from the gyroscope, so there is a noise term
ε [24].
linAcct = A ∗ acct−1 + B ∗ gyrot + ε
Next, Kalman filter makes a prediction for the measurement of the sensor
(acct) by passing a sensor prediction function (f(x)) the linAcct term and ac-
counting for error ε that is possible [24].
acct = f(linAcct) + ε
Finally, the Kalman filter determines compensated estimate for the given
sensor, linAccest, by measuring the actual sensor in question, acct, subtracting
37

it from its predicted value, acct, and multiplying that by the pre-tuned Kalman
gain vector, k. This quantity is then added to the linAcct term.
linAccest = linAcct + k ∗ (acct − acct)
The scenarios for how this equation play out in a couple of ways. One way
is that the predicted measurement, acct, could be the same as the measurement,
acct, and that entire term goes away, with the original state prediction, linAcct,
becoming the next state for the sensor linAccest. The other is that measured
sensor value, acct, could be different from the predicted value acct, so the Kalman
gain vector k can scale how much that difference affects the estimated value
linAccest. This general process is expanded to three dimensions in the LIFT
system due to unrestricted freedom of movement on the barbell.
Figure 3.5: An example of the output of a Kalman filter given accelerometer and
gyroscope signals [27]
38

In Figure 3.5, the green signal represents example raw accelerometer mea-
surements and the blue one are the cleaner, Kalman filtered measurements.
3.3 How data classification systems work
Classification algorithms are a type of “machine learning”. Classification algo-
rithms can “learn” to predict the label of given input values when “trained” with
a representative data set for a specific application. This fact makes them inter-
esting to apply to domains that have the potential to generate a lot of data that
also have known domain-specific labels. Classification algorithms shine where the
pattern in the raw data itself is not clear to the human eye, but it can be teased
out and differentiated with statistical features that machine learning algorithms
act upon.
Statistical features such as mean, variance, standard deviation, max, min, etc.
can be used to describe a particular instance of an input signal. These sets of
statistical features are, naturally, called feature sets. Specific instances of feature
sets can be paired with application-specific labels that can tell a classification
algorithm that those set of features are an example of what a given label “looks”
like. Classification algorithms can take these feature-set label-pairings and build
their own model of how the underlying data defines those specific labels and can
be used to predict future, unlabeled data sets.
How classification algorithms build their internal model predicting feature sets
is algorithm-dependent. The following sections will discuss how the particular
classification algorithms used by LIFT work internally and their suitability for
LIFT’s specific data set.
39

3.3.1 Decision tree
A decision tree is a graph of nodes with feature checks that can classify unlabeled
feature sets. Quinlan et al. describes an example decision tree in pseudocode:
Figure 3.6: Verbal example of a decision tree [89]
Figure 3.6 reads not unlike a series of nested “if-statements” found in virtually
every programming language. The difference with these “if-statements”, however,
is that these were automatically generated by a data set that had a number of
feature sets and corresponding labels. This ability for a computer to “learn”
what feature values best represent the particular label is the fundamental building
block for the LIFT system. Manually defining feature guidelines for how a “good”
weight lifting technique should look would be tedious and would not lead to a very
robust system because different people have different limb lengths and variations
of correct technique. The more optimal way is to get as wide of a variety of body
types as possible. This method covers as many cases of different limb lengths
and technique variations as possible for the demographics of the testing facilities
in use by the researchers.
40

3.3.1.1 Decision Tree Algorithm
An adapted version of Quinlan’s C4.5 decision tree induction algorithm will be
discussed here for clarity [41]:
Figure 3.7: C4.5 algorithm for decision tree induction [41]
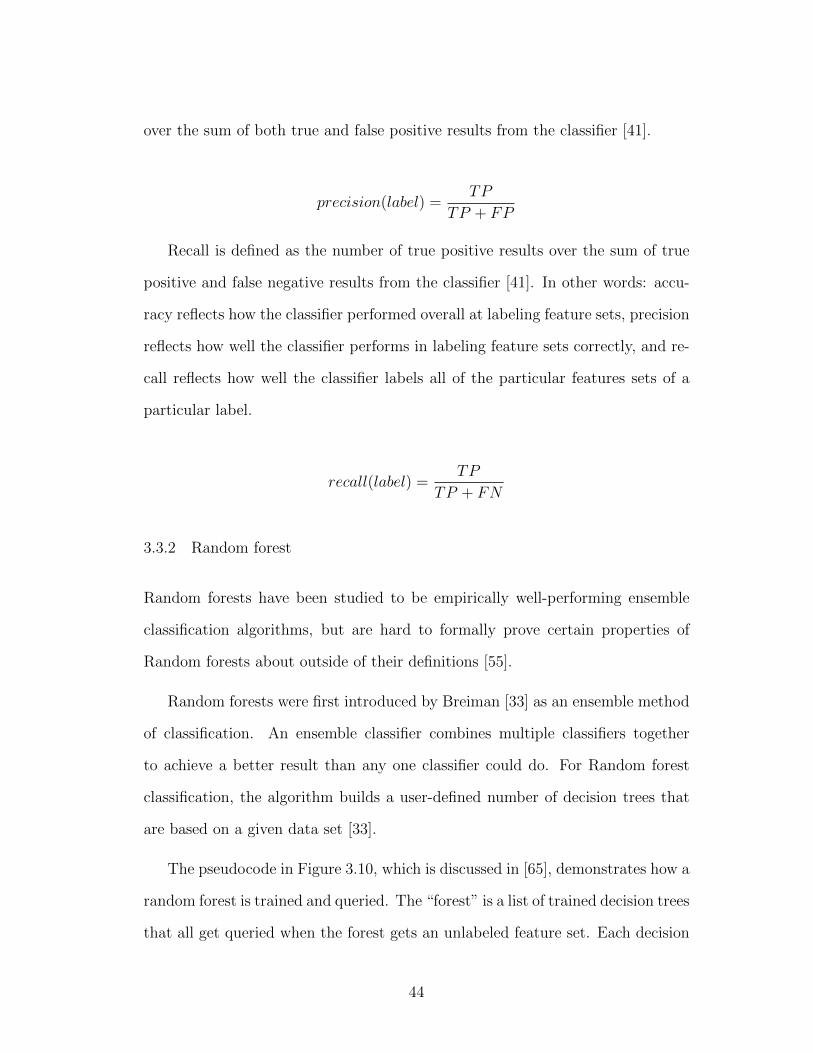
The C4.5 algorithm as described in Figure 3.7 is a method to help recursively
build decision trees based on their features and how much information is gained at
each leaf node. The core action at the heart of this algorithm is called “splitting”
as seen in Figure 3.8. A splitting node creates two paths in the tree structure to
further categorize a given unlabeled feature set. An example of these splitting
nodes is seen in Figure 3.9.
41

Figure 3.8: selectSplittingAttribute() functions using information gain and infor-
mation gain ratio measures. [41]
These nodes are created for the highest information gain features in a feature
set [41]. Each feature can only be split on once in a given path [41]. This rule
ensures that the algorithm will eventually reach the termination conditions and
not produce an incredibly large tree that is “overfitted”, or created to be too
specific for future feature sets. The algorithm’s stopping conditions are when
the data set contains only instances with the same label or when there are no
more attributes to split upon. The current splitting attribute is determined by
calculating the potential “information gain” for each feature in the current feature
set [41]. The algorithm then uses the feature with the most gain as the splitting
feature. The value of the feature to be split upon is determined by the feature
values within the domain subset that are currently used in the recursive function.
42
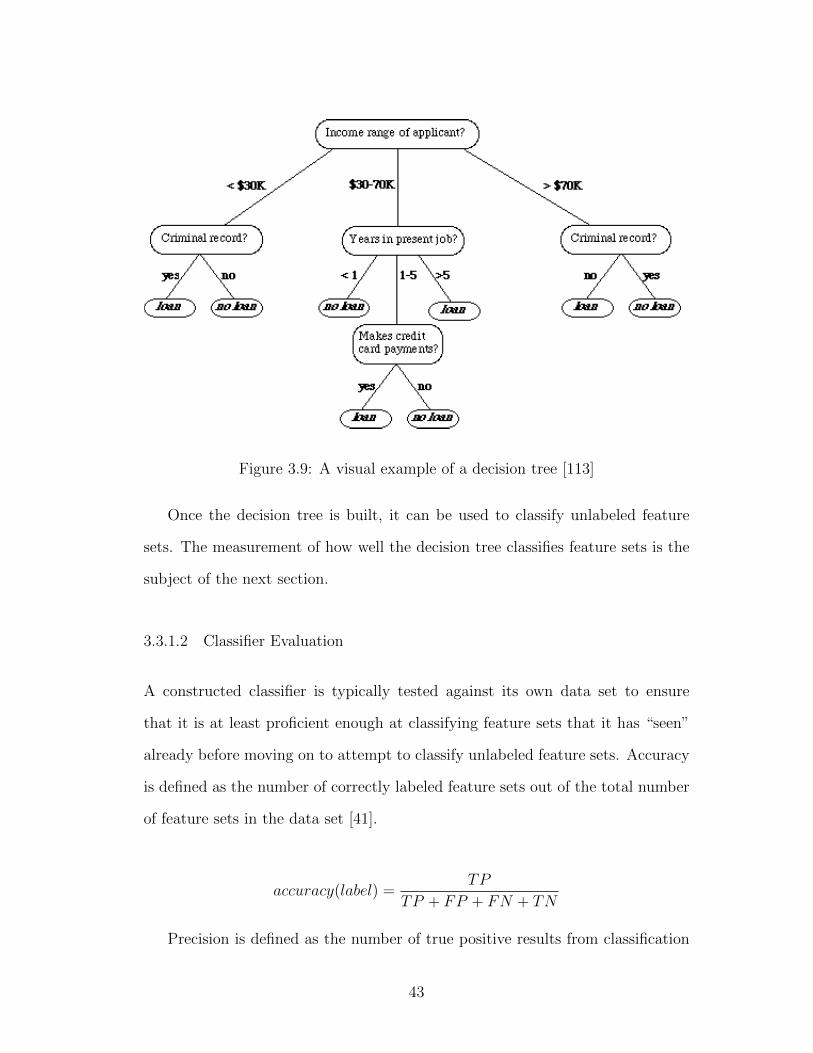
Figure 3.9: A visual example of a decision tree [113]
Once the decision tree is built, it can be used to classify unlabeled feature
sets. The measurement of how well the decision tree classifies feature sets is the
subject of the next section.
3.3.1.2 Classifier Evaluation
A constructed classifier is typically tested against its own data set to ensure
that it is at least proficient enough at classifying feature sets that it has “seen”
already before moving on to attempt to classify unlabeled feature sets. Accuracy
is defined as the number of correctly labeled feature sets out of the total number
of feature sets in the data set [41].
accuracy(label) =TP
TP + FP + FN + TN
Precision is defined as the number of true positive results from classification
43
over the sum of both true and false positive results from the classifier [41].
precision(label) =TP
TP + FP
Recall is defined as the number of true positive results over the sum of true
positive and false negative results from the classifier [41]. In other words: accu-
racy reflects how the classifier performed overall at labeling feature sets, precision
reflects how well the classifier performs in labeling feature sets correctly, and re-
call reflects how well the classifier labels all of the particular features sets of a
particular label.
recall(label) =TP
TP + FN
3.3.2 Random forest
Random forests have been studied to be empirically well-performing ensemble
classification algorithms, but are hard to formally prove certain properties of
Random forests about outside of their definitions [55].
Random forests were first introduced by Breiman [33] as an ensemble method
of classification. An ensemble classifier combines multiple classifiers together
to achieve a better result than any one classifier could do. For Random forest
classification, the algorithm builds a user-defined number of decision trees that
are based on a given data set [33].
The pseudocode in Figure 3.10, which is discussed in [65], demonstrates how a
random forest is trained and queried. The “forest” is a list of trained decision trees
that all get queried when the forest gets an unlabeled feature set. Each decision
44

Figure 3.10: Random Forest Pseudocode [65]
tree is trained by selecting random features from a subset of the data set that is
uniformly chosen with replacement (called “bagging” or “bootstrapping”) [23]. A
simple method for evaluating the label of an unknown feature set is to have each
decision tree simply vote for the label it thinks the feature set represents [23].
When considering individual decision trees, their evaluation of what the label
should be is highly varied, but since it is a forest that is built by uniformly
selecting sample feature sets from the data set, there should be a label that is
closely correlated to the underlying function or model, if it exists [23].
3.3.3 Extra-tress
The Extra-trees splitting algorithm was proposed by Geurts et al. in a 2006 paper
[47]. The algorithm was designed to potentially “... build totally randomized trees
whose structures are independent of the output values of the learning sample”
45

[47]. The algorithm also breaks from the pack by learning from the entire data
set, instead of a uniform sample like the Random forest algorithm [47] Geurts et
al. described the algorithm as the following:
Figure 3.11: Extra-Trees splitting algorithm [47]
The pseudocode in 3.11 enables “randomizing both attribute and cut-point
choice while splitting the tree node” [47]. This randomization allows the tree
to be built independently of the labels for the classes, which can lead to higher
performance in some applications [47]. Geurts et al. found the Extra-trees al-
gorithmic complexity to be O(nlog(n)), which is on par with other tree-based
classification algorithms, but he claims to have a significant speedup due to the
”simplicity of the node-splitting procedure” [47].
Geurts et al. reported the results of an empirical study comparing classifica-
46

tion algorithms’ performance and accuracy to each other [47]. The Extra-trees
algorithm was not only validated to be as accurate as other state-of-the-art classi-
fication algorithms, but its performance was competitive as well as long as there
is enough memory [47]. The increased randomness comes at a cost: the algo-
rithm produces 1.5-3x more leaves than the random forest algorithm [47]. This
should not be an issue as long as the amount of memory dedicated to running
Extra-trees scales with the size of the data set.
47

CHAPTER 4
Related Work
There is a large and ever-growing body of research that investigates the use of
sensor and video motion capturing systems to quantify the movement of the
human body in order to augment some aspect of it.
4.1 General motion tracking systems
Researchers have pushed the envelope of joint configuration and body segment
movement tracking by improving upon the sensor filtering methods available,
specifically with different types of Kalman filters [64,111]. These Kalman filters
often take in multiple IMU inputs, and research has been done about how to
most effectively synchronize the data from their readings [36]. LIFT makes use
of an Kalman filter that is applied by the IMU device.
There have been many lines of research dedicated to advancing the goals
related to achieving practical levels of sensor network contexual awareness and
event classification [29,52,59]. Some fairly general methods for how body sensor
networks operate for the purpose of human movement analysis have been patented
[32, 43]. There are also patents for hand motion tracking with video motion
capturing systems [100,103]. The ramifications of potential enforcement of these
patents in the future for academic and commercial development of generalized
body motion tracking remains to be seen.
48

4.2 Systems used to augment healthcare
One of the more obvious uses of motion detecting sensors is for detecting deficien-
cies in a person’s primary means of movement: walking and using their hands.
There has been research done with movement detecting sensors in long term gait
tracking, neurological tremors, and other movement disorders [51, 62, 98] Just
like in section 4.1, there are many patents in this area of study [48,70]. Multiple
patents in this field indicate how valuable this technology is in the eyes of the
inventors and other stakeholders in the project.
Researchers can also monitor trunk and posture with motion tracking devices
to give feedback to the wearer when they have put themselves in less-than-ideal
positions for their health [74,82].
The trunk sensors for posture detection are a mild form of ambulatory mon-
itoring. More serious ambulatory monitoring systems involve detecting senior
citizen falls and other emergencies [53, 66, 101]. It is evident that these sys-
tems are built with widespread adoption in mind because they integrate into
smartphones, which are common devices that has movement sensors. LIFT fol-
lows these researchers’ lead by designing the system with widespread adoption
in mind by using a minimally invasive amount of extra equipment to be able to
give feedback to weight lifting technique.
In the rehabilitation domain, Moeller et al. created an Android app that
aided in quantifying how well a trainee performed various exercises on a balance
board and provide visual feedback on how well they did [76]. Researchers have
also used motion tracking sensors in upper limb neurorehabilitation [88].
49
4.3 Systems used to augment general exercise performance
Running is one of the most basic forms of exercise, but few people, save for
possibly very experienced or competitive runners ever consider their running
technique because it develops naturally as a person gains experience running
[77]. Researchers have built feedback systems with sensors to help with improv-
ing running technique [69, 104, 115]. Bicycling is another fairly basic form of
exercise once a person learns how to ride one. Training and getting better at
competitive bicycling is a more difficult task and is why researchers have devel-
oped many different sensors for bicycling, such as heart rate monitors [28,58,84]
and power meters [31, 34,67]. The heart rate monitor enables the cyclist to help
determine how hard their cardiovascular system is working and the power cycle
gives feedback about how much power the cyclist is generating with each pedal
stroke. These pieces of feedback help the cyclist determine what their next rac-
ing move should be when competing, or how they can optimize their training.
More recent bicycling research includes the use of a Google Glass bicycle coach
application [105]. The bicycle coach application gives feedback about how fast
the user is going among other performance metrics [105]. Swimming is another
aerobic sport like running and bicycling, but has a much higher learning curve
when it comes to sport-specific technique. Naturally, researchers have created
sensor-based feedback systems to improve a swimmer’s performance [30,81].
One of the more novel sport feedback technologies has come in the form of
sensors embedded in baseballs to evaluate the performance of pitches that are
thrown [69]. The force applied on a baseball during a pitch as well as direction
and magnitude of the rotation of a baseball in flight are very important factors
in the overall quality of an intended pitch, so an embedded IMU is well-suited to
50
collect this type of data.
An application of the general activity recognition technology discussed in
section 4.1 is exercise recognition [29, 99]. The LIFT system and other qualita-
tive exercise feedback systems like it, could be integrated with general activity
recognition systems to automatically give exercise feedback once the exercise in
question has been identified by the activity recognition system.
Another interest in the body area sensor network field is estimating energy
expenditure during exercise [109]. How much a person gains and loses body
weight is determined by the number of calories they eat minus the amount they
expend by normal activity and exercise. The number of calories a person eats
can be tracked in a fairly straightforward way, so this type of research is working
on the other term of the “caloric equation” by exploring ways to obtain a more
accurate count of energy expenditure.
The end goal of all these types of sport and exercise-specific of research is the
same as the LIFT system: to provide feedback to users in order to increase their
domain-specific performance.
4.4 Systems used to augment weight lifting performance
One of the oldest methods for evaluating a person’s maximal strength has always
been performing a one-repetition maximum lift. When lifting maximal weights,
a person is pushing their muscular and supporting structures’ limits, so injuries
are more likely to occur [68]. A safer, more efficient method for many in the
future that is being researched is to estimate a person’s one-repetition maximum
with a sensor attached to the particular exercise in question [91].
Pernek et al. used the sensors built into smartphones to automatically count
51
repetitions performed in a set of exercises [87]. A similar line of research is trying
to determine the best axis for repetition detection, which minimizes the amount
of features and computations that need to occur to provide accurate repetition
counts [78].
Nejadiana et al. describes a video-based motion capture system that uses
a dynamic programming method to evaluate the mechanical cost of various bar
path trajectories for the snatch lift [83].
Sato et al. measured the acceleration felt by a barbell through various
Olympic lifts and was able to compare barbell accelerations on Olympic lifts
between different workout parameters such as intensity [94, 95]. Sato et al. in
doing this also validated that data collected by an accelerometer on a barbell can
be just as accurate as data obtained from high speed video analysis [96,97]. An-
other similar line of research validated that accelerometers record reproducible
front squat data [37]. Yet another similar line of research placed an IMU on
a barbell and weight lifting belt, with force plates and camera to validate the
accuracy of the values recorded by the IMUs [49]
Velloso et al. developed an on-body weight lifting tracking system that
recorded data from four sensors strategically placed on the body, and obtained
feature sets based on the mean, variance, standard deviation, max, min, kurtosis,
and skew functions [110]. Those feature sets fed into a Random Forest classifier
system [110]. The classifier system that was able to detect specific weight lifting
technique deficiencies in a bicep curl with a 78% success rate with leave-one-out
subject validation [110]. Velloso et al. doubts that it is feasible to scale this
weight lifting classifier system to detect all mistakes for each exercise one wishes
to train on [110].
52

The LIFT analysis system will attempt to ease Velloso et al.’s qualms about
scalability by restricting the domain of exercises to train classifiers on to barbell
movements that most athletes perform in strength and conditioning programs.
53
CHAPTER 5
Methodology
The LIFT analysis system will apply Velloso et al.’s methodology of running
classification algorithms over derived features of collected sensor data [110]. The
main difference is that the LIFT analysis system will attempt to only use one
sensor that is strategically and unobtrusively placed on the weight collar secured
on a barbell for specific lifts: back squat, bench press, and strict overhead shoulder
press.
5.1 Barbell Lifts
These barbell lifts were chosen because they are fundamental movements for any
athletic strength training program. Athletes do not always have the luxury of
having a qualified coach observing them to correct their technique at a moments
notice, so the LIFT analysis system may help provide some basic amount of
weight lifting coaching to a wider audience in the future.
These particular movements were also chosen because the bar is secure in the
hands of the athlete and the athlete’s body is between the bar and the ground
during most portions of these lifts. The danger for the bar to be dropped and the
sensor potentially damaged by the shock of the loaded bar hitting the ground is
much higher with other lifts [96].
54
5.2 Subject testing
Another key differentiator in this study of weight lifting technique deficiencies is
that the study uses many more subjects of varying strength levels. This gives a
more diverse data set in an attempt to improve and validate the broader efficacy
of the LIFT system.
5.2.1 Profile of subjects
The subjects were limited to trainees that train in either Cal Poly’s athletic
weight room or recreation center. The gender was controlled for males because
while there were many potential female athlete participants in the athletic weight
room, there were not many corresponding untrained females who lifted weights
in the recreation center, which would result in a lack of variety of technique
deficiencies to truly validate the LIFT system.
Although the correct bar path for males and females does not change for any
given technique, the fact that males on average have bigger bones, and larger
yet less flexible musculature than females can possibly affect the results of clas-
sifying technique deficiencies in unforeseen ways. These physiological factors can
vary greatly between individuals of the same gender, of course, so there is still
room for those factors to have an effect on the end result of classifying technique
deficiencies. The researchers are attempting to control significant physiological
confounding variables in this study by controlling for the participant’s gender.
The use of this system on female trainees can possibly be the subject of future
research and can be compared to the results of this male study.
There is an inherent bias with the given college-aged population of males,
55
so future potential research can study the efficacy of the LIFT system on the
teenage and older adult populations.
5.2.2 Realistic technique deficiencies
Every set recorded and analyzed by the LIFT system will be with non-trivial
weight. Velloso et al. in the name of safety, had their subjects intentionally
perform technique deficiencies with a 1.25 kg, or almost a 3 lb dumbbell [110].
This is an admirably safe methodology, and validated that it is possible to have an
algorithm differentiate between different simulated technique deficiencies, but it is
not a particularly useful result for its intended application. A subject performing
technique deficiencies with a weight comparable to a pair of shoes while under
very little stress will create very different looking data than a subject performing
the same exercise with a challenging, yet safe weight. A primary motivation
behind this study is to gather “real world” training data, not just data recorded
in experiments performed in a laboratory setting.
56
CHAPTER 6
Implementation
The sensor that was used in testing the LIFT analysis system is the YEI 3-Space
Bluetooth sensor [21]. This sensor is a 9-degrees-of-freedom inertial measurement
unit (IMU) and is described in further detail in Figure 6.1. The sensor commu-
nicates with an Android Nexus 7 tablet via Bluetooth. The Android tablet has
the LIFT data collection app installed on it. LIFT collects the data recorded by
the YEI IMU, stores it locally in a SQLite database for backup purposes and also
sends the data to a server that can perform technique classification. In the future,
the LIFT automated weight lifting coach system could leverage many users using
different sensors to contribute exercise data to help improve LIFT’s classification
algorithms.
6.1 Data collection
The YEI IMU is capable of collecting many different combinations of normal-
ized, corrected, and filtered orientation and movement data. For v1 (version 1)
of LIFT, the YEI IMU was configured to collect Euler angle and linear acceler-
ation data processed by an on-chip Kalman filter at 20 Hz. This combination
of sensor data yielded what was thought to be the most relevant motion data
for this application as explained in Chapter 3 [93]. In v2 of LIFT, the YEI IMU
was configured to collect quaternion orientation, linear acceleration, corrected ac-
57

Figure 6.1: A system diagram of the YEI IMU [21]
celeration, corrected gyroscope, corrected magnetometer, raw acceleration, raw
gyroscope, and raw magnetometer at roughly 70 Hz. Many things were found to
be broken after closely examining v1 of the LIFT automated weight lifting coach
system.
58
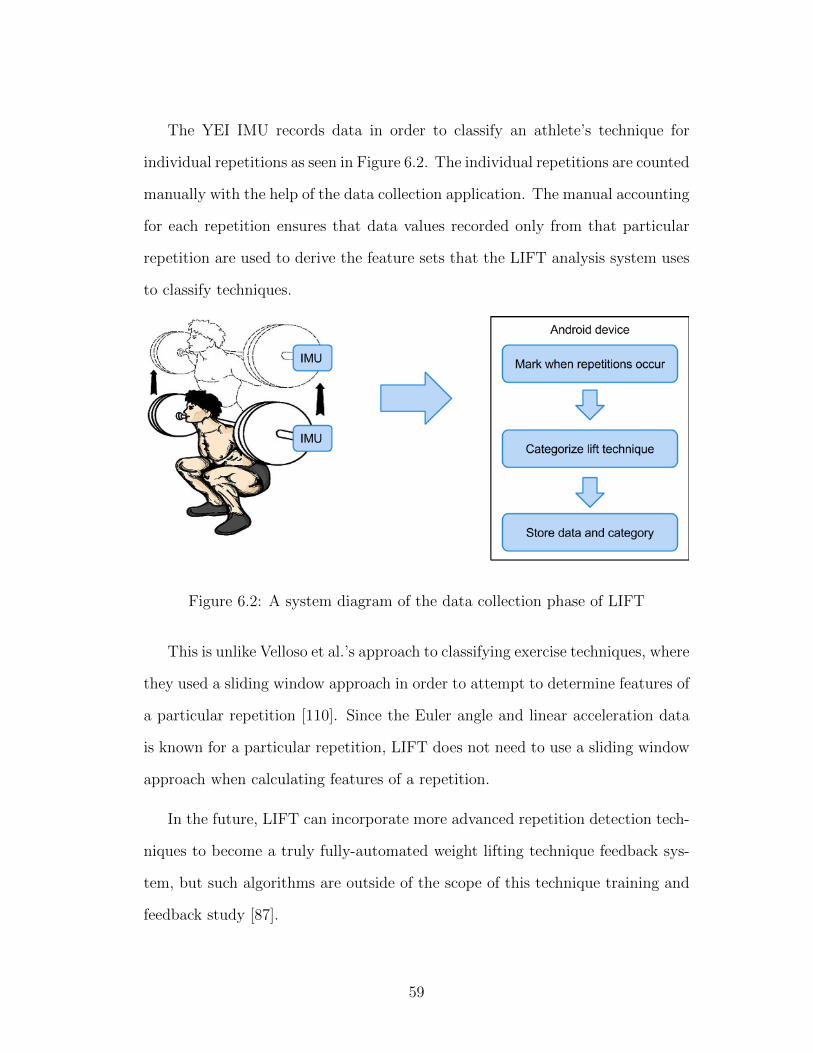
The YEI IMU records data in order to classify an athlete’s technique for
individual repetitions as seen in Figure 6.2. The individual repetitions are counted
manually with the help of the data collection application. The manual accounting
for each repetition ensures that data values recorded only from that particular
repetition are used to derive the feature sets that the LIFT analysis system uses
to classify techniques.
Figure 6.2: A system diagram of the data collection phase of LIFT
This is unlike Velloso et al.’s approach to classifying exercise techniques, where
they used a sliding window approach in order to attempt to determine features of
a particular repetition [110]. Since the Euler angle and linear acceleration data
is known for a particular repetition, LIFT does not need to use a sliding window
approach when calculating features of a repetition.
In the future, LIFT can incorporate more advanced repetition detection tech-
niques to become a truly fully-automated weight lifting technique feedback sys-
tem, but such algorithms are outside of the scope of this technique training and
feedback study [87].
59

6.2 Technique classification
The LIFT analysis system uses Scikit-learn [86] classification algorithms to iden-
tify good and bad bar movement patterns, which are indicative of technique in
the context of a particular exercise.
Each repetition was categorized in v1 by the quality of the bar’s orientation
by the recorded Euler angles and as well as the bar’s path indirectly by linear
acceleration. The quality of the bar’s orientation is determined by the bar’s roll,
pitch, and yaw during a lift. There should not be any change in orientation of the
bar in the lifts that LIFT is focusing on for this study: back squat, bench press,
and overhead press. Therefore, any noticeable change in the bar orientation will
be classified as a technique deficiency. The quality of the bar path is determined
by linear acceleration felt by the sensor in the X-, Y-, and Z- axes as seen in Figure
6.3. The barbell should be moving in the X-Z plane in a controlled fashion for
the back squat and bench press for particular reasons associated with each lift
as discussed in Section 2.4. If a particular acceleration pattern is not seen, then
the repetition should be classified as a technique deficiency. Whereas, for the
overhead press, any significant acceleration in that plane should be classified as
a technique deficiency.
After the repetitions were recorded, they were ran through the LIFT classifi-
cation system, as seen in Figure 6.4. The system calculates features that describe
what happens in each dimension in the orientation and linear acceleration vec-
tors over the course of a repetition in v1, and additionally the corrected and raw
accelerometer, gyroscope, and compass sensors in v2. The calculated features
include: mean, variance, standard deviation, max, min, root mean square (rms),
kurtosis, and skew.
60
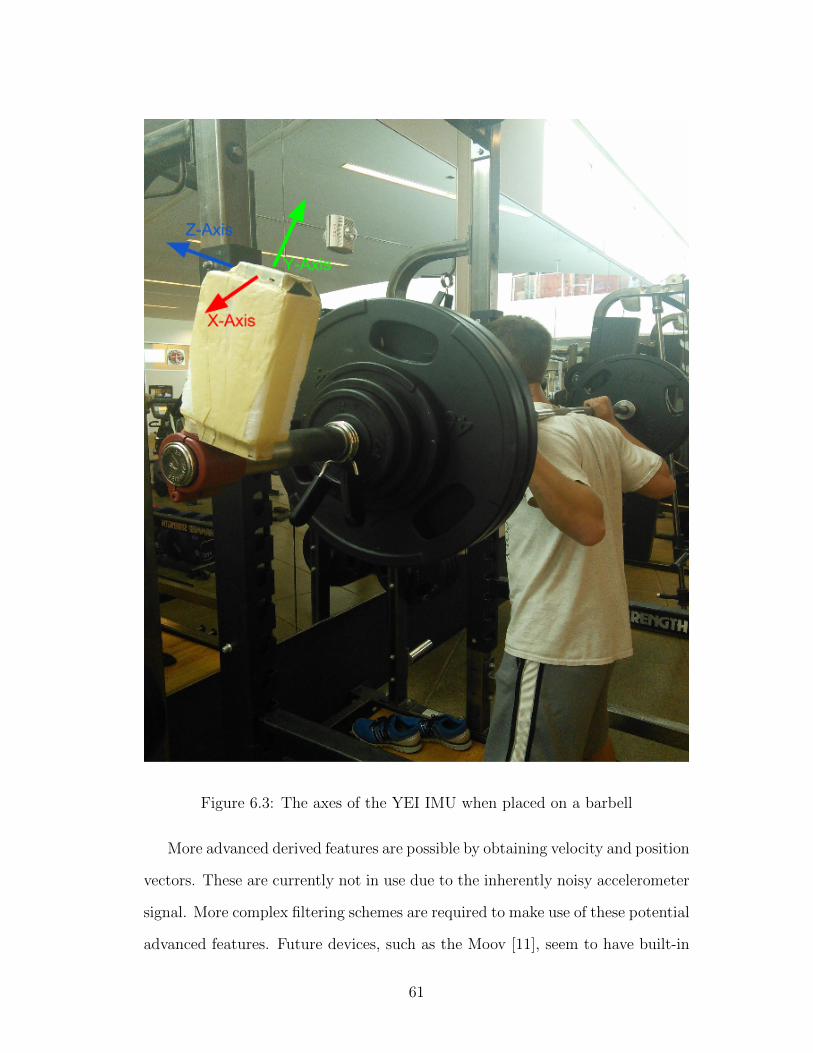
Figure 6.3: The axes of the YEI IMU when placed on a barbell
More advanced derived features are possible by obtaining velocity and position
vectors. These are currently not in use due to the inherently noisy accelerometer
signal. More complex filtering schemes are required to make use of these potential
advanced features. Future devices, such as the Moov [11], seem to have built-in
61
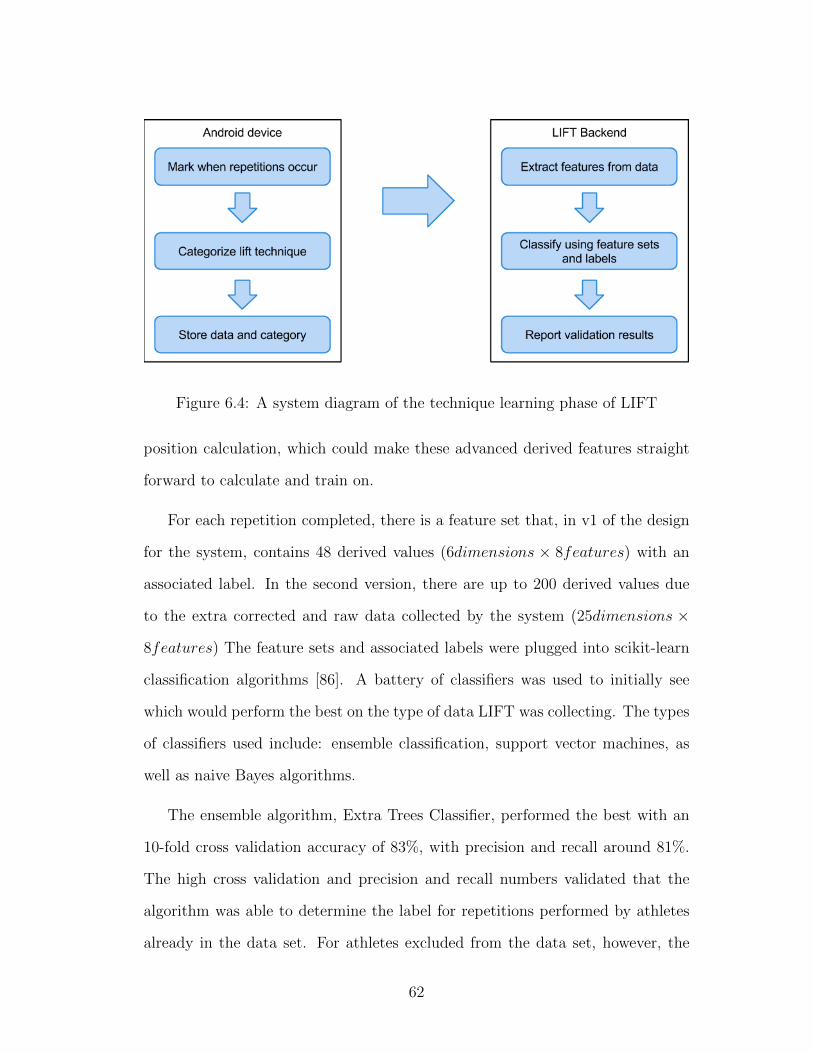
Figure 6.4: A system diagram of the technique learning phase of LIFT
position calculation, which could make these advanced derived features straight
forward to calculate and train on.
For each repetition completed, there is a feature set that, in v1 of the design
for the system, contains 48 derived values (6dimensions × 8features) with an
associated label. In the second version, there are up to 200 derived values due
to the extra corrected and raw data collected by the system (25dimensions ×
8features) The feature sets and associated labels were plugged into scikit-learn
classification algorithms [86]. A battery of classifiers was used to initially see
which would perform the best on the type of data LIFT was collecting. The types
of classifiers used include: ensemble classification, support vector machines, as
well as naive Bayes algorithms.
The ensemble algorithm, Extra Trees Classifier, performed the best with an
10-fold cross validation accuracy of 83%, with precision and recall around 81%.
The high cross validation and precision and recall numbers validated that the
algorithm was able to determine the label for repetitions performed by athletes
already in the data set. For athletes excluded from the data set, however, the
62

algorithm only performed on average of 45% accuracy with leave-one-subject
out validation for v1 of LIFT, but this was possibly due to a number of inherent
faults in the data collection step. The leave-one-subject-out validation performed
with an average of 41% accuracy with v2 of LIFT. This lower overall accuracy
is possibly due to not enough trained athlete participants in the second study.
These accuracies are further analyzed in Section 8
The Extra Trees classifier performed the best because it was able to form
randomized decision trees that were not biased towards any one data label. As
discussed in Section 3.3.3, the Extra Trees algorithm is able to build in more
randomness in the decision tree formation process on top of the Random Forest
approach. It not only randomizes the splitting mechanism, but it draws features
from the entire feature set, unlike the Random Forest algorithm, which only
draws a uniformly random features from the data set. This trade off decreases the
variability of the resultant Extra Trees algorithm, but can increase the bias [47].
6.3 Automated weight lifting coach
The architecture of the LIFT coach can be seen in Figure 6.5. This automated
method of providing feedback based on an existing data set of correct and incor-
rect lifts would be invaluable to helping a trainee perform proper technique on
each repetition of their workout and promote long-term health by reducing the
risk of injury during training. This architecture will be elaborated on further in
Section 11
63
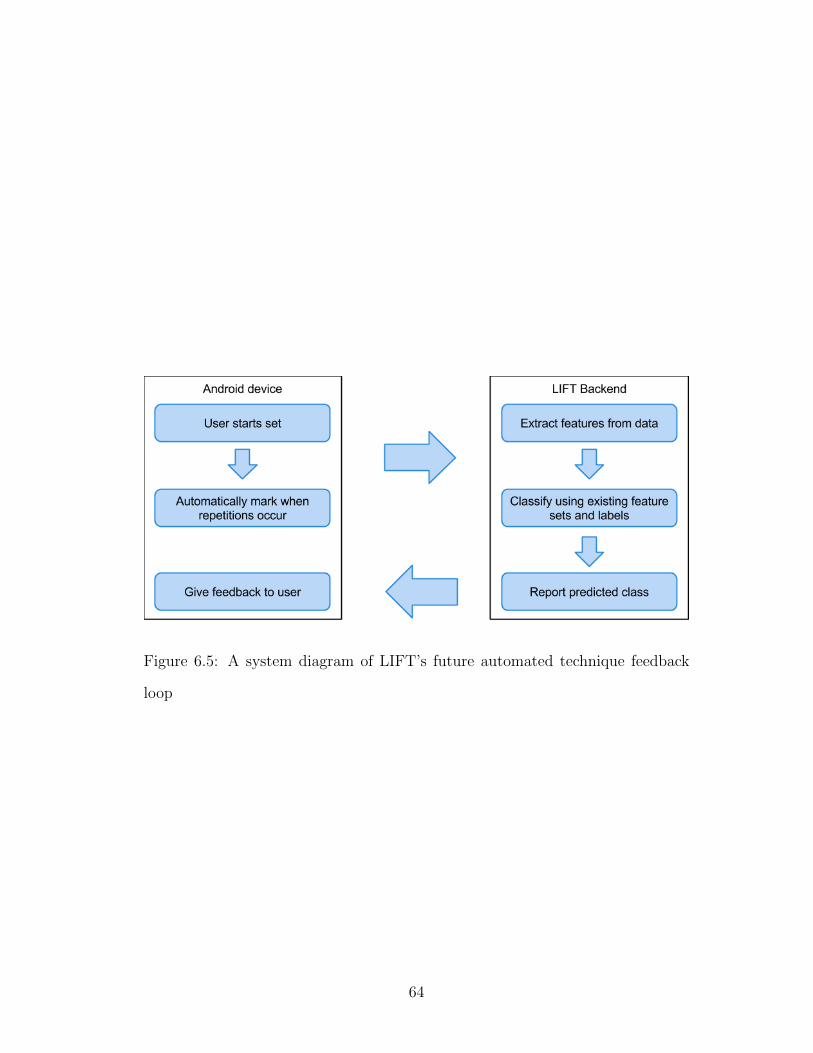
Figure 6.5: A system diagram of LIFT’s future automated technique feedback
loop
64

CHAPTER 7
Experimental Framework
LIFT’s Android mobile app was tested in Cal Poly San Luis Obispo’s Athletic
Weight Room and Recreation Center facilities. Cameron Van Wye, an athletic
weight room strength and conditioning coach, supervised the athletes’ technique
as they performed strict overhead presses, back squat, and bench press with the
Bluetooth-enabled IMU sensor attached to the left-side weight collar from the
researcher’s perspective as seen in Figure 6.3.
7.1 Research protocol
70 Cal Poly students participated in the study with LIFT v1, and 50 Cal Poly
students participated in the study with LIFT v2. The athletes were tasked to
perform 4 sets of 5 repetitions, working up to 75% of their 5 repetition maximum.
This workload fatigued the athletes adequately enough to commit technique de-
ficiencies, but not overly fatigue them. Van Wye discussed with the athletes
what weight they felt comfortable with for 4 sets of 5 repetitions and chose the
appropriate weight for them based on their comfort and strength levels.
Correct technique and technique deficiencies were observed by Van Wye while
Lady operated the LIFT data collection app. LIFT’s data collection functional-
ity allowed Lady to record the start and end times of repetitions and label the
repetitions as observed by Van Wye.
65

Individual repetitions were counted by the researchers at the bottom (after
the eccentric) portion of the overhead press, and at the top (after the concentric)
portion of the squat and bench press. This definition of a repetition enabled the
researchers to clearly communicate when technique deficiencies started to occur
and record a consistent window of data values (orientation and linear acceleration
vectors). The LIFT analysis system then derives aggregate features from these
data values.
7.2 Validation
Leave-one-subject-out validation was used as the primary means for determin-
ing LIFT’s performance. Leave-one-subject-out emulates the performance of the
LIFT system in a live technique feedback situation for each recorded athlete’s
completed repetitions.
This form of validation goes through each athlete contained in the data set and
excludes or “holds out” their exercise repetition data from being used to train the
technique classifier. Once the technique classifier has been trained, the excluded
or “held out” data is then run on the technique classifier. The performance of
the classifier is based on how many repetitions it is able to label correctly out of
the total amount of repetitions for the athlete. The performance of the system
as a whole is judged by aggregating all of the results for each athlete excluded
from the data set.
This type of validation ensures that the information gained by the classifica-
tion algorithm is applicable and valid for classifying an athlete’s weight lifting
technique who is not in the current data set. A 70 - 80% leave-one-subject-out
accuracy would be comparable to Velloso’s leave-one-subject-out accuracy [110].
66

CHAPTER 8
Results
Overall, the LIFT coach was not able to accurately distinguish individual tech-
nique deficiencies at a commercial production-quality level where a trainee could
rely on LIFT to recognize and help correct potentially dangerous technique de-
ficiencies. In v1, a number of researcher errors were the main cause behind the
low leave-one-subject-out accuracies. These adjustments between v1 and v2 are
discussed in Analysis in Section 9. Low leave-one-subject-out scores are still
prevalent in v2 and seem to primarily be caused by a lack of a “balance” of data,
where the training data set would contain a roughly equal distribution of highly
trained athletes and novice weight lifters. “Simple” confusion matrices have been
calculated to show that in the simple case, LIFT could indicate to the trainee that
something is likely wrong with their technique and can walk the trainee through
a standard procedure to remind the user of the correct technique. Although this
“simple” methodology was not in the intended goal, this is a good first step to-
wards validating that this type of technique evaluation system is feasible and
possibly useful.
In an attempt to gain a better general understanding of how v2 has improved
over v1, “simple” confusion matrices have also been included in the tabular and
graphical results. These simple matrices condense all of the technique deficiency
labels of a given exercise to just “Incorrect” to be compared to when the technique
is “Correct”.
67
The following results of the LIFT coach are normalized with respect to the
“truth label” rows, so they are able to be easily compared to Velloso et al.’s
results [110]. Confusion matrix magnitude data is displayed in non-zero cells to
compare the number of times a given label was recorded to other labels. “Golden”
repetitions were very close to ideal demonstrations of weight lifting technique.
They would be suitable to use as a base for a “golden standard” method of
technique deficiency detection, as discussed in Section 11.6, but is not relevant for
classification purposes, so its “deficiency priority” weight is low. The higher the
priority label, the more central to the movement it is. For example “Lower back
round” has a very high priority for squatting because it is a technique deficiency
that can have a high risk of injury at heavy loads and should be corrected above
all other deficiencies in the squat.
One of the issues that has affected this study is the researchers not collecting
data evenly across all labels so they can be compared fairly against each other
for classification. A label with more examples than other labels is more likely to
bias a classifier and cause the classifier to “overfit” its decision-making structure
for that overrepresented label.
8.1 Squat results
The squat is a fundamental weight lifting movement that is straight forward to
learn, but difficult to master. Due to the nature of the lift, there are many possible
technique deficiencies that a trainee can commit. Many individual technique
deficiency repetitions were recorded during v1 and v2 testing, but only a few
different types of technique deficiencies were recorded a significant number of
times to be recognized adequately by the classifier. This fact can be seen in
68
Figure 8.1 where there are only two labels along the diagonal that have an above
50% recognition rate, in this case “Correct” and “Did not reach parallel”. It
is interesting to note on this figure as well that “Upper back round”, “Knees
not spread out”, ”Wrists rolled back”, “Chin not tucked”, “Heels coming up
off of ground”, “Lower back round”, and “Hips roll under spine” get confused
with “Correct” technique very often in this data set. This may be due to the
combination that these technique deficiencies do not cause out of the ordinary
bar path features, and that they had much fewer recorded repetitions than the
“Correct” label. This trend translates into the v1 simple confusion matrix in
Figure 8.2, where the “Correct” label dominates and causes “Incorrect” feature
sets to be classified as “Correct”.
The second iteration of LIFT was able to capture a wider variety of technique
labels due to primarily testing LIFT in the Cal Poly Recreation center, but at
the cost of not capturing as many “Correct” labels. This is opposed to the first
iteration where testing took place primarily in the Cal Poly Athletic weight room
and because the student-athletes are much more well-trained, they committed
fewer technique deficiencies, resulting in more “Correct” labels.
In v2 squat testing, as seen in Figure 8.3, “Did not reach parallel”, and “Cor-
rect” were the most successful predicted labels for squatting. “Did not reach
parallel” often got confused as “Correct” and vice versa, which is not unexpected
because a trainee could have leg and torso lengths than another trainee. These
different limb proportions will define different distances the that the bar must
travel to reach the parallel mark. LIFT does not use estimated displacement as
a feature, but the researchers hypothesize that coming up out of a half squat will
look different than coming up out of a full squat with respect to Linear Acceler-
ation on the Y-axis, which is possibly why there was some moderate success in
69
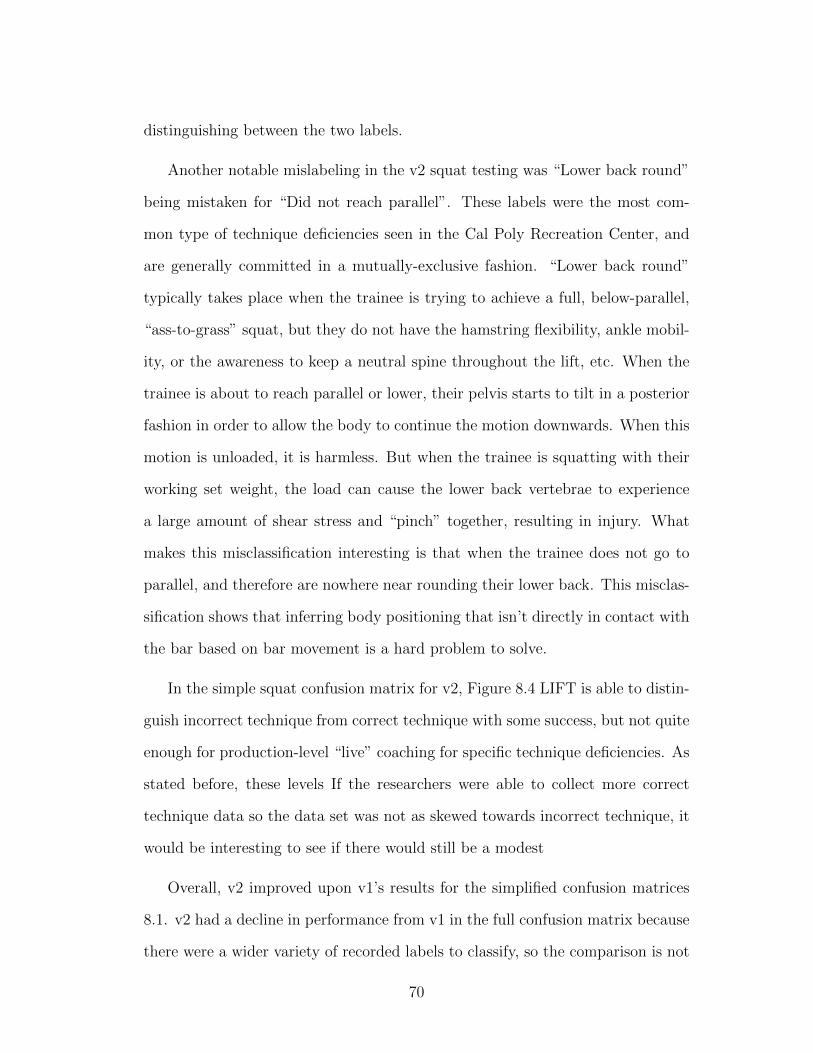
distinguishing between the two labels.
Another notable mislabeling in the v2 squat testing was “Lower back round”
being mistaken for “Did not reach parallel”. These labels were the most com-
mon type of technique deficiencies seen in the Cal Poly Recreation Center, and
are generally committed in a mutually-exclusive fashion. “Lower back round”
typically takes place when the trainee is trying to achieve a full, below-parallel,
“ass-to-grass” squat, but they do not have the hamstring flexibility, ankle mobil-
ity, or the awareness to keep a neutral spine throughout the lift, etc. When the
trainee is about to reach parallel or lower, their pelvis starts to tilt in a posterior
fashion in order to allow the body to continue the motion downwards. When this
motion is unloaded, it is harmless. But when the trainee is squatting with their
working set weight, the load can cause the lower back vertebrae to experience
a large amount of shear stress and “pinch” together, resulting in injury. What
makes this misclassification interesting is that when the trainee does not go to
parallel, and therefore are nowhere near rounding their lower back. This misclas-
sification shows that inferring body positioning that isn’t directly in contact with
the bar based on bar movement is a hard problem to solve.
In the simple squat confusion matrix for v2, Figure 8.4 LIFT is able to distin-
guish incorrect technique from correct technique with some success, but not quite
enough for production-level “live” coaching for specific technique deficiencies. As
stated before, these levels If the researchers were able to collect more correct
technique data so the data set was not as skewed towards incorrect technique, it
would be interesting to see if there would still be a modest
Overall, v2 improved upon v1’s results for the simplified confusion matrices
8.1. v2 had a decline in performance from v1 in the full confusion matrix because
there were a wider variety of recorded labels to classify, so the comparison is not
70
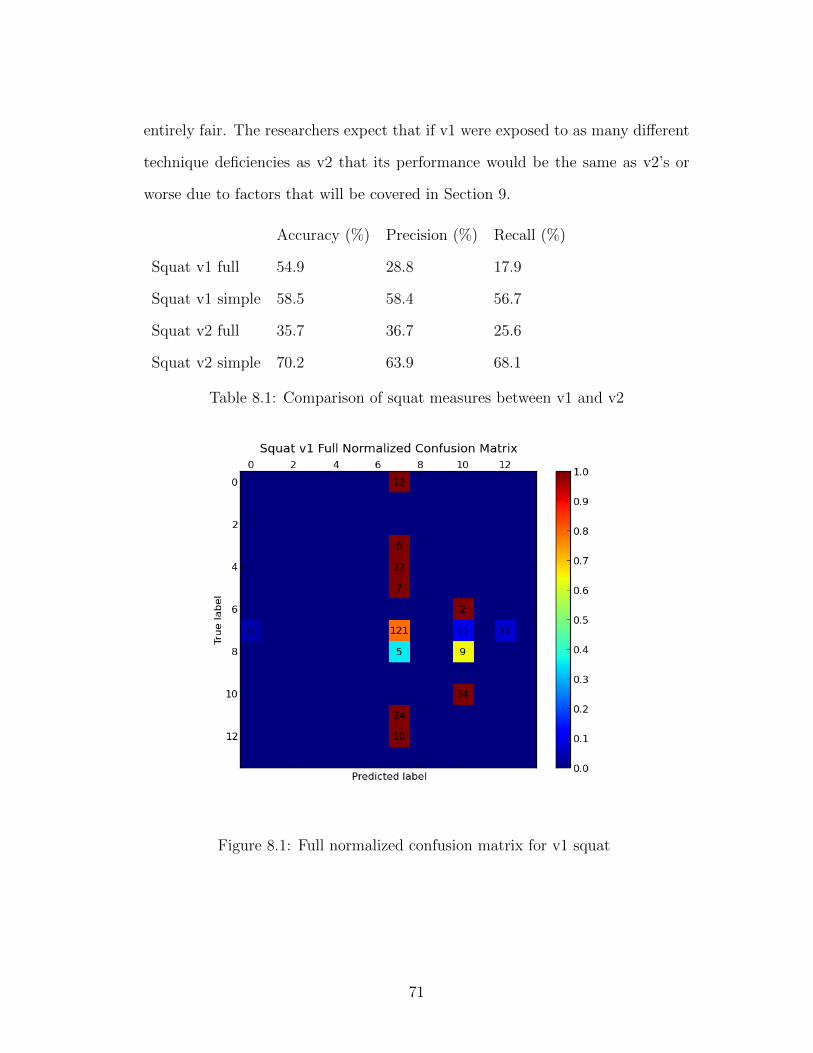
entirely fair. The researchers expect that if v1 were exposed to as many different
technique deficiencies as v2 that its performance would be the same as v2’s or
worse due to factors that will be covered in Section 9.
Accuracy (%) Precision (%) Recall (%)
Squat v1 full 54.9 28.8 17.9
Squat v1 simple 58.5 58.4 56.7
Squat v2 full 35.7 36.7 25.6
Squat v2 simple 70.2 63.9 68.1
Table 8.1: Comparison of squat measures between v1 and v2
Figure 8.1: Full normalized confusion matrix for v1 squat
71

Label number Squat Labels v1 Squat Labels v2
0 Upper back round Did not stand all the way up
1 Over extension / too vertical Upper back round
2 Jerky rep Over extension / too vertical
3 Knees not spread out Hips out / chasing with back
4 Wrists rolled back Knees not spread out
5 Chin not tucked Wrists rolled back
6 Chasing with back Chin not tucked
7 Correct Jerky rep
8 Heels coming up off of ground Correct
9 Golden Heels coming up off of ground
10 Did not reach parallel Golden
11 Lower back round Did not reach parallel
12 Hips roll under spine Lower back round
13 Did not complete repetition Hips roll under spine
14 N/A Did not complete repetition
Table 8.2: Squat label number table
8.2 Bench press results
The bench press is by and large the most recognizable and popular barbell exer-
cise. Because of its widespread popularity, lots of trainees can be under-coached
about how to properly perform the bench press. The first version of LIFT pre-
dicted the labels “Upper back not tight / elbows out” and “Correct” with some
success. “Upper back not tight / elbows out” was often misclassified as “Correct”
or “Wrists rolled back” as well. The “Upper back not tight / elbows out” label
is used when a trainee flares their elbows out towards 90 degrees, almost perpen-
72
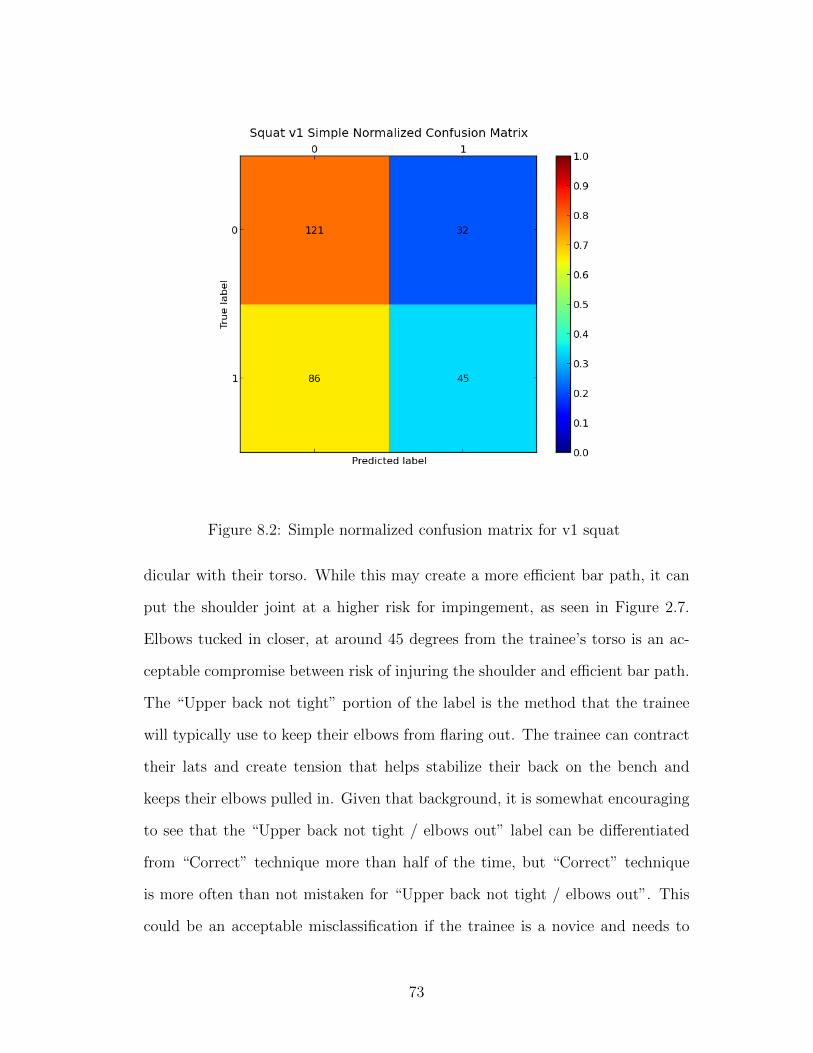
Figure 8.2: Simple normalized confusion matrix for v1 squat
dicular with their torso. While this may create a more efficient bar path, it can
put the shoulder joint at a higher risk for impingement, as seen in Figure 2.7.
Elbows tucked in closer, at around 45 degrees from the trainee’s torso is an ac-
ceptable compromise between risk of injuring the shoulder and efficient bar path.
The “Upper back not tight” portion of the label is the method that the trainee
will typically use to keep their elbows from flaring out. The trainee can contract
their lats and create tension that helps stabilize their back on the bench and
keeps their elbows pulled in. Given that background, it is somewhat encouraging
to see that the “Upper back not tight / elbows out” label can be differentiated
from “Correct” technique more than half of the time, but “Correct” technique
is more often than not mistaken for “Upper back not tight / elbows out”. This
could be an acceptable misclassification if the trainee is a novice and needs to
73
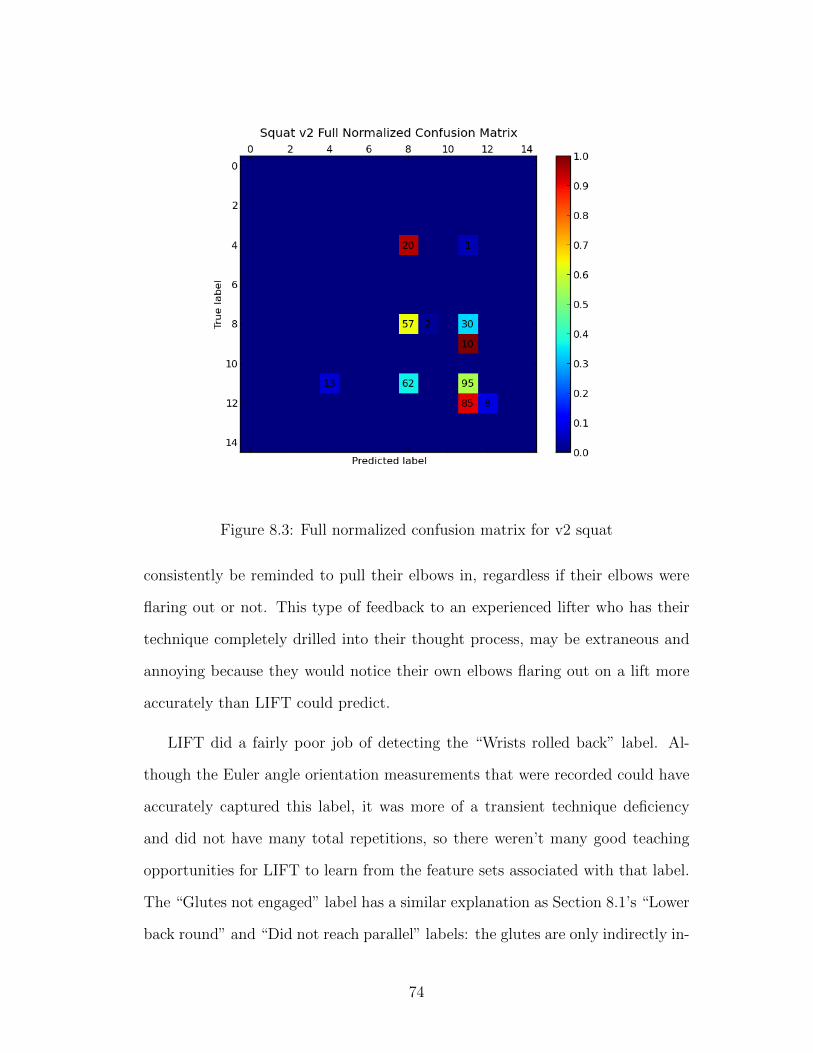
Figure 8.3: Full normalized confusion matrix for v2 squat
consistently be reminded to pull their elbows in, regardless if their elbows were
flaring out or not. This type of feedback to an experienced lifter who has their
technique completely drilled into their thought process, may be extraneous and
annoying because they would notice their own elbows flaring out on a lift more
accurately than LIFT could predict.
LIFT did a fairly poor job of detecting the “Wrists rolled back” label. Al-
though the Euler angle orientation measurements that were recorded could have
accurately captured this label, it was more of a transient technique deficiency
and did not have many total repetitions, so there weren’t many good teaching
opportunities for LIFT to learn from the feature sets associated with that label.
The “Glutes not engaged” label has a similar explanation as Section 8.1’s “Lower
back round” and “Did not reach parallel” labels: the glutes are only indirectly in-
74
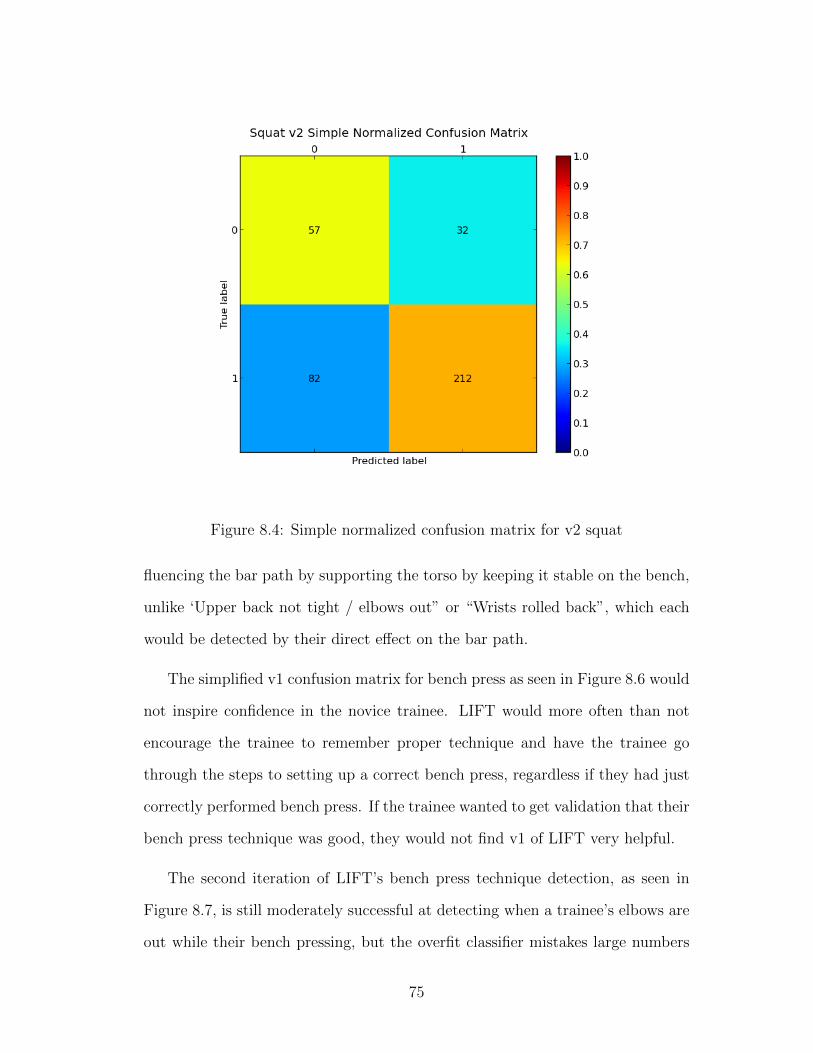
Figure 8.4: Simple normalized confusion matrix for v2 squat
fluencing the bar path by supporting the torso by keeping it stable on the bench,
unlike ‘Upper back not tight / elbows out” or “Wrists rolled back”, which each
would be detected by their direct effect on the bar path.
The simplified v1 confusion matrix for bench press as seen in Figure 8.6 would
not inspire confidence in the novice trainee. LIFT would more often than not
encourage the trainee to remember proper technique and have the trainee go
through the steps to setting up a correct bench press, regardless if they had just
correctly performed bench press. If the trainee wanted to get validation that their
bench press technique was good, they would not find v1 of LIFT very helpful.
The second iteration of LIFT’s bench press technique detection, as seen in
Figure 8.7, is still moderately successful at detecting when a trainee’s elbows are
out while their bench pressing, but the overfit classifier mistakes large numbers
75

of the labels “Did not lock out”, “Bounce off of chest”, “Correct”, “Upper back
not tight”, “Excessive lower back arch”, and “Did not touch chest” as “Elbows
out”. This is probably mostly due to the researchers collecting lots of data in Cal
Poly’s Recreation Center and not balancing the time between there and the Cal
Poly Athletic weight room collecting data on athletes who are very proficient at
performing correct bench press technique. This is the primary cause of why the
full precision and recall for v2 as seen in Table 8.3 is very poor, worse off when
compared with v1 of bench press data.
The great accuracy, precision, and recall numbers for LIFT’s bench press tech-
nique detection on the v2 simple confusion matrix 8.6 are misleading, primarily
because there are just so many incorrect labeled repetitions in comparison to cor-
rectly labeled repetitions. To be fair, the researchers were primarily interested in
figuring out if LIFT could differentiate between specific technique deficiencies and
give the trainee specific feedback about how to most accurately and effectively fix
their barbell lifts. It was not until far into the research that it was suggested that
LIFT could simply determine if a given repetition was simply correct or incorrect.
If this information alone was very accurate, this would be fairly useful tool for
novice trainees to have a reminder to concentrate on good technique above all
else and would positively reinforce them to know what good technique feels like
and also what it feels like when limbs are out of sync.
8.3 Overhead press results
The first version of LIFT’s overhead press technique detection was able to cor-
rectly identify correctly labeled repetitions fairly successfully 8.9. This comes at
a cost of biasing LIFT to misclassify techniques such as “Elbows out”, “Jerky
76
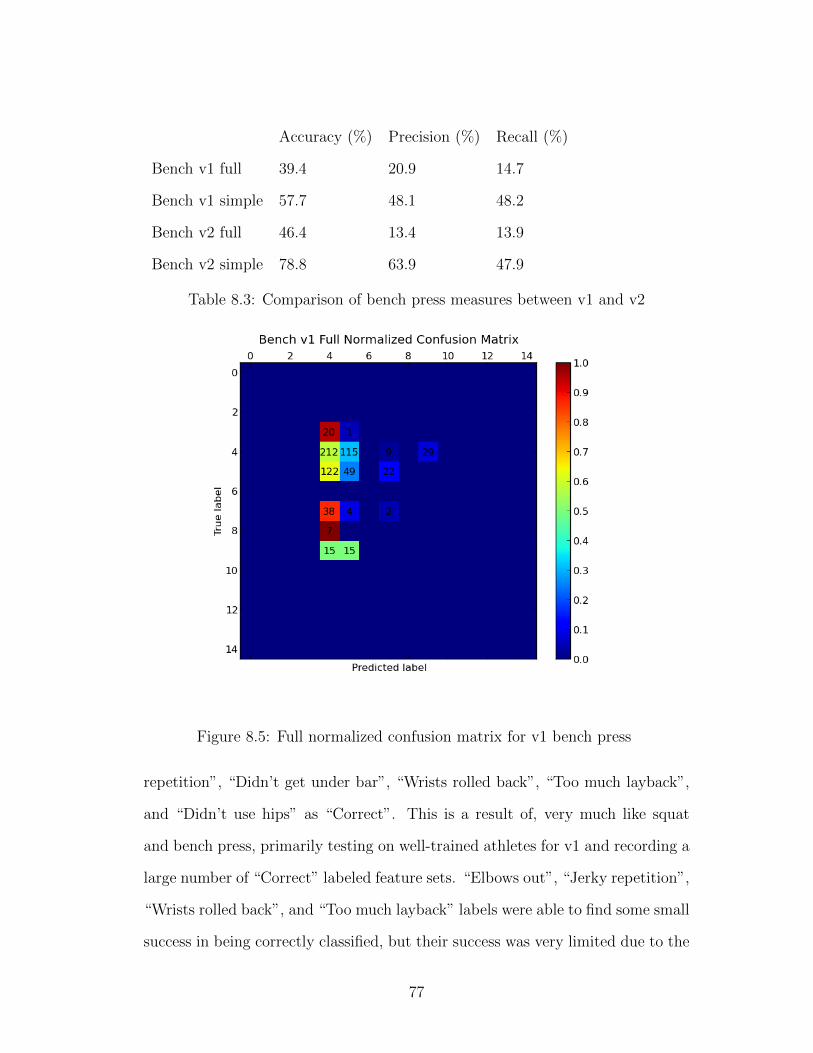
Accuracy (%) Precision (%) Recall (%)
Bench v1 full 39.4 20.9 14.7
Bench v1 simple 57.7 48.1 48.2
Bench v2 full 46.4 13.4 13.9
Bench v2 simple 78.8 63.9 47.9
Table 8.3: Comparison of bench press measures between v1 and v2
Figure 8.5: Full normalized confusion matrix for v1 bench press
repetition”, “Didn’t get under bar”, “Wrists rolled back”, “Too much layback”,
and “Didn’t use hips” as “Correct”. This is a result of, very much like squat
and bench press, primarily testing on well-trained athletes for v1 and recording a
large number of “Correct” labeled feature sets. “Elbows out”, “Jerky repetition”,
“Wrists rolled back”, and “Too much layback” labels were able to find some small
success in being correctly classified, but their success was very limited due to the
77

Label number Bench Label v1 Bench Label v2
0 Jerky repetition Elbows out
1 Did not complete repetition Jerky repetition
2 Did not lock out Did not complete rep
3 Bounce off of chest Did not lock out
4 Upper back not tight / elbows out Bounce off of chest
5 Correct Correct
6 Golden Golden
7 Glutes not engaged Upper back not tight
8 Excessive lower back arch Glutes not engaged
9 Wrists rolled back Excessive lower back arch
10 Left side came up first Wrists rolled back
11 Did not touch chest Left side came up first
12 Right side came up first Did not touch chest
13 N/A Right side came up first
Table 8.4: Bench press label numbers
overwhelming bias towards “Correct” technique labels.
The simplified v1 version of press technique detection for LIFT, as seen in
Figure 8.10 is successful more than half of the time at differentiating “Correct”
techniques from “Incorrect” techniques, and just about half of the time for the
other way around. LIFT as an overhead press coach could help validate that
a novice user was correctly performing the lift half of the time, but during the
other half of the time they would get feedback to remind themselves about how
to properly perform overhead press. This could be useful for novices who need
to constantly be reinforced and encouraged that they are performing correct or
78
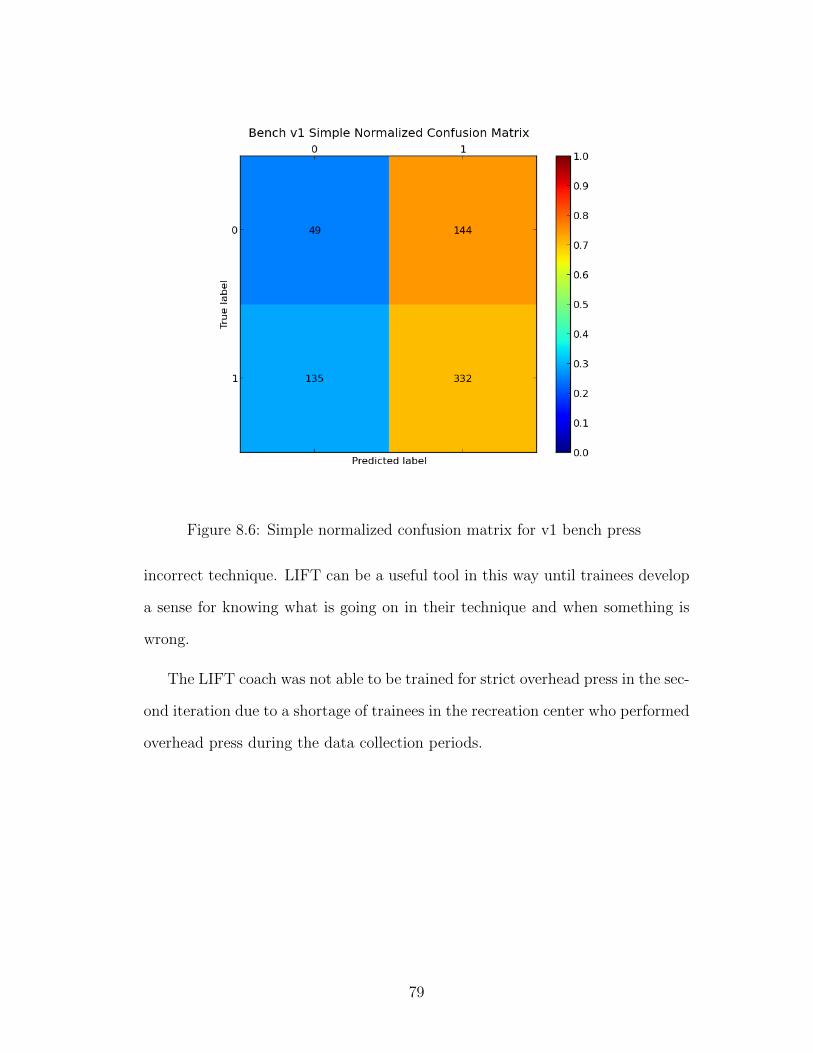
Figure 8.6: Simple normalized confusion matrix for v1 bench press
incorrect technique. LIFT can be a useful tool in this way until trainees develop
a sense for knowing what is going on in their technique and when something is
wrong.
The LIFT coach was not able to be trained for strict overhead press in the sec-
ond iteration due to a shortage of trainees in the recreation center who performed
overhead press during the data collection periods.
79
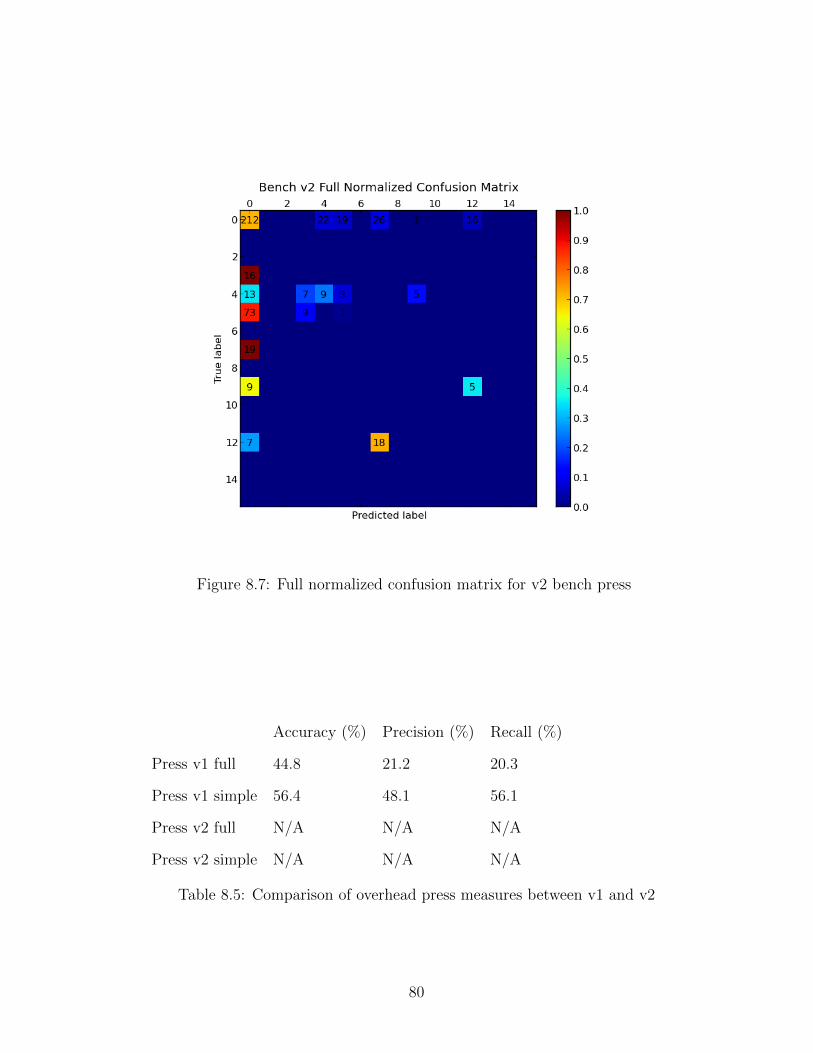
Figure 8.7: Full normalized confusion matrix for v2 bench press
Accuracy (%) Precision (%) Recall (%)
Press v1 full 44.8 21.2 20.3
Press v1 simple 56.4 48.1 56.1
Press v2 full N/A N/A N/A
Press v2 simple N/A N/A N/A
Table 8.5: Comparison of overhead press measures between v1 and v2
80
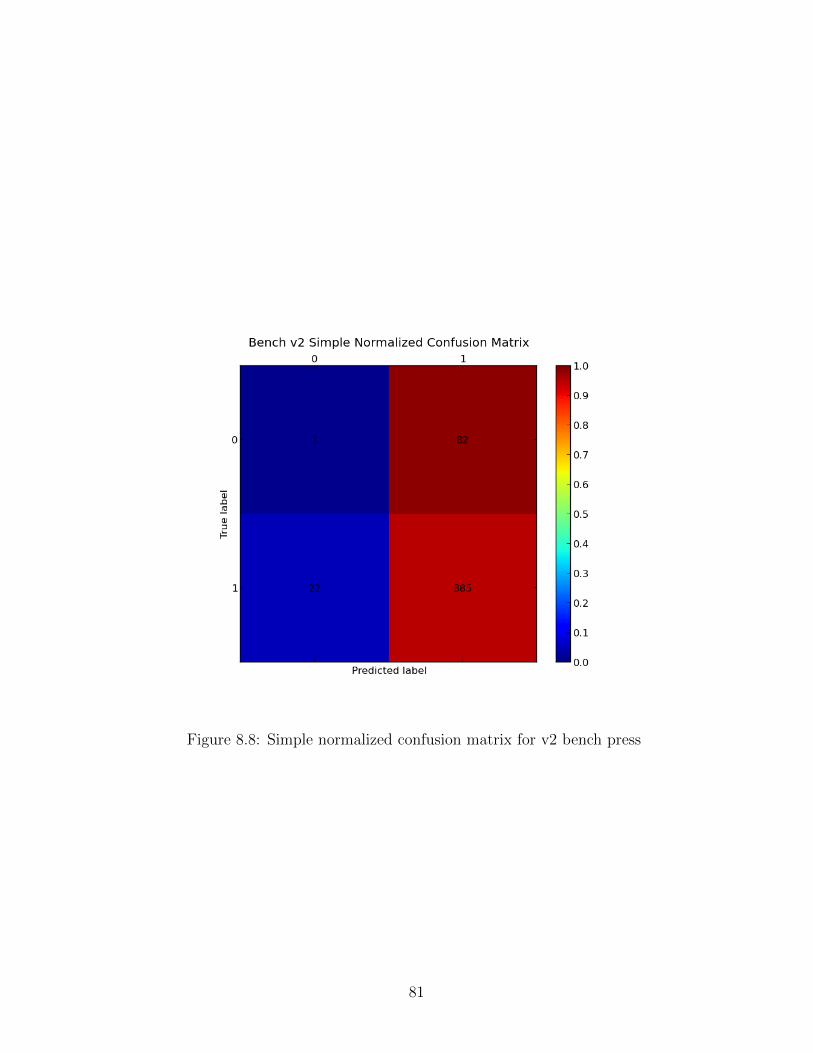
Figure 8.8: Simple normalized confusion matrix for v2 bench press
81

Label number Press Label v1
0 Elbows out
1 Pushed bar away / started too far out
2 Chest/Shoulders/Elbows down
3 Did not complete rep
4 Jerky repetition
5 Right side came up first
6 Didn’t get under bar
7 Correct
8 Golden
9 Wrists rolled back
10 Too much layback
11 Head down
12 Left side came up first
13 Didn’t use hips
Table 8.6: Overhead press v1 label numbers
82
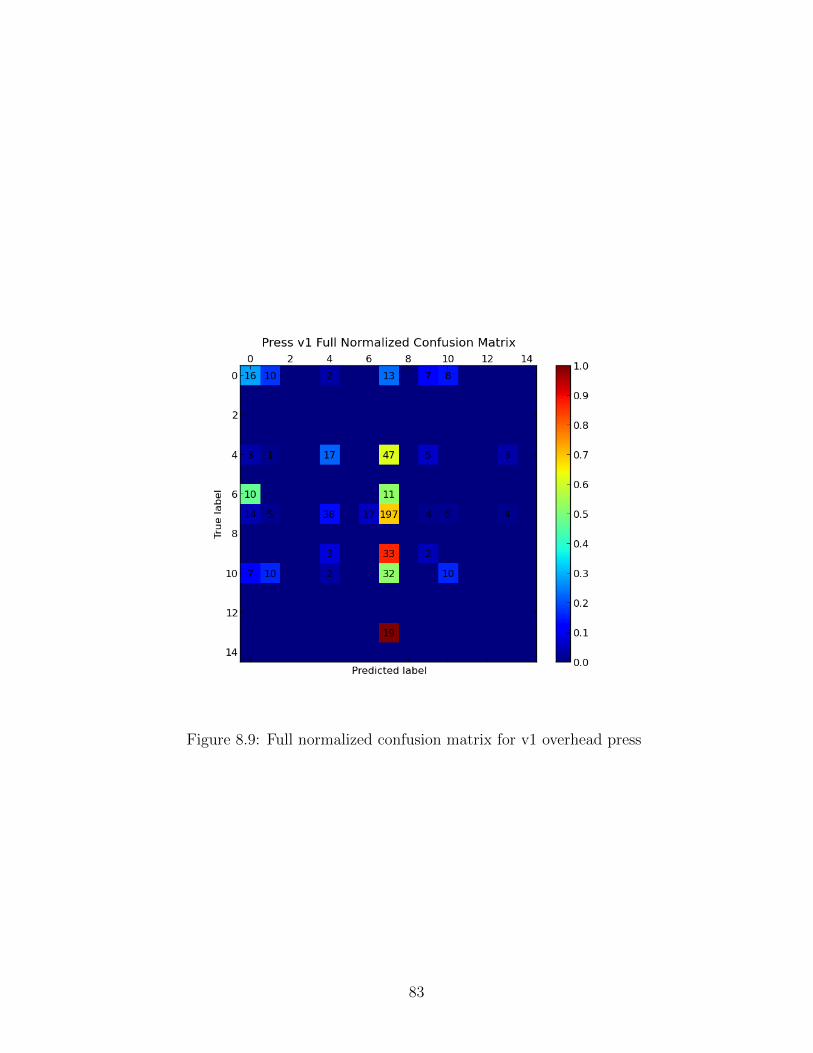
Figure 8.9: Full normalized confusion matrix for v1 overhead press
83

Figure 8.10: Simple normalized confusion matrix for v1 overhead press
84

CHAPTER 9
Analysis
Deriving results from the LIFT coach was an iterative process. Due to the na-
ture of running a human subject experiment and capturing “live” data, testing
revealed that the data collection system, study methodology, and technical design
error all played a part in obtaining the first, fairly erroneous results from LIFT.
9.1 Research study bias and error
As with any data collection experiment, unexpected things happen that help
correct and steer the direction of the experiment towards better definitions, mea-
surements, and representative participant demographics.
9.2 Athlete bias
The athletes in the weight room are well-trained, so they did not commit many
technique deficiencies, so the number of correct repetitions in the training set
are disproportionately higher than the rest of the repetition labels. This also
affected the leave-one-subject-out validation as well. If only one subject com-
mitted a technique deficiency or a limited number of repetitions across multiple
subjects were labeled as a particular deficiency, then they were very likely to be
misclassified as another technique deficiency or as a correct repetition.
85

9.3 Technique deficiency challenges
At various points during the study, subjects performed weight lifting exercises
in such a way that did not fall under pre-existing labels for technique deficien-
cies, so a new labels had to be created and accounted for. On the other end of
the technique deficiency labeling spectrum: subjects either had a very different
understanding of what an exercise entailed, or were very undertrained, but had
a correct understanding of what they should be attempting to accomplish for a
given exercise. Both of these personas introduced the notion of labeling a repeti-
tion with multiple technique deficiencies. Recording multiple labels for a specific
repetition makes algorithmic classification a very hard problem.
9.4 Researcher error
The researchers were not perfect in identifying exactly when the repetitions
started and ended or what its particular label was with LIFT’s data collection
app, occasionally misclicking and missing a repetition, cutting off a repetition
too quickly, or not remembering when exactly a subject’s technique started to
break down. These error sets were later added to a blacklist to be ignored when
analyzing the data in LIFT, but not all of the error sets were blacklisted. This
introduces a small amount of error, limited to 1 - 5 repetitions per testing day,
which is significantly less than 2833 which is the amount of repetitions recorded
in total across both versions of the study. The mislabeling types of errors oc-
curred when subjects performed repetitions greater than or equal to the average
size of the researcher’s short-term memory (5 - 10 repetitions) [75].
86
9.5 Overcoming research study bias and error
To combat these research study-specific sources of bias and error for athlete bias,
challenges with specific weight lifting techniques, and researcher recording error,
respectively, the researchers done in turn:
1. Received approval from the Human Subjects committee to conduct their
study in the Cal Poly Recreation Center, where less-well trained athletes
are more likely to commit technique deficiencies on their own.
2. Amended their testing protocol to explain and demonstrate what they mean
when they instruct the subject to perform a specific exercise.
3. Limited the number of repetitions athletes perform to 5, because it is eas-
ier to remember and break down exactly when an exercise started to be
performed poorly.
These study improvements made the data collection process run much smoother
and enabled the researchers to collect data more accurately.
9.6 Technical error considerations
The first iteration of trainee testing with LIFT was unfortunately inherently
flawed in multiple facets, starting at the sensor level.
9.6.1 Orientation taring
There was an error in the data collecting app where the orientation was automat-
ically tared at the start of every set, regardless of the sensor’s actual orientation.
This was not a correct taring method because the YEI documentation states that
the sensor considers “the zero orientation to be the orientation in which the plug
87

is facing towards you and top(the side with buttons on it) facing up” [22]. The
reasoning behind this specific zero orientation is that the “sensor must be given
a reference orientation that represents the orientation of the sensor when it is in
the position in which you consider the plug to be towards you and the buttons
up” [22].
This was a major factor that contributed to the very low leave-one-subject
out scores that came from athlete testing because the reference orientation was
what enabled the Kalman filter to determine the inital conditions for the sen-
sor fusion process. Because these initial conditions were flawed, they produced
widely-variable output for the orientation, linear acceleration, and gravity vector
readings. The sensor is now manually tared at the beginning of testing an athlete
for a particular exercise.
9.6.2 Magnetometer effects
The magnetometer in the IMU is misguided due to its proximity to the ferrous
metal in the barbell weight collar, the barbell itself, and plates. When the re-
searchers initially got the sensor, they thought about this issue and assumed they
would only be using the raw accelerometer and gyroscope values. They moved
further along in their research and discovered that the sensor can do “sensor fu-
sion” via a Kalman filter on the IMU itself [21], which could potentially yield
more accurate data [93]. Sensor fusion, as detailed in Chapter 2, takes advantage
of the fact that the accelerometer, gyroscope, and magnetometer all have different
weaknesses and can compensate for those weaknesses by combining them together
to obtain a more accurate picture of the motion the IMU is capturing [93]. The
resultant outputs of sensor fusion are orientation, linear acceleration, and the di-
rection of gravity. These outputs are dependent on the inputs of all of the sensors
88

combined, so one consistently inaccurate reading for one sesnor could affect the
end result of all of the sensor fusion outputs.
This is what happened during the first iteration of trainee testing. The re-
searchers did not consider the assumption they made earlier, when considering
the sensor’s interaction with the context of the application environment (lots of
ferrous metals), by using the magnetometer when they moved forward with us-
ing the data captured with the sensor fusion feature. The ferrous metal barbells
and plates adjust the sensor’s perceived orientation by an angle of approximately
30 degrees, but that can hardly be trusted as a constant that stays consistent
throughout the testing. The athletic weight room and recreation center use dif-
ferent types of weights and barbells, so the magnetometer-affected data could
not be assumed to be off by the same angle in all situations. This change in
magnetometer angle so thoroughly undermined the notion of having the sensor
know its orientation in space; it was critical for the researchers to find a solution
that maximized the distance between the sensor and the ferrous metals that it
must still keep track of.
The researchers responded to this issue by putting enough space between
the sensor on the collar and plates by using a firm spacer. The spacer puts at
minimum 6 inches of non-conductive material between the sensor and the weight
collar it will attach to, as seen in Figure 9.1. The distance required between
the sensor and weight collar was measured by moving the weight collar closer to
the sensor until it had an effect on its perceived orientation as shown on a 3D
visualization program provided by the manufacturer of the sensor. Spring clips
will be used to secure the lifter’s weight, and the sensor weight collar will be
attached to the very end of the barbell to prevent interference from the metallic
weight lifting plates.
89

Figure 9.1: The second design of LIFT’s sensor packaging
9.6.3 Euler angles and Gimbal lock
Another source of inaccurate data was the data format of the orientation output
from the Kalman filter. Euler angles, which may be more human readable and
understandable than other methods to defining rotation, are prone to what is
called “Gimbal lock” [93] when an axis of rotation can be ambiguously defined
as another axis of rotation. This is most prominently seen when the pitch goes
to 90 degrees, in line with the roll dimension. This causes the sensor to output
bad values and could potentially introduce unnecessary variability in the system.
90
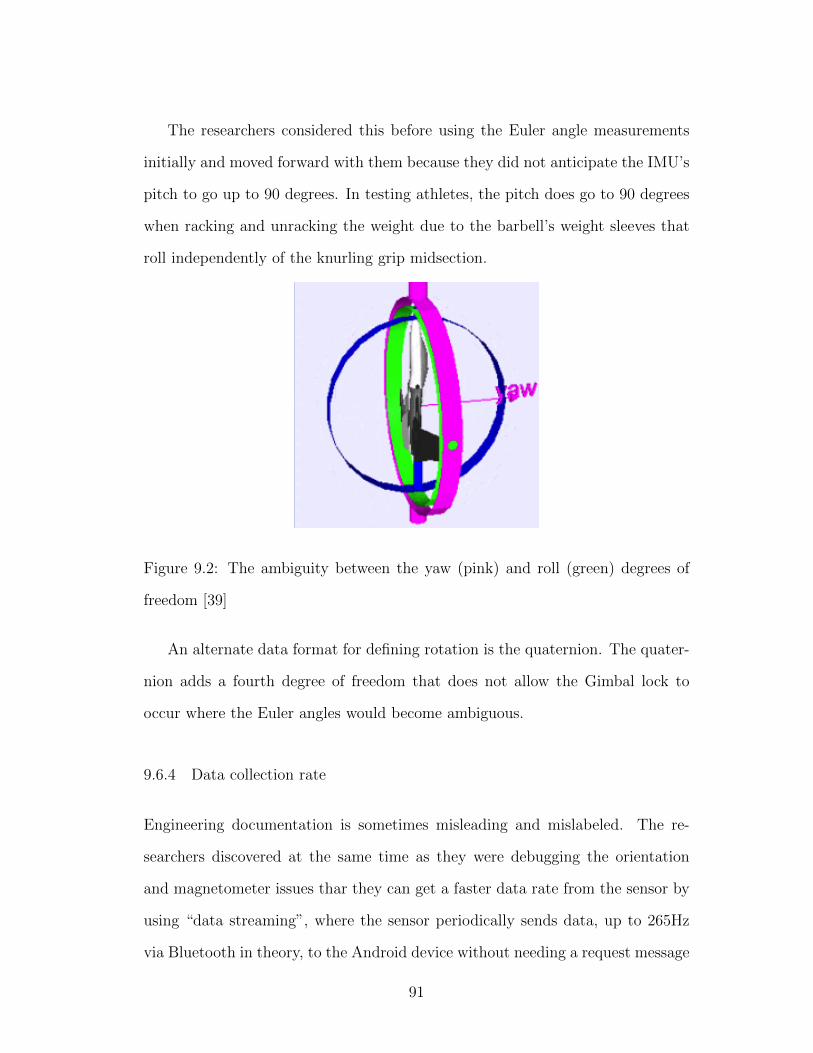
The researchers considered this before using the Euler angle measurements
initially and moved forward with them because they did not anticipate the IMU’s
pitch to go up to 90 degrees. In testing athletes, the pitch does go to 90 degrees
when racking and unracking the weight due to the barbell’s weight sleeves that
roll independently of the knurling grip midsection.
Figure 9.2: The ambiguity between the yaw (pink) and roll (green) degrees of
freedom [39]
An alternate data format for defining rotation is the quaternion. The quater-
nion adds a fourth degree of freedom that does not allow the Gimbal lock to
occur where the Euler angles would become ambiguous.
9.6.4 Data collection rate
Engineering documentation is sometimes misleading and mislabeled. The re-
searchers discovered at the same time as they were debugging the orientation
and magnetometer issues thar they can get a faster data rate from the sensor by
using “data streaming”, where the sensor periodically sends data, up to 265Hz
via Bluetooth in theory, to the Android device without needing a request message
91
for every data point [21].
This feature was described under the heading “Wired Streaming Mode” in the
YEI datasheet, and is the only section on “streaming” there is no corresponding
“Wireless Streaming Mode” heading [22]. Until they were debugging sensor
orientation code, they did not know that there was such a thing as Bluetooth
streaming. The heading “Wired streaming” made it sound like it required a
cable to be attached and that precluded their use case.
The researchers are now able to take data at much faster rates at around
100Hz with this streaming mode and it has lead to more accurate results than
the first iteration of the 20Hz message-passing-based collection rate.
9.6.5 Exercise technique deficiency ambiguity
Exercise technique deficiencies are sometimes ambiguous because there are mul-
tiple deficiencies occurring at once due to the trainee’s poor understanding of the
proper technique to do in the first place. The researchers have come up with a
“deficiency priority” to try and solve this problem. If multiple deficiencies are
spotted, then the LIFT analysis tool would just use the label that most directly
impacts the core movement of the lift. The “core movement” of a lift is defined
as the body parts that are or are closest to the active joints in question for a
particular exercise. By having to rework other things for the next data collection
iteration, the researchers also had a chance to take what they learned from the
first time recording the data set and can make the next data set’s labels more
accurate.
92
CHAPTER 10
Conclusions
This research has verified Velloso et al.’s claim that training classifiers to predict
technique errors is time-consuming and hard to scale [110]. The classification
problem became harder when significantly challenging amounts of weight were
tested on participants as well as the many different types of technique deficiencies
that are found in barbell exercises, as described in Chapter 2. The classification
problem was confounded by erroneous use of the sensor in earlier versions. As
those problems became ironed out over time, new ones appeared in the form of
significant participant bias towards being undertrained and performing barbell
exercises with improper technique as the system was re-tested. This bias towards
more novice trainees is just an example of one of the many complex interactions
of variables, physical or computational, within the LIFT system.
One of the main takeaways from this research is that although this is a hard
problem, there is plenty of commercial potential [2, 3, 11, 16] because this is an
important problem for many people. The barriers to teaching people how to
exercise safely and effectively with instant feedback in a very widespread fashion
have never been lower and are ready for willing innovators to scale over them.
Society has much strength to gain, potential to unlock, many lives to improve,
and weight to lose if this research or related commercial ventures continues and
finds success.
93

CHAPTER 11
Future Work
There are many ways to branch and build off of this groundwork for a on-bar
exercise technique feedback system. Below are a few that the researchers would
be particularly interested in continuing forward with.
11.1 Visual feedback
The LIFT framework aims to put an invaluable weight lifting coaching toolset
in the hands of athletes with access to mobile technology. Much of the weight
lifting feedback loop can be automated so inexperienced lifters without a personal
trainer or weight lifting coach can receive feedback on their weightlifting technique
without the hassle of setting up extra equipment. Future iterations of LIFT will
be able to visually compare an athlete’s bar path with an established standard
optimal path for a given lift, or even against other elite-level lifter’s bar paths.
Another variation of the system could possibly establish an athlete’s warm up sets
to be the standard which their future sets for that workout should be compared
to. If the later sets in the workout start to deviate too much, the system could
suggest to the user to decrease the amount of weight they are lifting or stop doing
that exercise for that workout.
94
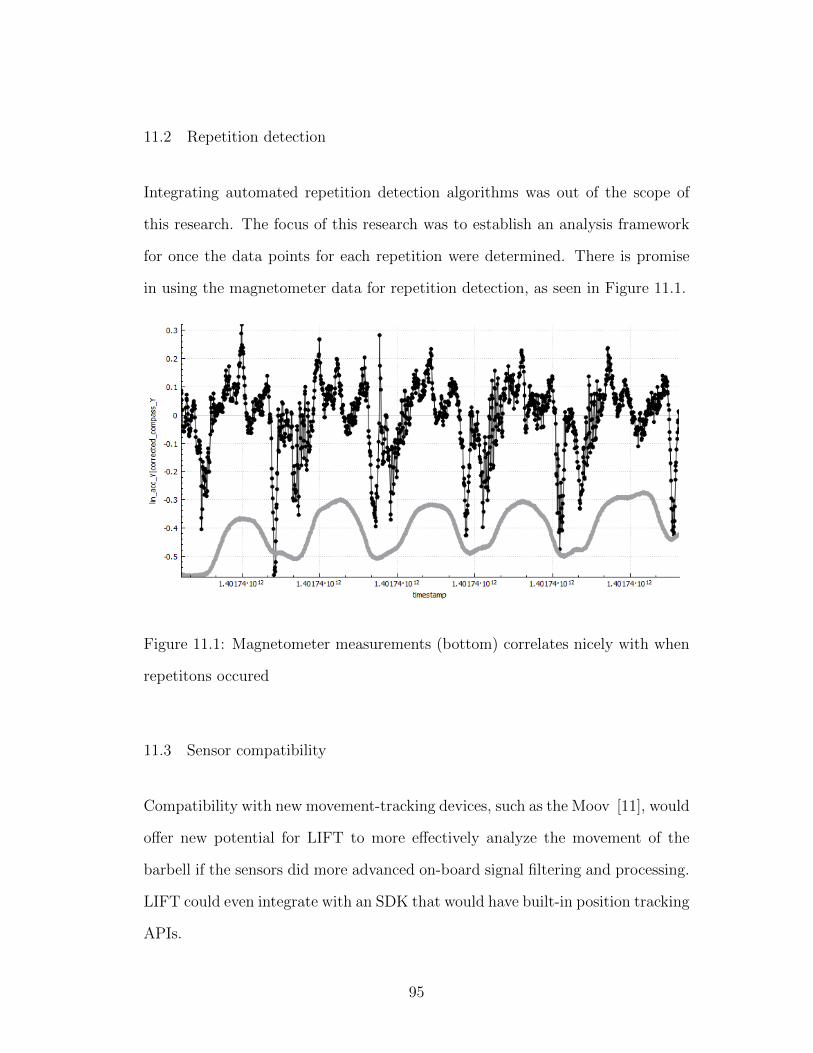
11.2 Repetition detection
Integrating automated repetition detection algorithms was out of the scope of
this research. The focus of this research was to establish an analysis framework
for once the data points for each repetition were determined. There is promise
in using the magnetometer data for repetition detection, as seen in Figure 11.1.
Figure 11.1: Magnetometer measurements (bottom) correlates nicely with when
repetitons occured
11.3 Sensor compatibility
Compatibility with new movement-tracking devices, such as the Moov [11], would
offer new potential for LIFT to more effectively analyze the movement of the
barbell if the sensors did more advanced on-board signal filtering and processing.
LIFT could even integrate with an SDK that would have built-in position tracking
APIs.
95
11.4 Body type clustering
In the future, the LIFT analysis system’s Android app could not only take data
points acquired by the sensor into consideration for technique evaluation, but it
could also cluster similarly-sized athletes together to account for anatomical vari-
ations in bone structure. Athletes who have similar anatomical proportions, such
as limb and torso lengths, are more likely to have the same “correct” technique
than those who do not. This additional step could help LIFT classify the data
the sensor collects more accurately. The anatomical data will be self-reported
and could be subject to some amount of error, so ratios of limb lengths can be
clustered in addition to the raw limb length values.
This approach was not taken in this research because the researchers’ wanted
to keep the friction for participation in the study as low as possible.
11.5 Female study
The research conducted so far has only been on male student-athletes and recre-
ation center participants. A main concern that was expressed in Section 5.2.1
was that while there would be plenty of female student-athlete participants who
do barbell exercises in the athletic weight room, they would be biased towards
completing exercises in a “correct” fashion. There is not as large of a corre-
sponding female population in the recreation center that participate in barbell
weight lifting exercise, so the data would be heavily skewed towards classifying
repetitions as “correct”. The researchers could have eventually recorded enough
technique deficiencies in the athletic weight room to have relevant results, but
unfortunately, this was not feasible within the time frame of when this research
96
was to be completed.
11.6 Alternative ways to provide weight lifting feedback
A “golden standard” approach may be how other competing exercise feedback
systems are attempting to classify and give exercise technique feedback. The
golden standard would classify a repetition outside of a 5-10% threshold as “in-
correct”. After it is classified as incorrect, the system would go into more analysis
as to specifically how the technique was incorrect and to provide feedback to the
user about what they could do differently.
97

BIBLIOGRAPHY
[1] Amiigo. https://amiigo.com/.
[2] Athos Clothing . https://www.liveathos.com/.
[3] Atlas Fitness Tracker. http://atlaswearables.com/.
[4] Barsense app. http://www.barsense.com/.
[5] Basis. http://www.mybasis.com/.
[6] Coach’s Eye app. http://www.coachseye.com/.
[7] Fitbit. http://www.fitbit.com/.
[8] Jawbone Up. https://jawbone.com/up.
[9] Kinovea software. http://www.kinovea.org/.
[10] Moov Developers. http://developers.moov.cc/.
[11] Moov Fitness Tracker. http://moov.cc/.
[12] Nike + iPod. https://www.apple.com/ipod/nike/run.html.
[13] Nike+ Fuelband SE. http://www.nike.com/us/en us/c/nikeplus-fuelband.
[14] Platform Helper app. https://play.google.com/store/apps/details?id=platform.helper.yair.
[15] Polar Flow. https://flow.polar.com/.
[16] Push Strength Tracker. http://www.pushstrength.com/.
98

[17] Quantified Self Guide to Self-Tracking Tools.
http://quantifiedself.com/guide/.
[18] Sitting facts. http://www.juststand.org/TheFacts/tabid/816/language/en-
US/Default.aspx.
[19] The Rise of the Quantified Self in Health Care.
http://blogs.wsj.com/venturecapital/2013/08/13/the-rise-of-the-
quantified-self-in-health-care/.
[20] Withings. http://vitrine.withings.com/.
[21] YEI 3-Space Bluetooth Sensor.
http://www.yeitechnology.com/productdisplay/3-space-bluetooth.
[22] YEI 3-Space Bluetooth Sensor User’s Manual.
http://www.yeitechnology.com/sites/default/files/YEI 3-
Space Sensor Users Manual Bluetooth 2.0 r21 26Mar2014.pdf.
[23] Machine Learning 2.8 Random Forests.
https://www.youtube.com/watch?v=o7iDkcpOr g, 6 2011.
[24] Tutorial: Kalman Filter with MATLAB example part1.
https://www.youtube.com/watch?v=FkCT LV9Syk, 4 2011.
[25] Chapter 1, traffic detector handbook.
http://www.fhwa.dot.gov/publications/research/operations/its/06108/01.cfm,
4 2012.
[26] Estimating Velocity and Position Using Accelerometers. 10 2012.
99

[27] Android kalman filter accelerometer.
http://www.wikiprohq.com/android-kalman-filter-accelerometer,
5 2014.
[28] Juul Achten and Asker E Jeukendrup. Heart rate monitoring. Sports
medicine, 33(7):517–538, 2003.
[29] Kerem Altun and Billur Barshan. Human activity recognition using iner-
tial/magnetic sensor units. In Human Behavior Understanding, pages
38–51. Springer, 2010.
[30] Marc Bachlin, Kilian Forster, and Gerhard Troster. SwimMaster: A
wearable assistant for swimmer. In Ubicomp ’09: Proceedings of the
11th international conference on Ubiquitous computing, pages 215–
224, New York, NY, USA, September 2009. ACM.
[31] James Balmer, Rc Richard Davison, and Steve R Bird. Peak power pre-
dicts performance power during an outdoor 16.1-km cycling time
trial. Medicine and Science in Sports and Exercise, 32(8):1485–1490,
2000.
[32] K.A. Bonnet. Systems and methods for comprehensive human movement
analysis, April 15 2014. US Patent 8,698,888.
[33] Leo Breiman. Random forests. Machine learning, 45(1):5–32, 2001.
[34] Jeffrey P Broker. Cycling power: road and mountain. High-Tech Cycling:
The science of riding faster, pages 147–174, 2003.
[35] Yongyao Cai, Yang Zhao, Xianfeng Ding, and James Fen-
nelly. Magnetometer basics for mobile phone applications.
100

http://www.electronicproducts.com/Sensors and Transducers/ Sen-
sors and Transducers/Magnetometer basics for mobile phone applications.aspx,
1 2012.
[36] Andrew J. Callaway and Jon E. Cobb. Linear Acceleration Measure-
ment Utilizing Inter-Instrument Synchronization: A Comparison be-
tween Accelerometers and Motion-Based Tracking Approaches. Mea-
surement in Physical Education and Exercise Science, 16(2):151–163,
2012.
[37] John F Caruso, Nathan M Olson, Skyler T Taylor, Jessica R McLagan,
Catherine M Shepherd, Jake A Borgsmiller, Melissa L Mason, Re-
bekah R Riner, Laura Gilliland, and Shawn Grisewold. Front squat
data reproducibility collected with a triple-axis accelerometer. The
Journal of Strength & Conditioning Research, 26(1):40–46, 2012.
[38] Paul Chek. How to eat, move and be healthy. CHEK Institute, San
Diego, CA, 2004.
[39] Wikimedia Commons. Gimbal lock, 2011. File: Gimbal lock.jpg.
[40] Rachel Cooper, Diana Kuh, Rebecca Hardy, Mortality Review Group,
et al. Objectively measured physical capability levels and mortality:
systematic review and meta-analysis. BMJ: British Medical Journal,
341, 2010.
[41] Dekhtyar, Alexander. Data Mining: Classication/Supervised
Learning. http://users.csc.calpoly.edu/ dekhtyar/466-
Spring2012/lectures/lec05.466.pdf, 2012.
101
[42] Michael J Duffey and John H Challis. Vertical and lateral forces applied
to the bar during the bench press in novice lifters. The Journal of
Strength & Conditioning Research, 25(9):2442–2447, 2011.
[43] M. Duncan, S. Parker, C. Worringham, P. Condie, A. Barriskill, B. Cur-
cic, J. Jasiewicz, and T. Parker. Motion Monitoring and Analysis
System, October 25 2007. US Patent App. 10/562,858.
[44] Avery D Faigenbaum and Gregory D Myer. Resistance training among
young athletes: safety, efficacy and injury prevention effects. British
journal of sports medicine, 44(1):56–63, 2010.
[45] John Garhammer. Biomechanical Profiles of Olympic Weightlifters. In-
ternational Journal of Sport Biomechanics, 1(2), 1985.
[46] John Geen and David Krakauer. New imems R© angular-rate-sensing gyro-
scope. Analog Dialogue, 37(3):1–4, 2003.
[47] Pierre Geurts, Damien Ernst, and Louis Wehenkel. Extremely random-
ized trees. Machine learning, 63(1):3–42, 2006.
[48] J. Giuffrida. Movement disorder monitoring system and method, May 29
2012. US Patent 8,187,209.
[49] D. Gordon, S.L. Mullane, P.P. Conway, and A.A. West. Development of
a Novel System for Monitoring Strength and Conditioning in Elite
Athletes. Procedia Engineering, 34(0):496 – 501, 2012. Engineering of
Sport Conference 2012 .
[50] Vivienne Gray. The framing of Socrates: the literary interpretation of
Xenophon’s Memorabilia, volume 79. Franz Steiner Verlag, 1998.
102

[51] Giuliana Grimaldi and Mario Manto. Neurological tremor: Sensors, sig-
nal processing and emerging applications. Sensors, 10(2):1399–1422,
2010.
[52] John J. Guiry, Pepijn van de Ven, and John Nelson. Multi-Sensor Fu-
sion for Enhanced Contextual Awareness of Everyday Activities with
Ubiquitous Devices. Sensors, 14(3):5687–5701, 2014.
[53] Mohammad Ashfak Habib, Mas S Mohktar, Shahrul Bahyah Kamaruz-
zaman, Kheng Seang Lim, Tan Maw Pin, and Fatimah Ibrahim.
Smartphone-based solutions for fall detection and prevention: chal-
lenges and open issues. Sensors, 14(4):7181–7208, 2014.
[54] Mats Hagberg. Muscular endurance and surface electromyogram in iso-
metric and dynamic exercise. Journal of Applied Physiology, 51(1):1–
7, 1981.
[55] Fred Hamprecht. 6.3 Random Forest.
https://www.youtube.com/watch?v=gdnIqGbqiYs, 11 2012.
[56] Hagen Hartmann, Klaus Wirth, and Markus Klusemann. Analysis of the
load on the knee joint and vertebral column with changes in squat-
ting depth and weight load. Sports Medicine, 43(10):993–1008, 2013.
[57] Robert Hurling, Michael Catt, Marco De Boni, William Bruce Fairley,
Tina Hurst, Peter Murray, Alannah Richardson, and Singh Jaspreet
Sodhi. Using Internet and Mobile Phone Technology to Deliver an
Automated Physical Activity Program: Randomized Controlled Trial.
J Med Internet Res, 9(2):e7, Apr 2007.
103
[58] Asker Jeukendrup and Adrie Van Diemen. Heart rate monitoring dur-
ing training and competition in cyclists. Journal of Sports Sciences,
16(sup1):91–99, 1998.
[59] Hao Jiang and Jason O. Hallstrom. Fast, Accurate Event Classification
on Resource-Lean Embedded Sensors. ACM Trans. Auton. Adapt.
Syst., 8(2):11:1–11:22, July 2013.
[60] Hemant Khandelwal. Snapshot of the wearable device market.
http://www.crunchyfriday.com/snapshot-of-wearable-device-market/,
1 2014.
[61] Gihan Kuruppu, S. R. Kodituwakku, and U. A. J. Pinidiyaarachchi. High
Speed Motion Tracking for Weightlifting based on Correlation Coeffi-
cient Template Matching.
[62] Zhi Li and Guanglie Zhang. A gait recognition system for rehabilita-
tion based on wearable micro inertial measurement unit. In Robotics
and Biomimetics (ROBIO), 2011 IEEE International Conference on,
pages 1678–1682, Dec 2011.
[63] Wade A Lillegard, Eugene W Brown, Daniel J Wilson, Ruben Henderson,
and Evelyn Lewis. Efficacy of strength training in prepubescent to
early postpubescent males and females: effects of gender and matu-
rity. Developmental Neurorehabilitation, 1(3):147–157, 1997.
[64] Z. Lin, M. Zecca, S. Sessa, L. Bartolomeo, H. Ishii, K. Itoh, and
A. Takanishi. Development of an ultra-miniaturized inertial mea-
surement unit WB-3 for human body motion tracking. In System In-
104

tegration (SII), 2010 IEEE/SICE International Symposium on, pages
414–419, Dec 2010.
[65] Henrik Linusson, Robin Rudenwall, and Andreas Olausson. Random for-
est och glesa datarespresentationer. University of BorAs/School of
Business and IT, 2012.
[66] Michael Marschollek, Matthias Gietzelt, Mareike Schulze, Martin
Kohlmann, Bianying Song, and Klaus-Hendrik Wolf. Wearable sen-
sors in healthcare and sensor-enhanced health information systems:
all our tomorrows? Healthcare informatics research, 18(2):97–104,
2012.
[67] James C Martin, Douglas L Milliken, John E Cobb, Kevin L McFadden,
and Andrew R Coggan. Validation of a mathematical model for road
cycling power. Journal of applied biomechanics, 14:276–291, 1998.
[68] Jerry L Mayhew, Blair D Johnson, Michael J LaMonte, Dirk Lauber, and
Wolfgang Kemmler. Accuracy of prediction equations for determin-
ing one repetition maximum bench press in women before and after
resistance training. The Journal of Strength & Conditioning Research,
22(5):1570–1577, 2008.
[69] Ryan S McGinnis. Advancing Applications of IMUs in Sports Training
and Biomechanics. PhD thesis, University of California, 2013.
[70] J. McNames, P.M.R. Aboy, and A. Greenberg. Complete integrated sys-
tem for continuous monitoring and analysis of movement disorders,
March 25 2010. US Patent App. 12/565,697.
[71] Mehdi. Fractional Plates. http://stronglifts.com/5x5/#Fractional Plates.
105
[72] Mehdi. Madcow 5 x 5: Another Simple Routine to Get Stronger Af-
ter StrongLifts 5 x 5. http://stronglifts.com/madcow-5x5-training-
programs/.
[73] Mehdi. Microloading Solutions.
http://stronglifts.com/madcow/Topics/Microloading.htm.
[74] Brandon J Miller and Fadi A Fathallah. Body-fixed orientation sen-
sors for trunk motion sensing. In Proceedings of the Human Factors
and Ergonomics Society Annual Meeting, volume 51, pages 933–937.
SAGE Publications, 2007.
[75] George A Miller. The magical number seven, plus or minus two: some
limits on our capacity for processing information. Psychological re-
view, 63(2):81, 1956.
[76] A. Moeller, L. Roalter, S. Diewald, M. Kranz, N. Hammerla, P. Olivier,
and T. Ploetz. Gymskill: A personal trainer for physical exercises. In
Proceedings of the International Conference on Pervasive Computing
and Communications, 2012.
[77] Isabel S Moore, Andrew M Jones, and Sharon J Dixon. Mechanisms for
improved running economy in beginner runners. Medicine & Science
in Sports & Exercise, 2012.
[78] Bobak Mortazavi, Mohammad Pourhomayoun, Gabriel Alsheikh, Nabil
Alshurafa, Sunghoon Ivan Lee, and Majid Sarrafzadeh. Determining
the Single Best Axis for Exercise Repetition Recognition and Count-
ing with SmartWatches.
106

[79] Sam K Morton, James R Whitehead, Ronald H Brinkert, and Dennis J
Caine. Resistance training vs. static stretching: effects on flexibil-
ity and strength. The Journal of Strength & Conditioning Research,
25(12):3391–3398, 2011.
[80] Nathaniel Mott. Fitness Tech Needs to Pick Up the Pace.
http://pando.com/2012/05/21/fitness-tech-needs-to-pick-up-the-
pace/.
[81] SL Mullane, N Chakravorti, PP Conway, and AA West. Design and
implementation of a user-centric swimming performance monitoring
tool. Proceedings of the Institution of Mechanical Engineers, Part P:
Journal of Sports Engineering and Technology, 225(4):213–229, 2011.
[82] Bijan Najafi, Deena Horn, Samuel Marclay, Ryan T Crews, Stephanie
Wu, and James S Wrobel. Assessing postural control and postural
control strategy in diabetes patients using innovative and wearable
technology. Journal of diabetes science and technology, 4(4):780–791,
2010.
[83] Shahram Lenjan Nejadian, Mostafa Rostami, and Abolghasem Naghash.
Cost evaluation of different snatch trajectories by using dynamic pro-
gramming method. Procedia Engineering, 2(2):2563–2567, 2010.
[84] G Neumayr, R Pfister, G Mitterbauer, H Gaenzer, W Sturm, and H Ho-
ertnagl. Heart rate response to ultraendurance cycling. British jour-
nal of sports medicine, 37(1):89–90, 2003.
[85] I. Newton, A. Motte, and J. Machin. The Mathematical Principles of
107

Natural Philosophy. Number v. 1 in The Mathematical Principles of
Natural Philosophy. B. Motte, 1729.
[86] F. Pedregosa, G. Varoquaux, A. Gramfort, V. Michel, B. Thirion,
O. Grisel, M. Blondel, P. Prettenhofer, R. Weiss, V. Dubourg, J. Van-
derplas, A. Passos, D. Cournapeau, M. Brucher, M. Perrot, and
E. Duchesnay. Scikit-learn: Machine learning in Python. Journal
of Machine Learning Research, 12:2825–2830, 2011.
[87] Igor Pernek, Karin Anna Hummel, and Peter Kokol. Exercise Repetition
Detection for Resistance Training Based on Smartphones. Personal
Ubiquitous Comput., 17(4):771–782, April 2013.
[88] Rodrigo Prez, rsula Costa, Marc Torrent, Javier Solana, Eloy Opisso,
Csar Cceres, Josep M. Tormos, Josep Medina, and Enrique J. Gmez.
Upper limb portable motion analysis system based on inertial tech-
nology for neurorehabilitation purposes. Sensors, 10(12):10733–10751,
2010.
[89] John Ross Quinlan. C4.5: programs for machine learning, volume 1. Mor-
gan Kaufmann, 1993.
[90] Mark Rippetoe. Starting Strength. The Aasgaard Company.
[91] Jari-Pekka Rontu, Manne I Hannula, Sami Leskinen, Vesa Linnamo, and
Jukka A Salmi. One-repetition maximum bench press performance
estimated with a new accelerometer method. The Journal of Strength
& Conditioning Research, 24(8):2018–2025, 2010.
[92] Dan Rowinski. How Google’s Fitness API Will Buff You Up.
108
http://readwrite.com/2014/01/17/how-google-fitness-api-contextual-
sensor-data-android-users.
[93] David Sachs. Sensor Fusion on Android Devices: A Revolution in Motion
Processing. https://www.youtube.com/watch?v=C7JQ7Rpwn2k, 8
2010.
[94] Kimi Sato and Paul Fleschler. A new approach to measure weightlifting
performance “introducing an accelerometer”.
[95] Kimitake Sato, Paul Fleschler, and W Sands. Barbell acceleration analy-
sis on various intensities of weightlifting. In ISBS-Conference Proceed-
ings Archive, volume 1, 2009.
[96] Kimitake Sato, William A Sands, and Michael H Stone. The reliability of
accelerometry to measure weightlifting performance. Sports Biome-
chanics, 11(4):524–531, 2012.
[97] Kimitake Sato, Sarah L Smith, and William A Sands. Validation of
an accelerometer for measuring sport performance. The Journal of
Strength & Conditioning Research, 23(1):341–347, 2009.
[98] M. Schulze, Tsung-Han Liu, Jiang Xie, Wu Zhang, Klaus-Hendrik Wolf,
T. Calliess, H. Windhagen, and M. Marschollek. Unobtrusive ambu-
latory estimation of knee joint angles during walking using gyroscope
and accelerometer data - a preliminary evaluation study. In Biomed-
ical and Health Informatics (BHI), 2012 IEEE-EMBS International
Conference on, pages 559–562, Jan 2012.
[99] Christian Seeger, Alejandro Buchmann, and Kristof Van Laerhoven. my-
HealthAssistant: A Phone-based Body Sensor Network That Cap-
109
tures the Wearer’s Exercises Throughout the Day. In Proceedings of
the 6th International Conference on Body Area Networks, BodyNets
’11, pages 1–7, ICST, Brussels, Belgium, Belgium, 2011. ICST (Insti-
tute for Computer Sciences, Social-Informatics and Telecommunica-
tions Engineering).
[100] A. Shamaie. Tracking bimanual movements, September 11 2008. US
Patent App. 11/932,766.
[101] T. Shany, S.J. Redmond, M.R. Narayanan, and N.H. Lovell. Sensors-
Based Wearable Systems for Monitoring of Human Movement and
Falls. Sensors Journal, IEEE, 12(3):658–670, March 2012.
[102] Jason Shea. Fatigue, recovery, and supercompensation.
http://www.teamunify.com/cseksc/ doc / Shea FatigueRecovery
Supercompensation-2.pdf.
[103] A.V.W. Smith, A.I. Sutherland, A. Lemoine, and S. Mcgrath. Hand ges-
ture recognition system and method, October 3 2000. US Patent
6,128,003.
[104] Z.S. Sobolewski. Intelligent sport shoe system, June 18 2013. US Patent
8,467,979.
[105] Gabor Soros, Florian Daiber, and Tomer Weller. Cyclo: A personal bike
coach through the glass. In SIGGRAPH Asia 2013 Symposium on
Mobile Graphics and Interactive Applications, SA ’13, pages 99:1–
99:4, New York, NY, USA, 2013. ACM.
[106] K Starrett. Becoming A Supple Leopard. Victory Belt Publishing, 2013.
110

[107] MJ Thompson, M Li, and DA Horsley. Low power 3-axis lorentz force
navigation magnetometer. In Micro Electro Mechanical Systems
(MEMS), 2011 IEEE 24th International Conference on, pages 593–
596. IEEE, 2011.
[108] Alexander A Trusov. Overview of MEMS Gyroscopes: History, Principles
of Operations, Types of Measurements. 2011.
[109] Y. Varatharajah, N. Karunathilaka, M. Rismi, S. Kotinkaduwa, and
D. Dias. Body area sensor network for evaluating fitness exercise.
In Wireless and Mobile Networking Conference (WMNC), 2013 6th
Joint IFIP, pages 1–8, April 2013.
[110] Eduardo Velloso, Andreas Bulling, Hans Gellersen, Wallace Ugulino, and
Hugo Fuks. Qualitative activity recognition of weight lifting exercises.
In Proceedings of the 4th Augmented Human International Confer-
ence, pages 116–123. ACM, 2013.
[111] Daniel Vlasic, Rolf Adelsberger, Giovanni Vannucci, John Barnwell,
Markus Gross, Wojciech Matusik, and Jovan Popovic. Practical Mo-
tion Capture in Everyday Surroundings. ACM Trans. Graph., 26(3),
July 2007.
[112] Patrick L Walter. The history of the accelerometer. Sound and vibration,
31(3):16–23, 1997.
[113] Bill Wilson. Induction of Decision Trees
Notes. http://www.cse.unsw.edu.au/billw/
cs9414/notes/ml/06prop/id3/id3.html, 2008.
[114] Gary Wolf. Quantified Self. http://quantifiedself.com/about/.
111

[115] Xiaoyi Zhang, Ming-Chun Huang, Fengbo Ren, Wenyao Xu, Nan Guan,
and Wang Yi. Proper running posture guide: A wearable biomechan-
ics capture system. In Proceedings of the 8th International Conference
on Body Area Networks, BodyNets ’13, pages 83–89, ICST, Brus-
sels, Belgium, Belgium, 2013. ICST (Institute for Computer Sciences,
Social-Informatics and Telecommunications Engineering).
112