towards an ontology modeling tool. a validation in software engineering scenarios
TRANSCRIPT
Expert Systems with Applications 39 (2012) 11468–11478
Contents lists available at SciVerse ScienceDirect
Expert Systems with Applications
journal homepage: www.elsevier .com/locate /eswa
Towards an ontology modeling tool. A validation in software engineering scenarios
Francisco José García-Peñalvo a, Ricardo Colomo-Palacios b,⇑, Juan García a, Roberto Therón a
a Universidad de Salamanca, Spainb Universidad Carlos III de Madrid, Spain
a r t i c l e i n f o
Keywords:OWLOntologiesKnowledge engineeringVisual analyticsSoftware engineering
0957-4174/$ - see front matter � 2012 Elsevier Ltd. Ahttp://dx.doi.org/10.1016/j.eswa.2012.04.009
⇑ Corresponding author.E-mail address: [email protected] (R. Colom
a b s t r a c t
Ontology creation and management related processes are very important to define and develop semanticservices. Ontology Engineering is the research field that provides the mechanisms to manage the life cycleof the ontologies. However, the process of building ontologies can be tedious and sometimes exhaustive.OWL-VisMod is a tool designed for developing ontological engineering based on visual analytics concep-tual modeling for OWL ontologies life cycle management, supporting both creation and understandingtasks. This paper is devoted to evaluate OWL-VisMod through a set of defined tasks. The same tasks alsowill be done with the most known tool in Ontology Engineering, Protégé, in order to compare theobtained results and be able to know how is OWL-VisMod perceived for the expert users. The comparisonshows that both tools have similar acceptation scores, but OWL-VisMod presents better feelings regard-ing user’s perception tasks due to the visual analytics influence.
� 2012 Elsevier Ltd. All rights reserved.
1. Introduction within the company, while there are already several offers of ven-
Semantic technologies are one of the fastest developing fieldswithin the Information and Communication Technology sectorand, as such, under constant examination by scientists and IT pro-fessionals (Janev & Vranes, 2011). Semantic, from the Greek‘‘semantikos’’, involves giving significance or meaning to wordsor symbols, enabling distinctions between the meanings of differ-ent words or symbols. Semantic technologies are based on ontolo-gies (Fensel, 2002). Ontology formalizes knowledge meaning andfacilitates the search for contents and information (Jiang & Tan,2009). The main objective of ontologies is to establish ontologicalagreements, which serve as the basis for communication betweeneither human or software agents, hence, reducing language ambi-guity and knowledge differences between agents, which may leadto errors, misunderstandings and inefficiencies (Blanco, Lasheras,Fernández-Medina, Valencia-García, & Toval, 2011).
Now, semantic technology research relies on a number of keymethodologies such as knowledge representation languages orreasoning algorithms (Hitzler & Janowicz, 2011). The applicationof ontologies for expressing semantics of data does not restrictany longer exclusively on semantic web or semantic web services(Vrba, Radakovic, Obitko, & Marík, 2011).
According to Breslin, O’Sullivan, Passant, and Vasiliu (2010),industry has begun to watch developments with interest and anumber of large companies have started to experiment withSemantic technologies to ascertain if these new technologies canbe leveraged to add more value for their customers or internally
ll rights reserved.
o-Palacios).
dors of Semantic solutions on the market. Due to this expansionseveral fields has been affected by semantics and many solutionsand initiatives have been developed. Software Engineering is oneof them. As a result of this there are many initiatives reported inthe literature that employ semantic technologies in aspects likerequirements (Chicaiza, Lopez, Piedra, Martinez, & Tovar, 2010),analysis (Tappolet, Kiefer, & Bernstein, 2010, modeling (Gallardo,Molina, Bravo, Redondo, & Collazos, 2011; Martinho, Varajao, &Domingos, 2010; Sicilia, Sicilia, Sánchez-Alonso, García-Barrioca-nal, & Pontikaki, 2009), teaming (Soto-Acosta, Casado-Lumbreras,& Cabezas-Isla, 2010; Valencia-García, García-Sánchez,Castellanos-Nieves, Fernández-Breis, & Toval, 2010), cooperativebuilding (Tacla, Freddo, Paraiso, Ramos, & Sato, 2011), softwaremetrics (García-Crespo, Colomo-Palacios, Gómez-Berbís, & Mencke,2009), reuse (Shiva & Shala, 2008) or quality management (Garcíaet al., 2010) to cite some of the most relevant and recent cases.
Ontologies represent one of the most common representationsof the semantic technologies (García-Peñalvo, García, & Therón,2011). There is a research field called Ontology Engineering, whichprovides the mechanisms to manage the life cycle of them. TheOntology Engineering has been described as an investigation meth-odology that provides the rational design of a knowledge base(Mizoguchi, 2004). It also provides the principles for the set ofactivities and processes that cover the life cycle of ontologies.The main of these processes are the creation, management, analy-sis and reuse of ontologies.
As well as the processes, the Ontology Engineering also coversother aspects such as metrics, methodologies and the diverse toolsfor creating, editing and visualizing ontologies. Most of theseontology editors and tools are based on the use of simple visualiza-
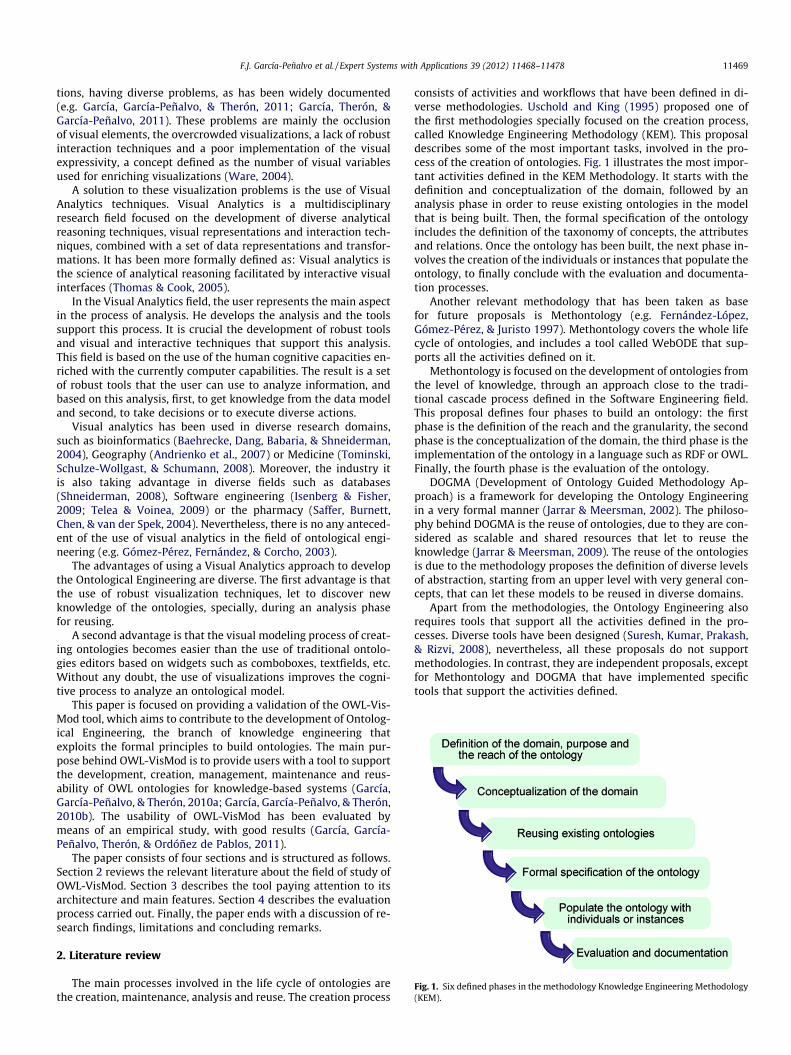
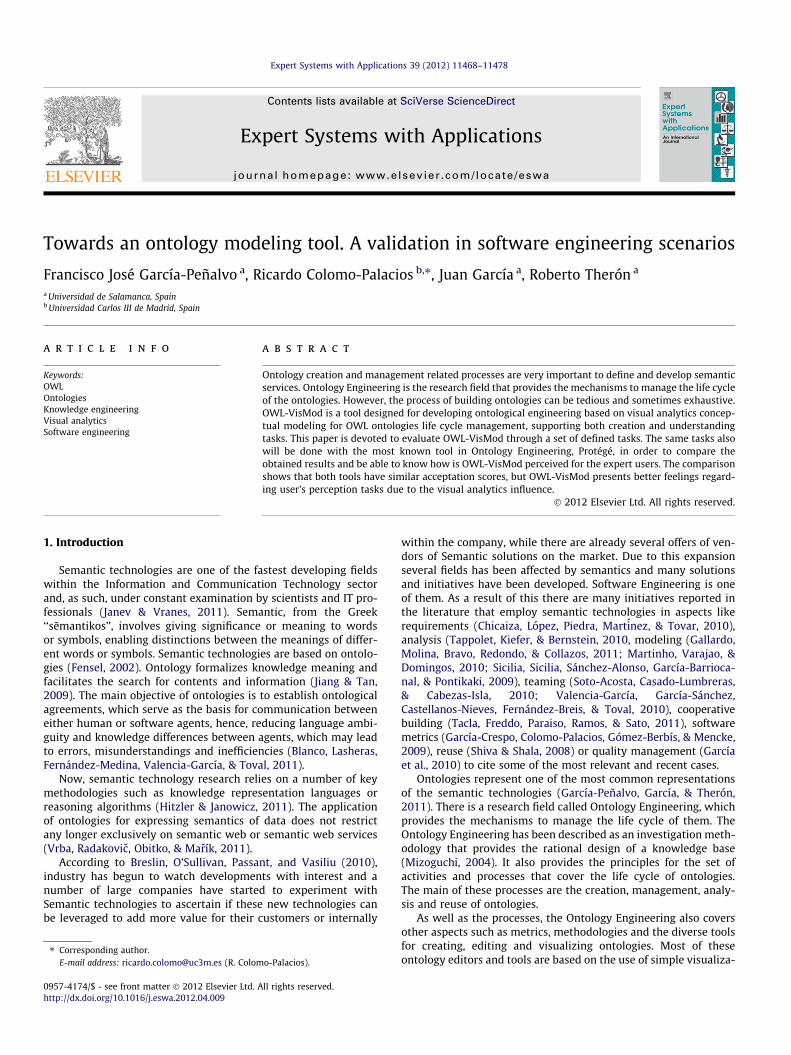
Fig. 1. Six defined phases in the methodology Knowledge Engineering Methodology(KEM).
F.J. García-Peñalvo et al. / Expert Systems with Applications 39 (2012) 11468–11478 11469
tions, having diverse problems, as has been widely documented(e.g. García, García-Peñalvo, & Therón, 2011; García, Therón, &García-Peñalvo, 2011). These problems are mainly the occlusionof visual elements, the overcrowded visualizations, a lack of robustinteraction techniques and a poor implementation of the visualexpressivity, a concept defined as the number of visual variablesused for enriching visualizations (Ware, 2004).
A solution to these visualization problems is the use of VisualAnalytics techniques. Visual Analytics is a multidisciplinaryresearch field focused on the development of diverse analyticalreasoning techniques, visual representations and interaction tech-niques, combined with a set of data representations and transfor-mations. It has been more formally defined as: Visual analytics isthe science of analytical reasoning facilitated by interactive visualinterfaces (Thomas & Cook, 2005).
In the Visual Analytics field, the user represents the main aspectin the process of analysis. He develops the analysis and the toolssupport this process. It is crucial the development of robust toolsand visual and interactive techniques that support this analysis.This field is based on the use of the human cognitive capacities en-riched with the currently computer capabilities. The result is a setof robust tools that the user can use to analyze information, andbased on this analysis, first, to get knowledge from the data modeland second, to take decisions or to execute diverse actions.
Visual analytics has been used in diverse research domains,such as bioinformatics (Baehrecke, Dang, Babaria, & Shneiderman,2004), Geography (Andrienko et al., 2007) or Medicine (Tominski,Schulze-Wollgast, & Schumann, 2008). Moreover, the industry itis also taking advantage in diverse fields such as databases(Shneiderman, 2008), Software engineering (Isenberg & Fisher,2009; Telea & Voinea, 2009) or the pharmacy (Saffer, Burnett,Chen, & van der Spek, 2004). Nevertheless, there is no any anteced-ent of the use of visual analytics in the field of ontological engi-neering (e.g. Gómez-Pérez, Fernández, & Corcho, 2003).
The advantages of using a Visual Analytics approach to developthe Ontological Engineering are diverse. The first advantage is thatthe use of robust visualization techniques, let to discover newknowledge of the ontologies, specially, during an analysis phasefor reusing.
A second advantage is that the visual modeling process of creat-ing ontologies becomes easier than the use of traditional ontolo-gies editors based on widgets such as comboboxes, textfields, etc.Without any doubt, the use of visualizations improves the cogni-tive process to analyze an ontological model.
This paper is focused on providing a validation of the OWL-Vis-Mod tool, which aims to contribute to the development of Ontolog-ical Engineering, the branch of knowledge engineering thatexploits the formal principles to build ontologies. The main pur-pose behind OWL-VisMod is to provide users with a tool to supportthe development, creation, management, maintenance and reus-ability of OWL ontologies for knowledge-based systems (García,García-Peñalvo, & Therón, 2010a; García, García-Peñalvo, & Therón,2010b). The usability of OWL-VisMod has been evaluated bymeans of an empirical study, with good results (García, García-Peñalvo, Therón, & Ordóñez de Pablos, 2011).
The paper consists of four sections and is structured as follows.Section 2 reviews the relevant literature about the field of study ofOWL-VisMod. Section 3 describes the tool paying attention to itsarchitecture and main features. Section 4 describes the evaluationprocess carried out. Finally, the paper ends with a discussion of re-search findings, limitations and concluding remarks.
2. Literature review
The main processes involved in the life cycle of ontologies arethe creation, maintenance, analysis and reuse. The creation process
consists of activities and workflows that have been defined in di-verse methodologies. Uschold and King (1995) proposed one ofthe first methodologies specially focused on the creation process,called Knowledge Engineering Methodology (KEM). This proposaldescribes some of the most important tasks, involved in the pro-cess of the creation of ontologies. Fig. 1 illustrates the most impor-tant activities defined in the KEM Methodology. It starts with thedefinition and conceptualization of the domain, followed by ananalysis phase in order to reuse existing ontologies in the modelthat is being built. Then, the formal specification of the ontologyincludes the definition of the taxonomy of concepts, the attributesand relations. Once the ontology has been built, the next phase in-volves the creation of the individuals or instances that populate theontology, to finally conclude with the evaluation and documenta-tion processes.
Another relevant methodology that has been taken as basefor future proposals is Methontology (e.g. Fernández-López,Gómez-Pérez, & Juristo 1997). Methontology covers the whole lifecycle of ontologies, and includes a tool called WebODE that sup-ports all the activities defined on it.
Methontology is focused on the development of ontologies fromthe level of knowledge, through an approach close to the tradi-tional cascade process defined in the Software Engineering field.This proposal defines four phases to build an ontology: the firstphase is the definition of the reach and the granularity, the secondphase is the conceptualization of the domain, the third phase is theimplementation of the ontology in a language such as RDF or OWL.Finally, the fourth phase is the evaluation of the ontology.
DOGMA (Development of Ontology Guided Methodology Ap-proach) is a framework for developing the Ontology Engineeringin a very formal manner (Jarrar & Meersman, 2002). The philoso-phy behind DOGMA is the reuse of ontologies, due to they are con-sidered as scalable and shared resources that let to reuse theknowledge (Jarrar & Meersman, 2009). The reuse of the ontologiesis due to the methodology proposes the definition of diverse levelsof abstraction, starting from an upper level with very general con-cepts, that can let these models to be reused in diverse domains.
Apart from the methodologies, the Ontology Engineering alsorequires tools that support all the activities defined in the pro-cesses. Diverse tools have been designed (Suresh, Kumar, Prakash,& Rizvi, 2008), nevertheless, all these proposals do not supportmethodologies. In contrast, they are independent proposals, exceptfor Methontology and DOGMA that have implemented specifictools that support the activities defined.
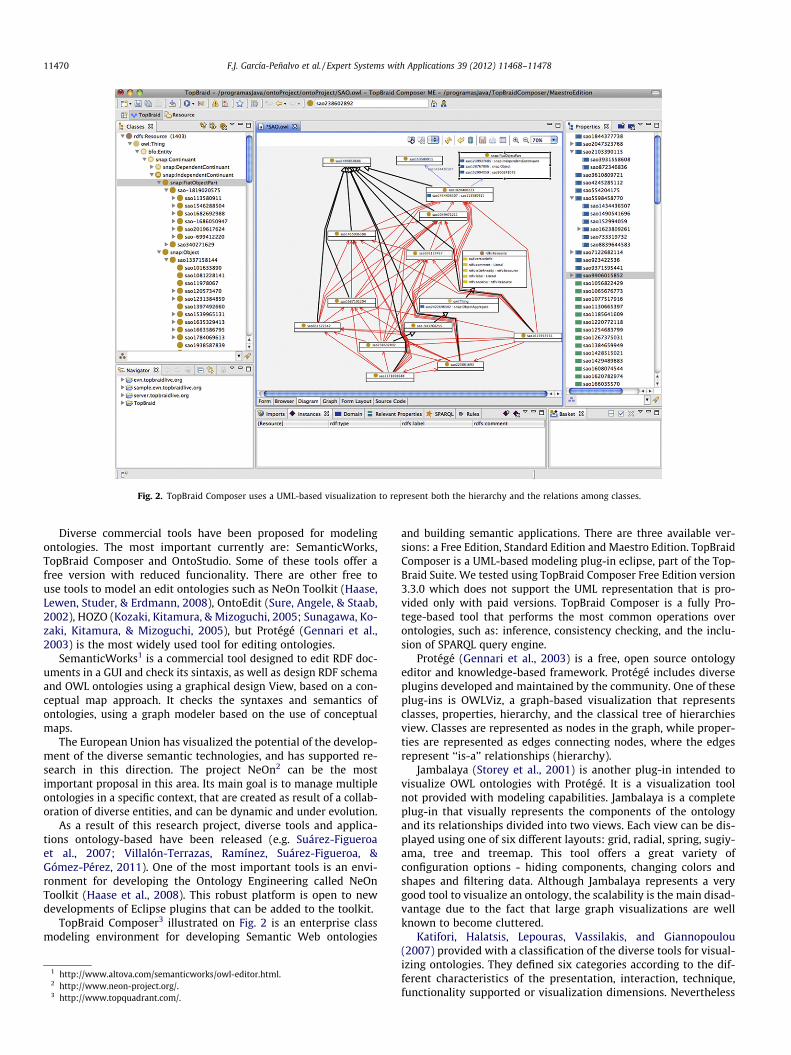
Fig. 2. TopBraid Composer uses a UML-based visualization to represent both the hierarchy and the relations among classes.
11470 F.J. García-Peñalvo et al. / Expert Systems with Applications 39 (2012) 11468–11478
Diverse commercial tools have been proposed for modelingontologies. The most important currently are: SemanticWorks,TopBraid Composer and OntoStudio. Some of these tools offer afree version with reduced funcionality. There are other free touse tools to model an edit ontologies such as NeOn Toolkit (Haase,Lewen, Studer, & Erdmann, 2008), OntoEdit (Sure, Angele, & Staab,2002), HOZO (Kozaki, Kitamura, & Mizoguchi, 2005; Sunagawa, Ko-zaki, Kitamura, & Mizoguchi, 2005), but Protégé (Gennari et al.,2003) is the most widely used tool for editing ontologies.
SemanticWorks1 is a commercial tool designed to edit RDF doc-uments in a GUI and check its sintaxis, as well as design RDF schemaand OWL ontologies using a graphical design View, based on a con-ceptual map approach. It checks the syntaxes and semantics ofontologies, using a graph modeler based on the use of conceptualmaps.
The European Union has visualized the potential of the develop-ment of the diverse semantic technologies, and has supported re-search in this direction. The project NeOn2 can be the mostimportant proposal in this area. Its main goal is to manage multipleontologies in a specific context, that are created as result of a collab-oration of diverse entities, and can be dynamic and under evolution.
As a result of this research project, diverse tools and applica-tions ontology-based have been released (e.g. Suárez-Figueroaet al., 2007; Villalón-Terrazas, Ramínez, Suárez-Figueroa, &Gómez-Pérez, 2011). One of the most important tools is an envi-ronment for developing the Ontology Engineering called NeOnToolkit (Haase et al., 2008). This robust platform is open to newdevelopments of Eclipse plugins that can be added to the toolkit.
TopBraid Composer3 illustrated on Fig. 2 is an enterprise classmodeling environment for developing Semantic Web ontologies
1 http://www.altova.com/semanticworks/owl-editor.html.2 http://www.neon-project.org/.3 http://www.topquadrant.com/.
and building semantic applications. There are three available ver-sions: a Free Edition, Standard Edition and Maestro Edition. TopBraidComposer is a UML-based modeling plug-in eclipse, part of the Top-Braid Suite. We tested using TopBraid Composer Free Edition version3.3.0 which does not support the UML representation that is pro-vided only with paid versions. TopBraid Composer is a fully Pro-tege-based tool that performs the most common operations overontologies, such as: inference, consistency checking, and the inclu-sion of SPARQL query engine.
Protégé (Gennari et al., 2003) is a free, open source ontologyeditor and knowledge-based framework. Protégé includes diverseplugins developed and maintained by the community. One of theseplug-ins is OWLViz, a graph-based visualization that representsclasses, properties, hierarchy, and the classical tree of hierarchiesview. Classes are represented as nodes in the graph, while proper-ties are represented as edges connecting nodes, where the edgesrepresent ‘‘is-a’’ relationships (hierarchy).
Jambalaya (Storey et al., 2001) is another plug-in intended tovisualize OWL ontologies with Protégé. It is a visualization toolnot provided with modeling capabilities. Jambalaya is a completeplug-in that visually represents the components of the ontologyand its relationships divided into two views. Each view can be dis-played using one of six different layouts: grid, radial, spring, sugiy-ama, tree and treemap. This tool offers a great variety ofconfiguration options - hiding components, changing colors andshapes and filtering data. Although Jambalaya represents a verygood tool to visualize an ontology, the scalability is the main disad-vantage due to the fact that large graph visualizations are wellknown to become cluttered.
Katifori, Halatsis, Lepouras, Vassilakis, and Giannopoulou(2007) provided with a classification of the diverse tools for visual-izing ontologies. They defined six categories according to the dif-ferent characteristics of the presentation, interaction, technique,functionality supported or visualization dimensions. Nevertheless
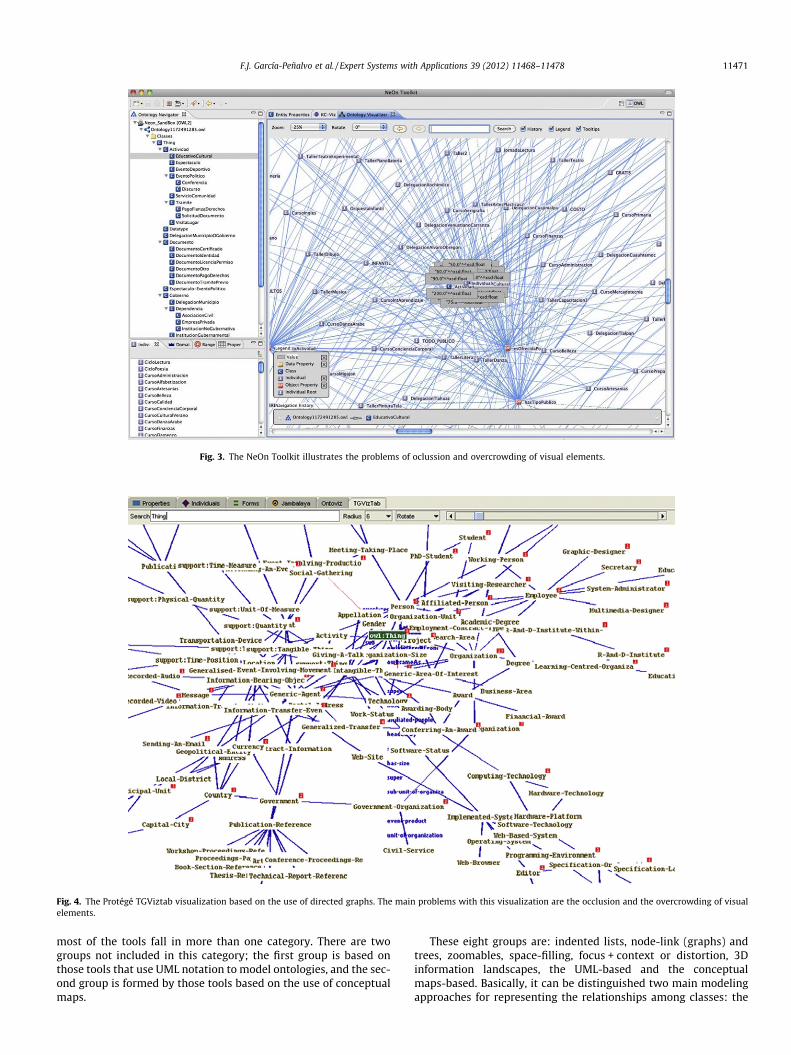
Fig. 3. The NeOn Toolkit illustrates the problems of oclussion and overcrowding of visual elements.
Fig. 4. The Protégé TGViztab visualization based on the use of directed graphs. The main problems with this visualization are the occlusion and the overcrowding of visualelements.
F.J. García-Peñalvo et al. / Expert Systems with Applications 39 (2012) 11468–11478 11471
most of the tools fall in more than one category. There are twogroups not included in this category; the first group is based onthose tools that use UML notation to model ontologies, and the sec-ond group is formed by those tools based on the use of conceptualmaps.
These eight groups are: indented lists, node-link (graphs) andtrees, zoomables, space-filling, focus + context or distortion, 3Dinformation landscapes, the UML-based and the conceptualmaps-based. Basically, it can be distinguished two main modelingapproaches for representing the relationships among classes: the
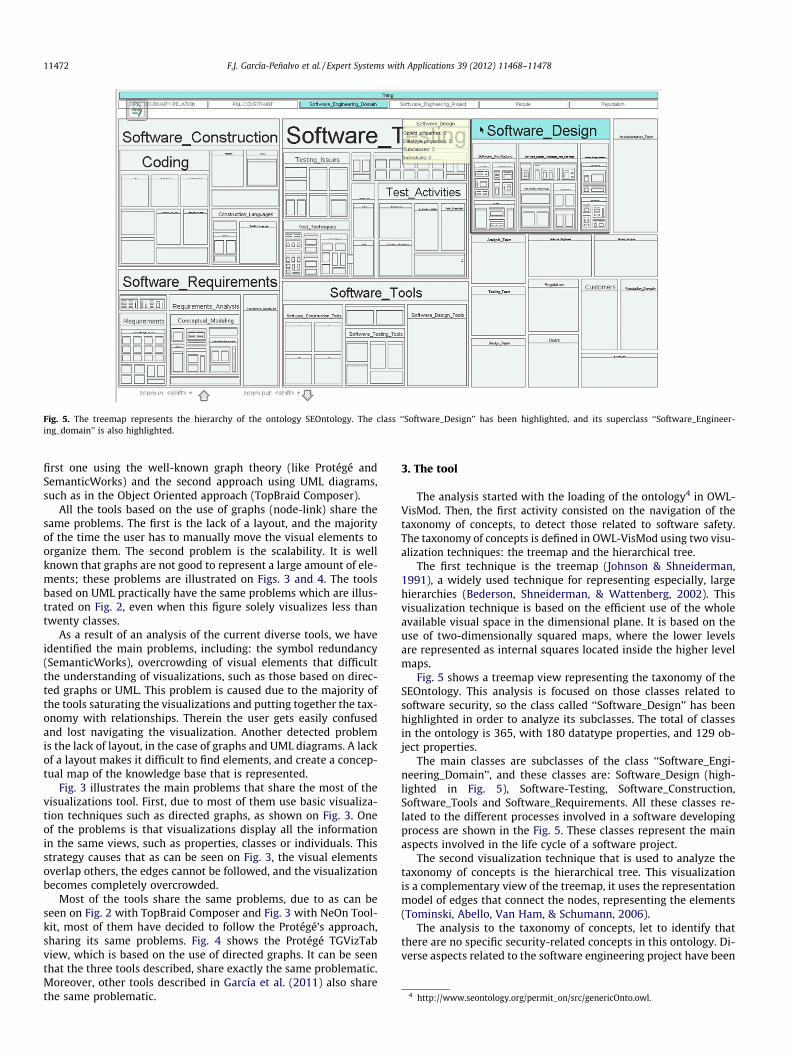
Fig. 5. The treemap represents the hierarchy of the ontology SEOntology. The class ‘‘Software_Design’’ has been highlighted, and its superclass ‘‘Software_Engineer-ing_domain’’ is also highlighted.
4 http://www.seontology.org/permit_on/src/genericOnto.owl.
11472 F.J. García-Peñalvo et al. / Expert Systems with Applications 39 (2012) 11468–11478
first one using the well-known graph theory (like Protégé andSemanticWorks) and the second approach using UML diagrams,such as in the Object Oriented approach (TopBraid Composer).
All the tools based on the use of graphs (node-link) share thesame problems. The first is the lack of a layout, and the majorityof the time the user has to manually move the visual elements toorganize them. The second problem is the scalability. It is wellknown that graphs are not good to represent a large amount of ele-ments; these problems are illustrated on Figs. 3 and 4. The toolsbased on UML practically have the same problems which are illus-trated on Fig. 2, even when this figure solely visualizes less thantwenty classes.
As a result of an analysis of the current diverse tools, we haveidentified the main problems, including: the symbol redundancy(SemanticWorks), overcrowding of visual elements that difficultthe understanding of visualizations, such as those based on direc-ted graphs or UML. This problem is caused due to the majority ofthe tools saturating the visualizations and putting together the tax-onomy with relationships. Therein the user gets easily confusedand lost navigating the visualization. Another detected problemis the lack of layout, in the case of graphs and UML diagrams. A lackof a layout makes it difficult to find elements, and create a concep-tual map of the knowledge base that is represented.
Fig. 3 illustrates the main problems that share the most of thevisualizations tool. First, due to most of them use basic visualiza-tion techniques such as directed graphs, as shown on Fig. 3. Oneof the problems is that visualizations display all the informationin the same views, such as properties, classes or individuals. Thisstrategy causes that as can be seen on Fig. 3, the visual elementsoverlap others, the edges cannot be followed, and the visualizationbecomes completely overcrowded.
Most of the tools share the same problems, due to as can beseen on Fig. 2 with TopBraid Composer and Fig. 3 with NeOn Tool-kit, most of them have decided to follow the Protégé’s approach,sharing its same problems. Fig. 4 shows the Protégé TGVizTabview, which is based on the use of directed graphs. It can be seenthat the three tools described, share exactly the same problematic.Moreover, other tools described in García et al. (2011) also sharethe same problematic.
3. The tool
The analysis started with the loading of the ontology4 in OWL-VisMod. Then, the first activity consisted on the navigation of thetaxonomy of concepts, to detect those related to software safety.The taxonomy of concepts is defined in OWL-VisMod using two visu-alization techniques: the treemap and the hierarchical tree.
The first technique is the treemap (Johnson & Shneiderman,1991), a widely used technique for representing especially, largehierarchies (Bederson, Shneiderman, & Wattenberg, 2002). Thisvisualization technique is based on the efficient use of the wholeavailable visual space in the dimensional plane. It is based on theuse of two-dimensionally squared maps, where the lower levelsare represented as internal squares located inside the higher levelmaps.
Fig. 5 shows a treemap view representing the taxonomy of theSEOntology. This analysis is focused on those classes related tosoftware security, so the class called ‘‘Software_Design’’ has beenhighlighted in order to analyze its subclasses. The total of classesin the ontology is 365, with 180 datatype properties, and 129 ob-ject properties.
The main classes are subclasses of the class ‘‘Software_Engi-neering_Domain’’, and these classes are: Software_Design (high-lighted in Fig. 5), Software-Testing, Software_Construction,Software_Tools and Software_Requirements. All these classes re-lated to the different processes involved in a software developingprocess are shown in the Fig. 5. These classes represent the mainaspects involved in the life cycle of a software project.
The second visualization technique that is used to analyze thetaxonomy of concepts is the hierarchical tree. This visualizationis a complementary view of the treemap, it uses the representationmodel of edges that connect the nodes, representing the elements(Tominski, Abello, Van Ham, & Schumann, 2006).
The analysis to the taxonomy of concepts, let to identify thatthere are no specific security-related concepts in this ontology. Di-verse aspects related to the software engineering project have been
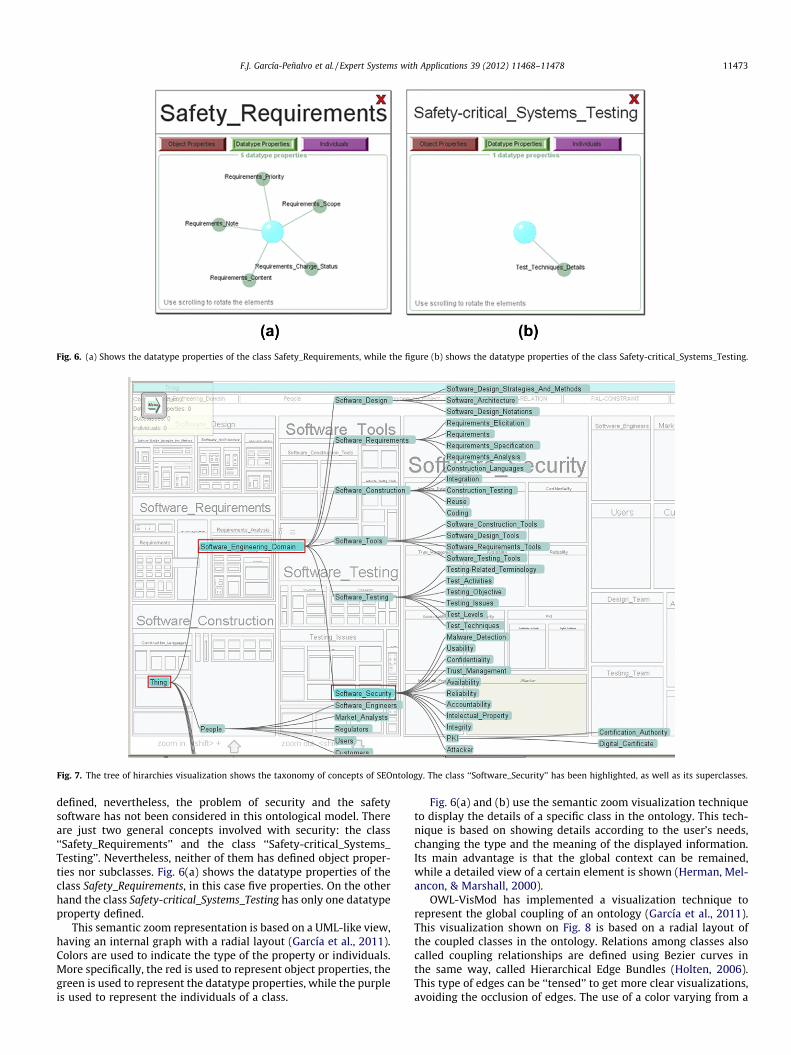
Fig. 6. (a) Shows the datatype properties of the class Safety_Requirements, while the figure (b) shows the datatype properties of the class Safety-critical_Systems_Testing.
Fig. 7. The tree of hirarchies visualization shows the taxonomy of concepts of SEOntology. The class ‘‘Software_Security’’ has been highlighted, as well as its superclasses.
F.J. García-Peñalvo et al. / Expert Systems with Applications 39 (2012) 11468–11478 11473
defined, nevertheless, the problem of security and the safetysoftware has not been considered in this ontological model. Thereare just two general concepts involved with security: the class‘‘Safety_Requirements’’ and the class ‘‘Safety-critical_Systems_Testing’’. Nevertheless, neither of them has defined object proper-ties nor subclasses. Fig. 6(a) shows the datatype properties of theclass Safety_Requirements, in this case five properties. On the otherhand the class Safety-critical_Systems_Testing has only one datatypeproperty defined.
This semantic zoom representation is based on a UML-like view,having an internal graph with a radial layout (García et al., 2011).Colors are used to indicate the type of the property or individuals.More specifically, the red is used to represent object properties, thegreen is used to represent the datatype properties, while the purpleis used to represent the individuals of a class.
Fig. 6(a) and (b) use the semantic zoom visualization techniqueto display the details of a specific class in the ontology. This tech-nique is based on showing details according to the user’s needs,changing the type and the meaning of the displayed information.Its main advantage is that the global context can be remained,while a detailed view of a certain element is shown (Herman, Mel-ancon, & Marshall, 2000).
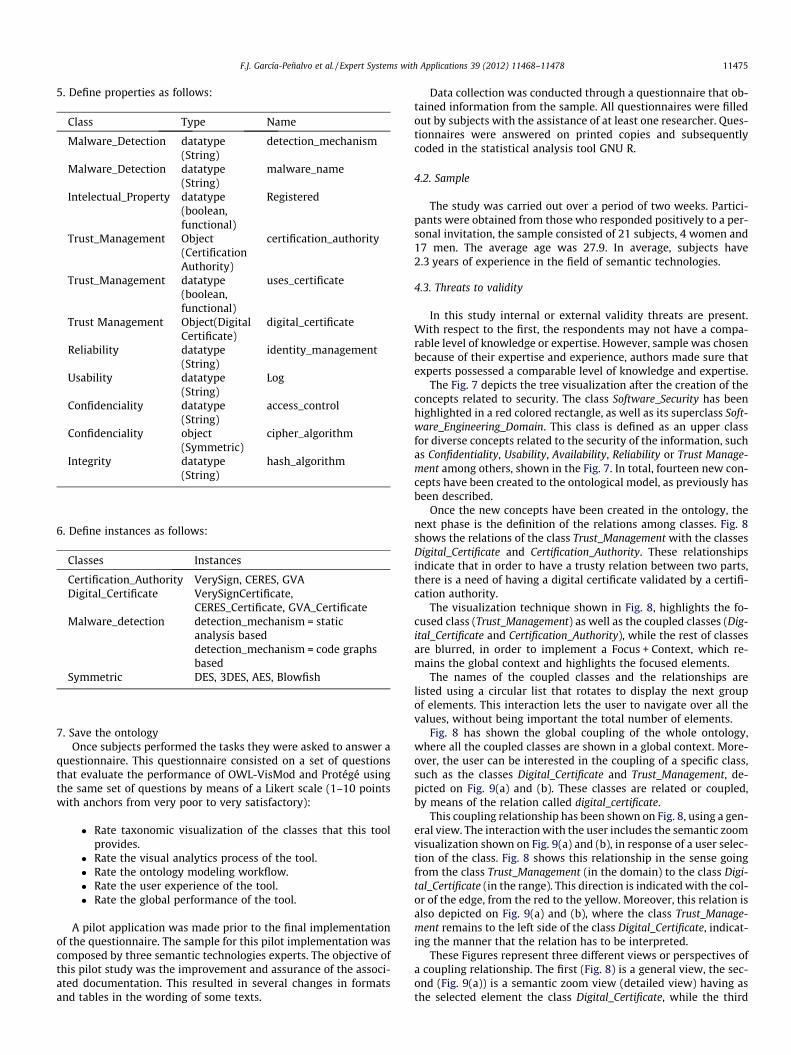
OWL-VisMod has implemented a visualization technique torepresent the global coupling of an ontology (García et al., 2011).This visualization shown on Fig. 8 is based on a radial layout ofthe coupled classes in the ontology. Relations among classes alsocalled coupling relationships are defined using Bezier curves inthe same way, called Hierarchical Edge Bundles (Holten, 2006).This type of edges can be ‘‘tensed’’ to get more clear visualizations,avoiding the occlusion of edges. The use of a color varying from a
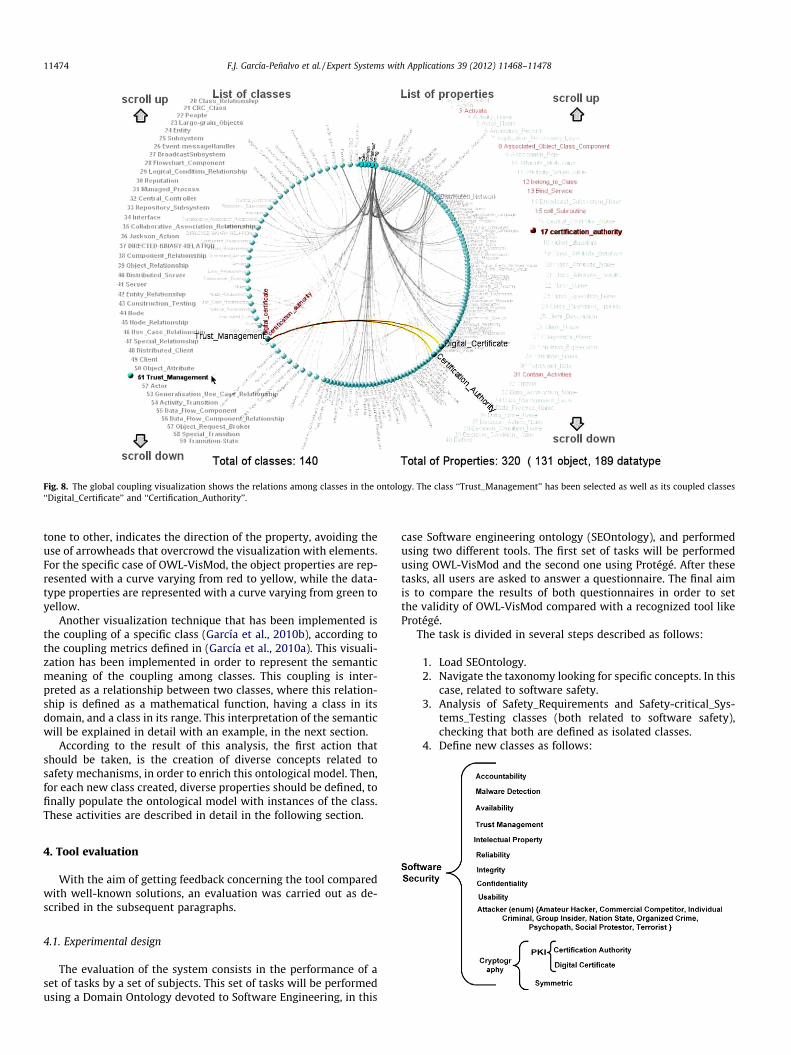
Fig. 8. The global coupling visualization shows the relations among classes in the ontology. The class ‘‘Trust_Management’’ has been selected as well as its coupled classes‘‘Digital_Certificate’’ and ‘‘Certification_Authority’’.
11474 F.J. García-Peñalvo et al. / Expert Systems with Applications 39 (2012) 11468–11478
tone to other, indicates the direction of the property, avoiding theuse of arrowheads that overcrowd the visualization with elements.For the specific case of OWL-VisMod, the object properties are rep-resented with a curve varying from red to yellow, while the data-type properties are represented with a curve varying from green toyellow.
Another visualization technique that has been implemented isthe coupling of a specific class (García et al., 2010b), according tothe coupling metrics defined in (García et al., 2010a). This visuali-zation has been implemented in order to represent the semanticmeaning of the coupling among classes. This coupling is inter-preted as a relationship between two classes, where this relation-ship is defined as a mathematical function, having a class in itsdomain, and a class in its range. This interpretation of the semanticwill be explained in detail with an example, in the next section.
According to the result of this analysis, the first action thatshould be taken, is the creation of diverse concepts related tosafety mechanisms, in order to enrich this ontological model. Then,for each new class created, diverse properties should be defined, tofinally populate the ontological model with instances of the class.These activities are described in detail in the following section.
4. Tool evaluation
With the aim of getting feedback concerning the tool comparedwith well-known solutions, an evaluation was carried out as de-scribed in the subsequent paragraphs.
4.1. Experimental design
The evaluation of the system consists in the performance of aset of tasks by a set of subjects. This set of tasks will be performedusing a Domain Ontology devoted to Software Engineering, in this
case Software engineering ontology (SEOntology), and performedusing two different tools. The first set of tasks will be performedusing OWL-VisMod and the second one using Protégé. After thesetasks, all users are asked to answer a questionnaire. The final aimis to compare the results of both questionnaires in order to setthe validity of OWL-VisMod compared with a recognized tool likeProtégé.
The task is divided in several steps described as follows:
1. Load SEOntology.2. Navigate the taxonomy looking for specific concepts. In this
case, related to software safety.3. Analysis of Safety_Requirements and Safety-critical_Sys-
tems_Testing classes (both related to software safety),checking that both are defined as isolated classes.
4. Define new classes as follows:
F.J. García-Peñalvo et al. / Expert Systems with Applications 39 (2012) 11468–11478 11475
5. Define properties as follows:
Class
Type NameMalware_Detection
datatype(String)detection_mechanism
Malware_Detection
datatype(String)malware_name
Intelectual_Property
datatype(boolean,functional)Registered
Trust_Management
Object(CertificationAuthority)certification_authority
Trust_Management
datatype(boolean,functional)uses_certificate
Trust Management
Object(DigitalCertificate)digital_certificate
Reliability
datatype(String)identity_management
Usability
datatype(String)Log
Confidenciality
datatype(String)access_control
Confidenciality
object(Symmetric)cipher_algorithm
Integrity
datatype(String)hash_algorithm
6. Define instances as follows:
Classes
InstancesCertification_Authority
VerySign, CERES, GVA Digital_Certificate VerySignCertificate,CERES_Certificate, GVA_Certificate
Malware_detection detection_mechanism = staticanalysis baseddetection_mechanism = code graphsbased
Symmetric
DES, 3DES, AES, Blowfish7. Save the ontologyOnce subjects performed the tasks they were asked to answer a
questionnaire. This questionnaire consisted on a set of questionsthat evaluate the performance of OWL-VisMod and Protégé usingthe same set of questions by means of a Likert scale (1–10 pointswith anchors from very poor to very satisfactory):
� Rate taxonomic visualization of the classes that this toolprovides.
� Rate the visual analytics process of the tool.� Rate the ontology modeling workflow.� Rate the user experience of the tool.� Rate the global performance of the tool.
A pilot application was made prior to the final implementationof the questionnaire. The sample for this pilot implementation wascomposed by three semantic technologies experts. The objective ofthis pilot study was the improvement and assurance of the associ-ated documentation. This resulted in several changes in formatsand tables in the wording of some texts.
Data collection was conducted through a questionnaire that ob-tained information from the sample. All questionnaires were filledout by subjects with the assistance of at least one researcher. Ques-tionnaires were answered on printed copies and subsequentlycoded in the statistical analysis tool GNU R.
4.2. Sample
The study was carried out over a period of two weeks. Partici-pants were obtained from those who responded positively to a per-sonal invitation, the sample consisted of 21 subjects, 4 women and17 men. The average age was 27.9. In average, subjects have2.3 years of experience in the field of semantic technologies.
4.3. Threats to validity
In this study internal or external validity threats are present.With respect to the first, the respondents may not have a compa-rable level of knowledge or expertise. However, sample was chosenbecause of their expertise and experience, authors made sure thatexperts possessed a comparable level of knowledge and expertise.
The Fig. 7 depicts the tree visualization after the creation of theconcepts related to security. The class Software_Security has beenhighlighted in a red colored rectangle, as well as its superclass Soft-ware_Engineering_Domain. This class is defined as an upper classfor diverse concepts related to the security of the information, suchas Confidentiality, Usability, Availability, Reliability or Trust Manage-ment among others, shown in the Fig. 7. In total, fourteen new con-cepts have been created to the ontological model, as previously hasbeen described.
Once the new concepts have been created in the ontology, thenext phase is the definition of the relations among classes. Fig. 8shows the relations of the class Trust_Management with the classesDigital_Certificate and Certification_Authority. These relationshipsindicate that in order to have a trusty relation between two parts,there is a need of having a digital certificate validated by a certifi-cation authority.
The visualization technique shown in Fig. 8, highlights the fo-cused class (Trust_Management) as well as the coupled classes (Dig-ital_Certificate and Certification_Authority), while the rest of classesare blurred, in order to implement a Focus + Context, which re-mains the global context and highlights the focused elements.
The names of the coupled classes and the relationships arelisted using a circular list that rotates to display the next groupof elements. This interaction lets the user to navigate over all thevalues, without being important the total number of elements.
Fig. 8 has shown the global coupling of the whole ontology,where all the coupled classes are shown in a global context. More-over, the user can be interested in the coupling of a specific class,such as the classes Digital_Certificate and Trust_Management, de-picted on Fig. 9(a) and (b). These classes are related or coupled,by means of the relation called digital_certificate.
This coupling relationship has been shown on Fig. 8, using a gen-eral view. The interaction with the user includes the semantic zoomvisualization shown on Fig. 9(a) and (b), in response of a user selec-tion of the class. Fig. 8 shows this relationship in the sense goingfrom the class Trust_Management (in the domain) to the class Digi-tal_Certificate (in the range). This direction is indicated with the col-or of the edge, from the red to the yellow. Moreover, this relation isalso depicted on Fig. 9(a) and (b), where the class Trust_Manage-ment remains to the left side of the class Digital_Certificate, indicat-ing the manner that the relation has to be interpreted.
These Figures represent three different views or perspectives ofa coupling relationship. The first (Fig. 8) is a general view, the sec-ond (Fig. 9(a)) is a semantic zoom view (detailed view) having asthe selected element the class Digital_Certificate, while the third
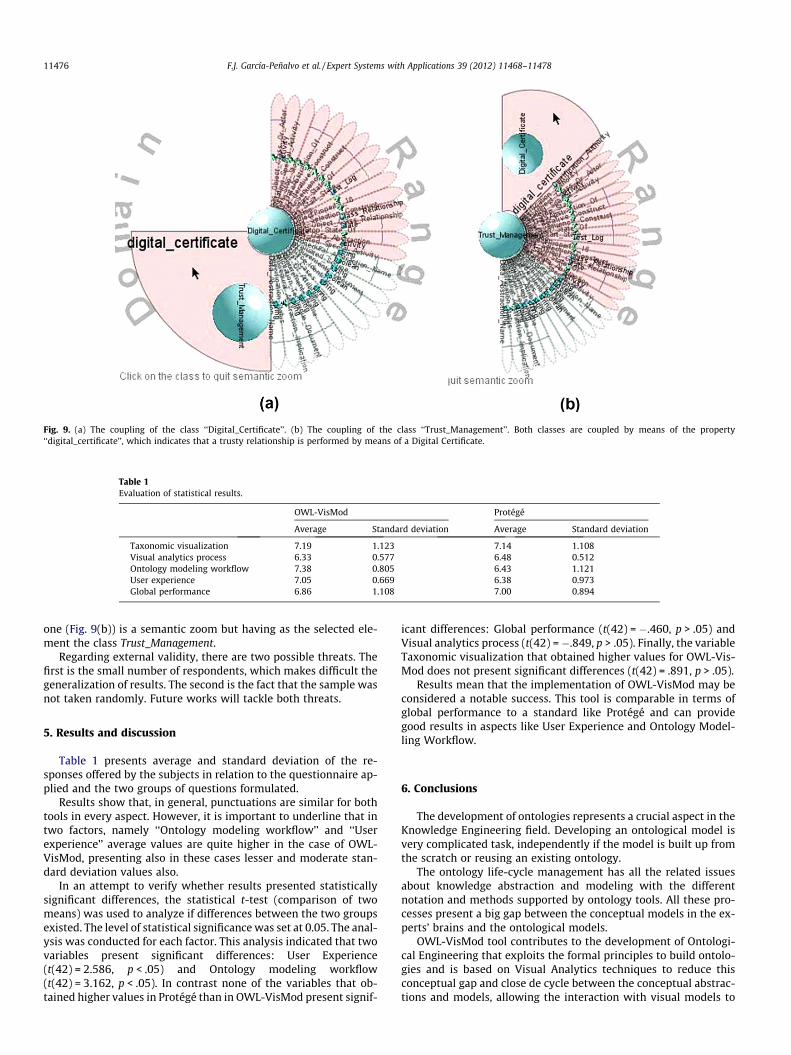
Fig. 9. (a) The coupling of the class ‘‘Digital_Certificate’’. (b) The coupling of the class ‘‘Trust_Management’’. Both classes are coupled by means of the property‘‘digital_certificate’’, which indicates that a trusty relationship is performed by means of a Digital Certificate.
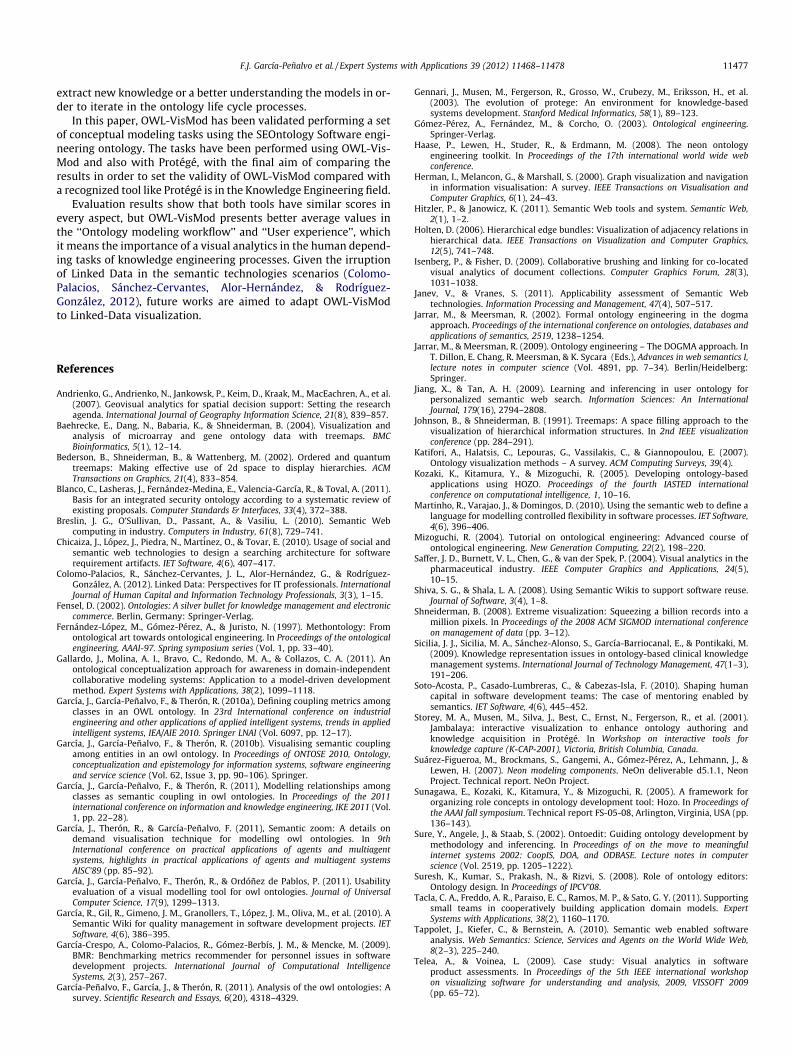
Table 1Evaluation of statistical results.
OWL-VisMod Protégé
Average Standard deviation Average Standard deviation
Taxonomic visualization 7.19 1.123 7.14 1.108Visual analytics process 6.33 0.577 6.48 0.512Ontology modeling workflow 7.38 0.805 6.43 1.121User experience 7.05 0.669 6.38 0.973Global performance 6.86 1.108 7.00 0.894
11476 F.J. García-Peñalvo et al. / Expert Systems with Applications 39 (2012) 11468–11478
one (Fig. 9(b)) is a semantic zoom but having as the selected ele-ment the class Trust_Management.
Regarding external validity, there are two possible threats. Thefirst is the small number of respondents, which makes difficult thegeneralization of results. The second is the fact that the sample wasnot taken randomly. Future works will tackle both threats.
5. Results and discussion
Table 1 presents average and standard deviation of the re-sponses offered by the subjects in relation to the questionnaire ap-plied and the two groups of questions formulated.
Results show that, in general, punctuations are similar for bothtools in every aspect. However, it is important to underline that intwo factors, namely ‘‘Ontology modeling workflow’’ and ‘‘Userexperience’’ average values are quite higher in the case of OWL-VisMod, presenting also in these cases lesser and moderate stan-dard deviation values also.
In an attempt to verify whether results presented statisticallysignificant differences, the statistical t-test (comparison of twomeans) was used to analyze if differences between the two groupsexisted. The level of statistical significance was set at 0.05. The anal-ysis was conducted for each factor. This analysis indicated that twovariables present significant differences: User Experience(t(42) = 2.586, p < .05) and Ontology modeling workflow(t(42) = 3.162, p < .05). In contrast none of the variables that ob-tained higher values in Protégé than in OWL-VisMod present signif-
icant differences: Global performance (t(42) = �.460, p > .05) andVisual analytics process (t(42) = �.849, p > .05). Finally, the variableTaxonomic visualization that obtained higher values for OWL-Vis-Mod does not present significant differences (t(42) = .891, p > .05).
Results mean that the implementation of OWL-VisMod may beconsidered a notable success. This tool is comparable in terms ofglobal performance to a standard like Protégé and can providegood results in aspects like User Experience and Ontology Model-ling Workflow.
6. Conclusions
The development of ontologies represents a crucial aspect in theKnowledge Engineering field. Developing an ontological model isvery complicated task, independently if the model is built up fromthe scratch or reusing an existing ontology.
The ontology life-cycle management has all the related issuesabout knowledge abstraction and modeling with the differentnotation and methods supported by ontology tools. All these pro-cesses present a big gap between the conceptual models in the ex-perts’ brains and the ontological models.
OWL-VisMod tool contributes to the development of Ontologi-cal Engineering that exploits the formal principles to build ontolo-gies and is based on Visual Analytics techniques to reduce thisconceptual gap and close de cycle between the conceptual abstrac-tions and models, allowing the interaction with visual models to
F.J. García-Peñalvo et al. / Expert Systems with Applications 39 (2012) 11468–11478 11477
extract new knowledge or a better understanding the models in or-der to iterate in the ontology life cycle processes.
In this paper, OWL-VisMod has been validated performing a setof conceptual modeling tasks using the SEOntology Software engi-neering ontology. The tasks have been performed using OWL-Vis-Mod and also with Protégé, with the final aim of comparing theresults in order to set the validity of OWL-VisMod compared witha recognized tool like Protégé is in the Knowledge Engineering field.
Evaluation results show that both tools have similar scores inevery aspect, but OWL-VisMod presents better average values inthe ‘‘Ontology modeling workflow’’ and ‘‘User experience’’, whichit means the importance of a visual analytics in the human depend-ing tasks of knowledge engineering processes. Given the irruptionof Linked Data in the semantic technologies scenarios (Colomo-Palacios, Sánchez-Cervantes, Alor-Hernández, & Rodríguez-González, 2012), future works are aimed to adapt OWL-VisModto Linked-Data visualization.
References
Andrienko, G., Andrienko, N., Jankowsk, P., Keim, D., Kraak, M., MacEachren, A., et al.(2007). Geovisual analytics for spatial decision support: Setting the researchagenda. International Journal of Geography Information Science, 21(8), 839–857.
Baehrecke, E., Dang, N., Babaria, K., & Shneiderman, B. (2004). Visualization andanalysis of microarray and gene ontology data with treemaps. BMCBioinformatics, 5(1), 12–14.
Bederson, B., Shneiderman, B., & Wattenberg, M. (2002). Ordered and quantumtreemaps: Making effective use of 2d space to display hierarchies. ACMTransactions on Graphics, 21(4), 833–854.
Blanco, C., Lasheras, J., Fernández-Medina, E., Valencia-García, R., & Toval, A. (2011).Basis for an integrated security ontology according to a systematic review ofexisting proposals. Computer Standards & Interfaces, 33(4), 372–388.
Breslin, J. G., O’Sullivan, D., Passant, A., & Vasiliu, L. (2010). Semantic Webcomputing in industry. Computers in Industry, 61(8), 729–741.
Chicaiza, J., Lopez, J., Piedra, N., Martinez, O., & Tovar, E. (2010). Usage of social andsemantic web technologies to design a searching architecture for softwarerequirement artifacts. IET Software, 4(6), 407–417.
Colomo-Palacios, R., Sánchez-Cervantes, J. L., Alor-Hernández, G., & Rodríguez-González, A. (2012). Linked Data: Perspectives for IT professionals. InternationalJournal of Human Capital and Information Technology Professionals, 3(3), 1–15.
Fensel, D. (2002). Ontologies: A silver bullet for knowledge management and electroniccommerce. Berlin, Germany: Springer-Verlag.
Fernández-López, M., Gómez-Pérez, A., & Juristo, N. (1997). Methontology: Fromontological art towards ontological engineering. In Proceedings of the ontologicalengineering, AAAI-97. Spring symposium series (Vol. 1, pp. 33–40).
Gallardo, J., Molina, A. I., Bravo, C., Redondo, M. A., & Collazos, C. A. (2011). Anontological conceptualization approach for awareness in domain-independentcollaborative modeling systems: Application to a model-driven developmentmethod. Expert Systems with Applications, 38(2), 1099–1118.
García, J., García-Peñalvo, F., & Therón, R. (2010a), Defining coupling metrics amongclasses in an OWL ontology. In 23rd International conference on industrialengineering and other applications of applied intelligent systems, trends in appliedintelligent systems, IEA/AIE 2010. Springer LNAI (Vol. 6097, pp. 12–17).
García, J., García-Peñalvo, F., & Therón, R. (2010b). Visualising semantic couplingamong entities in an owl ontology. In Proceedings of ONTOSE 2010, Ontology,conceptualization and epistemology for information systems, software engineeringand service science (Vol. 62, Issue 3, pp. 90–106). Springer.
García, J., García-Peñalvo, F., & Therón, R. (2011), Modelling relationships amongclasses as semantic coupling in owl ontologies. In Proceedings of the 2011international conference on information and knowledge engineering, IKE 2011 (Vol.1, pp. 22–28).
García, J., Therón, R., & García-Peñalvo, F. (2011), Semantic zoom: A details ondemand visualisation technique for modelling owl ontologies. In 9thInternational conference on practical applications of agents and multiagentsystems, highlights in practical applications of agents and multiagent systemsAISC’89 (pp. 85–92).
García, J., García-Peñalvo, F., Therón, R., & Ordóñez de Pablos, P. (2011). Usabilityevaluation of a visual modelling tool for owl ontologies. Journal of UniversalComputer Science, 17(9), 1299–1313.
García, R., Gil, R., Gimeno, J. M., Granollers, T., López, J. M., Oliva, M., et al. (2010). ASemantic Wiki for quality management in software development projects. IETSoftware, 4(6), 386–395.
García-Crespo, A., Colomo-Palacios, R., Gómez-Berbís, J. M., & Mencke, M. (2009).BMR: Benchmarking metrics recommender for personnel issues in softwaredevelopment projects. International Journal of Computational IntelligenceSystems, 2(3), 257–267.
García-Peñalvo, F., García, J., & Therón, R. (2011). Analysis of the owl ontologies: Asurvey. Scientific Research and Essays, 6(20), 4318–4329.
Gennari, J., Musen, M., Fergerson, R., Grosso, W., Crubezy, M., Eriksson, H., et al.(2003). The evolution of protege: An environment for knowledge-basedsystems development. Stanford Medical Informatics, 58(1), 89–123.
Gómez-Pérez, A., Fernández, M., & Corcho, O. (2003). Ontological engineering.Springer-Verlag.
Haase, P., Lewen, H., Studer, R., & Erdmann, M. (2008). The neon ontologyengineering toolkit. In Proceedings of the 17th international world wide webconference.
Herman, I., Melancon, G., & Marshall, S. (2000). Graph visualization and navigationin information visualisation: A survey. IEEE Transactions on Visualisation andComputer Graphics, 6(1), 24–43.
Hitzler, P., & Janowicz, K. (2011). Semantic Web tools and system. Semantic Web,2(1), 1–2.
Holten, D. (2006). Hierarchical edge bundles: Visualization of adjacency relations inhierarchical data. IEEE Transactions on Visualization and Computer Graphics,12(5), 741–748.
Isenberg, P., & Fisher, D. (2009). Collaborative brushing and linking for co-locatedvisual analytics of document collections. Computer Graphics Forum, 28(3),1031–1038.
Janev, V., & Vranes, S. (2011). Applicability assessment of Semantic Webtechnologies. Information Processing and Management, 47(4), 507–517.
Jarrar, M., & Meersman, R. (2002). Formal ontology engineering in the dogmaapproach. Proceedings of the international conference on ontologies, databases andapplications of semantics, 2519, 1238–1254.
Jarrar, M., & Meersman, R. (2009). Ontology engineering – The DOGMA approach. InT. Dillon, E. Chang, R. Meersman, & K. Sycara (Eds.), Advances in web semantics I,lecture notes in computer science (Vol. 4891, pp. 7–34). Berlin/Heidelberg:Springer.
Jiang, X., & Tan, A. H. (2009). Learning and inferencing in user ontology forpersonalized semantic web search. Information Sciences: An InternationalJournal, 179(16), 2794–2808.
Johnson, B., & Shneiderman, B. (1991). Treemaps: A space filling approach to thevisualization of hierarchical information structures. In 2nd IEEE visualizationconference (pp. 284–291).
Katifori, A., Halatsis, C., Lepouras, G., Vassilakis, C., & Giannopoulou, E. (2007).Ontology visualization methods – A survey. ACM Computing Surveys, 39(4).
Kozaki, K., Kitamura, Y., & Mizoguchi, R. (2005). Developing ontology-basedapplications using HOZO. Proceedings of the fourth IASTED internationalconference on computational intelligence, 1, 10–16.
Martinho, R., Varajao, J., & Domingos, D. (2010). Using the semantic web to define alanguage for modelling controlled flexibility in software processes. IET Software,4(6), 396–406.
Mizoguchi, R. (2004). Tutorial on ontological engineering: Advanced course ofontological engineering. New Generation Computing, 22(2), 198–220.
Saffer, J. D., Burnett, V. L., Chen, G., & van der Spek, P. (2004). Visual analytics in thepharmaceutical industry. IEEE Computer Graphics and Applications, 24(5),10–15.
Shiva, S. G., & Shala, L. A. (2008). Using Semantic Wikis to support software reuse.Journal of Software, 3(4), 1–8.
Shneiderman, B. (2008). Extreme visualization: Squeezing a billion records into amillion pixels. In Proceedings of the 2008 ACM SIGMOD international conferenceon management of data (pp. 3–12).
Sicilia, J. J., Sicilia, M. A., Sánchez-Alonso, S., García-Barriocanal, E., & Pontikaki, M.(2009). Knowledge representation issues in ontology-based clinical knowledgemanagement systems. International Journal of Technology Management, 47(1–3),191–206.
Soto-Acosta, P., Casado-Lumbreras, C., & Cabezas-Isla, F. (2010). Shaping humancapital in software development teams: The case of mentoring enabled bysemantics. IET Software, 4(6), 445–452.
Storey, M. A., Musen, M., Silva, J., Best, C., Ernst, N., Fergerson, R., et al. (2001).Jambalaya: interactive visualization to enhance ontology authoring andknowledge acquisition in Protégé. In Workshop on interactive tools forknowledge capture (K-CAP-2001), Victoria, British Columbia, Canada.
Suárez-Figueroa, M., Brockmans, S., Gangemi, A., Gómez-Pérez, A., Lehmann, J., &Lewen, H. (2007). Neon modeling components. NeOn deliverable d5.1.1, NeonProject. Technical report. NeOn Project.
Sunagawa, E., Kozaki, K., Kitamura, Y., & Mizoguchi, R. (2005). A framework fororganizing role concepts in ontology development tool: Hozo. In Proceedings ofthe AAAI fall symposium. Technical report FS-05-08, Arlington, Virginia, USA (pp.136–143).
Sure, Y., Angele, J., & Staab, S. (2002). Ontoedit: Guiding ontology development bymethodology and inferencing. In Proceedings of on the move to meaningfulinternet systems 2002: CoopIS, DOA, and ODBASE. Lecture notes in computerscience (Vol. 2519, pp. 1205–1222).
Suresh, K., Kumar, S., Prakash, N., & Rizvi, S. (2008). Role of ontology editors:Ontology design. In Proceedings of IPCV’08.
Tacla, C. A., Freddo, A. R., Paraiso, E. C., Ramos, M. P., & Sato, G. Y. (2011). Supportingsmall teams in cooperatively building application domain models. ExpertSystems with Applications, 38(2), 1160–1170.
Tappolet, J., Kiefer, C., & Bernstein, A. (2010). Semantic web enabled softwareanalysis. Web Semantics: Science, Services and Agents on the World Wide Web,8(2–3), 225–240.
Telea, A., & Voinea, L. (2009). Case study: Visual analytics in softwareproduct assessments. In Proceedings of the 5th IEEE international workshopon visualizing software for understanding and analysis, 2009, VISSOFT 2009(pp. 65–72).

11478 F.J. García-Peñalvo et al. / Expert Systems with Applications 39 (2012) 11468–11478
Thomas, J. J., & Cook, K. A. (2005). Illuminating the path: The research and developmentagenda for visual analytics. Los Alamitos, CA: IEEE Press.
Tominski, C., Abello, J., Van Ham, F., & Schumann, H. (2006). Fisheye tree views andlenses for graph visualization. In Proceedings of the international conference oninformation visualization (pp. 17–24).
Tominski, C., Schulze-Wollgast, P., & Schumann, H. (2008). Visual methods foranalyzing human health data. In N. Wickramasinghe & E. Geisler (Eds.).Encyclopedia of healthcare information systems (vol. 1, pp. 1357–1364). Hershey,PA: IGI-Global.
Valencia-García, R., García-Sánchez, F., Castellanos-Nieves, D., Fernández-Breis, J. T.,& Toval, A. (2010). Exploitation of social semantic technology for softwaredevelopment team configuration. Software, IET, 4(6), 373–385.
Vrba, P., Radakovic, M., Obitko, M., & Marík, V. (2011). Semantic technologies: Latestadvances in agent-based manufacturing control systems. International Journal ofProduction Research, 49(5), 1483–1496.
Uschold, M., & King, M. (1995). Towards a methodology for building ontologies. InProceedings of workshop on basic ontological issues in knowledge sharing (Vol. 1,pp. 1–15).
Villalón-Terrazas, B., Ramínez, J., Suárez-Figueroa, M. C., & Gómez-Pérez, A. (2011).A network of ontology networks for building e-employment advanced systems.Expert Systems with Applications, 38(11), 13612–13624.
Ware, C. (2004). Information visualization: Perception for design. San Francisco, CA:Morgan Kaufmann.