towards an understanding of production costs at australia ... · 13th ausimm underground...
TRANSCRIPT

13th AusIMM Underground Operators’ Conference 2017 Capturing the Opportunities: Communication, Collaboration, Innovation
16-18 October 2017, Gold Coast, Australia
Towards an understanding of production costs at Australia’s underground gold minesSam Ulrich, MAusIMM12
Allan Trench, FAusIMM134
Steffen Hagemann1
1. Centre for Exploration Targeting, The University of Western Australia2. CSA Global, Perth3. Business School, The University of Western Australia4. CRU Group, United Kingdom

Towards an understanding of production costs at Australia’s underground gold mines
Introduction• Reported Mining Costs• History of Studies• Snapshot at 2017 Q2
– Cost Curves, Grade Curves
• Time Series 2014 Q1 to 2017 Q2– Grade v Costs
• Conclusions & Implications
16 Oct 2017AusIMM UG Operators Conference, Gold Coast, AustraliaSlide 2 of 25

Towards an understanding of production costs at Australia’s underground gold mines
Reported Mining Costs
16 Oct 2017AusIMM UG Operators Conference, Gold Coast, AustraliaSlide 3 of 25
13th AusIMM Underground Operators’ Conference 2017 Capturing the Opportunities: Communication, Collaboration, Innovation
16-18 October 2017, Gold Coast, Australia
Towards an understanding of production costs at Australia’s underground gold mines
Reported Mining & Production Costs
• Comparing costs on $/oz basis since at least 1940• Gold Institute – Cash Costs, Total Cash Costs• Brook Hunt – C1, C2, C3• Company Specific – CAS, NCE• World Gold Council – AISC, AIC• By-products v Co-products• Voluntary & Unregulated• Non-GAAPThis study using All-in Sustaining Costs (AISC)
16 Oct 2017AusIMM UG Operators Conference, Gold Coast, AustraliaSlide 4 of 25
“A gold mine is a hole in the ground with a liar standing on top of it.” origin unverified

Towards an understanding of production costs at Australia’s underground gold mines
HistoryStudy Context
16 Oct 2017AusIMM UG Operators Conference, Gold Coast, AustraliaSlide 5 of 25
13th AusIMM Underground Operators’ Conference 2017 Capturing the Opportunities: Communication, Collaboration, Innovation
16-18 October 2017, Gold Coast, Australia

Towards an understanding of production costs at Australia’s underground gold mines
A Really Brief History
16 Oct 2017AusIMM UG Operators Conference, Gold Coast, AustraliaSlide 6 of 25
Initial study by Kanakis (2014) on 2013 Q4 data for all Australian and New Zealand gold mines showed there are linkages between costs and geology:
• Mineralisation style – distributed v discrete• Mineralisation geometry – planer v cylindrical shoots v equidimensional • Host rock – nothing clear• Refractory mineralisation – important ??? (needs further work)• Grade is king hypothesis – not as simple as it sounds
Initial study weakness: Not big enough
A follow-up study by Ulrich et al. (2016) on 2016 Q1 data confirmed Kanakis finding on grade is king.
Testing the hypothesis grade is king

Towards an understanding of production costs at Australia’s underground gold mines
History cont…
16 Oct 2017AusIMM UG Operators Conference, Gold Coast, AustraliaSlide 7 of 25
Cos
ts ($
A/oz
)
Gold Grade (g/t)
Lower grade = higher cost mines
Higher grade = lower cost mines
The Grade is King Hypothesis
Source: Kanakis 2014

Towards an understanding of production costs at Australia’s underground gold mines
History Cont…
2013 Q4 – Kanakis (2014) 2016 Q1 – Ulrich et al. (2016)
16 Oct 2017AusIMM UG Operators Conference, Gold Coast, AustraliaSlide 8 of 25
0
400
800
1,200
1,600
2,000
0.00 2.00 4.00 6.00 8.00 10.00 12.00
All-i
n Su
stai
ning
Cos
ts ($
A/oz
)
Average Gold Feed Grade (g/t)
OP OperationOP/UG OperationUG Operation
0
400
800
1,200
1,600
2,000
0.00 2.00 4.00 6.00 8.00 10.00 12.00 14.00
All i
n Su
stai
ning
Cos
ts ($
A/oz
)
Average Gold Operating Grade (g/t)
Open PitUnderground
Grade v Costs Relationship Not That Simple at Industry Level

Towards an understanding of production costs at Australia’s underground gold mines
Snapshot of Australian Gold MiningQuarter Ending 30 June 2017
16 Oct 2017AusIMM UG Operators Conference, Gold Coast, AustraliaSlide 9 of 25
13th AusIMM Underground Operators’ Conference 2017 Capturing the Opportunities: Communication, Collaboration, Innovation
16-18 October 2017, Gold Coast, Australia

Towards an understanding of production costs at Australia’s underground gold mines
Cost Curve – AISC (Reported)
16 Oct 2017AusIMM UG Operators Conference, Gold Coast, AustraliaSlide 10 of 25
2017 Q2Reported AISC
2017 Q2 Gold Price
1st Quartile ≤ A$886/oz
Median = A$1,054/oz
4th Quartile > A$1,256/oz
1st Ernest Henry -A$432/oz

Towards an understanding of production costs at Australia’s underground gold mines
16 Oct 2017AusIMM UG Operators Conference, Gold Coast, AustraliaSlide 11 of 25
2017 Q2Adjusted Co-AISC
Cost Curve – Co-AISC (Adjusted)
Gold-plus mines• Ernest Henry• Cadia• Mt Carlton• Boddington• Hera• Peak• Beta Hunt
1st Fosterville A$517/oz2017 Q2 Gold Price

Towards an understanding of production costs at Australia’s underground gold mines
Grade Curve – Ave Feed/Head Grade
16 Oct 2017AusIMM UG Operators Conference, Gold Coast, AustraliaSlide 12 of 25
2017 Q2Reported Ave
Feed Grade (g/t)
Highest – FostervilleHigh quartile ≥ 5.35 g/tMedian = 2.19 g/tLow quartile ≤ 1.24 g/tLowest – Ernest Henry & Cadia

Towards an understanding of production costs at Australia’s underground gold mines
Time Series AnalysisAustralian Gold Mining1 January 2014 to 30 June 2017
16 Oct 2017AusIMM UG Operators Conference, Gold Coast, AustraliaSlide 13 of 25
13th AusIMM Underground Operators’ Conference 2017 Capturing the Opportunities: Communication, Collaboration, Innovation
16-18 October 2017, Gold Coast, Australia

Towards an understanding of production costs at Australia’s underground gold mines
Time Series Study Period
16 Oct 2017AusIMM UG Operators Conference, Gold Coast, AustraliaSlide 14 of 25
0
250
500
750
1,000
1,250
1,500
1,750
2,000
Jan-07 Jan-08 Jan-09 Jan-10 Jan-11 Jan-12 Jan-13 Jan-14 Jan-15 Jan-16 Jan-17
AISC
& G
old
Pric
e (A
$/oz
)
Study period
Gold price (monthly average)
Upper quartile
Lower quartileMedian
• Relatively stable study period – no evidence for cost escalation
Towards an understanding of production costs at Australia’s underground gold mines
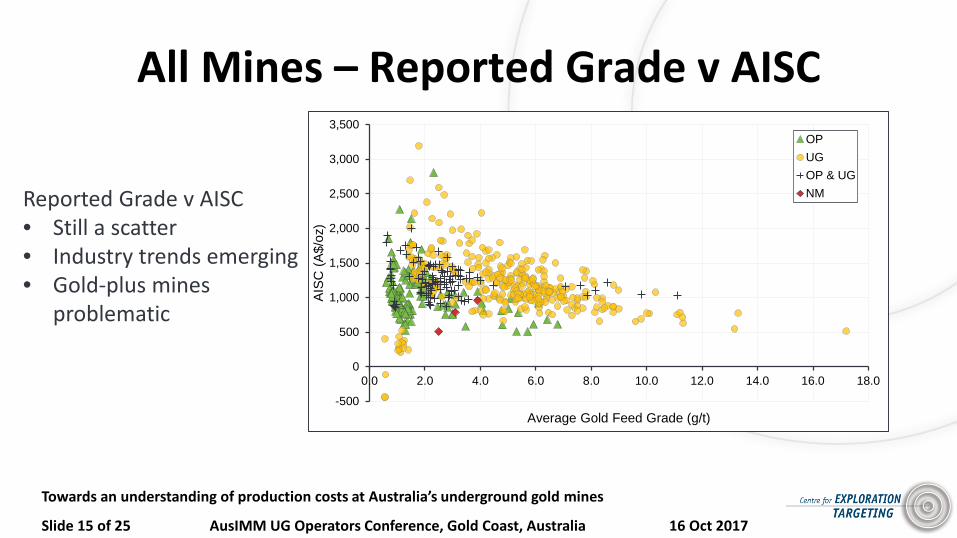
All Mines – Reported Grade v AISC
16 Oct 2017AusIMM UG Operators Conference, Gold Coast, AustraliaSlide 15 of 25
-500
0
500
1,000
1,500
2,000
2,500
3,000
3,500
0.0 2.0 4.0 6.0 8.0 10.0 12.0 14.0 16.0 18.0
AISC
(A$/
oz)
Average Gold Feed Grade (g/t)
OPUGOP & UGNMReported Grade v AISC
• Still a scatter• Industry trends emerging• Gold-plus mines
problematic

Towards an understanding of production costs at Australia’s underground gold mines
Grade v AISC
16 Oct 2017AusIMM UG Operators Conference, Gold Coast, AustraliaSlide 16 of 25
0
500
1,000
1,500
2,000
2,500
3,000
3,500
0.00 2.00 4.00 6.00 8.00 10.00 12.00 14.00 16.00 18.00
AISC
(A$/
oz)
Average Gold Feed Grade (g/t)
Note: excludes underground gold-plus operations
Underground gold mines – Overall grade cost relationships
Non-linear Relationship
• As grade increases, AISC decreases, but decay rate less than growth rate of AISC, if grade decreases

Towards an understanding of production costs at Australia’s underground gold mines
UG Mines - Grade v Processing Costs
16 Oct 2017AusIMM UG Operators Conference, Gold Coast, AustraliaSlide 17 of 25
0
100
200
300
400
500
0.00 2.00 4.00 6.00 8.00 10.00 12.00 14.00 16.00 18.00
Proc
essi
ng C
osts
(A$/
oz)
Average Gold Feed Grade (g/t)
• Strong negative relationship between processing costs and gradeNote: excludes underground gold-plus operations

Towards an understanding of production costs at Australia’s underground gold mines
UG Mines - Grade v Mining Costs
16 Oct 2017AusIMM UG Operators Conference, Gold Coast, AustraliaSlide 18 of 25
0
200
400
600
800
1000
1200
1400
0.00 3.00 6.00 9.00 12.00 15.00
Min
ing
Cos
ts (A
$/oz
)
Average Gold Feed Grade (g/t)
0
200
400
600
800
1000
1200
1400
0.00 3.00 6.00 9.00 12.00 15.00
Min
ing
Cos
ts (A
$/oz
)
Average Gold Mined Grade (g/t)
Costs dominated by 3 mines
Note: excludes underground gold-plus operations
• Considerably less of a cost difference with changing grade• Factors affecting what is being mined most important
• Geology, geometry etc

Towards an understanding of production costs at Australia’s underground gold mines
Individual Mines - Grace v AISC
16 Oct 2017AusIMM UG Operators Conference, Gold Coast, AustraliaSlide 19 of 25
0
250
500
750
1,000
1,250
1,500
1,750
0 2 4 6 8 10 12 14 16 18
AISC
(A$/
oz)
Average Gold Feed Grade (g/t)
Fosterville
0
250
500
750
1,000
1,250
1,500
1,750
0 2 4 6 8 10 12 14 16 18
AISC
(A$/
oz)
Average Gold Feed Grade (g/t)
Jundee
Non-linear relationship
Towards an understanding of production costs at Australia’s underground gold mines
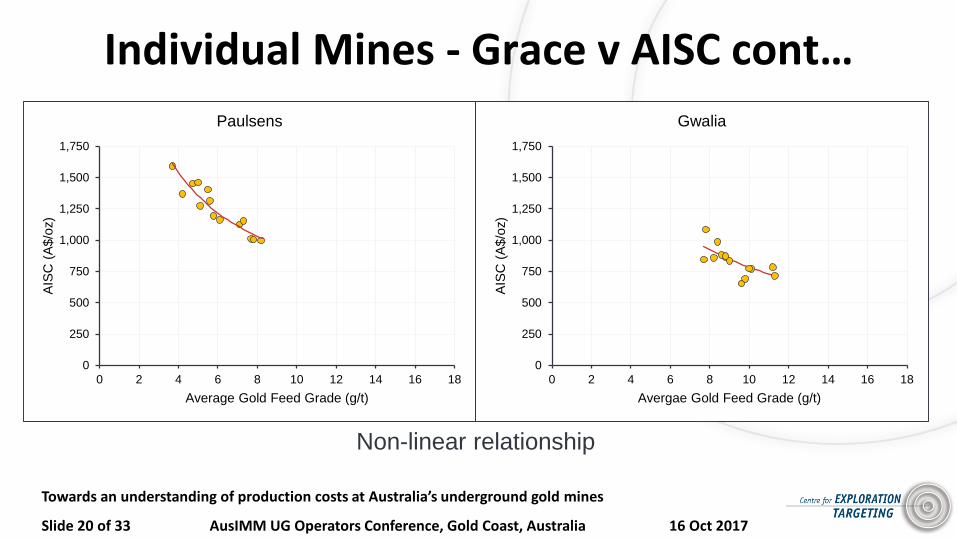
Individual Mines - Grace v AISC cont…
16 Oct 2017AusIMM UG Operators Conference, Gold Coast, AustraliaSlide 20 of 33
0
250
500
750
1,000
1,250
1,500
1,750
0 2 4 6 8 10 12 14 16 18
AISC
(A$/
oz)
Average Gold Feed Grade (g/t)
Paulsens
0
250
500
750
1,000
1,250
1,500
1,750
0 2 4 6 8 10 12 14 16 18
AISC
(A$/
oz)
Avergae Gold Feed Grade (g/t)
Gwalia
Non-linear relationship

Towards an understanding of production costs at Australia’s underground gold mines
Individual UG Mines Grade v AISC
16 Oct 2017AusIMM UG Operators Conference, Gold Coast, AustraliaSlide 21 of 25
0
500
1,000
1,500
2,000
2,500
0.00 2.00 4.00 6.00 8.00 10.00 12.00 14.00 16.00 18.00 20.00
AISC
(A$/
oz)
Average Gold Feed Grade (g/t)
Non-linear relationshipPower function i.e. y=ax-b
• Individual mines have different grade-cost relationships• Individual grade cost relationships different to overall industry relationship

Towards an understanding of production costs at Australia’s underground gold mines
Conclusions & Implications
16 Oct 2017AusIMM UG Operators Conference, Gold Coast, AustraliaSlide 22 of 25
13th AusIMM Underground Operators’ Conference 2017 Capturing the Opportunities: Communication, Collaboration, Innovation
16-18 October 2017, Gold Coast, Australia

Towards an understanding of production costs at Australia’s underground gold mines
Conclusions & Implications
16 Oct 2017AusIMM UG Operators Conference, Gold Coast, AustraliaSlide 23 of 25
• “Grade is King” • Yes - for individual UG gold mines• Not that simple when comparing all UG gold mines
• Grade v costs – strong negative relationships • Quantifiable for most individual UG mines
• Different grade-cost profiles between mines• Different rates of growth or decline in AISC as grade changes• Therefore, grade is not a direct indicator of quality• What’s driving this? – More study required
• geology (mineralisation style, structure etc) • geometry• ???

Towards an understanding of production costs at Australia’s underground gold mines
Conclusions & Implications Cont…• Mine owner implications
• Declining grades or high grade opportunities on AISC• Ore Reserve grades varying to recently processed grades
• Implications for M&A • Opportunities and risks of varying grades at mines with different grade-
cost profiles. • Which mine might be a better buy for your company’s risk profile?
• The Future – Could one potentially determine a grade-cost profile at the resource stage or earlier, by knowing and understanding the fundamental attributes that drive costs?
16 Oct 2017AusIMM UG Operators Conference, Gold Coast, AustraliaSlide 24 of 25

Towards an understanding of production costs at Australia’s underground gold mines
Contact DetailsSam Ulrich: [email protected] trench: [email protected] Hagemann: [email protected]
Further Reading• Ulrich, S., Trench, A & Hagemann, S. 2017. Towards an
understanding of production costs at Australia’s underground gold mines. 13th AusIMM Underground Operators’ Conference. Gold Coast, Australia. 16-18 October.
• Ulrich, S., Kanakis, M.D., Groves, D., Hagemann, S., Sykes, J.P. & Trench, A. 2016. Is Grade King in Gold? A Preliminary Analysis of Gold Production Costs at Australian and New Zealand Mines. AusIMM New Zealand Branch Conference. Wellington, New Zealand. 4-6 September.
• Kanakis, M.D. 2014. Geological Factors that Influence the Cost of Production in Currently Operating Gold Mines within Australia and New Zealand. BSc (Mineral Geoscience) Honours Thesis. The University of Western Australia.
16 Oct 2017AusIMM UG Operators Conference, Gold Coast, AustraliaSlide 25 of 25
CSA GlobalMining Industry Consultants
Acknowledgments
The supportive mining companies
13th AusIMM Underground Operators’ Conference 2017 Capturing the Opportunities: Communication, Collaboration, Innovation
16-18 October 2017, Gold Coast, Australia