towards business cases for electric buses. towards business... · scenario comparison oberhausen...
TRANSCRIPT

Towards Business Cases for Electric Buses
Fabian Meishner, RWTH Aachen - ISEA
Eliptic Final Conference
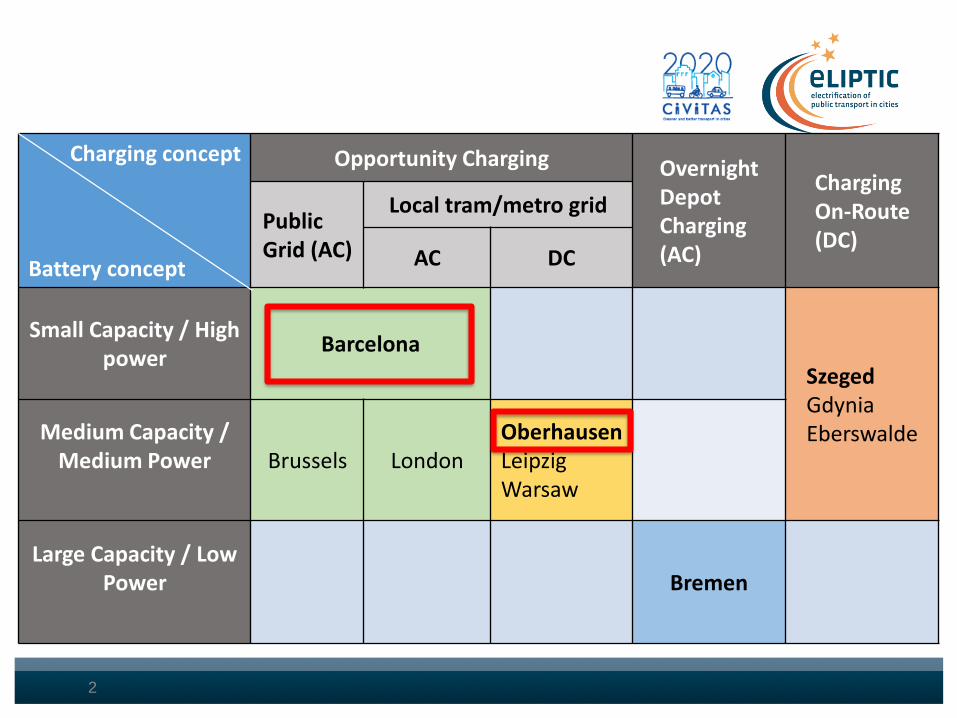
Technological ConceptsCharging concept
Battery concept
Opportunity Charging OvernightDepot Charging(AC)
ChargingOn-Route (DC)
Public Grid (AC)
Local tram/metro grid
AC DC
Small Capacity / High power
Barcelona
SzegedGdynia EberswaldeMedium Capacity /
Medium Power Brussels LondonOberhausenLeipzigWarsaw
Large Capacity / Low Power Bremen
2

Scenario ComparisonOberhausen & Barcelona
Oberhausen Barcelona
Lines andOperation
2 lines, 1 standard bus each~ 170-300 km daily distance
1 line, 2 articulated buses~ 200 km daily distance
Vehicle 2x Solaris Urbino 12e 2x Solaris Urbino 18e
Passenger capacity
70 110
Heating/AC Electric Electric
Battery 200 kWh Li-Ion (LFP/C) 125 kWh Li-Ion (NMC/LTO)
OpportunityCharging
220 kW at two TerminalsConnected to DC Tram grid
400/500 kW at both terminalsConnected to AC Public&Metro grid
Depot Charging
20 kW (AC) 50 kW (AC)
3

Towards a Business Case
1
2
3
4
5
6
7
Data collection
Simulation of operation & TCO Calculation
Cost comparison with diesel
Scaling effects of infrastructure
Consideration of external factors
Sensitivity analysis
Risk assessment
4

Business Case CompositionData Collection - Invest
1
Item Quantity Oberhausen Barcelona
Vehicle
Chassis 1 300,000 € 532,000 €
Battery 1 200,000 € 187,500 €
Ʃ Bus 1 500,000 € 719,500 €
Ʃ Bus,total 2 1,000,000 € 1,440,000 €
Infrastructure
Construction/Installation 1 370,000 € 792,000 €
Fast Charging Device 1 93,000 € 170,000 €
Slow Charging Device 1 16,000 € 35,000 €
Ʃ Infrastructure,total 2 devices 625,000 € 1,202,000 €
Ʃ Project 1.625M € 2.642M €
5

Business Case CompositionData Collection - Operation
Item Quantity Oberhausen Barcelona
Maintenance
Costs per Quarter per bus 4,500 € 4,500 €
Trend general ▼ ▼
Energy
Costs T0 - 0.15 €/kWh 0.06 – 0.1 €/kWh
Costs Tend - 0.225 €/kWh (+50%) 0.09 – 0.15 €/kWh (+50%)
Operation
Theor. Mileage per bus/year 86,700 km 73,000 km
Average Passenger per bus 28 (40 %) 48 (40 %)
* *
* reduced costs through connection to the existing network
6

Towards a Business Case
1
2
3
4
5
6
7
Data collection
Simulation of operation & TCO Calculation
Cost comparison with diesel
Scaling effects of infrastructure
Consideration of external factors
Sensitivity analysis
Risk assessment
7

Business CaseSimulation of Operation
Item Oberhausen Barcelona
Energy Consumption
Average Case 1.3 kWh/km 2.0 kWh/km
Worst Case 2.6 kWh/km 4.5 kWh/km
Oberhausen Line 962, Mo-Fr, Worst-Case Barcelona Lini H16, Mo-Fr, Worst-Case
8

Business CaseTCO comparison of Projects
0.0100 €0.0134 €
0.0043 €
0.0032 €
0.0106 € 0.0075 €
0.0113 €0.0153 €
0.0076 €0.0048 €
0.0438 € 0.0441 €
0.0000 €
0.0050 €
0.0100 €
0.0150 €
0.0200 €
0.0250 €
0.0300 €
0.0350 €
0.0400 €
0.0450 €
0.0500 €
Oberhausen Barcelona
TCO comparison in € / passenger km
Energy
Infrastructure
Batteries
Maintenance
Vehicles
Investigation timeframe 12 years
Interest rate 4 %
Battery replacement 1 (year 6)
Residual value of components 5 % of invest
9

Towards a Business Case
1
2
3
4
5
6
7
Data collection
Simulation of operation & TCO Calculation
Cost comparison with diesel
Scaling effects of infrastructure
Consideration of external factors
Sensitivity analysis
Risk assessment
10

Business CaseCost Comparison to Diesel EU6
Item Quant. OberhausenElectric
Oberhausen Diesel
BarcelonaElectric
Barcelona Diesel
Vehicle 1 500,000 € 240,000 719,500 € 350,000
Maintenance 14,500 €/quarter/bus▼
4,500 €/quarter/bus▬
4,500 €/quarter/bus▼
4,500 €/quarter/bus ▬
Infrastructuretotal
2 devices
625,000 € neglectable 1,202,000 € neglectable
Energy - 0.15 €/kWh ▲ 1 €/l ▲0.06-0.1 €/kWh ▲
0.9 €/l ▲
assumption: same reliability / availability !
11

Business CaseTCO comparison of Projects
0.0100 € 0.0082 €
0.0134 €0.0091 €
0.0043 €0.0059 €
0.0032 €
0.0045 €
0.0106 € 0.0075 €
0.0113 €0.0153 €
0.0076 €
0.0141 €
0.0048 €
0.0151 €
0.0438 €
0.0283 €
0.0441 €
0.0287 €
0.0000 €
0.0050 €
0.0100 €
0.0150 €
0.0200 €
0.0250 €
0.0300 €
0.0350 €
0.0400 €
0.0450 €
0.0500 €
Oberhausen Oberhausen Diesel EU6 Barcelona Barcelona Diesel EU6
TCO Comparison in € / passenger km
Energy
Infrastructure
Batteries
Maintenance
Vehicles
12

Towards a Business Case
1
2
3
4
5
6
7
Data collection
Simulation of operation & TCO Calculation
Cost comparison with diesel
Scaling effects of infrastructure
Consideration of external factors
Sensitivity analysis
Risk assessment
13

Infrastructure Scaling Electrification of a complete bus line
0.0134 € 0.0134 €
0.0032 € 0.0032 €
0.0075 € 0.0075 €
0.0153 €
0.0047 €
0.0048 €
0.0048 €
0.0441 €
0.0336 €
0.0000 €
0.0050 €
0.0100 €
0.0150 €
0.0200 €
0.0250 €
0.0300 €
0.0350 €
0.0400 €
0.0450 €
0.0500 €
2 buses 8 buses
Barcelona
Energy
Infrastructure
Batteries
Maintenance
Vehicles
Consideration of scaling effects of infrastructureonly 2 buses at the moment, but 8 possible on this line
opp. charging infrastructure costs per km significantly reduced
14

Towards a Business Case
1
2
3
4
5
6
7
Data collection
Simulation of operation & TCO Calculation
Cost comparison with diesel
Scaling effects of infrastructure
Consideration of external factors
Sensitivity analysis
Risk assessment
15

External factorsEnvironmental Costs
Item FederalEnvironmental
Agency Germany
EU Clean VehiclesDirective
Oberhausen Diesel EU6 Bus(38 l / 100 km)
Barcelona Diesel EU6 Bus
(60 l / 100 km)
CO2 145 €/t 30 €/t 125.000 € 190,000 €
NOx 10,300 €/t 4,400 €/t 4.050 € 8,000 €
PM 36,300 €/t 87,000 €/t 120 € 180 €
Noise 0.0968 €/km 0.0768 €/km 79.000 € 66,000 €
Ʃ 208,170 € 264,180 €
16

External factors
0.0100 €0.0082 €
0.0134 €
0.0091 €
0.0043 €0.0059 €
0.0032 €
0.0045 €
0.0106 €0.0075 €
0.0045 € 0.0047 €
0.0076 €
0.0141 €
0.0048 €
0.0151 €
0.0033 €
0.0071 €
0.0028 €
0.0069 €
0.0402 €
0.0350 € 0.0364 € 0.0356 €
0.0000 €
0.0050 €
0.0100 €
0.0150 €
0.0200 €
0.0250 €
0.0300 €
0.0350 €
0.0400 €
0.0450 €
Oberhausen Oberhausen Diesel EU6 Barcelona Barcelona Diesel EU6
Total cost per kilometer scaled with Environment
Environment
Energy
Infrastructure
Batteries
Maintenance
Vehicles
17

Towards a Business Case
1
2
3
4
5
6
7
Data collection
Simulation of operation & TCO Calculation
Cost comparison with diesel
Scaling effects of infrastructure
Consideration of external factors
Sensitivity analysis
Risk assessment
18

SensitivityNo battery replacement
0.0100 €0.0082 €
0.0134 €
0.0091 €
0.0043 €0.0059 €
0.0032 €
0.0045 €
0.0066 €0.0047 €
0.0045 € 0.0047 €
0.0076 €
0.0141 €
0.0048 €
0.0151 €
0.0033 €
0.0071 € 0.0028 € 0.0069 €
0.0363 € 0.0350 €
0.0337 € 0.0356 €
0.0000 €
0.0050 €
0.0100 €
0.0150 €
0.0200 €
0.0250 €
0.0300 €
0.0350 €
0.0400 €
Oberhausen Oberhausen Diesel EU6 Barcelona Barcelona Diesel EU6
Total cost per passenger kilometerscaled / with Environment / no battery replacement
Environment
Energy
Infrastructure
Batteries
Maintenance
Vehicles
19

Towards a Business Case
1
2
3
4
5
6
7
Data collection
Simulation of operation & TCO Calculation
Cost comparison with diesel
Scaling effects of infrastructure
Consideration of external factors
Sensitivity analysis
Risk assessment
200

Risks
■ Charging infrastructure technically not mature
□ Failure leads to inoperability of electric buses on the affected line
□ Diesel buses must be kept in reserve higher TCO
■ Interoperability of charging infrastructure with other bus manufacturers
□ If new buses are procured, they have to be able to directly use the existing systemwithout profound adaption
■ Warranty for battery/vehicle/charging infrastructure
□ Who pays when errors occur that damage important components, e.g. the battery
■ Changes of Political situation/will
211

Conclusion and outlook
Is there a Business Case to use existing infrastructure?
□ It depends
□ Reduced costs for energy have significant positive impact
Battery electric buses will be a Business Case, if …
■ political will is strengthened – accordingly funding to overcome
high investment costs
■ the system reliability increases to the level of diesel buses
■ costs of all components are reduced (especially vehicle/battery)
■ interoperability of different manufacturers is ensured
□ standardization of coupling and charging devices
222

233
All results with detailed
explanation will be available soon
in the “Final Business Cases”
report, see
www.eliptic-project.eu

Towards Business Cases for Electric Buses
Fabian Meishner, RWTH Aachen - ISEA
Eliptic Final Conference