towards dynamic performance measurement systems - diva
TRANSCRIPT

Mälardalen University Press Licentiate ThesesNo. 140
TOWARDS DYNAMIC PERFORMANCE MEASUREMENT SYSTEMS
A FRAMEWORK FOR MANUFACTURING ORGANISATIONS
Mohammed Salloum
2011
School of Innovation, Design and Engineering

Copyright © Mohammed Salloum, 2011ISBN 978-91-7485-022-2ISSN 1651-9256Printed by Mälardalen University, Västerås, Sweden

I
Abstract
Consensus prevails that performance measurement systems should reflect the strategic direction and business environment of a company. However, strategies and business environments are dynamic in nature while existing performance measurement systems are stable and predictable. This has created problems for companies as the strategic direction and business environment alters. Even though the literature surrounding the field is vast and dense there is a gap regarding how to keep performance measurement system up to date and dynamic.
With the existing problem in mind, the objective of this research is to develop a framework that will support the realisation of dynamic performance measurement systems in manufacturing organisations.
The research in this thesis has adopted a systems approach and is built around four case studies and two literature studies. The case studies have been conducted at manufacturing organisations on three different continents. The first literature study focused on the general literature in the field whilst the second literature study focused on the characteristics of dynamic performance measurement system in particular.
The end-result of this research is a framework based on 19 factors systemised under five sub-headings: review process, IT systems, management, employees and culture. In excess of the 19 factors, an additional two factors focalising on the realisation of the framework in practice finalises the end-result.
As the research is derived from an industrial problem, this thesis provides an insight for academics of the contemporary struggles of manufacturing organisations with their performance measurement systems. Moreover, this framework provides practitioners with a foundation for making their performance measurement systems compatible and suitable for ever-changing content.

II
III
Acknowledgements
Firstly, I would like to show my gratitude towards my supervisors, Associate Professor Magnus Wiktorsson, Dr Marcus Bengtsson and Professor Christer Johansson. The time, energy and effort that you three have spent are inestimable to me. Without your encouragements, friendliness and enthusiasm this thesis would not have been written. To put it simple, you are worth your weight in gold!
A big thanks to Adjunct Professor Anders Fundin and Anette Brannemo for always taking time to receive and consult me, you have not turned me down once. Even though I do not always make it explicit, I value the laughs and moments shared with the highly talented people at IDT graduate school.
I am grateful towards Ivan Obrovac and Volvo Construction Equipment for giving me the opportunity to become an industrial PhD student. Further, I would like to thank the ProLoc research project and VINNOVA for the financial support. My gratitude towards my former managers, Fredrik Berntsson and Catrin Mattsson, for always ensuring that the workload did not impact on my research. Thanks to my fantastic colleagues at the Department of Finance and Business Control at Volvo Construction Equipment (Customer Support) for always supporting and covering for me.
Thanks to all my awesome friends for the encouragements over time. Last but not least, I would like to thank my family for the unconditional love and support. It would require endless combinations of superlatives to describe my feelings for you.
Eskilstuna, May 2011
Mohammed

IV

V
Publications
Appended papers
Paper I - Salloum, M. and Wiktorsson, M. (2009) “From Metric to Process: Towards a Dynamic and Flexible Performance Measurement System for Manufacturing Systems” Swedish Production Symposium 09, Göteborg,
Sweden.
Salloum was the corresponding author and presenter of the paper.
Paper II – Salloum, M., Wiktorsson, M., Bengtsson, M. and Johansson, C. (2010) “Aligning Dynamic Performance Measures” 6th
European Conference
on Management, Leadership and Governance, Wroclaw, Poland.
Salloum was the corresponding author and presenter of the paper.
Paper III – Salloum, M., Bengtsson, M., Wiktorsson, M. and Johansson, C. (2011) “ Designing a performance measurement support structure – A longnitudinal case study” Swedish Production Symposium 11, Lund,
Sweden.
Salloum was the corresponding author and presenter of the paper.
Paper IV – Salloum, M. and Wiktorsson, M. (2011) “Dynamic abilities in performance measurement system: a case study on practice and strategies” 18
th
EurOMA Conference, Cambridge, UK.
Salloum was the corresponding author of the paper.
Other publications
Bruch, J., Wiktorsson, M., Bellgran, M. and Salloum, M. (2011) “In search for improved decision making on manufacturing footprint: A conceptual model for information handling” Swedish Production Symposium 11, Lund, Sweden.
Bruch was the corresponding author and presenter of the paper.

VI

VII
Table of Contents 1. Introduction......................................................................................1
1.1 Background ...................................................................................................................... 1 1.2 Problem Description and Research Objective.................................................................. 3 1.3 Research Questions .......................................................................................................... 3 1.4 Delimitations .................................................................................................................... 4 1.5 Contribution ..................................................................................................................... 4 1.6 Outline of the Thesis ........................................................................................................ 4
2. Research Methodology....................................................................7
2.1 Scientific Approach.......................................................................................................... 7 2.2 Research Process .............................................................................................................. 9 2.3 Data Collection............................................................................................................... 11 2.4 Analysis of Data ............................................................................................................. 15 2.5 Quality of Research ........................................................................................................ 16
3. Frame of Reference .......................................................................19
3.1 Performance Measurement, a Historical Aspect ............................................................ 19 3.2 The Balanced Scorecard (BSC)...................................................................................... 22 3.3 The Relationship between Measures and Strategy......................................................... 25 3.4 State of the art of Dynamic Performance Measurement Systems .................................. 26
4. Paper Summary .............................................................................37
4.1 Paper I ............................................................................................................................ 37 4.2 Paper II ........................................................................................................................... 38 4.3 Paper III.......................................................................................................................... 38 4.4 Paper IV.......................................................................................................................... 39
5. Empirical Findings ........................................................................41
5.1 Case Study A.................................................................................................................. 41 5.2 Case Study B .................................................................................................................. 42 5.3 Case Study C .................................................................................................................. 45 5.4 Case Study D.................................................................................................................. 49
6. A framework for dynamic PMS...................................................57
6.1 Factors that constitute dynamics in a PMS .................................................................... 57 6.2 Systematisation of factors .............................................................................................. 63 6.3 Realisation of factors...................................................................................................... 65 6.4 Summarising the findings into a framework .................................................................. 67
7. Conclusions and Contributions ....................................................69
7.1 Conclusions .................................................................................................................... 69 7.2 Scientific and Industrial Contributions .......................................................................... 70 7.3 Quality of the Presented Research ................................................................................. 70 7.4 Future Research.............................................................................................................. 71
Reference List.....................................................................................73

VIII

1
1. Introduction
This introduction gives a brief background of the contemporary challenges in
creating performance measurement systems that are dynamic. After the background has been presented, the problem description, research objective, research questions, delimitation, and contributions are outlined in order to
clarify the scope of this thesis. The chapter is then concluded by a brief presentation of the thesis outline.
1.1 Background
In a globalised and ever-changing world the companies surviving are the ones who are able to rapidly and successfully adapt to new conditions. Shareholders, customers, employees, suppliers, technology and society all place demands on the company’s ability to adapt and drive internal and external evolution. Change is not an option anymore but a requirement for survival and the ability to stay competitive.
During the second half of the twentieth century rapid technological and political progress shifted the rules of the game for companies around the world. Globalisation started to change the nature of making business, trade barriers were lowered and successful companies began to compete in an international arena and regarded the world as their market (Rolstadås, 1998). Companies were no longer confined to their geographical locations and started to compete for customers across the globe. However, with these technological, political and market changes came mounted pressure on amplified performance and increased market shares for companies on the global market. One way to continuously improve (Cross and Lynch, 1992), enhance productivity (Bernolak, 1997) and assess the performance of processes and whole operations is performance measurement (Slack et al, 2004). For the last 15 years the field of performance measurement has been in focus in an ever-increasing number of fields (Folan and Brown, 2005). Research evidence indicates that measuring firms outperform non-measuring firms financially, in management of change and in being perceived as industry leaders (Lingle and Schiemann, 1996). Ittner et al (2003) develops the argument and states that companies extensively using financial and, in particular, non-financial measures earn higher stock market returns than firms with similar strategies and value drivers that do not deploy performance measures as extensively.

2
During the latter half of 2008 it became unquestionable for some companies with large manufacturing units in Sweden that their performance measurement systems (PMS) lacked mechanisms allowing them to reflect the business environment in which they operate. An economical boom was rapidly replaced by a financial crisis with severe repercussions globally. Several companies within the Swedish manufacturing sector witnessed how record breaking order intakes and production output were promptly substituted by negative order intakes and plant closings. Strategic objectives and investment initiatives solely purposing to increase occupancy rates, production output and capacity needs were, over night, replaced with large-scale redundancy notes, cost cutting programmes and heavy decline in market demand. The unforeseen and extreme market conditions deeply impacted on the PMS of these manufacturing units. The performance measures deployed when the occupancy rates were high became inappropriate and irrelevant when the factories struggled to stay open. However, the manufacturing units soon realised that their PMS did not have the capabilities to replace obsolete measures.
A paradox arose when manufacturing units in dire need to quickly rearrange internal priorities and focal points stood without means to make it happen. Management teams and production supervisors were dispossessed of performance follow-ups as performance measures became obsolete and did neither reflect the strategic objectives nor the current business environment. As a direct consequence, production performance follow-ups became narrowed down to more static measures such as safety and environment. Even though a dynamic environment needs dynamic performance measures (Tatikonda and Tatikonda, 1998), companies often struggle to reflect the evolving business environment and priorities in their PMS. The development, implementation and use of adequate performance measurement frameworks are some major challenges confronting organisations and, at the same time, significant success factors (Santos et al, 2002). Moreover, the failure to simultaneously replace obsolete measures with relevant dittos is resulting in added confusion and cost for companies (Paranjape et al, 2006).
The literature surrounding the field of performance measurement and management is vast and dense, however, a gap regarding how to keep PMS up to date and dynamic exists (Ghalayini and Noble, 1996; Melnyk et al, 2004; Neely, 2005; Bourne, 2008). Even though it is generally accepted by academics and practitioners alike that performance measures ought to be derived and aligned to strategy (Dixon et al, 1990; Wisner and Fawcett, 1991; Cross and Lynch, 1992), the knowledge about the factors that affect the evolution of a PMS over time is limited due to the a small amount of research that has been conducted in this part of the field (Kennerley and Neely 2003). Empirics indicate that the strategic direction of the company has a limited influence at

3
the PMS (O´Mara et al, 1998) and that unlike the context that the PMS operate in it appears to be static (Kennerley and Neely, 2002).
1.2 Problem Description and Research Objective
The paradox of combining ever changing and dynamic strategies with stable and predictive PMS has created problems for companies as the strategic direction and business environment alters. Deployed performance measures and measurement systems can quickly become obsolete without the means to re-align them with strategy and business environment. Even though the research in the field of performance measurement is vast, a small amount of research is made regarding the factors affecting dynamic PMS. This became even more apparent during the aftermath of the 2008 financial crisis when the PMS of manufacturing units in Sweden became inappropriate without the means or the understanding to mend them. The small amount of research conducted is a contributing element to why companies often fail to continuously reflect the dynamic business environment in their PMS.
As a consequence of this problem description, the objective of this research is
to develop a framework that will support the realisation of dynamic
performance measurement systems in manufacturing organisations.
1.3 Research Questions
With the background and outlined research objective in mind, three research questions have been formulated. The first research question is formulated as:
RQ1 – What factors constitute dynamics in a performance measurement
system?
Due to the little amount of research performed regarding the dynamics in PMS the initial step is to understand what factors that actually affects them.
RQ2 – How can the identified factors be systemised?
To merely identify factors that constitute dynamics in a PMS is insufficient to fulfil the outlined research objective. Research question two inquires how the identified factors can be systemised into a framework.
RQ3 – How can the identified factors be realised?
To generate factors and systemise them is not enough to present a framework with practical relevance. Research question three answers how the findings

4
from the two previous questions can be realised in order to create a dynamic PMS.
1.4 Delimitations
The research presented is limited to large multinational manufacturing units with the empirical data collected from operational sites within the heavy machinery industry. The research has been conducted at three different manufacturing units with between 800 to 1400 employees at each unit.
Parts of the research end-result are obtainable today in theories concerning various areas within the field of PMS and strategic management. Even though the collected empirics involves considerable amount of data regarding the use of the PMS, the research results presented are limited to the research objective and research questions.
No isolated consideration is given to how the business strategies have been developed and formulated. The final outcome of this research is a framework that will support the realisation of dynamic performance measurement systems in manufacturing organisations, the verification of the framework is beyond the scope of the presented research.
1.5 Contribution
First and foremost this research intends to amplify the understanding of how to realise dynamic PMS in manufacturing organisations. Most PMS available today are reliable but static which has proven problematic as discussed earlier.
The expected contribution to the academic community is the enhancement of the understanding of the dynamic PMS requirements. Further, it is expected that the research conducted will raise awareness in the academic community regarding the challenges and struggles that face practitioners in the field of performance measurement.
Regarding the industry, it is expected that the results will provide guidance for practitioners seeking dynamics in their PMS. Furthermore, the ambition is that this research will contribute to increased awareness among management teams regarding the requirements for dynamic PMS.
1.6 Outline of the Thesis
This thesis consists of seven chapters, Figure 1 illustrates how the chapters are related. This first chapter has motivated the chosen subject by presenting a background, problem description, research objective, three research questions,
5
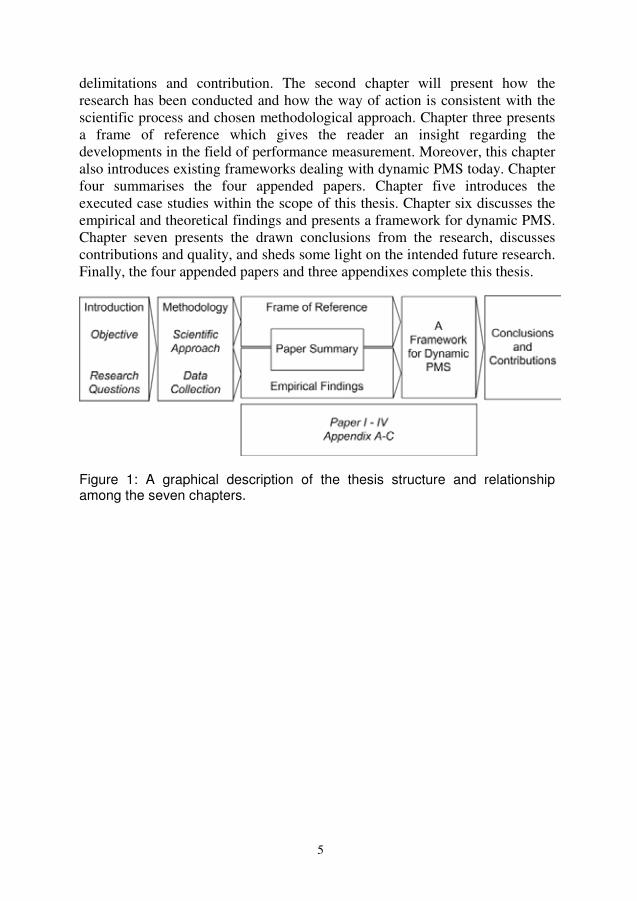
delimitations and contribution. The second chapter will present how the research has been conducted and how the way of action is consistent with the scientific process and chosen methodological approach. Chapter three presents a frame of reference which gives the reader an insight regarding the developments in the field of performance measurement. Moreover, this chapter also introduces existing frameworks dealing with dynamic PMS today. Chapter four summarises the four appended papers. Chapter five introduces the executed case studies within the scope of this thesis. Chapter six discusses the empirical and theoretical findings and presents a framework for dynamic PMS. Chapter seven presents the drawn conclusions from the research, discusses contributions and quality, and sheds some light on the intended future research. Finally, the four appended papers and three appendixes complete this thesis.
Figure 1: A graphical description of the thesis structure and relationship among the seven chapters.

6

7
2. Research Methodology
Chapter two is dedicated to outlining how the research in this thesis has been
conducted. The start off point of the chapter is to present the adopted view of science. The research process, chosen strategies for data collection and data analysis are then introduced in order to give the reader an understanding of
how the research has been conducted. The chapter is then concluded by discussing the quality of the research.
2.1 Scientific Approach
As highlighted in the introducing chapter, the research presented in this thesis purposes to be valid for the academic and industrial communities alike. The starting point of the research has been influenced by problems and challenges evident in both the real world and in theory as dictated by Fagerström (2004). Throughout this thesis, two literature studies have been iteratively combined with four case studies in order to answer the research questions and objective in a desirable fashion. This approach goes in line with Fagerström (2004) that argues that in order to create dual relevance of the result, the research ought to move in an iterative process combining theory with real world contact (see Figure 2).
Figure 2: Schematic view of the research process - adapted from Fagerström (2004).
According to Neely (2005), the four most cited authors within the field of performance measurement are from four different academic disciplines: accounting (Kaplan), management (Neely), information systems/operations

8
research (Banker) and mathematics/operations research (Charnes). When conducting research within a field with such dissemination, the decision regarding what methodological approach to choose is challenging and sometimes adverse.
Arbnor and Bjerke (1994) have classified three different methodological approaches (see Figure 3). Firstly, the analytical approach which is positivistic and assumes that reality is objective. Secondly, the actors’ approach which is hermeneutic and sees reality as a social construction. Thirdly, the systems approach which assumes that reality is objectively achievable and constructed in a sense that the whole deviates from the sum of its components.
The array of factors that needs to be considered when conducting research within the field of performance measurement is diversified. For instance, the content of performance measures, especially financial performance measures, can be scrutinised from an analytical approach. On the other hand, a PMS is affected by non-analytic factors not considered in a positivistic-based approach such as its temporal, cultural and social contexts. Moreover, the PMS works in an open production system and as a component of a management system, making it suitable for analysis from a systems approach. Neither an analytical nor an actors’ approach can be mutually exclusively applied in this research. In order to ensure that the chosen scientific approach is appropriate for the entirety of the studied phenomenon, a systems approach has been applied. However, the attitude towards the research questions has varied slightly within the systems approach (see Figure 3).
Figure 3: The relationship between the scientific approaches and the formulated research questions. The figure is adapted from Arbnor and Bjerke (1994).
9
The first research question inquires the factors that constitute dynamics in a PMS and is more inclined to the analytical approach. The second research question deals with the systematisation and puts the relationship amongst the factors at focus. Research question two has thus a more centralised position within the systems approach then the first question (see Figure 3). The third research question manages the realisation of the factors. Even though the relationships between the PMS and the interrelating systems are central, the question is approached from a slightly more hermeneutic angle due to the increased subjectivity and relativity surrounding it.
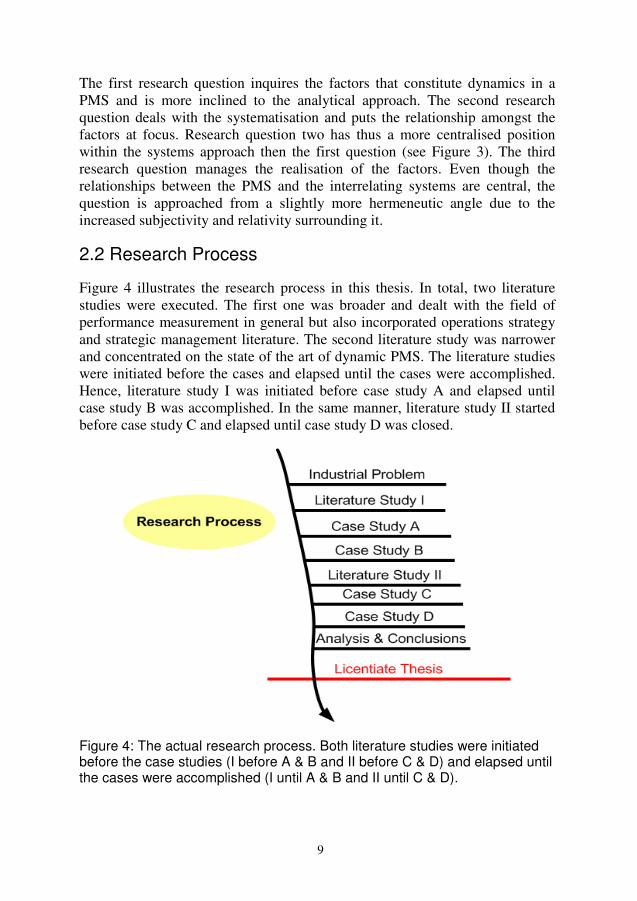
2.2 Research Process
Figure 4 illustrates the research process in this thesis. In total, two literature studies were executed. The first one was broader and dealt with the field of performance measurement in general but also incorporated operations strategy and strategic management literature. The second literature study was narrower and concentrated on the state of the art of dynamic PMS. The literature studies were initiated before the cases and elapsed until the cases were accomplished. Hence, literature study I was initiated before case study A and elapsed until case study B was accomplished. In the same manner, literature study II started before case study C and elapsed until case study D was closed.
Figure 4: The actual research process. Both literature studies were initiated before the case studies (I before A & B and II before C & D) and elapsed until the cases were accomplished (I until A & B and II until C & D).
10
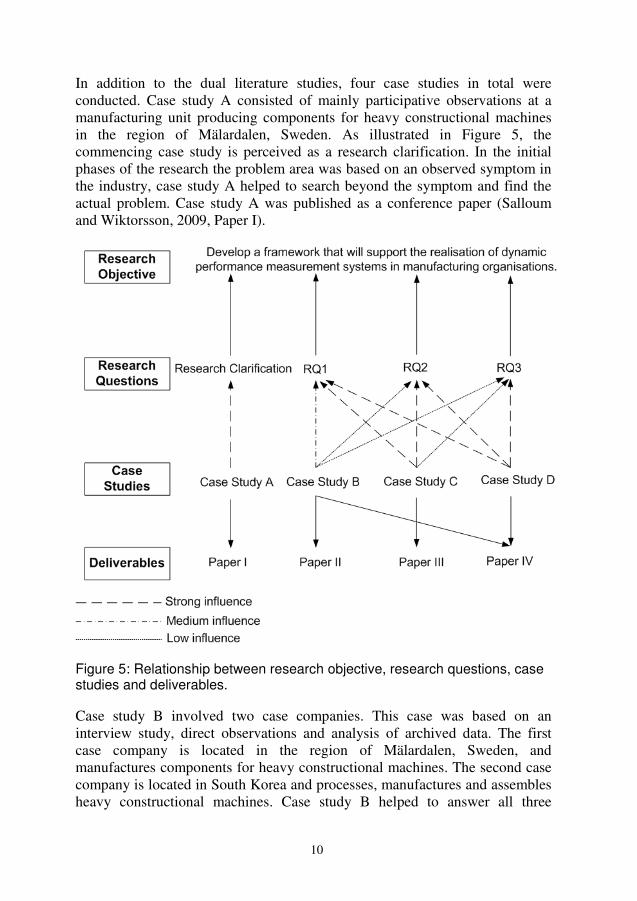
In addition to the dual literature studies, four case studies in total were conducted. Case study A consisted of mainly participative observations at a manufacturing unit producing components for heavy constructional machines in the region of Mälardalen, Sweden. As illustrated in Figure 5, the commencing case study is perceived as a research clarification. In the initial phases of the research the problem area was based on an observed symptom in the industry, case study A helped to search beyond the symptom and find the actual problem. Case study A was published as a conference paper (Salloum and Wiktorsson, 2009, Paper I).
Figure 5: Relationship between research objective, research questions, case studies and deliverables.
Case study B involved two case companies. This case was based on an interview study, direct observations and analysis of archived data. The first case company is located in the region of Mälardalen, Sweden, and manufactures components for heavy constructional machines. The second case company is located in South Korea and processes, manufactures and assembles heavy constructional machines. Case study B helped to answer all three

11
research questions (see Figure 5) and was published as a conference paper (Salloum et al, 2010, Paper II).
Case study C was also conducted at a manufacturing unit producing components for heavy constructional machines in the region of Mälardalen, Sweden. The case stretched for 10 months and the main data source for the study was participative observations. This case helped to answer all three research questions as illustrated in Figure 5. The findings of the case study was summarised and published as a conference paper (Salloum et al, 2011, Paper III).
Case study D was, just like case study B, based on an interview study, direct observations and analysis of archived data. The fourth case was conducted at a truck manufacturing site in Australia. This study helped to answer all three research questions and the findings are summarised in an accepted conference paper (Salloum and Wiktorsson, 2011, Paper IV).
2.3 Data Collection
2.3.1 Literature studies
Two literature studies in total were executed. The literature studies has been used to form the data protocol for the case studies but also, as Yin (1994) argues, to develop sharper and more profound research questions.
To initiate both literature studies, the databases of Proquest, Emerald Insight and to some extent Google Scholar, were searched through using following keywords: performance measures, performance measurement, performance measurement systems, performance management, performance metrics, performance management process, dynamic performance measurement system, evolving measurement systems, strategic management, the balanced scorecard, strategic alignment, performance measurement alignment, alignment, key performance indicators, history of performance measurement, performance measurement in change, revision of performance measures, updating performance measures, updating performance measurements, organisational change, changing performance measures, updating performance measurement systems, updating performance measures, audit of performance measures, auditing of performance measurement systems, reviewing performance measurement systems, reviewing performance measures, quality management and performance measurement, dynamic performance measures and dynamic key performance indicators. Further, the databases were also searched through typing author surnames: Kaplan, Norton, Ghalayini, Neely, de Waal, Bititci,
12
Drucker, Mintzberg, Skinner, Chandler, Eccles, Dixon, Kennerley, Bourne, Keegan, Sink, Tuttle, Cross, Lynch, Charnes and Banker.
Once a solid base of academic articles had been obtained the search of literature was extended to books referred to in the articles. Finally the ingoing material to the research study was finished by searching through the journals of: International Journal of Production Economics, International Journal of Operations & Production Management, Measuring Business Excellence, International Journal of Productivity, Management Accounting Research, International Journal of Productivity and Performance Management, Management Science, Performance Management and to some extent, the Harvard Business Review.
The journals were not searched through with the use of keywords but instead volume by volume. However, some volumes were not searched through due to library access restrictions. The literature studies were integral for answering the first research question and provided important insights for the answering of the other two research questions.
2.3.2 Case Data Collection
In total, four case studies were executed. The reason for using case studies, and not for example surveys, is the possibility of an in-depth (Bell, 2000) and holistic (Merriam, 1994) study of the formulated problem. Moreover, the type of research questions, the level of control on behavioural events and the focus on contemporary events also influenced the choice as advocated by Yin (2009). The data collection methodology of each case study is discussed in more detail below.
Case Study A
The main data source for case study A is participative observations. The research involved social interaction between the researcher and the informants in the milieu of the latter, during which data was systematically and unobtrusively collected as advocated by Taylor and Bogdan (1998). Besides the participative observations, three out of the six data sources for case studies proposed by Yin (1994) were applied: documents, archival records and direct observations. Collection of physical artefacts and interviews were not conducted. The documents and archival records took the form of meeting minutes, emails, presentations, process descriptions and standardised work routines. Moreover, the participating-observations were made by the researcher as an employee in the case company as a financial controller. The direct observations were made at certain performance measurement meetings that were attended in capacity of a researcher.

13
Case Study B
Case study B is multiple and involves two units of analysis (case companies). The case study process is based on the principles of case study design suggested by Yin (1994). The choice of the first case company, the Swedish site, fell natural as the researcher was in service there as a financial controller. The choice of the second case company, the South Korean site, was taken due to a reputable production system, IS/IT capabilities and the cultural aspects of comparing two companies located at different continents. After the choice of case companies a data collection protocol with three components was designed:
• Observations of archived data – Includes the financial database, information systems, operational manuals and processes of the case companies.
• Interview study – Interviews was divided into three parts: opening part with open questions, middle part with semi-structured questions and a closing questionnaire.
• Direct observations – Direct observations were applied consistently over the case study during factory tours, process introductions and meetings.
The open questions purposed to generate an understanding of how each interviewee perceived the PMS, the way of working for keeping it up to date its closely correlated systems and processes. The semi-structured questions are slightly more structured than the initial questions and purposed to generate an understanding of the qualities of certain characteristics of the PMS and in the work of keeping it up to date. The closing interview questionnaire purposed to gauge how well the interviewees believed that their organisation kept the PMS up to date (see Appendix B).
Throughout the case study personal notes were taken during interviews, direct observations and collection of archived data. The databases, manuals and processes were scrutinised in order to create an accurate picture of the process and system capabilities of each case company. The nine members of the executive management board in Sweden were invited to separate interviews that took between 40-60 minutes each to execute and were held at random conference rooms at the manufacturing site.
Seven members of the executive production management board at the South Korean unit were invited to separate interviews that took between 50-70 minutes each to execute and were held at a designated conference room at the manufacturing site. All interviews were executed based on the principles developed by Lantz (1993).

14
Case Study C
Case study C used participative observations as its main data source. In addition, the empirical data acquisition was also made through observations, informal discussions, formal discussions and reflections. Thus, the study was hybrid of structured and unstructured observations (Bell, 2000). Moreover, material such as meeting minutes, emails, presentations and personal notes from meetings were also used as empirical data.
At the end of each day the researcher had time reserved for writing in a case diary. The content of the case diary was composed of analysis, constructions, personal reflections and thoughts of the progress of events as advocated by Merriam (1994). The recommended directions by Taylor and Bogdan (1998) for registration of information were applied to the highest possible extent in order to enhance the empirical collection:
• Be attentive and observant.
• Interchange between broad and narrow focuses.
• Observant regarding key words in the individual’s way of communicating.
• Concentrate on the openings and closings of sentences.
• Mentally recapitulate the progress of events during breaks and pauses.
Even though the chosen method is widely recognised, the challenges of biases and subjectivity associated with it need to be highlighted. Biases and subjectivity impacts on the conception, registration and interpretation of the collected information and an observer can not evade or elude this influence (Merriam, 1994). The limit of this influence comes down to the capability and skilfulness of the researcher, this is further discussed in section 2.5.
Case Study D
In converse to case B, case study D was executed with only one unit of analysis (case company). This case is based on the principles of the design of single case studies advocated by Yin (1994). The applied data collection protocol consisted of three components:
• Observations of archived data – Includes the financial database, information systems, operational manuals and processes of the case company.
• Interview study – Interviews was divided into two parts: opening part with open and semi-structured questions and a closing questionnaire for some of the interviewees.

15
• Direct observations – Direct observations were applied consistently over the case study during factory tours, process introductions and meetings.
The open questions purposed to generate an understanding of how each interviewee perceived the PMS, the way of working for keeping it up to date and its closely correlated systems and processes. The semi-structured questions purposed to generate an understanding of the qualities of certain characteristics of the PMS, in the work of keeping it up to date and its closely correlated systems and processes. The closing questionnaire purposed to gauge how important and complex each interviewee perceived factors constitutional for creating dynamic PMS. The questionnaire was only given to the executive management and first-line managers.
Throughout the case study a diary was kept and personal notes were taken during interviews, direct observations and collection of archived data. The interviewees were divided into two groups depending on their hierarchical belonging in regards to the interview material (see Appendix C). An interview material with nine question areas and a questionnaire were used for the executive and first-line management. In contrast, team leaders and other staff had an interview material consisting of eight question areas. The total interview study mounted up to 20 interviewees with five being executive managers, first-line managers, seven team leaders and two other white collars. All interviews were executed based on the principles developed by Lantz (1993).
2.4 Analysis of Data
Empirics and theories have been analysed simultaneously in multiple rounds. The purpose of this was to ensure that generated results remained practically and theoretically relevant during the entire research process. In order to analyse the data in an established and adequate manner two strategies were applied.
Firstly, the strategy of pattern matching logic has been applied due to its appropriateness in multiple case study research (Yin, 1994). This method of analysis comes down to contrasting patterns discovered in empirics and anticipated equivalences. Secondly, the findings from each separate case study and from the overall research study has been clustered as suggested by Merriam (1994). Clustering implies that findings that resemble each other are grouped in categories. The clustering can be done in several dimensions but regardless the quest is to firstly group findings and secondly to conceptualise resembling trends and qualities (Merriam, 1994).

16
2.5 Quality of Research
2.5.1 Validity
To ensure that the research results are reliable and useful, validation is of utmost importance. The validity techniques applied in this research are based on Olesen’s (1992) five factors of validation and Denscombe’s (2000) seven questions of validation (Table 1).
Table 1: Five factors and seven questions of validation (the seventh question discussed separately).
Five factors of validation (Olesen, 1992)
Seven questions of validation (Denscombe, 2000)
Internal logic – The result is based on known and accepted theories, and that there is a connection between the starting point, the hypothesis and the result.
1. Do the conclusions respect the complexity of the researched phenomenon while being consistent?
Truth - The theoretical and practical results can be used to explain “real” phenomena.
2. Is the chosen approach of examination of the research purpose reasonable and clearly motivated?
Acceptance – That other researchers accept the theories used in the project, and that professionals use tools based on the theory.
3. Has results been triangulated with other sources?
4. Has any alternative explanations been investigated?
Application – That use of the tools leads to the probability for success increasing with repeated use. They do not necessarily lead to success every time, but over a period of time they will give better results than if they were not used.
5. Has the informants been presented the research results and given the opportunity to give their feedback of it?
Novelty value – That new solutions are presented, or that new ways of looking at a particular problem are introduced.
6. To what extend does the research results concur with results and conclusions of existing knowledge within the subject?
Acceptance, internal logic and to some extent, novelty value, are ensured by the review process that the approved academic articles appended to the thesis have been put through. The mixed use of data sources such as participative observations and interview studies has enabled the study of the phenomenon from various perspectives and situations. This mix has contributed to a deeper understanding of the complexity and has contributed to include these nuances in the drawn conclusions.

17
The truth and application of the research conducted has been validated continuously as the research strives for both industrial and academic relevance. The research results of each study were presented to the informants and alternative explanations has been to some extent highlighted and discussed in the findings. By testing the findings and by mixing the data sources within the case studies triangulation has been achieved. The data protocols used for each case study is based on literature studies within the field and earlier findings within the own research. Each informant received a transcribed version of their interview and validated it before the phase of analysis started. Moreover, each company involved in the empirical gathering has validated the content of the academic articles related to their case study before publication. Finally, the findings derived in this thesis do not oppose and contradict results and conclusions made by other researcher within the field.
The seventh question posed by Denscombe (2000) highlights the role of the researcher: has the “self” of the researcher been acknowledged as influencing to the research conducted without distorting the research results?
Several precautions have been made in order to secure that the self does not impact on the quality of the conducted research. When conducting participatory studies at the company, a diary has been written on daily basis containing both research and work related tasks. A reflection part is also included in the diary where the researcher reflects on what has been done and to what purpose.
2.5.2 Reliability
Reliability is, according to Merriam (1994) the extent that the research results can be repeated. Moreover, reliability can also be seen as the ability to execute a test in multiple manners (Arbnor and Bjerke, 1994).
All studies conducted within the presented research have been documented to the highest possible extent, from the initial contact with the companies to the analysis of the empirical data. In two out of four case studies a case diary was written during the study in order to keep track of actions and occurrences.
In general, the documentation of the interview phase of the studies was stronger than the phase of observations of archived data. This is due to the higher level of planning required for the interview phase with creation of interview material and transcription of interviews. In order to amplify the reliability of the presented research in this thesis, the interview documentation for case study B and D have been appended (see Appendix B and C). The presented precautions are in line with those advocated by Yin (1994) regarding documenting the procedures and actions within a case to the highest possible extent.

18

19
3. Frame of Reference
The frame of reference introduces the theoretical framework of the research.
This section presents the two literature studies described in section 2.3.1. Four sections distinguish this chapter: Initially, the theoretical development in the field is presented from a historical perspective, both in general and from an
operations management perspective. Secondly, the balanced scorecard framework is presented in order to give the reader an insight of the most impacting framework within the field of performance measurement. Thirdly, the state of the art of dynamic performance measurement systems is presented. Finally, a reflection over the state of the art ends the chapter. Moreover, Appendix A defines the key terms adopted in this research and hence supports
the frame of reference.
3.1 Performance Measurement, a Historical Aspect
No universal narrative exists explaining the evolution of the field of performance measurement from genesis to its contemporary condition. However, some researchers have tried to classify the field into distinctive time periods and phases. From an operations management perspective, Radnor and Barnes (2007) argues that the evolution performance measurement can be divided into three distinctive time periods in continuous evolution; the early twentieth century, post WWII and mid 1980s. The transition between these eras should not be seen as revolutionary or sudden but bevelling (Radnor and Barnes, 2007). In converse, Ghalayini and Noble (1996) perceive the performance measurement literature to be divided into only two phases, 1880s and 1980s. Neely (1999) also emphasis the two phase evolution of the field, and argues that in the transit between 1980s and 1990s a performance measurement revolution occurred with seven underlying reasons. The detachment of ownership and management and the introduction of the tableau de bord in France also influenced the progress of the field (Brudan, 2010). Irrelevant of how the periods of evolution are classified, it stands clear that the field of performance measurement has evolved from being heavily focused on efficiency and financial measures to balanced approaches with both efficiency and effectiveness as focal points.
3.1.1 Scientific Management and the DuPont Model
Two events have had great impact on the application of performance measurement in the beginning of the 20th century. The first event is focused on
20
the use of performance measurement in operations management. When Frederick Taylor introduced scientific management he set a new paradigm for the behaviour of management. Taylor built his philosophy around the principle that management was responsible of devising the most efficient method of performing work. By devising the most efficient methods of work, increased efficiency and output of individual workers would be derived. New and improved methods were derived via analysis of existing work methods and the performance of these new methods was then closely monitored through the use of performance measures (Radnor and Barnes, 2007).
The second event concerned the measurement of performance for a whole business. The DuPont model was developed in the beginning of the 20th century and incorporated nearly all basic methods that were used to manage big businesses long after its creation (Chandler, 1977). Due to the penetrating power that the model had when it was introduced, the financial measures that it consisted of became widely adopted (Neely and Bourne, 2000). Some have even argued that the work of DuPont and General Motors was the genesis of the field of performance measurement (Tangen, 2004).
These two events resulted in that performance measurement, from a micro perspective, were used to assess productivity in operations management (Radnor and Barnes, 2007), and from a macro perspective to gauge the performance of companies (Neely and Bourne, 2000). With the labour intense operations of the early twentieth century, performance measures appropriately emphasised cost with a focus on financial measures such as productivity, profit and return on investment (Ghalayini and Noble, 1996).
3.1.2 Human Relations Movement
Regardless of the widespread impact of scientific management, the theories of Frederick Taylor were not without critics. The human relations movement, which had it origins in Elton Mayo’s Hawthorne experiments and Abraham Maslow’s hierarchy of needs amongst others, argued that scientific management had a heavy focus on the technical aspects of productivity while neglecting their social equivalences (Radnor and Barnes, 2007). The arguments of the human relations movement were not without scientific support. The experiments at the Hawthorne plant are credited for providing new groundbreaking scientific foundations for management (Smith, 1998). The studies were conducted between the years 1927 and 1932 and examined productivity correlated to work conditions. Benevolent supervision and affection for employees proved to be positively correlated with performance and it was concluded that people were motivated by more than financial
21
incentives and that that employees achieved best and generated most motivation in humane milieus (Geber, 1986).
Due to the gained popularity of the human relations movement and the low unemployment rates in the era of post WWII, employers were pressured to increase the quality of working in order to retain and attract qualified personnel. As a consequence of these unfolded events, workers were given additional influence over work practices and standards. Frederick Taylor’s paradigm of close monitoring of individual workers was gradually replaced with productivity measures on team levels and experiments such as self-managed teams (Radnor and Barnes, 2007).
3.1.3 A New Paradigm
Globalisation started to change the rules of making business, trade barriers were lowered and successful companies started to compete in an international arena and regarded the world, and not only their nations, as their market (Rolstadås, 1998). In the 1970s the unquestioned position of the American management style became challenged as western manufacturers were pressured by acute competition from Japan. Consumers experienced that Japanese goods were superior in both quality, variety and competitively priced and Western manufacturers were forced to overlook their practices (Radnor and Barnes, 2007). The pure financial way of measuring performance was not longer perceived as an appropriate way of managing a modern business, the widely adopted practices that had realised strong penetrating power after the DuPont model was introduced had hardly been modified since the beginning of the 20th century (Neely and Bourne, 2000). The most apparent difference between Western and Japanese manufacturers was that the former solely focused on efficiency while the latter equally emphasised efficiency and effectiveness. In order to recapture their competitive edge, companies re-evaluated their strategic priorities from solely low-cost production to delivery, short lead time, quality and flexibility (Ghalayini and Noble, 1996).
Due to the change in business environment, the limitations of traditional measures became evident. Measuring performance via solely financial measures became heavily criticised. Kennerley and Neely (2003) for instance, argued that it is broadly accepted that the information provided by cost based systems is insufficient for the effective management of businesses in changing and competitive markets. Skinner (1974) states that the traditional performance measures lack a strategic foundation and fail to succeed in delivering data on quality, responsiveness and flexibility. Najmi et al (2005) concurs and argue that traditional performance measures fail to convey strategies and priorities in
22
an effective manner within an organisation and Kaplan and Norton (1992) states that traditional measures are too internally focused.
Furthermore, the impact of the shift in correlation between the tangible book value and market value of firms also contributed to the discontentment of traditional performance measures. A study conducted 1982 concluded that the tangible book value represented 62 per cent of the market value of industrial organisations. In contrast, similar studies conducted at the turn of the century showed the tangible book value had shrunken and only represented 10 to 15 per cent of market value. In the process of creating value, the influence of tangible assets had diminished over time and focus has been inevitably put at intangible assets such as customer relationships, innovative products, high quality operational processes, efficient information systems and employee capabilities, further strengthening the argument of the need to abandon sole financial performance measures (Kaplan and Norton, 2001a).
As a consequence of these events and the new competitive reality, companies around the world started to rethink how to measure the performance of their businesses (Eccles, 1991). Balanced and multi-dimensional measurement concepts such as the performance measurement matrix (Keegan et al, 1989), the balanced scorecard (BSC) (Kaplan and Norton, 1992) and Cross and Lynch’s performance pyramid (1988) emerged. These concepts were proactive and emphasised a balance between financial, internal measures and non-financial, external measures (Bourne et al, 2000).
3.2 The Balanced Scorecard (BSC)
As mentioned earlier, the available literature within the field of PMS is vast. According to Neely (1999) statistics show that between the years of 1994 and 1996, 3615 articles were published. Further, in America alone, a new book in the field of performance measurement emerged every fortnight. However, regardless of the amount of literature available, one PMS has had a higher impact than any other framework within the field. Several citation/co-citation analysis point at the undeniably dominance of the BSC framework (Marr and Schuma, 2003; Neely, 2005). The BSC is perhaps the best known PMS existing (Neely et al, 2005) and has been widely adopted in practice (Rigby, 2001). The framework has even been listed as one of the most important management tools of the last 75 years by the Harvard Business Review (Bourne et al, 2002). Over the course of time, the originators have continuously refined the BSC (Andersen et al, 2004) and today three generations of the concept exist (Lawrie and Cobbold, 2004). Kaplan and Norton (2006) argue that the BSC has since the introduction evolved to a system for managing the execution of strategy.

23
3.2.1 The First Generation BSC
The BSC was developed 1992 by Robert Kaplan and David Norton based on the notion that sole reliance on financial measures in management systems is insufficient. The idea was to use a balanced set of measures to allow executive managers to take a fast but comprehensive look at four crucial perspectives of business (Kaplan and Norton, 1992; 2001b). These perspectives are derived to provide answers to four paramount questions illustrated in Figure 6:
• How do we look to our shareholders? (financial perspective)
• What must we excel at? (internal business perspective)
• How do our customers see us? (the customer perspective)
• How can we continue to improve and create value? (innovation and learning perspective)
Figure 6: The balanced scorecard (Kaplan & Norton, 1992).
The BSC uses financial performance measures as tools to display results of taken actions. Moreover, the model deploys operational non-financial performance measures to assess drivers of future financial performance. The purpose of streams of information from several directions in combination with a limited set of measures is to guard against information overflow, sub-optimisation, combining disparate elements in a single report and to keep the focus at the most crucial aspects of business (Kaplan and Norton, 1992).
3.2.2 The Second Generation BSC
The relationship between strategy and performance measurement was amplified in the second generation of the BSC (Kaplan and Norton, 1996b; 2001a). The linkage between measures and the cause and effect relationships

24
that strategy is founded upon became the focus point (Kaplan and Norton, 1996a). The biggest addition to the second generation BSC was the concept of strategy maps (Lawrie and Cobbold, 2004). A Strategy map helps to create a clear line regarding how jobs are linked to overall objectives of the organisation and gives a mean for clearly communicating the strategy (Niven, 2006). Moreover, they provide a visual representation of critical objectives and the relationships among them that drive organisational performance and show the cause and effect relationships (Figure 7). Further, strategy maps allow companies to describe and communicate the value of both tangible and intangible assets (Kaplan and Norton, 2000).
Figure 7: Strategy maps (Kaplan and Norton, 2001a).
3.2.3 The Third Generation BSC
The third generation BSC is a refinement of the earlier generation of the concept in order to further amplify the functionality and strategic relevance. The additions made to the third generation BSC are a destination statement and an additional concept of strategic linkages. The destination statement is a quantitatively detailed description of what the organisation is likely to resemble at a set future date (Lawrie and Cobbold, 2004) and the concept of strategic linkages is a simplification of the strategy maps depicted in Figure 7.

25
3.2.4 Applauded and Criticised
Even though the impact of the BSC is well documented, critics have not been sitting in silence. Ghalayini et al (1997) argues that the weakness of the BSC is that it is conceptualised as a tool of controlling for senior managers, and is not applicable at factory operation levels. Furthermore, another weakness is the lack of a competitor perspective. Smith (2005) argues that the BSC is weak in the contribution to employees and suppliers, that the concept is silence on the selection of measures and that it failure to address HR issues and strategic uncertainties. Neely et al (2001) argues that even though the BSC has been pioneering, the world has moved on to new priorities that are not reflected in the framework. Brignall (2002) argues that the linear nature of the tools for designing and implementing the BSC is the problem, strategy maps assume rationality between factors of performance when those relationships are recursive and irrational in practice. Neely et al (2000) develops it further by stating that even though the concept is valuable, it provides little guidance on how appropriate measures can be identified, introduced, and used to manage business. Further, little empirical evidence is available on the relationship between non-financial measures and financial performance (Banker et al, 2000) and despite the fact that the implementation of the BSC been highly recommended in the literature, the majority of organisations are still relying on traditional financial performance measures Gosselin (2005). Moreover, empirics from KPMG management consulting indicate that the overall failure rate of BSC implementation is around 70 percent (Debusk and Crabtree, 2006).
3.3 The Relationship between Measures and Strategy
It is widely recognised in literature that performance measures need to achieve alignment with strategic priorities (Keegan et al, 1989; Dixon et al, 1990; Lynch and Cross, 1991; Kaplan and Norton, 1993; Neely et al, 1994; Bititci, 1995; Neely et al, 1996; Bourne et al, 2000; Bititci et al, 2001; McAdam and Bailie, 2002; Hass et al, 2005; Melnyk et al, 2005; Kaplan and Norton, 2008; Lima et al, 2009). The link between measurement system and strategy is powerful if achieved, creating alignment between the two components will provide information on whether the strategy is being implemented and encourage behaviours consistent with it (Neely, 1999). Further, a successful cascading of performance measures from the strategy will maintain a common focus throughout the organisation (Cokins, 2004).
Tapinos et al (2005) argue that performance measurement has a significant influence in supporting the achievement of the goals of an organisation and in the effectiveness and efficiency of its strategic planning process. Feurer and Chaharbaghi (1995) argue that in the current dynamic environment, the

26
selection of the measures must be continuous process and that constant review and projection for future measurement requirements are necessary. In an analysis based on the common characteristics of PMS in the literature, Taticchi and Balachandran (2008) concur and list communication/alignment as one of the most desirable features of a PMS. According to Neely et al (2005) measurement systems should be deployed as part of strategic management systems. Measures should hence be derived from strategy and provide consistency for actions and decisions. A literature study conducted by Johnston and Pongatichat (2008) concluded that the benefits of strategically aligned performance measures are:
• Informing the organisation regarding the direction, priorities and implementation of strategy and influences consistent behaviour with it.
• Creating a shared base of understanding and aligning short-term actions with long-term goals.
• The links between the performance of individuals and sub-units are made clear and goals and means are made visible.
• Integration among organisational processes.
• Limiting overemphasis on local objectives, thus reducing sub-optimisation.
• Focusing change efforts and permitting and encouraging organisational learning.
3.4 State of the art of Dynamic Performance Measurement Systems
As Kennerley and Neely (2002) concluded, unlike the context that PMS operate in, they appear to be static. Empirics indicate that the strategic direction of a company has limited influence at the PMS (O´Mara et al, 1998; Ittner and Larcker, 2003). The dense research and literature within the field is concentrated on the design and implementation of measurement systems, far less has been done in regards to how to keep PMS continuously up to date. However, there are some exceptions, in the coming sections four frameworks will be presented that deals with the problem of keeping PMS up to date and dynamic. Kennerley and Neely (2003) addresses the challenge from a wide perspective while Bititci et al (2000) puts information technology in focus as a possible solution. Najmi et al (2005) takes a hierarchical approach and Ghalayini et al (1997) proposes the combination of three tools in order to create dynamic PMS. Other investigations that address the problem (Farris et al, 2011; Van Aken et al, 2005) have been excluded due to their perceived narrowness. Moreover, the concept of Hoshin Kanri that offers a method to cascade and update strategies and goals in an organisation (Witcher, 2002;

27
Witcher, 2003; Jackson; 2006; Witcher and Chau, 2007) has been left out due to its focus on the lean principles of manufacturing systems rather than PMS.
3.4.1 Framework of factors affecting the evolution of PMS
The first framework is arguably the most comprehensive presented in this thesis and has been developed over three articles (Kennerley and Neely, 2002; Kennerley and Neely, 2003; Kennerley et al, 2003). Through empirics gathered from seven case companies, a wide array of enablers and barriers to the evolution of PMS were compiled and broadly categorised under four critical factors; culture, process, people and systems (Figure 8):
• Processes – Existence of a process for reviewing, modifying and deploying measures.
• People – The availability of the required skills to use, reflect on, modify and deploy measures.
• Systems – The availability of flexible information technology that enable the collection, analysis and reporting of appropriate data.
• Culture – The existence of a measurement culture within the organisation ensuring that the value of measurement, and so the importance of maintaining relevant and appropriate measures, is appreciated.
Besides the four categories, internal and external triggers to modification of the PMS are also listed. These triggers can and often do disrupt the normal evolution patterns (Kennerley et al, 2003). The originators argue that the evolution of a system is possible through execution of three phases, namely reflection, modification and deployment. These three phases form a continuously evolutionary cycle (Figure 9):
• Reflection on the existing PMS to identify where it is no longer appropriate and where enhancements need to be made.
• Modification of the PMS to ensure alignment to the organisation’s new circumstances.
• Deployment of the modified PMS so that it can be used to manage the performance of the organisation.

28
Figure 8: Barriers to and enables or measures evolution (Kennerley et al, 2003).
In addition to the three phases a pre-requisite is formulated for enabling evolution. The prerequisite to any evolution is the active use of the PMS. This requires that the PMS is used to manage the business so that the importance of the measures is demonstrated throughout the organisation (Kennerley et al, 2003). In the framework the originators have defined the PMS as a composition of three fractions, the individual measures, the set of measures and the supporting infrastructure (Figure 9). The three phases of the evolution requires the reflection on all components of the PMS.
In order to effectively manage the evolution of the PMS, organisations must relate the enabling factors to the three phases of evolution. Further, the originators developed a maturity model to be used as an assessment tool. The model lists how well developed culture, processes, people and systems are in relation to the requirements of the three evolutionary phases on a five level scale (Kennerley and Neely, 2002; Kennerley et al, 2003). Once developed, the framework was put to test in a longitudinal study at a UK case company. The findings of the study supported the content of the framework.

29
Figure 9: Framework of factors affecting the evolution of PMS (Kennerley and Neely, 2003).
3.4.2 The integrated model
This framework takes a different approach from the first and puts information technology in centre. Bititci et al (2000) has developed a model (the integrated model) based on research that purposed to explore the use of IT based management tools as self-auditing dynamic PMS. The model is influenced by earlier research results, developments of IT based management tools and characteristics of existing PMS such as the BSC (Kaplan and Norton, 1992), SMART (Cross and Lynch, 1988) and PMQ (Dixon et al, 1990). Within the integrated model, a PMS needs to be dynamic by:
• Being sensitive to changes in the external and internal environment of an organisation.
• Reviewing and reprioritising internal objectives when changes in the external and internal environment are significant enough.
• Deploying the changes to internal objectives and priorities to critical parts of the organisation, thus ensuring alignment at all times.
• Ensuring that gains achieved through improvement programs are maintained.
The required capabilities for a dynamic PMS are divided into two categories: frameworks capabilities and IT platform capabilities. Firstly, the framework capabilities must include an external control system which uses performance measures to continuously monitor the critical parameters in the external environment for changes. Secondly, an internal control system is needed which uses performance measures to continuously monitor the critical parameters in

30
the internal environment for changes. Further, a review mechanism which uses the performance information provided by the internal and external monitors and the objectives and priorities set by higher level systems to decide internal objectives and priorities must be included.
A deployment system which deploys the revised objectives and priorities to business units, processes and activities using performance measures is required. Finally a set of systems which; facilitates the management of the causal relationship between various performance measures, quantification of the casual relationships to quantify criticality and priorities, ensures that gains made as a result of improvement initiatives are maintained through local performance measures used by the people who work within activities and processes and finally a system that facilitates identification and use of performance limits and thresholds to generate alarm signals to provide early warning of potential performance problems. For the IT platform, four requirements were also identified:
• The IT platform has to provide an executive information system not just a means of maintaining the PMS.
• The IT platform must be capable of accommodating and incorporating all the elements of the framework as specified above.
• It should be integrated within the existing business systems, i.e. integrated within the existing ERP environment.
• It should be capable of handling simple rules to facilitate performance management, e.g. raising of alarm signals and warning notices.
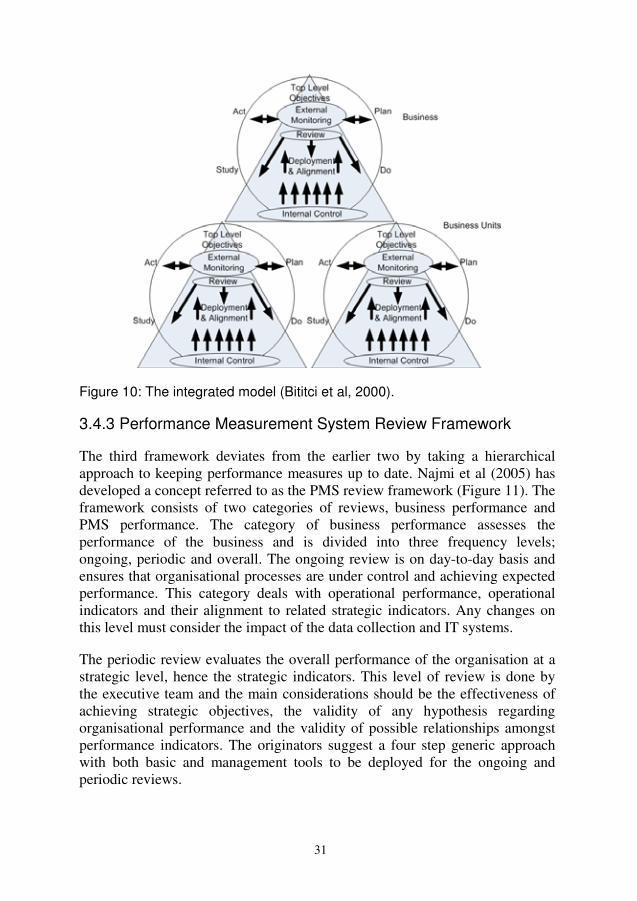
In reality the need for change is not always driven for the top of the organisation or company, infrequent events can trigger a review of objectives and goals for a business unit that prompts it to review the whole measurement system in order to contribute more and better to the organisations overall objectives. So, instead of having one model applied for the whole business it should be perceived as several models that are interlinked throughout the business as illustrated in Figure 10.
31
Figure 10: The integrated model (Bititci et al, 2000).
3.4.3 Performance Measurement System Review Framework
The third framework deviates from the earlier two by taking a hierarchical approach to keeping performance measures up to date. Najmi et al (2005) has developed a concept referred to as the PMS review framework (Figure 11). The framework consists of two categories of reviews, business performance and PMS performance. The category of business performance assesses the performance of the business and is divided into three frequency levels; ongoing, periodic and overall. The ongoing review is on day-to-day basis and ensures that organisational processes are under control and achieving expected performance. This category deals with operational performance, operational indicators and their alignment to related strategic indicators. Any changes on this level must consider the impact of the data collection and IT systems.
The periodic review evaluates the overall performance of the organisation at a strategic level, hence the strategic indicators. This level of review is done by the executive team and the main considerations should be the effectiveness of achieving strategic objectives, the validity of any hypothesis regarding organisational performance and the validity of possible relationships amongst performance indicators. The originators suggest a four step generic approach with both basic and management tools to be deployed for the ongoing and periodic reviews.

32
The overall review assesses the validity of the mission and vision statements and whether the strategic objectives still supports these statements. This review level takes into account all internal and external factors (SWOT analysis) affecting the overall direction of the organisation. Further, the whole system is reviewed systematically to ensure its effectiveness and efficiency. A four step approach to the overall review is provided and support tools such as the EFQM self-assessment model are proposed. The second review category, the PMS performance, deals with the efficiency and effectiveness of the PMS actual measuring capabilities. Further, this category also assesses the accuracy of the mapping of the business onto the PMS and the efficiency of the PMS process.
Figure 11: PMS Review Framework (Najmi et al, 2005).
3.4.4 The Integrated Dynamic Performance Measurement System
The fourth framework presented revolves around the combination of three tools in order to create a dynamic PMS. Ghalayini et al (1997) have developed a framework labelled the IDPMS (Integrated Dynamic Performance Measurement System). IDPMS combines three existing tools to integrate management, process improvement teams and the factory shop floor. In the framework the management determines the areas of success. The process improvement teams focuses on improving performance and continuously updating the performance standards for the factory shop floor. The factory shop floor collects and analysis data for day-to-day decision making. The relationships and linkages between the three function areas are further outlined in Figure 12. The tools used in this model are the PMQ (Dixon et al, 1990), the half-life concept and the MVFCT (modified value-focused cycle time). The PMQ will be addressed separately in the next section. The underlying premise

33
of the half-life concept is that defects will be halved if legitimated process improvement efforts are put in place. The MVFCT is a diagram that models manufacturing processes accurately so that employee-based teams can improve processes from a holistic perspective. The originators argue that the IDPMS facilitates dynamic updating of the general areas of success, performance measures, performance measures standards, performance indicators and performance indicator standards.
Figure 12: Integrated Dynamic Performance Measurement System (Ghalayini et al, 1997).
3.4.5 Other frameworks and related empirical studies
Dixon et al (1990) have developed a tool named the performance measurement questionnaire (PMQ) that is described as a process for changing performance measures. The PMQ is a questionnaire consisting of four parts that allows respondents to gauge improvement areas, performance factors and personal performance measures. The idea is to depict the PMQ results from the various functions and management levels of an organisation against each other using four statistical tools; alignment, congruence, consensus and confusion. The statistical results are then used as input for an evaluation meeting among the functions with the purpose to foster commitment around necessary changes of the PMS and develop an action plan for these changes.
Waggoner et al (1999) have developed a framework of impacting forces of PMS evolution and change. The framework is derived from a cross-disciplinal literature study involving the fields of operations management, social

34
psychology, management accounting and organisational behaviour. The four principal categories of force that can, according to the originators, shape the evolution of organisational PMS (see Figure 13).
Figure 13: Forces impacting performance measurement system evolution and change (Waggoner et al, 1999).
Searcy et al (2007) argue that formal systems criteria can help organisations coping with the challenges of designing, implementing and evolving their systems. Franco and Bourne (2003) showed in a study that the most important factors for managing with performance measures are: organisational culture, management leadership and commitment, a compensation link, education and understanding, communication and reporting, review and updating, IT, a structured framework and the industry and business needs. Bourne et al (2000) argues that in order to continuously updating PMS in manufacturing companies four processes needs to be in place:
• A process to review targets of current measures.
• A process to review current measures.
• A process to develop new measures.
• A process to challenge the strategy.
Bititci et al (2006) concluded over five case studies that PMS are involved in a bi-directional relationship with management style and organisational culture, the PMS can affect culture and leadership style, and culture and management style can shape the success of the PMS. Hence, in order to succeed in the use of the PMS, organisational culture, management style and the PMS structure need to evolve at the same pace as the PMS. In a study conducted by Townley et al (2003) several parameters were identified as impacting on the measurement system over time, enthusiasm being replaced by scepticism and

35
disillusionment, failure to manage change appropriately, underestimation of the required effort, lack of commitment for change, political issues and the degree of involvement of employees.
3.5 Reflection
Even though the challenges of creating dynamics in PMS are evident, the state of the art within the field is arguably limited. Under section 3.4, several frameworks have been identified and described. The frameworks attack the problem from different approaches. With exception of the Kennerley et al (2003) and Waggoner et al (1999) frameworks, the scope of the presented frameworks is narrowed down to a technical and process based approach. However, it should be noted that the Kennerley and Neely framework is based on an interview study with 25 managers from seven companies whereof only two in manufacturing (food packaging and printing machinery) (Kennerley and Neely, 2002). Section 3.4.5 asserts that subjective factors such as organisational politics, employee involvement and commitment play an important role in keeping the PMS up to date. Considering some of the presented frameworks in isolation might raise the questions whether they are even relevant to be presented in this thesis. However, if the various strengths, or perspectives, of the frameworks would be observed jointly a more complete picture of an adequate dynamic PMS might uncover.

36

37
4. Paper Summary
This chapter summarises the four appended papers. The purpose of the chapter
is to give the reader a short but comprehensive description of each paper. All four papers are based on the literature studies and case studies described in section 2.2. The chapter shortly presents the purpose, the chosen method and
the main findings of each paper.
4.1 Paper I
The purpose of Paper I is to discuss how to achieve a dynamic and flexible PMS applicable for manufacturing sites. The analysis is based on a literature review of major performance measurement schemes as well as a problem identified in industry. Paper I introduces an industrial case where the current measurement practices are evaluated and put in relation to the findings made in the literature study. Important aspects for future research within the field as well as at the case company are discussed.
From the literature study, it is concluded that change has become more frequent and at a broader horizon, putting pressure on more dynamic and flexible solutions. There is a need for a dynamic (long term response to contextual change) and flexible (short term response to contextual change) PMS that is to be characterised by the ability to cope with rapid organisational and business cyclical changes. Furthermore, the continuous management of the PMS is vital, not only adding extra indicators and measures as priorities change, but in fact removing old priorities. The case company in paper I had two processes in place for keeping the PMS updated, one at the top level and one at the lower level of the organisation. However, due to the non-existence of a connecting link or structure, the organisation had no coherence between the two processes. The short term consequence of the missing link was prolonged and unarticulated decision making. The long term consequence was an overhanging risk of breakdown of the PMS and extraordinary costs of restructuring it.
The conclusion of Paper I is that the future research agenda in the field of performance management must focus on deriving a dynamic and flexible process to support the measurement system due to the general limitations of current performance measurement frameworks.

38
4.2 Paper II
The purpose of Paper II is twofold, firstly to single out and present theoretically crucial characteristics for dynamic and flexible PMS. Secondly, to investigate to what extent the theoretical parameters are applied in practice through a case study. The case study involves two case companies (manufacturing units) and amounted in total to 16 interviews.
The literature review singled out eleven factors deemed crucial for dynamic and flexible PMS: on-going management, evolution, alignment and cascading of measures, processes, people, systems, culture, ownership, data quality and structured way of working.
The study showed that the case companies applied different approaches to the review and on-going management of their respective PMS. The first company created a process for updating the PMS on a quarterly basis whilst the second company linked the review of the PMS to the yearly update of the business plan. The IT-system design proved to be crucial for the quality of measurement data. The first company had problems with high manual impositions and quality of data whilst the second company had a fully integrated and automatic system producing reliable data. Even though respective case company displayed strengths and weaknesses, neither was deemed to have a dynamic PMS.
The conclusion derived in Paper II is that in order to be able to revise measurement systems without deploying extensive resources companies should start off with aligning their measures throughout the organisation. If alignment is reached between measures and objectives a base is set for efficiently evolving the PMS.
4.3 Paper III
The purpose of Paper III is to present key contributing factors for creating dynamic abilities in a production PMS. The factors are derived by contrasting a case study to findings made in a literature study. The case presented is a participatory study that stretches over 10 months and follows a project leader with the task of re-designing and implementing a support structure for a production PMS.
The literature study listed parameters deemed important for dynamic PMS that was then put in comparison to the case study. The comparison showed that all the parameters found in literature affect the evolution of a PMS to some degree. The case company had a process in place for updating the PMS that was

39
theoretically sound. However, the potential of the process was never realised in practice due to several problems. The process was poorly documented, coordinated and structured. Moreover, the lack of understanding in the organisation regarding the requirements of change had an impact on the process.
The main findings of Paper III are that all the parameters found in literature and put to test affect the evolution of the PMS to some degree and the emergence of four additional factors: information transparency, proactive coordination, documented process and visual traceability. From the drawn conclusions, the factors affecting dynamic PMS can be divided under four sub-headings as advocated by Kennerley and Neely (2002): processes, culture, systems and people. Processes for reflection/review, deployment, modification and coordination need to be in place. A culture that strives for commitment to change, high involvement of employees, and appreciation of performance measures is also required. Further, systems for flexible handling of data and information are needed. Finally, the knowledge and skills of the people to handle the various processes and systems and facilitate the culture are required.
4.4 Paper IV
The purpose of Paper IV is to analyse the key factors for creating dynamic abilities in a PMS in order to manage the operations/strategy interface. The paper is based on a literature study of dynamic PMS and a case study. The case is executed at a manufacturing site in Australia belonging to a global truck manufacturer. In total the study is composed of 20 interviews stretching from team leaders on the factory floor to the general manager of the manufacturing site.
Five frameworks addressing the issue of creating dynamic PMS are presented as a result of the literature study. The case company displayed a PMS highly integrated to the operational management system (OMS). The interview results showed that no distinction between the systems seemed to exist, the organisation perceived the PMS and the OMS as one system. The OMS/PMS is not based on a given theoretical model but developed to fit the needs of the company. Through the OMS, the PMS is linked to the business plan process of the company. The business plan is used to generate strategically aligned goals and performance measures for the OMS and hence the PMS.
In order to update the PMS, the company executed a review process twice a year. The review process is based on a meeting structure with the initial and closing meetings held by the executive management team. The intention of the management was to involve the whole organisation in the review process.
40
However, due to crippling cultural, management and employee factors the production teams were not involved. Moreover, even though not crucial to the limitation of the dynamic abilities of the PMS in this case study, the IT-system was deemed to be time consuming and inflexible.
The main finding of Paper IV is the identification of five broad factors that need to be fulfilled by manufacturing organisations in order to create dynamic PMS: review process, information technology, management, culture and employees. Further, it was concluded that it is not adequate to acquire the capabilities listed under one or two of the five factors, in order to realise a dynamic PMS all five need to be existent. This became evident by the crippling effect that the culture, management and people had on an otherwise solid review process. Finally, in order to realise the factors in practice the PMS design and context needs to be considered due to the high level of integration between the overall management system and PMS displayed in the case study.

41
5. Empirical Findings
This chapter summarises the empirical findings made in this thesis. Four case
studies have been executed in total. The case studies are presented in chronological order with purpose, findings and conclusions. The empirical findings chapter presents the case studies thoroughly in contrast to the papers
where conference guidelines and subjects limited the empirical presentation. The data collection methods applied in the cases has been described under section 2.3.
5.1 Case Study A 5.1.1 Purpose
The purpose of case study A was to investigate the requirements of creating performance measures that reflect the business environment over time. The case was performed at a manufacturing unit producing components for heavy constructional machines in the region of Mälardalen, Sweden.
5.1.2 Findings
It was evident from the documents and archival records that the deployed PMS at the case company had similarities to a BSC in the sense that both emphasised the mix of financial and non-financial measures. However, the content of the PMS had been customised for the business needs of the case company and not after the four perspectives of the balanced scorecard.
The direct and participative observations showed that the decisions regarding what to measure was based on a combination of management discussions and directives from a global performance measurement initiative. Once decided upon what to measure on the top of the organisation a deployment process (result plan process) was used in order to cascade the measures throughout the organisation.
From the studied documents, it was evident that the global performance measurement initiative covered the breakdown of corporate strategies to functional and divisional goals and measures. In contrast, the deployment process was used to ensure alignment of measures in daily operations across the organisation. Moreover, the deployment process was also used to foster a

42
result culture within the organisation and to involve employees and managers alike through cascading the ownership in the organisation.
The PMS, deployment process and global initiative are three interlinked mechanisms that all are part of the overall management system. The global initiative is linked to the strategy phase, the PMS to the goal setting phase and deployment process to the execution phase. However, as the participative observations showed, no clear link existed between these three mechanisms. Hence, alterations of the performance measures made by the top management team were not always cascaded down the organisation through the deployment process. It became evident from the observations made that no process existed to facilitate and cascade changes between none of the three mechanisms. The consequence was a missing link between the macro and micro levels of performance management at the company.
5.1.3 Conclusion
The conclusion of case study A is that a process is needed to manage the PMS through change. The lack of a coherent process at the case company resulted in disintegration between macro and micro levels of performance management of the company (Salloum and Wiktorsson, 2009, Paper I).
5.2 Case Study B
5.2.1 Purpose
Case study B purposed to describe the characteristics of a dynamic PMS and investigate to what extent they are applied in practice. The study involves two case companies (manufacturing units), the first (MU-A) was located in the region of Mälardalen, Sweden, and manufactures components for heavy constructional machines. The second (MU-B) was located in South Korea and processes, manufactures and assembles heavy constructional machines. In total, 16 interviews were conducted, nine in Sweden and seven in South Korea. The interviews were held with the respective management team of each manufacturing unit (Salloum et al, 2010, Paper II).
5.2.2 Findings
From the interview results it became evident that MU-A had a measurement system that generated contradicting results. The contradicting results were a consequence of a gap regarding the standardisation and documentation of the handling and way of working within the PMS. Due to this gap, definitions and the ways data was generated could differentiate from time to time and department to department. The direct observations showed that meetings

43
dedicated to break down strategy existed but were organised ad-hoc and a business plan was absent, weakening the alignment of strategy and performance measures. Even though the various components of a business plan existed in the organisation they were not compiled into an explicit document.
From the archival data gathered it became evident that MU-A deployed a tool labelled the result plan that purposed to enhance result oriented culture and ensure that measures and objectives are cascaded throughout the organisation. As part of this tool, quarterly meetings are held with the purpose of reflecting and updating goals and performance measures. The tool was used by the whole organisation; managers, white collars and production teams alike. The only difference was that the tool was personal on all levels of the organisation except for production teams and cross-functional production teams were it was owned by the teams. On the result plan both strategic and operational performance measures and goals were deployed and tracked. The plan consisted of overall measures decided upon by the top management team, such as delivery precision and internal PPM, and supportive measures decided upon by the owner of the tool.
The interview results revealed that even though the result plan process enhanced the evolution of measures, the process was crippled due to the non-existence of a re-loop mechanism ensuring that the way of working was established throughout the organisation. Once the tool was introduced it was decided upon how it would look like and what it should contain. But with time, concessions were gradually made by the management regarding the content and design until every document with a set of performance measures could be justified as a result plan.
The PMS and the result plan process was part of the overall management system in MU-A. The direct observations and archival data showed that the result plan process was integrated to the day-to-day management control of the organisation. MU-A used multiple IT systems with comprehensive manual impositions for generating performance measures and PMS reports. The interview results clearly showed that this had a negative effect on the quality of the data. The respondents expressed that they viewed the quality of data as correlated to the viability of the PMS over time. The consequence of the output with low quality was a decrease of trust, importance and will to keep the PMS up to date. One respondent wondered why the organisation would bother sacrificing time and resources updating a PMS that does not always provide information reliable enough to take decisions upon.
In contrast to MU-A, the MU-B interview results showed that it used a business plan approach to deploy and continuously update their PMS. Once a year, the business plan was reviewed and changes were given to the performance

44
measure owners. The changes involved anything from replacing or abolishing a performance measurement to altering the definition or target level. The performance measure owners further cascaded the measures down the organisation. Once cascaded the measures are followed up depending on the nature of it, from daily to monthly. The PMS was integrated to the whole management system. In the management system, the strategy and business plan served as input to the PMS whilst the PMS served as input to the financial processes. The focus of the business plan process was to cascade and align the PMS to the strategy. The on-going management of the measurement system was out of the scope of the business plan process.
The interview results indicated that any changes occurring between the annual business plan process was communicated to the whole organisation through recognised means. Any alterations to the business plan process were done by the process development department. The information system was deemed by the interviewees in MU-B to be highly flexible. From archival data and direct observations it was evident that the organisation had managed to integrate the information needs of the production, finance, sourcing and maintenance departments into one IT system. The interview results showed that this made the information handling flexible, of high quality and in principal free from manual impositions from a day-to-day performance measurement perspective. Consensus was reached among the MU-B interview respondents that the quality of data was important for the long term survival of the PMS. However, MU-B had no problems with the quality and deemed it to be consistently high and reliable.
5.2.3 Conclusion
The conclusion made in case study B strengthens findings made by other researchers regarding the lack of dynamic capabilities of existing PMS. The two manufacturing units displayed different strengths and weaknesses but neither had the full capabilities advocated in theory for a dynamic PMS. MU-A lacked a structured way of handling its process and was challenged by the quality of the IT system output which it perceived as critical. On the other hand, MU-B did not have a way of working for changes between the annual business plan process.

45
5.3 Case Study C
5.3.1 Purpose
The main purpose of case study C is to find key contributing factors for creating dynamic abilities in a production PMS. Further, the case also investigates how the factors can be systemised and realised. Factors derived from a literature study are contrasted to a case study mainly based on participative observations. The study was conducted at a manufacturing unit producing components for heavy constructional machines in the region of Mälardalen, Sweden. The case stretched over 10 months and followed the re-design and implementation of a support structure for a production PMS.
5.3.2 Findings
From the archived documents and direct observations it was clear that the case company deployed a PMS that consisted of a set of performance measures based on both operational and strategic objectives. In order to cascade, update and link tasks and actions to the performance measures a process labelled the result plan process was deployed. The vision of the result plan process was to foster result orientation and measurement culture within the organisation and to cascade and update goals and measures regularly. The result plan itself was an Excel document that incorporated performance measures and objectives for the whole year as well as more specific goals and measures for the quarter. For each quarter the performance measures and goals were further decomposed to measurable tasks and actions and followed up on weekly basis. The result plan was meant to be used throughout the organisation, from top management to production teams and white collar departments. Moreover, the result plan was personal on all levels expect for production and cross-functional teams where it was owned by the whole team.
Formal discussions and direct observations made it evident that the idea was to link a three layered meeting structure to the result plan process. The meeting structure consisted of yearly, quarterly and weekly meetings. The yearly meetings purposed to set the goals and measures for the coming year with consideration for the overall strategy, strategic and operational achievements, historical performance and business environment. Further, these meeting were used to cascade measures throughout the organisation.
The quarterly meetings alluded to review, modify and update measures and goals depending on strategic and operational performance and changes in both internal and external environments. Finally, the weekly meetings purposed to follow up the plans. Hence, each production team got the autonomy to select

46
their own measures as long as they supported the overriding goals of the organisation. The top management team believed that the local expertise of the teams would enable the organisation to develop better and more accurate performance measures.
Further, the participative observations showed that the intention was also to use the result plans as a tool to delegate the ownership of measures. Having a performance measure on your result plan constituted the responsibility for reporting the weekly follow up, reaching the target and react on deviations with actions and tasks. The underlying idea was that by giving these responsibilities, the owner of the measure had an incentive to ensure that the measure was appropriate as he or she was responsible for its performance.
The process had once been developed and implemented by an external management consultant firm. When implementing the result plan process the organisation got educated in how the process works and how to create a result oriented mindset. The education form was not rigid but adapted to the situation. It could range from one-on-one session to group sessions. Moreover, the consultant firm was involved in all three types of meetings in order to assist, coach and further educate the participants.
However, as the participative observations showed, the vision of the process was never fulfilled in reality. The result plan process was flawed from several perspectives (Salloum et al, 2011, Paper III). In order to enhance the understanding regarding where the process fell short, a problem workshop was held within the project. The purpose of the problem workshop was to outline the gap between the current state and the vision of the result plan process. A group of 12 individuals from various parts of the organisation participated in the workshop.
From the workshop output it became evident that the organisation had problems in understanding the performance measures, the relationships between performance measures and the relationship to strategy (see Figure 14). It was highlighted by the workshop participants that the efforts to get the organisation to generate this understanding were not prioritised. Further, a gap in knowledge regarding how the organisation could affect the measures also existed. Moreover, it became evident that the way the organisation communicated regarding performance measures was inadequate and that the organisation had problems in prioritising.

47
Figure 14: The problem workshop output compiled and sorted.
Beside all the detailed problems that emerged in the problem workshop, several other issues were distinguished. Participative observations showed that there was a general lack of understanding of the required effort and commitment from the top management. It became obvious that not even everyone had a result plan. The largest function of the case company had large parts of its organisation not using the result plan. Instead, they deployed their PMS and claimed that it was their result plan.
Informal discussions with first-line managers revealed that the lack of understanding regarding how to affect the performance measures could develop into a lacklustre attitude and disengagement among employees. Moreover, one first-line managers did not think that the result orientation and measurement culture was nearly to be achieved just because management and employees had received a small amount of education, he stated that it signalled a lack of support from management instead. Another first-line manager argued that the top management needed to look past the reality of their own group and take actions in order to create a condition that allows the people in the organisation to understand and thus get involved.

48
Further, participative observations showed that the organisation struggled in structuring information related to the result plan process. The result plans were held at the internal website of respective department. No other organisational member could log on the website without being granted access. This put the organisation in a position where it had to assume that the way or working was functional as it did not have means to quickly check it.
Informal and formal discussions with managers from all hierarchical levels and operators across the organisation displayed that the yearly and quarterly meetings were at some parts of the organisation often not held. If they were held, the chronological order was overseen. Hence, no functional review mechanism of the performance measures was in place. Analysis of archived data showed that the report used for the weekly follow up meeting got updated regularly whilst the result plan was often not revisited between the quarterly and yearly meetings.
Moreover, the performance measures set at the yearly meetings were meant to be derived from the PMS of the organisation in order or to reach coherence in goal setting and follow up. The idea was to use the PMS as a tool for reporting goals and measures and the result plan as a tool for continuous improvements towards goals and measures. But, due to the lack of a functioning process no consistency was reached in the lower levels of the organisation between PMS and result plan. Further, through formal discussions it was indicated that due to employee turnover the shortcomings of the process were partially due to lack of education. The external management consulting firm had a lower presence as their contract was set to elapse with the company and this impacted on the education of individuals at new positions.
5.3.3 Conclusions
The main finding in case study C is that the factors critical to dynamic PMS can be divided under four headings: processes, culture, people and system. Thus, validating the findings made by Kennerley et al (2003). Processes need to be in place for review, modification and deployment of measures. These processes need to be coordinated and well documented. Secondly, systems is needed that can handle information in a flexible manner, that provides information transparency and that visualises the PMS of the organisation. The organisation needs to have a culture that advocates commitment and involvement for the PMS. Finally, the people with the skills to estimate the effort required and execute the update of the PMS are needed in the organisation. Moreover, from the case study, four factors emerged besides the ones found in literature: information transparency, visual traceability, documented process and coordination of the evolution of the PMS. Firstly,
49
regarding the need for the process, it needs to be applicable and explicitly documented with all relevant templates. Moreover, the proactive coordination of the change in the measurement system is needed and should be the responsibility of a process owner. Information transparency is required in order to distinct between obsolete and current material and information. Further, the process of cascading goals and measures is traceable in essence. By visualising this relationship and make the set of measures and goals at all levels of the organisation public and explicit it will become easy to detect where measures and goals are not coherent and where the PMS has not been updated.
5.4 Case Study D
5.4.1 Purpose
The purpose of case study D was to investigate what factors constitute dynamic abilities in a PMS and how the factors can be systemised and realised. In order to fulfil the purpose, a case was conducted at a heavy vehicle manufacturing site in Australia. The study is composed of 20 interviews incorporating almost all levels of the organisation.
5.4.2 Findings
The case company displayed a PMS highly integrated to the operational management system (OMS). It was evident from the interviews that no distinction between the systems seemed to exist and that the organisation perceived the whole as one system. The OMS/PMS is not based on a given theoretical model but developed to fit the needs of the company. The archived documents showed how the organisation linked the PMS, through the OMS, to the business plan process of the company. From the executive management interviews it became evident that the business plan process facilitated the strategic objectives of the organisation and was used to generate strategically aligned goals and performance measures for the OMS and hence the PMS (See Figure 15). The business plan was facilitated by the executive management team of the organisation.

50
Figure 15: The relationship between the global and local business plans (BP), the operational management system (OMS) and the PMS (Salloum and Wiktorsson, 2011, Paper IV).
The direct observations and interview results made it evident that the organisation deployed an information hub which hosted all data and information related to the OMS/PMS. One executive management interviewee argued that with a single information hub, it became easier for the organisation to emphasise current information regarding performance measures in contrast to spreading the content on several hubs or websites.
The only information kept outside of the information hub was sensitive performance measures and objectives such as heavy cost cuts or head count reductions. All performance measures and their intra-relationships were documented as performance measurement tree charts, available and visualised at the information hub. The performance measurement tree charts are presentations/diagrams per function and department that illustrate the relationships between the deployed measures (Figure 16). Linked to the measurement tree is a cover sheet per measure with information regarding the purpose, formula, definition, responsible person, frequency, usage, data sources and the last time the measure was reviewed.

51
Figure 16: An example of how a performance measurement tree at the case company could look like. The most important performance measure of the department is depicted at the top and the supporting measures are then depicted below.
By the interview results it became clear that the dynamic ability of the PMS was build around a review process executed twice a year (June and December). The process took on average two till three weeks to execute and was meant to involve the whole organisation. Several executive management members made it explicit during the interview study that the time it takes to carry out the review process made it not worthwhile to do it more than twice a year. Moreover, they also argued that in order to understand the appropriateness of the alterations done to the PMS, time is needed between the review sessions. If events would occur that impact on the prioritisation of performance measures this would be communicated between the review sessions.
The review process was facilitated and coordinated by the local production system expert. The facilitation of the process included planning and coordinating the meeting structure, setting up the agenda for the meetings and attending to support the groups that needed assistance in the execution. Further, the local production system expert was responsible for the continuous improvement of the review process through feedback from employees, management and own experiences after each review process session.
The process is based on a meeting structure initiated and closed by the executive management team. The input to the executive management team’s review meeting is the business plan performance, requirements from the global manufacturing organisation, overall appropriateness of the currently deployed performance measures and current business environment. The output from a review meeting ranges from abolishing a measure, replacing it with a new measure, adding a new measure, leaving measures intact or altering the:

52
purpose of measurement, formula of measure, definition of measure, ownership of measure, frequency of measurement, data sources or level of measurement. The process and templates used in the review activities were standardised and documented in order to ensure the traceability of the inputs and outputs between organisational levels.
Some executive management interviewees expressed that internal and external politics could affect the outcome of their review meeting. One interviewee expressed that internal politics could affect discussions regarding what and how to measure something and it sometimes resulted in that not the most appropriate choice was made. Further, the general and production managers argued that external politics (outside of the organisation but within the company group) could also impact on what to measure and how to measure it. This could lead to the replacement of relevant measures with irrelevant dittos. The risk of deploying politically influenced (and inappropriate) measures is, according to the production manager, the decline of involvement in the organisation.
Once the executive management finished their review meeting, the function management did the same exercise with the executive management’s output as their input. Moreover, besides the executive management output, the function management also incorporates changes in their environment into the review. This chain of meetings is meant to continue down to the production teams. All departments had the autonomy regarding selection of measures as long as they supported the ones above them. Once all the review meetings were executed the agreement/feedback meetings started. The purpose of these meetings was to foster consensus and alignment regarding what was going to be measured. In contrast to the review meetings, these meetings had a bottom-up approach. The process was accomplished once the executive management team held the last agreement/feedback meeting. The executive management team has the power to either accept the efforts or ask for refinements. All the changes decided upon are then deployed by respective performance measurement owner, such as updating reports, presentations, scorecards and IT-systems. However, it was the responsibility of the executive management team members to ensure that the measurement owners within their functions actually deployed the changes.
Further, the archived documents proved that besides having the meeting structure, the general manager invited the whole organisation to a seminar twice a year where she gave feedback regarding the latest review process alterations and information regarding changes in both internal and external environments and how they has affected the company. The seminar allowed direct communication between the general manager and organisation regarding chosen performance measures, target levels and the strategy. Interview

53
respondents from all hierarchical levels perceived these meetings as a strong sign of the executive management team’s commitment to the review process and its output. Moreover, in order to enhance the communication further, a payback tracker was available on factory level. The tracker communicated the financial effects of the performance measures and continuous improvements to the organisation. The payback tracker followed the financial improvement impact on a total level but also for overtime, scrapings, rectifications, quality, inventory value, project targets and pace attainment.
However, it became apparent from the interview results that due to several challenges, the review process was never deployed on team level in production. Respondents from all hierarchical levels of the organisation reached consensus in their view of the disinterest of employees regarding performance measures. One team leader expressed that employees on the shop floor did simply not care, they wanted to do their job and go home. The executive management team respondents were united in their view that they had not reached out fully and had a contribution to make in order to engage the whole organisation. The executive management further expressed that they had made attempts to engage the production teams that failed. One executive management team member argued that the attempt failed due to the lack of understanding of the management in how to make the organisation wanting to get involved. The interview respondents that had been shop floor workers and recently been promoted to team leaders expressed that in order to get the employees involved the organisation had to give them measurement responsibilities. That is how they got involved, by being given responsibilities as team leaders.
The disinterest was not exclusive for employees within the production function. Even though the review process was fully deployed within the finance function, the finance manager expressed that he sometimes struggled in getting his function involved in the review process. He expressed that they could sit at the review meetings complaining about the waste of time and highlighting the importance of the operational work. Several respondents argued that a factor contributing to the lack of involvement was the culture of the organisation. One executive management team member with diverse cultural experiences argued:
“In Sweden you do reason with your group until you find a solution, in
Australia it is bang on. It is easier to be a manager but at the same time you lose the hotbed for development. Here at this plant, to engage your employees equals to inform them and nothing else. No dialogue or feedback exists. You must always control that things are getting done. This is fundamentally wrong and in order to redeem this we must change the culture. We must start at the top of the organisation and dare to delegate the responsibilities and give the

54
conditions for the employees to do what we ask them for. This journey starts
with us, the executive management team.”
Further, the organisation did not offer any performance measurement training to the production teams. This education was given once an operator or assembler became a team leader. Several team leaders expressed that the education that they received was important for their understanding regarding the role that the PMS played in the organisation and how they could contribute to the results and get involved.
Another challenge for the organisation is the communication process. Information regarding the PMS between the review sessions and general manager seminars were canalised through one communication channel, the team leaders. Interview results showed that the managerial body perceived communication as an important tool between review sessions against events with impact on the priorities of the PMS such as the 2008 financial crisis. The information communicated could range from applauding good accomplishments and short term performance measurement focus points to considerable internal and external events occurring affecting the performance of the case company. However, interview results showed that the team leader’s communication skills were perceived as very varying from the management and they recognised a gap in spreading information and inquired a more stable process. The production manager perceived the communication challenge of the organisation as their million dollar question.
Further, direct observations and interview results with the executive management team made it clear that the case company had evident problems with their inflexible and disintegrated IT-systems. High levels of manual impositions for collecting and compiling data encroached on the time for analysis, limited the measurement scope and amplified the risk for human errors. The organisation had been in situations where it could not measure what it needed due to the limitations of the IT systems.
In connection to the interviews, all management team members, irrelevant of hierarchical affiliation, filled in a questionnaire regarding factors important for the PMS. As the result in Figure 17 indicates, the management commitment is perceived as the most important factor. Further, information transparency, employee involvement, coordination and culture were also factor deemed to be highly important by the managerial body of the organisation.

55
Figure 17: The management questionnaire output visualised in a chart. The blue line visualises the importance (scaled on the left Y-axis) of a factor whilst the red line represents the perceived complexity (scaled on the right Y-axis) of it.
5.4.3 Conclusions
The main findings in case study D are the crippling effect that the culture, management and people had on an otherwise solid review process and the high level of integration between the overall management system and PMS. The earlier findings made in case study C are modified. In manufacturing organisations, the factors critical to dynamic PMS can be divided under five headings: processes, systems, management, employees and culture. It is not adequate to acquire the capabilities listed under one or two of the five factors, in order to realise a dynamic PMS all five need to be existent.
A review process is needed. The process need to be coordinated and involve the whole organisation. Further, a flexible IT system is needed in order to handle changes. The IT system needs to provide a high quality of data and low manual impositions. The management plays a pivotal role in creating dynamic PMS. It became evident from the empirical results that the understanding, commitment and management understanding are all factors that affect the PMS and the involvement of the organisation. Further, the employees play an equally pivotal role, education, ownership and involvement of the employees are needed. Moreover, in order to achieve dynamic PMS a culture that

56
encourages the involvement and openness within the organisation is needed. The culture is central and impacts on employees, management, information sharing and review process alike.

57
6. A framework for dynamic PMS
This chapter is structured around the main findings of this thesis. The initial
section presents 19 factors that constitute dynamics in a PMS. Then, the next two sections discuss how the factors can be systemised and realised. The closing section of the chapter compiles the findings into a framework. The
results presented under the four sections of this chapter are products of the analysis of data conducted. Other researchers might have derived different results with the same theoretical and empirical material depending on what strategies of data analysis they would have chosen.
6.1 Factors that constitute dynamics in a PMS
From the executed empirical studies 19 factors have been identified that constitute dynamics in a PMS. Some of these are evident in the theoretical frameworks presented in this thesis whilst others have emerged from the empirics. The factors are discussed and related to each other more thoroughly below.
Standardised review process
Firstly, a review process is needed in order to continuously review the PMS (Salloum et al, 2011, Paper III; Salloum and Wiktorsson, 2011, Paper IV). Case studies B, C and D showed that the organisations had some form of review process in place. The process need to be standardised in the sense that it is documented with all the related templates and eventual tools as discussed in Salloum et al (2011, Paper III). Moreover, the process ought to be executed twice a year, every six months. The reasons for choosing two times a year are several. The review process requires attention from the whole organisation for a considerable amount of time as illustrated in case study D. Hence, the burden of executing the process more often, quarterly for instance, can have negative consequences in line with the ones in case study C. Moreover, it can become challenging to distinguish if desirable outcomes are generated within a time frame of less than six months as argued by the top managers in case study D. The need to have a review process in place is emphasised by several authors within the field (Feurer and Chaharbaghi, 1995; Bourne et al, 2000; Bititci et al, 2000; Kennerley et al, 2003; Najmi et al, 2005).

58
Meeting structure
In order to involve employees and managers alike in the review process, a meeting structure stretching over the whole organisation is needed as made evident in case studies C and D. The meeting structure needs to be executed in a hierarchically chronological order (Figure 18). The purpose of the hierarchical set up of the meeting structure is dual, firstly to create alignment in the organisation by allowing the organisational levels to feed each other with input. Secondly, to create a feedback re-loop for securing the compatibility and alignment of performance measures in the organisation and to communicate changes to the immediate interested parties. The lack of a feedback re-loop was highlighted as problematic in Salloum et al (2010, Paper II). Within the meeting structure each department or performance measurement group has two meetings, one to review and eventually modify the measures and one to secure the compatibility of the measures with the above hierarchical level. As Salloum and Wiktorsson (2011, Paper IV) and case study D pointed out, the strategy and overall current business environment is fed into the process through the meeting structure.
Change deployment
Once the PMS is reviewed and eventual modifications are decided upon, the performance measurement owners should deploy these changes. The change deployment involves replacing existing performance measures in all reports, presentations and possible scorecards across the organisation but also ensuring that the IT-systems are updated with the latest information as shown in case study D. The role of the change deployment is touched upon by Bititci et al (2000) and Kennerley et al (2003). The output from a review meeting ranges from abolishing a measure, replacing it with a new measure, adding a new measure, leaving measures intact or altering the: purpose of measurement, formula of measure, definition of measure, ownership of measure, frequency of measurement, data sources or level of measurement as illustrated in case study D.
Feedback
Once the changes are deployed it is important to provide the whole organisation with feedback regarding how their changes have affected the PMS. Hence, it needs to be ensured that the organisation has a clear understanding of all impacting alterations made during the review process sessions. The seminars held in case study D by the general manager witnesses of the importance of this feedback. Moreover, in case study C the lack of feedback of alterations was underlined as a problem (see Figure 14). Even
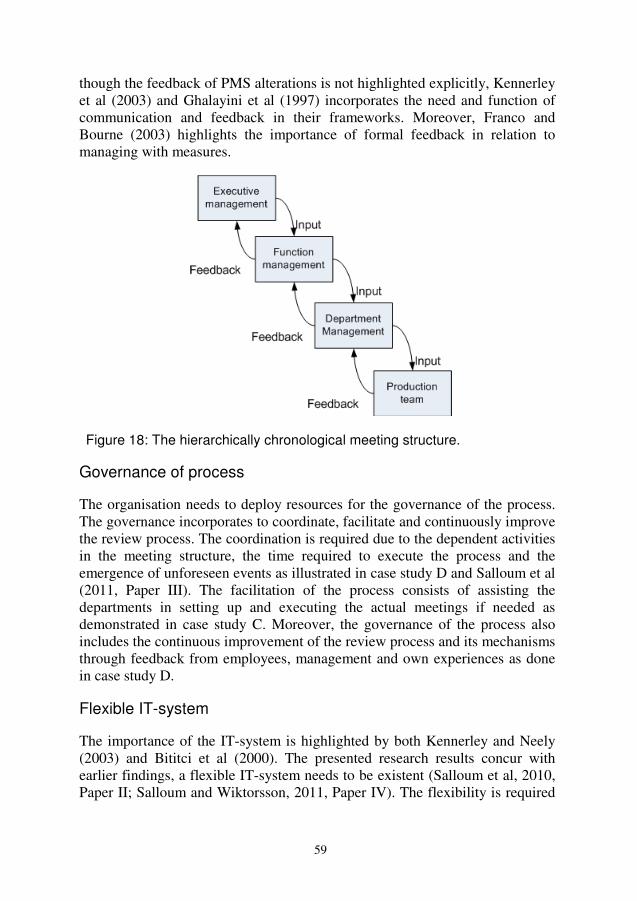
59
though the feedback of PMS alterations is not highlighted explicitly, Kennerley et al (2003) and Ghalayini et al (1997) incorporates the need and function of communication and feedback in their frameworks. Moreover, Franco and Bourne (2003) highlights the importance of formal feedback in relation to managing with measures.
Figure 18: The hierarchically chronological meeting structure.
Governance of process
The organisation needs to deploy resources for the governance of the process. The governance incorporates to coordinate, facilitate and continuously improve the review process. The coordination is required due to the dependent activities in the meeting structure, the time required to execute the process and the emergence of unforeseen events as illustrated in case study D and Salloum et al (2011, Paper III). The facilitation of the process consists of assisting the departments in setting up and executing the actual meetings if needed as demonstrated in case study C. Moreover, the governance of the process also includes the continuous improvement of the review process and its mechanisms through feedback from employees, management and own experiences as done in case study D.
Flexible IT-system
The importance of the IT-system is highlighted by both Kennerley and Neely (2003) and Bititci et al (2000). The presented research results concur with earlier findings, a flexible IT-system needs to be existent (Salloum et al, 2010, Paper II; Salloum and Wiktorsson, 2011, Paper IV). The flexibility is required

60
in order to allow the deployment of a PMS aligned with organisational needs and the strategic direction rather than IT capabilities (see case study D).
High quality of data
Consistent high quality of data is needed in order to make performance measures reliable and purposeful over time. If an IT-system provides unreliable data the trust of the content of performance measures will diminish over time, and with it, the will to ensure that the PMS reflects its surroundings (Salloum et al, 2010, Paper II). The importance of the high quality of data to the motivation of the organisation for keeping the PMS up to date was evident in case study C.
Low manual impositions
Low manual impositions enables the organisation to allocate resources for analysing and acting on measurement results rather then generating them (Salloum and Wiktorsson, 2011, Paper IV). Further, a low level of manual impositions decreases the risks for human errors when compiling information/data and hence should increase the quality of data as reasoned in case study B.
Integration of IT-systems
The integration of IT-systems concurs with the findings of Bititci et al (2000) and Kennerley et al (2003). As highlighted in (Salloum et al, 2010, Paper II) and case study B the integration of information systems could be vital to the quality of data, flexibility of the system and level of manual impositions. Moreover, the disintegration of information systems can prove to be problematic and time-consuming as shown in case study D and Paper IV (Salloum and Wiktorsson, 2011, Paper IV).
Accessible information hub
Further, an information hub accessible for the whole organisation needs to be available. The information hub ought to contain all information related to the PMS such as:
• Results and outcomes of performance measures.
• Visualisation of the relationship of all the performance measures.
• The information regarding the current PMS with the purpose, definition, usage, data sources, data formula, ownership and measurement frequency of each performance measure.
• Upcoming measurement information between the review process sessions.

61
An accessible information hub strengthens the organisations understanding of where it is heading as all information regarding the direction is easily available for everyone. With a single information hub, it becomes easier for the organisation to emphasis current performance measures and other related information in contrast to spreading the content on internal websites as argued in case study D and Salloum et al (2011, Paper III). Information deemed to be of highly sensitive character ought to be kept out of the information hub as the management did in case study D.
Management understanding
Management needs to possess an understanding of the requirements for creating dynamic PMS in order to enable the organisation to obtain it. It needs to understand the requirements of creating, executing and nurturing a functional review process and IT-system. Moreover, it also needs to comprehend the demands on itself, what it needs to provide for the organisation and the pivotal role of employees and culture in creating dynamic PMS. The lack of management understanding can be an obstacle as exemplified by Salloum et al (2011, Paper III) and case study D. The need to secure the competence and understanding of the management is in line with the findings of Kennerley and Neely (2003) and Franco and Bourne (2003).
Management commitment
Management commitment creates the foundation for enabling the organisation to create a dynamic PMS. The executive management team need to commit itself to keeping the PMS dynamic over time by spending the required time in the review process, making resources available for governance, education and information-technology as discussed in Salloum et al (2011, Paper III) and case study D. Moreover, the importance of the commitment of management is highlighted in the case study D questionnaire (see Figure 17). The pivotal role of the commitment of management is highlighted by Townley et al (2003), Kennerley et al (2003), Waggoner et al (1999) and Franco and Bourne (2003).
Communication
In between the review sessions, management must secure that it has reliable and recognised means of communication, ensuring the continuous flow of information regarding the PMS. Changes both in the internal and external environments can swiftly require the organisation to shift the focus of the organisation. This shift does not constitute changing the performance measures but the focus of the organisation regarding what measure or type of measures is most urgent and important at the moment. The need for keeping the organisation informed regarding the current state of business is highlighted in

62
case study D. Kennerley et al (2003) emphasises the need for multi-dimensional communication of performance to the organisation.
Inter/Intra Organisational politics
Organisational politics, both external and internal, have an impact on the viability of the PMS and needs to be managed. The impact of organisational politics concurs with the findings made by Waggoner et al (1999) and Townley et al (2003). The politics of the organisation can lead to the deployment of inappropriate measures in the organisation as underlined in case study D.
Involvement of employees
Besides the role that management plays, the employees have an equal critical role in creating dynamic PMS. Just as the understanding of the managerial body is important, it is equally crucial to involve the employees. The involvement of the organisation is crucial for executing the review process as discussed in Salloum and Wiktorsson (2011, Paper IV). A solid process is not sufficient for creating dynamics without the involvement of the organisation. Without the involvement of the employees, the process will not be properly executed (Salloum et al, 2011, Paper III; Salloum and Wiktorsson, 2011, Paper IV). The importance of employee involvement for the evolution of the PMS has been underlined earlier by Townley et al (2003).
Employee training
Employee training is important in order to ensure that the organisation possesses the practical skills and as a driver of involvement in the organisation as discussed in case study D. Firstly, it needs to involve the necessities for the review process and IT-systems. Secondly, the training ought to incorporate the role of the PMS, relationship to strategy and business environment and how the employees can contribute to the performance measures. The lack of employee training was a negatively contributing factor in case study B, C and D. In Salloum et al (2010, Paper II), questions were raised regarding the IT training and competence of the employees. Whilst in case study C and D, the lack of training crippled the review process and the employee involvement and understanding. The need for employee training is in line with earlier findings made by Kennerley et al (2003) regarding the need to secure the human competence.

63
Ownership of performance measures
In addition to getting the employees involved, the organisation needs to give them the ownership of performance measures. The lack of ownership delegation is listed by Kennerley et al (2003) as a barrier for the evolution of performance measures. The responsibility and accountability that incorporates the ownership will enhance employees strive for appropriate performance measures and thus motivate and involve them in the review process as discussed in case study C and D.
Autonomy in selecting measures
Besides disseminating the ownership, autonomy in selecting performance measures need to be recognised. The organisation needs to allow the local expertise, the employees close to the processes, to choose the performance measures that they believe are important as long as they are compatible with the strategic direction and business environment of the organisation, as shown in case study C and D. The autonomy of measurement selection concurs with findings in team focused PMS (Mendibil and MacBryde, 2006; Meyer, 1994) and strategic planning (Mintzberg, 1994).
Culture within an organisation
The last identified factor is culture within the organisation. In order to achieve a dynamic PMS, a culture is needed that, as Kennerley et al (2003) expressed it, ensures that the value of measurement and the importance of maintaining relevant and appropriate measures are appreciated. In case study D the need for a culture that engages employees, advocates delegation of responsibilities and sets the right conditions for the organisation was requested. The culture of the organisation has an impact on the involvement of employees, ownership of measures, management commitment, information sharing in the organisation and the resource availability for creating a dynamic PMS (Salloum and Wiktorsson, 2011, Paper IV). Moreover, the importance of the culture for creating dynamic PMS was further highlighted by the questionnaire results in case D (see Figure 17) and in the findings of case study C. Several other empirical studies and frameworks have distinguished the importance that culture play for the PMS (Waggoner et al, 1999; Franco and Bourne, 2003; de Waal, 2009).
6.2 Systematisation of factors
In literature, the frameworks are systemised under broad factors and sub-headings in order to cluster closely correlated parameters and make it easier to

64
grasp the underlying ideas of the concepts. Kennerley et al (2003) chose to divide their enablers and barriers under four broad factors: processes, culture, people and systems. Bititci et al (2000) took a different approach and opted to divide the defining characteristics of a dynamic PMS into framework and IT-platform capabilities. Najmi et al (2005) split their framework into two categories of reviews, business performance and PMS performance, and distinguished between into three review levels; ongoing, periodic and overall. Ghalayini et al (1997) deploys three tools and levels of the organisation to illustrate how their framework ought to be systematised. In order to comprehend the findings presented in section 6.1, the 19 factors are systemised into five sub-headings. The purpose of the sub-headings is to systemise the findings into a framework.
The common denominator for the presented frameworks is the existence of a review process or mechanism (Ghalayini et al, 1997; Bititci et al, 2000; Kennerley et al, 2003; Najmi et al, 2005). The empirics in this research concur with earlier findings and the existence of a review process seems to be fundamental to dynamic PMS. Therefore, the factors related to the process of reviewing the PMS is clustered under the first sub-heading labelled review process (Figure 19). A review process needs to be existent ensuring a structured and regular way of working for reviewing and updating the PMS. Moreover, the IT and information related factors are composed under the sub-heading IT-systems. This goes in line with the distinctions made by both Bititci et al (2000) and Kennerley et al (2003). The capabilities of the IT-systems are pivotal for creating a PMS that reflects the strategic direction and business environment of an organisation.
The review process and the IT-systems represents the objective side of the framework, these factors are needed in order to set the structure for a dynamic PMS. The objective side of the model indicates that the large majority of the factors are structural. However, it should be understood that the distinction between an objective and a subjective is not definite. It merely suggests that the majority of factors located on one side of the framework are objective or subjective. For instance, feedback, that is a subjective factor, is located under the review process on the objective side.
The only frameworks going beyond the structural characteristics and discussing the more subjective factors in relation to dynamic PMS are the ones by Kennerley et al (2003) and Waggoner et al (1999). The findings made in this thesis conclude that without recognising the subjective factors the framework will become inappropriate and dysfunctional (Salloum et al, 2011, Paper III; Salloum and Wiktorsson, 2011, Paper IV). However, in contrast to Kennerley

65
and Neely (2003) that list people and culture, the sub-headings of management,
employees and culture have been deployed (Figure 19).
The management of the organisation needs to commit to creating a dynamic PMS and understand the effort that comes with it. The employees of the organisation need to be involved in selecting and reviewing the PMS. The existence of a culture that engages employees, advocates delegation of responsibilities and enables the appropriate conditions for the organisation is needed. Even though only one of the 19 identified factors deals with culture, the impact that it has on the review process, information sharing, employees, management and resource availability makes it classified as a sub-heading. Moreover, due to the wideness of the cultural impact it is depicted in the middle of Figure 19.
Figure 19: Systemisation of factors constitutional for dynamic PMS.
From the collected empirics it stands clear that the need to balance the development of the objective and subjective sides is pivotal (Salloum et al, 2011, Paper III; Salloum and Wiktorsson, 2011, Paper IV). To have a well developed review process and IT-systems without the commitment and understanding of management or employee involvement will not constitute a dynamic PMS. Further, the reversed, with strong management commitment, understanding and employee involvement but neither a review process nor a adequate IT-systems, will not be sufficient.
6.3 Realisation of factors
The vast amount of literature available within the field of performance measurement has been highlighted earlier. However, as Bourne (2008) noted,

66
new practices within the field rarely emerge from academia. Moreover, empirics show that organisations develop own scorecards and frameworks that fit the needs of their businesses instead of using theoretical models (Bauer et al, 2004). The finding in this research strengthens these empirics, even though there are points of resemblance between the PMS of the case companies and their theoretical dittos, the companies have developed their PMS with the needs of the business as focal point and not based on theory.
Further, the experience drawn from the case studies is that the PMS has been integrated, to some extent, to the management system of the organisation. In one case it was integrated to the extent that the whole was perceived as one system and not as two separate systems (Salloum and Wiktorsson, 2011, Paper IV). As a consequence of the diversification in design and integration of the PMS, the characteristics of it and the ways of working related to it have been different from case to case.
Moreover, the characteristics of the IT-system can also vary greatly in between organisations (Salloum et al, 2010, Paper II; 2011, Paper III; Salloum and Wiktorsson, 2011, Paper IV). The level of manual impositions, quality of data, level of system integration and system set-up are difficult to generalise about in order to list universal rules regarding how to realise the IT related factors.
Further, the factors under the sub-headings of management, employees and culture are difficult to draw universal conclusions on. The type of culture, management commitment and understanding, organisational politics, employee involvement and training, communication, ownership and autonomy in selecting measures varies from organisation to organisation as illustrated in the case studies.
These differences in capabilities makes it difficult, if not even impossible, to create a short-list with actions that need to be fulfilled in order to realise a dynamic PMS in practice. The way a PMS is designed and its relationship to other systems affect the realisation. Further, IT capabilities, the maturity of management, employees and culture varies from organisation to organisation. Some factors listed as constitutional for dynamic PMS might be available within the management system, the PMS, the production system or other concepts within an organisation. Instead of constructing something that already partially exists and creating confusion by having two concepts overlapping each other, an organisation should build on its strengths and consider the current capabilities as a starting point towards dynamic PMS. Thus, in order to realise dynamic PMS in practice, two broad factors need to be considered:
• The PMS design – The characteristics of the current PMS and the systems and processes integrated with it.

67
• The PMS context – The current IT-system capabilities and the level of maturity of management, employees and culture in the organisation.
6.4 Summarising the findings into a framework
In the previous sections, the three research questions have been answered and discussed. This leaves us with the fulfilment of the research objective which was formulated as to develop a framework that will support the realisation of dynamic performance measurement systems in manufacturing organisations.
By composing the answers to the research questions a framework has been constructed (Figure 20). The framework incorporates the factors that constitute dynamics in a PMS, their systemisation and what to consider when realising them in practice.
Figure 20: A framework for dynamic PMS in manufacturing organisations.
Practitioners within manufacturing organisations across the world can use this framework as a map for creating dynamic PMS. This framework provides a foundation for revising the crippling paradox of combining ever changing and dynamic strategies and business environments with stable and predictive PMS by making the measurement systems compatible and suitable for ever-changing content.

68

69
7. Conclusions and Contributions
This chapter starts off by summarising the findings of this thesis. It then
discusses and highlights the scientific and industrial contributions made. After the contributions, the chapter discusses the quality of the research and possible future research paths.
7.1 Conclusions
Even though the research in the field of performance measurement is vast, a small amount of research has been performed regarding the factors affecting dynamic PMS. The amount of research conducted is a contributing element to why companies often fail to continuously reflect the ever-changing business environment in their PMS.
The objective of this research is to develop a framework that will support the realisation of dynamic performance measurement systems in manufacturing organisations. As a step towards fulfilling this objective four papers were written and published.
Paper I concluded that the future research agenda in the field of performance management must focus on deriving a dynamic and flexible process to support the measurement system due to the general limitations of current performance measurement frameworks.
Paper II strengthens findings made by other researchers regarding the lack of dynamic capabilities of PMS. However, it is derived that in order to be able to revise their measurement systems without deploying extensive resources the companies should start off with aligning their measures throughout the organisation.
The main findings of paper III are that all theoretical factors found in theory affect the evolution of a PMS to some degree and that these factors can be divided under four sub-headings: processes, systems, culture and people. Further, the paper also presents four emerging factors impacting on the dynamic abilities of a PMS: information transparency, visual traceability, documented process and coordination of the evolution of the PMS.
The main findings of Paper IV are the identification of five broad factors that need to be fulfilled by manufacturing organisations in order to create dynamic PMS: review process, information technology, management, culture and

70
employees. Further, it was concluded that it is not adequate to acquire the capabilities listed under one or two of the five factors, in order to realise a dynamic PMS all five need to be existent. Finally, in order to realise the factors in practice the PMS design and context need to be considered due to the high level of integration between the overall management system and PMS displayed in the case study.
As Figure 20 illustrates, a framework has been constructed in order to fulfil the research objective. The framework consists of 19 factors listed under five sub-headings and an additional two factors related to the realisation of it.
7.2 Scientific and Industrial Contributions
This research is derived from an industrial problem and provides an insight of the current struggles for the companies. The answering of the research questions and objective is an academic contribution. For the first question, 19 factors were identified that constitute dynamics in a PMS. For the second question, five sub-headings emerged in which the 19 factors were systemised under. Finally, for the last question, two factors were underlined regarding the realisation of the sub-headings. The answers to the three research questions were then compiled into a framework in order to fulfil the research objective.
Irrelevant of the phases of the economical cycle, the industry is always confronted with tough goals and objectives that need to be achieved. This, in combination with every day problems and challenges leaves little resources to be deployed for deeper studies of problems that are not deemed directly acute. The contribution to the industrial community is a deeper study with a proposed solution for an existing problem. Moreover, as the initiation of this thesis is based on an industrial problem the framework presented ought to be in the interest of the industry.
7.3 Quality of the Presented Research
The research conducted and presented has been subject to the prerequisites and precautions of the chosen scientific approach, data collection and analysis strategies, validity, reliability and the self of the researcher.
In order to ensure validity, the research conducted and the set-up of this thesis has been structured in a logical flow with problem statement, current state of the art and empirical investigations. The end-result provides a possible explanation regarding how to handle the initiated problem and raises the question regarding how to make it practically realisable. Further, the end-result has developed existing theories to offer a solution to the problem rather than

71
providing a groundbreaking solution. As participative observations was used as the main data source for a considerable part of the empirical collection, a case dairy was written regularly in order to secure the quality of the research. Moreover, as the research has been conducted over time, the skills of the researcher has developed and matured, leading to better handling of the self.
Several precautions have been taken in order to secure the reliability of the research. The highest level of documentation has been aimed at, from the initial contact with case companies to the dissemination of the case results. All interviews have been documented from the interview protocol before the study to the final transcribed interview documents. The appended interview questions and questionnaires (Appendix B and C) strengthen the quest for the highest possible reliability of the conducted research.
However, even though the reliability of the research has been considered, the question regarding to what extent the research results presented in this thesis can be repeated needs to be clarified. Even though it would be possible to duplicate the case studies to an arguably high extent, it must be remembered that organisations are systems in constant motion and evolution. The research results might be able to be reproduced in full if the case study would be duplicated directly after it has been executed. However, with an increased time span, it would be difficult for other researchers to draw the same conclusions even though the case studies are duplicated.
Moreover, it could be argued that the choice of exclusively including companies within the same company group has compromised the quality of the research. This argument might, on a glance, seem justified and faultless. However, one must not forget that a large share of the factors in the framework deals with subjective factors. The diversity of these subjective factors is arguably higher from region to region rather than from company to company. As the chosen case companies are located on three different continents the diversity of the subjective influences has been taken into account in the research.
7.4 Future Research
The research presented in this thesis has been concentrated on large manufacturing organisations. A framework has been proposed for manufacturing organisations in order to realise dynamic PMS. Besides testing the presented framework in practice, several interesting aspects of dynamic PMS require further investigation.
The impact that management, employees and culture have on the long term dynamic ability of a PMS needs further investigation. The research presented in

72
this thesis highlighted and discussed these factors but further investigations would be beneficial to the academic and industrial communities alike.
Another possible aspect for the future research agenda is shifting the application of the research from manufacturing organisations to white-collar organisations. The notion of manufacturing and operations performance measurement is more explored and tested than their white-collar dittos.
Furthermore, another interesting future research path is the investigation of the integration of tools for goal alignment within the lean manufacturing literature such as Hoshin Kanri with PMS in manufacturing organisations.

73
Reference List
Andersen, H.V., Lawrie, G. and Savic, N., (2004). Effective quality management through third-generation balanced scorecard. International Journal of Productivity and Performance Management, 53 (7), pp. 634-645.
Arbnor, I. and Bjerke, B., (1994). Företagsekonomisk metodlära. Studentlitteratur: Lund, Sverige.
Banker, R.D., Potter, G. and Srinivasan, D., (2000). An empirical investigation of an incentive plan that includes nonfinancial performance measures. The Accounting Review, 75 (1), pp. 65-92.
Bauer, J., Tanner, S.J. and Neely, A., (2004). Developing a performance measurement audit template - a benchmarking study. Measuring Business Excellence, 8 (4), pp. 17-25.
Bell, J., (2000). Introduktion till forskningsmetodik. Tredje upplagan. Studentlitteratur: Lund, Sverige.
Bernolak, I., (1997). Effective measurment and successful elements of company productivity: The basis of competitiveness and world prosperity. International Journal of Production Economics, 52, pp. 203-213.
Bititci, U.S., (1995). Modelling of performance measurement systems in manufacturing enterprises. International Journal of Production Economics, 42, pp. 137-147.
Bititci, U.S., Turner, T. and Begemann, C., (2000). Dynamics of performance measurement systems. International Journal of Operations and Production Management, 20 (6), pp. 692-704.
Bititci, U.S., Suwignjo, P. and Carrie, A.S., (2001). Strategy management through quantitive modelling of performance measurement systems. International Journal of Production Economics, 69, pp. 15-22.
Bititci, U.S., Mendibil, K., Nudurupati, S., Garengo, P. and Turner, T., (2006). Dynamics of performance measurement and organisational culture. International Journal of Operations & Production Management, 26 (12), pp. 1325-1350.
Bourne, M., (2008). Performance measurement: learning from the past and projecting the future. Measuring Business Excellence, 12 (4), pp. 67-72.
Bourne, M., Wilcox, M., Neely, A. and Platts, K., (2000). Designing, implementing and updating performance measurement systems. International Journal of Operations & Production Management, 20 (7), pp. 754-771.

74
Bourne, M., Neely, A., Platts, K. and Mills, J., (2002). The success and failure of performance measurement initiatives - perceptions of participating managers. International Journal of Operations & Production Management, 22 (11), pp. 1288-1310.
Brignall, S., (2002). The UnBalanced Scorecard: a Social and Environmental Critique. Proceedings of 3rd International Conference on Performance Measurement and Management, Boston, USA.
Brudan, A., (2010). Rediscovering performance management: systems, learning and integration. Measuring Business Excellence, 14 (1), pp. 109-123.
Chandler, A.D., (1977). The Visible Hand – The Managerial Revolution in
American Business. Harvard University Press: Boston, USA.
Cokins, G., (2004). Performance Management - finding the missing pieces to
close the intelligence gap. John Wiley & Sons: New Jersey, USA.
Cross, K.F. and Lynch, R.L., (1988). The "SMART" Way to Define and Sustain Success. National Productivity Review, 8 (1), pp. 23-34.
Cross, K.F. and Lynch, R.L., (1992). For good measure. Certified Management Accountants (CMA) Magazine, 66 (3), pp. 20-24.
Debusk, G.K. and Crabtree, A.D., (2006). Does the balanced scorecard improve performance? Management Accounting, 8 (1), p. 44.
Denscombe, M., (2000). Forskningshandboken – för småskaliga forskningsprojekt inom samhällsvetenskap. Studentlitteratur: Lund, Sverige.
Dixon, J.R., Nanni, A.J. and Vollmann, T.E., (1990). The New Performance
Challenge – Measuring Operations for World-Class Competition. Dow Jones-Irwin: Illinois, USA.
Eccles, R.G., (1991). The Performance measurement manifesto. Harvard
Business Review, January-February, pp 131-137.
Fagerström, B., (2004). Managing distributed product development – An
Information and Knowledge Perspective. Doctorial dissertation, Chalmers Tekniska Högskola: Göteborg, Sverige.
Farris, J., Van Aken, M.E., Letens, G., Chearksul, P. and Coleman, G.D., (2011). Improving the performance review process - a structured approach and case application. International Journal of Operations & Production Management, 31 (4), pp. 376-404.
Feurer, R. and Chaharbaghi, K., (1995). Performance measurement in strategic change. Benchmarking for Quality Management & Technology, 2 (2), pp. 64-83.

75
Folan, P. and Brown, P., (2005). A review of performance measurement: towards performance management. Computers in Industry, 56, pp. 663-680.
Franco, M. and Bourne, M., (2003). Factors that play a role in “managing through measures”. Management Decision, 41 (8), pp. 698-710.
Geber, B., (1986). The Hawthorne Effect: Orwell or Buscaglia? Training, 23 (11), p. 115.
Ghalayini, A.M. and Noble J.S., (1996). The changing basis of performance measurement. International Journal of Operations & Production Management, 16 (8), pp. 63-80.
Ghalayini, A., Noble, J.S. and Crowe, T.J., (1997). An integrated dynamic performance measurement system for improving manufacturing competitiveness. International Journal of Production Economics, 48, pp. 207-225.
Gosselin, M., (2005). An empirical study of performance measurement in manufacturing firms. International Journal of Productivity and
Performance Management, 54 (5/6), pp. 419-437.
Hass, S., Burnaby, P., and Bierstaker, J.L., (2005). The use of performance measures as an integral part of an entity’s strategic plan. Managerial Auditing Journal, 20 (2), pp. 179-186.
Ittner, C.D. and Larcker, D.F., (2003). Coming up short on non-financial measurement. Harvard Business Review, November, pp. 1-9.
Ittner, C.D., Larcker, D.F. and Randall, T., (2003). Performance implications of strategic performance measurement in financial services firms. Accounting, Organizations and Society, 28, pp. 715-741.
Jackson, T.L., (2006). Hoshin Kanri For The Lean Enterprise: Developing
Competitive Capabilities and Managing Profit. Productivity Press: New York, USA.
Johnston, R. and Pongatichat, P., (2008). Managing the tension between performance measures and strategy: coping strategies. International Journal of Operations & Production Management, 28 (10), pp. 941-967.
Kaplan, R.S. and Norton, D.P., (1992). The balanced scorecard – measures that drive performance. Harvard Business Review, January- February, pp. 71-79.
Kaplan, R.S., and Norton, D.P., (1993). Putting the balanced scorecard to work. Harvard Business Review, September-October, pp. 134-147.
Kaplan, R.S. and Norton, D.P., (1996a). The balanced scorecard: Translating
Strategy into Action. Harvard Business School Press: Boston, USA.

76
Kaplan, R.S. and Norton, D.P., (1996b). Using the balanced scorecard as a strategic management system. Harvard Business Review, January-February, pp. 75-85.
Kaplan, R.S., and Norton, D.P., (2000). Having trouble with your strategy? Then map it! Harvard Business Review, September-October, pp. 167-176.
Kaplan, R.S. and Norton, D.P., (2001a). The strategy-focused organization. Harvard Business School Press: Boston, USA.
Kaplan, R.S., and Norton, D.P., (2001b). Transforming the balanced scorecard from performance measurement to strategic management: Part I! Accounting Horizons, 15 (1), pp. 167-176.
Kaplan, R.S. and Norton, D.P., (2006). Alignment. Harvard Business School Press: Boston, USA.
Kaplan, R.S. and Norton, D.P., (2008). The Execution Premium. Harvard Business School Press: Boston, USA.
Keegan, D.P., Eiler, R.G. and Jones, C.R., (1989). Are your performance measures obsolete? Management Accounting, 70 (12), pp. 45-50.
Kennerley, M. and Neely, A., (2002). A framework of the factors affecting the evolution of performance measurement systems. International Journal of Operations & Production Management, 21 (11), pp. 1222-1245.
Kennerley, M. and Neely, A., (2003). Measuring performance in a changing business environment. International Journal of Operations & Production Management, 23 (2), pp. 213-229.
Kennerley, M., Neely, A. and Adams, C., (2003). Survival of the fittest: measuring performance in a changing business environment. Measuring
Business Excellence, 7 (4), pp. 37-43.
Lantz, A., (1993). Intervjumetodik. Studentlitteratur: Lund, Sverige.
Lawrie, G. and Cobbold, I., (2004). Third-generation balanced scorecard: evolution of an effective strategic control tool. International Journal of
Productivity and Performance Management, 53 (7), pp. 611- 623.
Lima, E.P., Gouvea Costa, S.E. and Angelis, J.J., (2009). Strategic performance measurement systems: a discussion about their roles. Measuring Business
Excellence, 13 (3), pp. 39-48.
Lingle, J.H. and Schiemann, W.A., (1996). From balanced scorecard to is measurement. Management Review, 85 (56), pp. 56-61.
Lynch, R.L. and Cross K.F., (1991). Measure Up! Blackwell Publishers Ltd: Oxford, UK.
Marr, B. and Schiuma, G., (2003). Business performance measurement – past, present and future. Management Decision, 41 (8), pp. 680-687.

77
McAdam, R. and Bailie, B., (2002). Business performance measures and alignment impact on strategy – the role of business improvement models. International Journal of Operations & Production Management, 22 (9), pp. 976-996.
Melnyk, S.A., Stewart, D.M. and Swink, M., (2004). Metrics and performance measurement in operations management: dealing with the metrics maze. Journal of Operations Management, 22, pp. 209-217.
Melnyk, S.A., Calantone, J., Luft, J., Stewart, D.M., Zsidisin, G.A., Hanson, J. and Burns, L., (2005). An empirical investigation of the metrics alignment process. International Journal of Productivity and Performance Management. 54 (5/6) pp. 312-324.
Mendibil, K. and Macbryde, J., (2006). Factors that affect the design and implementation of team based performance measurement systems. International Journal of Productivity and Performance Management, 55 (2), pp. 118-142.
Merriam, S.B., (1994). Fallstudien som forskningsmetod. Studentlitteratur: Lund, Sverige.
Meyer, C., (1994). How the Right Measures Help Teams Excel. Harvard
Business Review, May-June, pp 95-103.
Mintzberg, H., (1994). The Rise and Fall of Strategic Planning. Prentice Hall: Hertfordshire, UK.
Najmi, M., Fan, I. and Rigas, J., (2005). A framework to review performance measurement systems. Business Process Management Journal, 11 (2), p.109.
Neely, A., (1999). The performance measurement revolution: why now and what next? International Journal of Operations and Production Management, 19 (2), pp. 205-228.
Neely, A., (2005). The evolution of performance measurement research: Developments in the last decade and a research agenda for the next. International Journal of Operations & Production Management, 25 (12), pp. 1264-1277.
Neely, A. and Bourne, M., (2000). Why measurement initiatives fail. Measuring Business Excellence, 4 (4), pp. 3-6.
Neely, A., Adams, C. and Crowe, P., (2001). The performance prism in practice. Measuring Business Excellence, 5 (2), pp. 6-12.
Neely, A., Gregory, M. and Platts, K., (2005). Performance measurement system design, a literature review and research agenda. International Journal of Operations and Production Management, 25 (12), pp. 1228-1263.

78
Neely, A., Mills, J., Platts, K. and Gregory M., (1994). Realizing Strategy through Measurement. International Journal of Operations & Production Management, 14 (3), pp. 140-152.
Neely, A., Mills, J., Platts, K., Gregory M. and Richards, H., (1996). Performance measurement system design: Should process based approaches be adopted? International Journal of Production Economics, 46 (47), pp. 423-431.
Neely, A., Mills, J., Platts, K., Richards, H., Gregory M., Bourne, M. and Kennerley, M.P., (2000). Performance measurement system design: developing and testing a process based approach. International Journal of Operations and Production Management, 20 (10), pp. 1119-1145.
Niven, P.R., (2006). Balanced Scorecard Step by Step: Maximizing
Performance and Maintaining Results. John Wiley and Sons, Inc: New Jersey, USA.
Olesen, J., (1992). Concurrent development in Manufacturing-based upon
dispositional mechanisms. Doctorial dissertation, The Technical University of Denmark: Lyngby, Denmark.
O´mara, C.E., Hyland, P.W. and Chapman, R.L., (1998). Performance measurement and strategic change. Managing Service Quality, 8 (3), pp. 178-182.
Paranjape, B., Rossiter B. and Pantano, V., (2006). Insights from the Balanced Scorecard: Performance measurement systems: successes, failures and future - a review. Measuring Business Excellence, 10 (3), pp. 4-14.
Radnor, Z.J. and Barnes, D., (2007). Historical analysis of performance measurement and management in operations management. International Journal of Productivity and Performance Management, 56 (5/6), pp. 384-396.
Rigby, D., (2001). Management tools and techniques: A Survey. California
Management Review, 43 (2), pp. 139-160.
Rolstadås, A., (1998). Enterprise performance measurement. International Journal of Operations & Production Management, 18 (9/10), pp. 989-999.
Salloum, M. and Wiktorsson M., (2009). From Metric to Process: Towards a Dynamic and Flexible Performance Measurement System for Manufacturing Systems. Proceedings of 3rd Swedish Production Symposium 2009, Gothenburg, Sweden.
Salloum, M., Wiktorsson, M., Bengtsson, M. and Johansson, C., (2010). Aligning Dynamic Performance Measures. Proceedings of 6th European Conference of Management, Leadership and Governance, Wroclaw, Poland.

79
Salloum, M., Bengtsson, M., Wiktorsson, M. and Johansson, C., (2011). Realising dynamic abilities in a measurement system – A participatory case study, Proceedings of 4th Swedish Production Symposium 2011, Lund, Sweden.
Salloum, M. and Wiktorsson, M., (2011). Dynamic abilities in performance measurement system: a case study on practice and strategies. Proceedings of 18th International Annual EurOMA Conference, Cambridge, UK.
Santos, S.P, Belton, V. and Howick, S., (2002). Adding value to a performance measurement by using system dynamics and multi-criteria analysis. International Journal of Operations & Production Management, 22 (11), pp. 1246-1272.
Searcy, C., Karapetrovic, S. and McCartney, D., (2006). Application of a systems approach to sustainable development performance measurement. International Journal of Productivity and Performance Management, 57 (2), pp. 182-197.
Skinner, W., (1974). The decline, fall and renewal of manufacturing. Industrial
Engineering, pp. 32-38.
Slack, N., Chambers, S. and Johnston, R., (2004). Operations Management.
4th edition. Pearson Education: Harlow, UK.
Smith, J.H., (1998). The enduring legacy of Elton Mayo. Human Relations, 51 (3), p. 221.
Smith, M., (2005). The balanced scorecard. Financial Management, February, pp. 27-28.
Tangen, S., (2004), Evaluation and Revision of Performance Measurement
Systems. Doctorial dissertation, Kungliga Tekniska Högskolan: Stockholm, Sweden.
Tapinos, E., Dyson, R.G. and Meadows, M., (2005). The impact of performance measurement in strategic planning. International Journal of Productivity and Performance Management, 54 (5/6), pp. 370-382.
Taticchi, P., and Balachandran K.R., (2008). Forward performance measurement and management integrated frameworks. International Journal of Accounting and Information Management, 16 (2), pp. 140-154.
Tatikonda, L.U. and Tatikonda, R.J., (1998). We need dynamic performance measures. Management Accounting, 80 (3), pp. 49-53.
Taylor, S.J. and Bodgan, R., (1998). Introduction to Qualitative Research
Methods– A guide and resource 3rd edition. John Wiley & Sons Inc: USA.

80
Townley, B., Cooper, D.J., and Oakes, L., (2003). Performance Measures and the Rationalization of Organizations. Organizational Studies, 24 (7), pp. 1045-1071.
Van Aken, M.E., Letens, G., Coleman, G.D., Farris, J. and Van Goubergen, D., (2005). Assessing maturity and effectiveness of enterprise performance measurement systems. International Journal of Productivity and Performance Management, 54 (5/6), pp. 400-418.
Waal, A.A. and Counet, H., (2009). Lessons learned from performance management systems implementations. International Journal of
Productivity and Performance Management, 58 (4), pp. 367- 390.
Waggoner, D., Neely, A.D. and Kennerley, M.P., (1999). The forces that shape organisational performance measurement systems: An interdisciplinary review. International Journal of Production Economics, 60 (61), pp. 53-60.
Wisner, J.D. and Fawcett, S.E., (1991). Linking Firm Strategy to Operating Decisions Through Performance Measurement. Production and Inventory Management Journal, 32 (3), pp. 5-11.
Witcher, B., (2002). Hoshin kanri: a study of practice in the UK. Managerial
Auditing Journal, 17 (7), pp. 390-396.
Witcher, B., (2003). Policy management of strategy (Hoshin Kanri). Strategic
Change, 12, pp. 83-94.
Witcher, B. and Chau, V.S., (2007). Balanced Scorecard and Hoshin Kanri: Dynamic Capabilities for Managing Strategic Fit. Management Decision, 45 (3), pp. 518-538.
Yin, R.K., (1994). Case study research: Design and methods. 2nd edition. Sage Publications Inc: Thousand Oaks, USA.
Yin, R.K., (2009). Case study research: Design and methods. 4th edition. Sage Publications Inc: Thousand Oaks, USA.