towards effective design treatment for right turns at
TRANSCRIPT

Portland State University Portland State University
PDXScholar PDXScholar
TREC Friday Seminar Series Transportation Research and Education Center (TREC)
2-5-2016
Towards Effective Design Treatment for Right Turns Towards Effective Design Treatment for Right Turns
at Intersections with Bicycle Traffic at Intersections with Bicycle Traffic
David Hurwitz Oregon State University
Christopher Monsere Portland State University, [email protected]
Follow this and additional works at: https://pdxscholar.library.pdx.edu/trec_seminar
Part of the Transportation Commons, Urban Studies Commons, and the Urban Studies and Planning
Commons
Let us know how access to this document benefits you.
Recommended Citation Recommended Citation Hurwitz, David and Monsere, Christopher, "Towards Effective Design Treatment for Right Turns at Intersections with Bicycle Traffic" (2016). TREC Friday Seminar Series. 33. https://pdxscholar.library.pdx.edu/trec_seminar/33
This Book is brought to you for free and open access. It has been accepted for inclusion in TREC Friday Seminar Series by an authorized administrator of PDXScholar. Please contact us if we can make this document more accessible: [email protected].

TOWARD EFFECTIVE DESIGN TREATMENTS FOR RIGHT-HOOK CRASHES AT INTERSECTIONS WITH
BICYCLE TRAFFIC
PSU FRIDAY SEMINARFEBRUARY 5, 2015
Research Team:David Hurwitz, Associate Professor, Co-PI, OSU Chris Monsere, Associate Professor, Co-PI, PSUMafruhatul Jannat, PhD ’15, OSU Jennifer Warner, MS ’15, OSUAli Razmpa, MS candidate, GRA, PSU

Crash Review (2007-2011), Statewide
1
4,072 reported bicycle-involved crashes 504 (12.3%) typed as a “potential” right-hook crash

2
Bicycle-Car Crash, 3568,
88%
Potential Right Hook Crash, 504,
12%

Right-Hook Severity Summary
3
4.2%
27.8%
61.7%
5.8%
0.6%
PDO
C
B
A
K
0.0% 50.0% 100.0%PDO C B A K

4
Intersection, 371, 74%
Driveway, 133, 26%

5
Traffic Signals, 267, 72%
Minor Stop , 88, 24%
4-Way Stop , 14, 4%
No Control, 2, 0%

6
No Right Turn Lane, Bike
Lane, 158, 59%
No Right Turn Lane, No Bike Lane, 66, 25%
Right Turn Lane, Bike Lane, 26,
10%
Right Turn Lane, No Bike Lane, 17, 6%
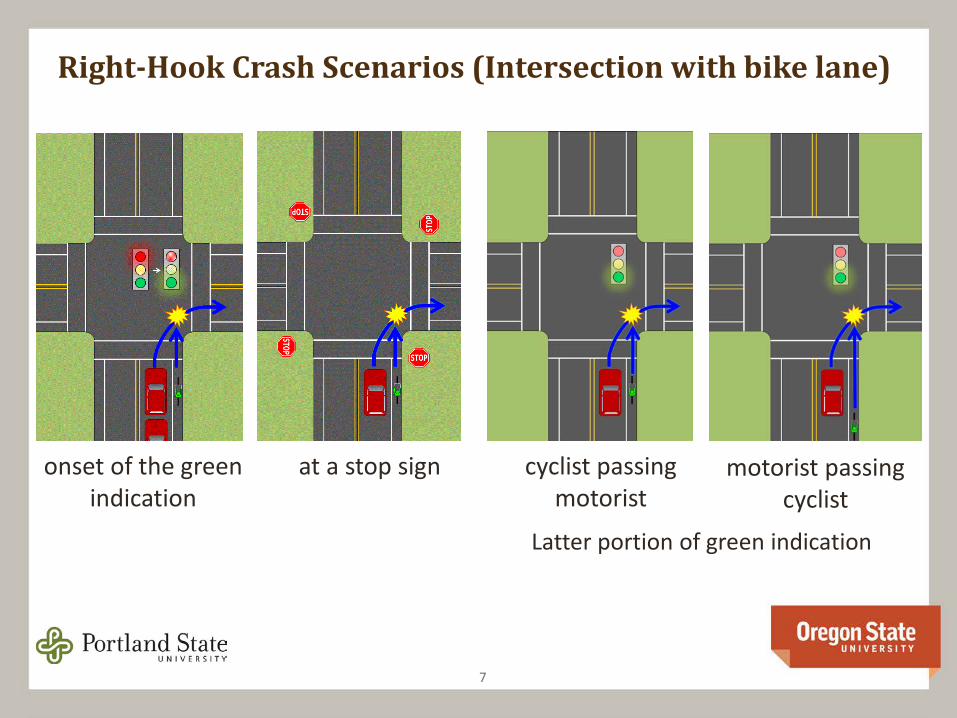
Right-Hook Crash Scenarios (Intersection with bike lane)
7
onset of the green indication
cyclist passing motorist
motorist passing cyclist
Latter portion of green indication
at a stop sign

Right-Hook Crash Scenarios (Intersection with bike lane)
8
onset of the green indication
cyclist passing motorist
motorist passing cyclist
Latter portion of green indication
at a stop sign

Methodology
9
Simulator Experiment 2
• Evaluate the effectiveness of four categories of treatments to mitigate right-hook crashes.
Simulator Experiment 1
• Experimentally verify the influence of four factors that potentially contribute to right-hook crashes.
Field Validation
• Validate through field observations the motorist-bicyclist interaction exhibited in Simulator Experiment 1.

OSU Driving Simulator
10
View from outside the car View from inside car w/bicycle
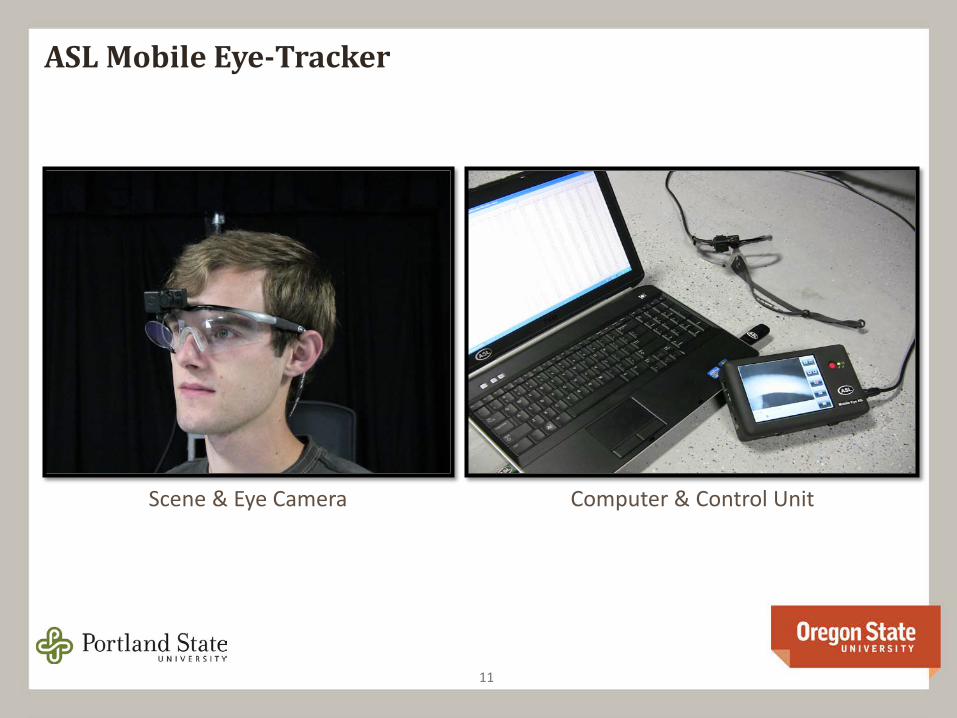
ASL Mobile Eye-Tracker
11
Scene & Eye Camera Computer & Control Unit

Simulator Experiment 1
12
Purpose:• Examine motorist behavior in response to four factors that
potentially contribute to right-hook crashes.
Research Objectives:• Determine how motorists’:
• visual attention• situational awareness• crash avoidance
• is influenced by the experimental factors.

Experiment 1 – Independent Variables
13
Name of the Variable Levels
Relative position of bicyclist
NoneOne (1) bicyclist riding in front of the motorist in an adjacent bicycle lane to the rightOne (1) bicyclist coming from behind the motorist in an adjacent bicycle lane to the right
Speed of bicyclistLower (12 mph)Higher (16 mph)
Presence of oncoming vehicular trafficNoneThree (3) vehicles
Presence of conflicting pedestrianNone
One (1) pedestrian walking towards the motorist

Experiment I – Experimental Drives
14
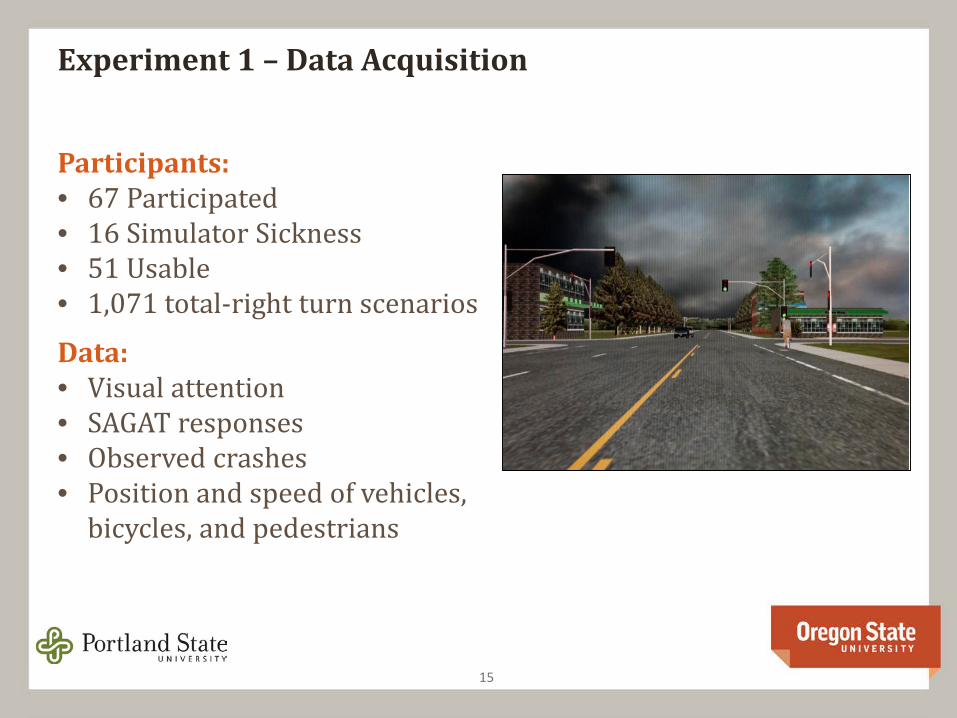
Experiment 1 – Data Acquisition
15
Participants:• 67 Participated• 16 Simulator Sickness• 51 Usable • 1,071 total-right turn scenarios
Data:• Visual attention• SAGAT responses• Observed crashes• Position and speed of vehicles,
bicycles, and pedestrians

Visual Attention – Areas of Interest (AOIs)
16

Visual Attention – Avg Total Fixation Durations (ATFD)
17
3.69
0.32 0.23 0.110.34 0.46
2.26
0.00
0.50
1.00
1.50
2.00
2.50
3.00
3.50
4.00
4.50
5.00
Pedestrian bicyclist Signaloverhead
Signal_side RV mirror Side mirror Oncomingveh
Dur
atio
n (s
ec)
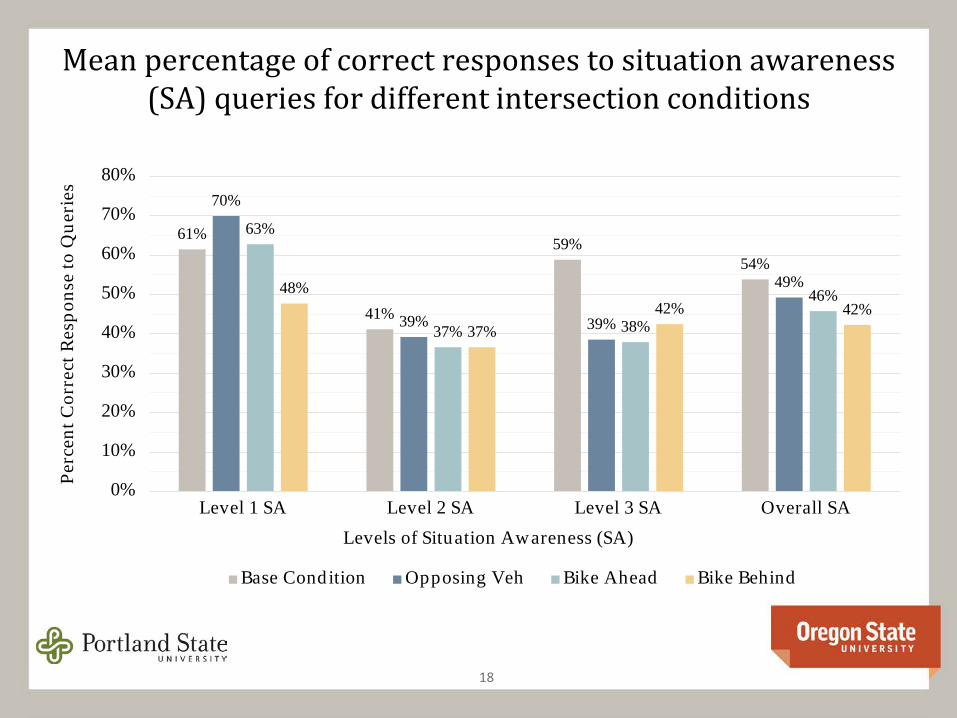
Mean percentage of correct responses to situation awareness (SA) queries for different intersection conditions
18
61%
41%
59%54%
70%
39% 39%
49%
63%
37% 38%
46%48%
37%42% 42%
0%
10%
20%
30%
40%
50%
60%
70%
80%
Level 1 SA Level 2 SA Level 3 SA Overall SA
Perc
ent C
orre
ct R
espo
nse
to Q
ueri
es
Levels of Situation Awareness (SA)
Base Condition Opposing Veh Bike Ahead Bike Behind

Mean percentage of correct responses to situation awareness (SA) queries for different intersection conditions
19
61%
41%
59%54%
70%
39% 39%
49%
63%
37% 38%
46%48%
37%42% 42%
0%
10%
20%
30%
40%
50%
60%
70%
80%
Level 1 SA Level 2 SA Level 3 SA Overall SA
Perc
ent C
orre
ct R
espo
nse
to Q
ueri
es
Levels of Situation Awareness (SA)
Base Condition Opposing Veh Bike Ahead Bike Behind

Crash Avoidance: Time-to-Collision (TTC)
20
• Simulator:• Time-to-collision is a
continuous value that changes in time
• Bikes in simulator do not change speed.
• Field• Post-encroachment
time (PET) is a discrete time measurement

Crash Avoidance: Crashes
21
From 1,071 right turns, 26 collisions observed: • 66% did not check mirror before turning• 5% looked but didn’t see • 18% assumed the bike would yield or there was enough time
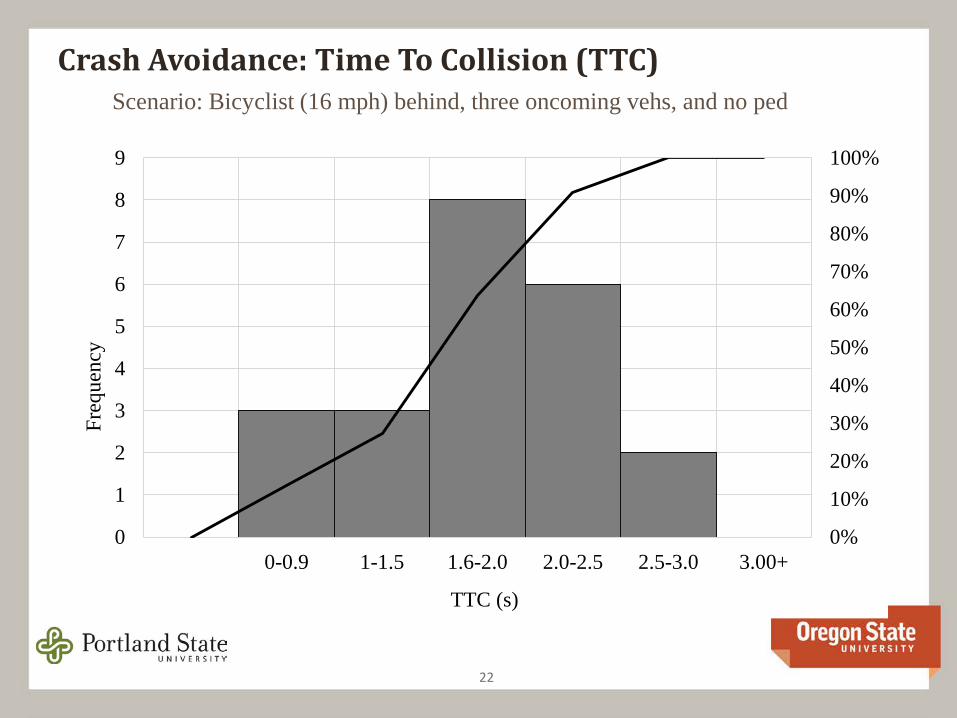
Crash Avoidance: Time To Collision (TTC)
22
0%
10%
20%
30%
40%
50%
60%
70%
80%
90%
100%
0
1
2
3
4
5
6
7
8
9
0-0.9 1-1.5 1.6-2.0 2.0-2.5 2.5-3.0 3.00+
Freq
uenc
y
TTC (s)
Scenario: Bicyclist (16 mph) behind, three oncoming vehs, and no ped

Crash Avoidance: Time To Collision (TTC)
23
0%
10%
20%
30%
40%
50%
60%
70%
80%
90%
100%
0
1
2
3
4
5
6
7
8
9
0-0.9 1-1.5 1.6-2.0 2.0-2.5 2.5-3.0 3.00+
Freq
uenc
y
TTC (s)
Scenario: Bicyclist (16 mph) behind, three oncoming vehs, and no ped

Crash Avoidance: Near-Crashes
24
From 408 right turns, 28 near-collisions observed:• 58% did not check mirror before turning• 23% looked but didn’t see• 19% assumed bike would yield or there was enough time

Field Validation
25
• November 5, 2014 to February 12, 2015
• All days of week• 144 hours
• Extraction of 43 events with measured PET < 5 seconds

Comparison of All Field and Simulator PET/TTCs
26
0%
10%
20%
30%
40%
50%
60%
70%
80%
90%
100%
0
5
10
15
20
25
30
0-0.9 1-1.5 1.5-2 2-2.5 2.5-3 3+
Freq
uenc
y
PET/TTC (s)
Field Simulator

Simulator Experiment 2
27
Purpose:• Examine motorist behavior in response to four
different categories of right-hook crash treatments
Research Objectives:• Identify engineering countermeasures that will
reduce frequency and severity of RH crashes
• Evaluate and compare these countermeasures
• Provide guidance to ODOT regarding the selection of design countermeasures

28
Experiment 2- Independent Variables
Dashed white bike line with stencil,
single line
Dashed white bike line with stencil,
double line
Dashed green bike lanes with white
outline
Full green bike lane with dashed white
outline
ODOT OR10-15b “Turning Vehicles Yield to Bicycles”
Larger curb radii, 30ft Smaller curb radii, 10ft With islands With islands and green pavement markings
PROTECTED INTERSECTIONS

Experiment 2- Experimental Drives
29

Experiment 2- Data Acquisition
30
Participants:• 46 Participated• 18 Simulator Sickness• 28 Usable • 616 total-right turn scenarios
Data:• Observed crashes• Visual attention• Position and speed of vehicles,
bicycles, and pedestrians

Experiment 2- Visual Attention… ATFD
31
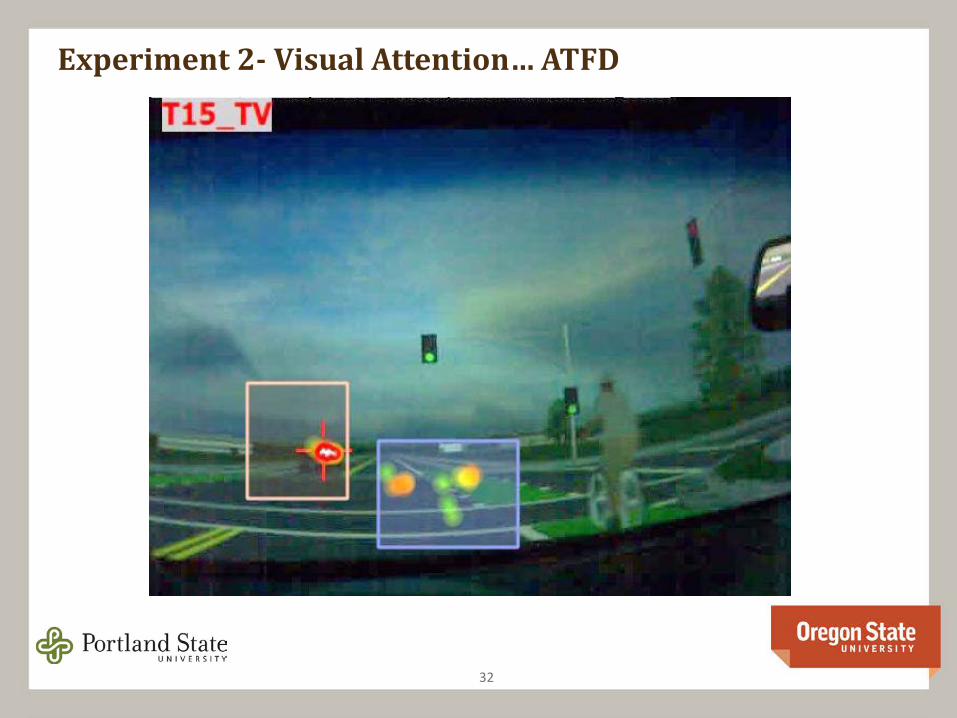
Experiment 2- Visual Attention… ATFD
32

Experiment 2- Visual Attention… ATFD
33
0.00 0.25 0.50 0.75 1.00 1.25 1.50 1.75 2.00 2.25 2.50 2.75
Bicyclist in Side-mirror
Bicyclist in Rear-mirror
Bicyclist
Side-mirror
Rear-mirror
Turning Vehicle
Signal
Pavement Marking
Signage
Dutch Intersection Pavement Marking
Dutch Intersection Island
Duration (sec)
Average Total Fixation Duration, by Signage Treatment Level
S0S1

Experiment 2- Visual Attention… ATFD
34
0.00 0.25 0.50 0.75 1.00 1.25 1.50 1.75 2.00 2.25 2.50 2.75
Bicyclist in Side-mirror
Bicyclist in Rear-mirror
Bicyclist
Side-mirror
Rear-mirror
Turning Vehicle
Signal
Pavement Marking
Signage
Dutch Intersection Pavement Marking
Dutch Intersection Island
Duration (sec)
Average Total Fixation Duration, by Signage Treatment Level
S0S1

Experiment 2- Visual Attention… Motorist Fixation on Bicyclist
35
Frequency of fixation
SignageS0 S1
Total (n) 296 300Fixated 228 242
% 77% 81%

Experiment 2- Crash Avoidance
36

Experiment 2- Crash Avoidance
37
0%
10%
20%
30%
40%
50%
60%
70%
80%
0
2
4
6
8
10
12
14
16
18
20
0.00 0.90 1.50
Freq
uenc
y
TTC Value (sec)
Distribution of TTC Values by Treatment D Level
D0D1Cumulative Frequency, D0Cumulative Frequency, D1

Experiment 2- Crash Severity
38

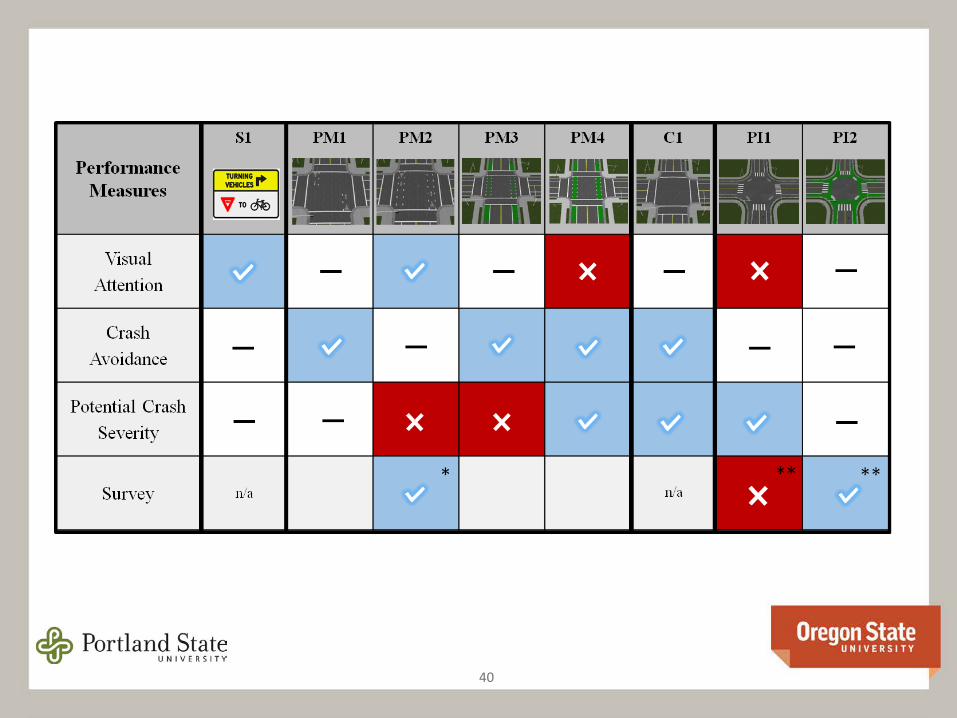
Final Comparison
• Each treatment was evaluated based on the following:
• Visual attention• Measurable change in longer AFTD towards bicycle targets
• Crash avoidance• Frequency of low and moderate TTC observations
• Crash severity• Speed of turning vehicles and variance of speed
39
40

41
Recommendations
Dashed white bike line with stencil,
single line
Dashed white bike line with stencil,
double line
Dashed green bike lanes with white
outline
Full green bike lane with dashed white
outline
ODOT OR10-15b “Turning Vehicles Yield to Bicycles”
Larger curb radii, 30ft Smaller curb radii, 10ft With islands With islands and green pavement markings
PROTECTED INTERSECTIONS

Acknowledgements
42
PhD Student:• Mafruhatul Jannat, PhD ’15, OSU
MS Students:• Jennifer Warner, MS anticipated spring 2015, OSU• Ali Razmpa, MS anticipated spring 2016, PSU
Undergraduate Research Assistants:• Amy Wyman, UHC anticipated spring 2017, OSU• Kayla Fleskes, BSCE anticipated spring 2016, OSU• Katie Mannion, BSCE anticipated spring 2016, OSU• Amber Meeks, BSCE anticipated spring 2018, OSU

Questions?
43
David Hurwitz, PhDAssociate ProfessorOregon State UniversityEmail: [email protected]
and
Chris Monsere, PhD, PEDepartment Chair and Associate Professor Portland State UniversityEmail: [email protected]