towards framework for the virtual data warehousezaiane/postscript/thesis/yuanji... · towards...
TRANSCRIPT

Towards Framework for the Virtual Data Warehouse
Yuan Ji Page 1 6/13/2003
Towards Framework forThe Virtual Data Warehouse
Course-based MS Report by Yuan JiApril 20, 2001

Towards Framework for the Virtual Data Warehouse
Yuan Ji Page 2 6/13/2003
Table of Content1. Introduction and Background..................................................................4
1.1 Data Warehouse .......................................................................................................... 4What is a data warehouse?............................................................................................... 4Operational data vs. informational data ........................................................................... 5OLTP vs. OLAP............................................................................................................... 6Multidimensional data and OLAP operations................Error! Bookmark not defined.Advantage of Data Warehouse ........................................................................................ 6Disadvantage of data warehouse...................................................................................... 7
1.2 Data Warehouse Architectures .................................................................................. 7Data mart.......................................................................................................................... 7Central data warehouse.................................................................................................... 8Distributed data warehouse.............................................................................................. 8Middle-ware approach: Virtual Data Warehouse ............................................................ 9
1.3 Multidimensional Data Model and OLAP operations........................................... 10Measures and dimensions .............................................................................................. 10Multidimensional data cube........................................................................................... 12OLAP operations ........................................................................................................... 12Database design ............................................................................................................. 13Implementation Architectures........................................................................................ 14
1.4 SQL and Data Cube operator .................................................................................. 15SQL aggregation function.............................................................................................. 15Problems with GROUP BY ........................................................................................... 15Data Cube operator ........................................................................................................ 16
1.5 Modeling Multidimensional Databases ................................................................... 19Data Model..................................................................................................................... 19Operators........................................................................................................................ 20
1.6 Multidimensional data modelMDMDMDMD and algebraic query languageMDMDMDMD----AAAA ............. 21TheMD data model ....................................................................................................... 21Example. ........................................................................................................................ 21QueryingMD database .................................................................................................. 24
1.7 Microsoft SQL Server Multidimensional Expressions (MDX) ............................. 27FoodMart Sales Cube sample ........................................................................................ 27MDX syntax................................................................................................................... 28Slicer specifications ....................................................................................................... 29
2. Virtual Data Warehouse System Design ...............................................31
2.1 System Architecture.................................................................................................. 34

Towards Framework for the Virtual Data Warehouse
Yuan Ji Page 3 6/13/2003
2.2 Schema Repository.................................................................................................... 35
2.3 XML Multi-Dimensional Query Language (XMDQL) ......................................... 39basic format....................................................................................................................39examples ........................................................................................................................ 39Path syntax .....................................................................................................................41XMDQL DTD................................................................................................................ 41
2.4 Query Distribution and Execution .......................................................................... 423. Implementation............................................Error! Bookmark not defined.
3.1 Distributed System Architecture .................................Error! Bookmark not defined.Corba..............................................................................Error! Bookmark not defined.SOAP .............................................................................Error! Bookmark not defined.
3.2 Implementation Tools ...................................................Error! Bookmark not defined.Jakarta Tomcat ............................................................................................................... 32Xerces Java Parser ......................................................................................................... 33Apache SOAP ................................................................................................................ 33
4. Conclusion and Future Work.................................................................45Reference ......................................................................................................45

Towards Framework for the Virtual Data Warehouse
Yuan Ji Page 4 6/13/2003
AbstractThis report presents a survey of data warehouse technology and an introduction of aframework for the implementation of virtual data warehouse. In the first par of survey,we briefly give a background of data warehouse and related concepts, and in the secondpart, we investigate query model and query language of data warehouse. Then wepresented our virtual data warehouse with system design and implementation. Onecontribution of our work is proposed a new data warehouse query language XMDQL(XML Multidimensional Data Query language) that is in XML format.
1. Introduction and Data Warehouse Background
This essay is based on DIVE-ON (Datamining in an Immersed Virtual Environment OverNetwork) project, which is a system that utilizes virtual reality, databases, distributedcomputing to visualize data mining. The complete system consists of three parts: VirtualData Warehouse(VDW), Visualization Control Unit (VCU) and User Interface manager(UIM). VCU and UIM provide data cube handling and interactive virtual mining tools tothe user. And our work is mostly in VDW part, which is responsible for data warehousemanagement and query execution.
In this section, we will explain some basic concepts in data warehouse area, and datawarehouse architecture plus multidimensional data model.
1.1 Data Warehouse
The data warehousing market is growing tremendously. According to a Surey.com report,“the worldwide spending was expected to rise from $37.4 billion 1999 to $148.5 billionby 2003. Also by 2003, the average amount of data that can be used for warehousing isexpected to increase to 1.1 TB”[Hammond99]. Data warehouse technologies have beensuccessfully deployed in many industries: manufacturing (for order shipment andcustomer support), retail (for user profiling an inventory management), financial services(for claims analysis, risk analysis, credit card analysis, and fraud detection),transportation (for fleet management), telecommunications (for call analysis), andhealthcare (for outcomes analysis)[Chaudhuri97].
What is a data warehouse?
Ralph Kimball in his book “The Data Warehouse Toolkit”[Kimball96] states that a datawarehouse is “a copy of transaction data specifically structured for query and analysis”.Data warehouse is informational and analysis and decision support oriented, notoperational or transaction processing oriented.
William Inmon, who coined the term “data warehouse” in 1990, defined a datawarehouse as a “subject oriented, integrated, time-variant, non-volatile collection of datathat is used primarily in organizational decision making.”[Inmon92]

Towards Framework for the Virtual Data Warehouse
Yuan Ji Page 5 6/13/2003
• Subject oriented. Subject-oriented in decision-support system is compared toapplication oriented in operational systems. In operational systems, data is organizedto support specific business process, thus, the same data might be organizeddifferently in different system. For examples, customer may be presented by differenttables in traditional databases, but in data warehouse, we only have one customerobject across the whole system. In other words, captures the basic nature of thebusiness environment.
• Integrated. Integration is the most important aspect of the data warehouseenvironment, and it means data found within the data warehouse is integrated, or hasbeen cleaned. It may appear in consistent naming conventions, in consistentmeasurement of variables, in consistent encoding structures, in consistent physicalattributes of data, and so forth.
• Time-variant . Time variant has two issues. First, informational data as a timedimension, and it is different in operational environment as in data warehouse. Theinformational data is accurate when you access it, but data warehouse contains historydata for last 5 to 10 years in most common siuations.
Another point is that data warehouse data represents data over a long time horizon –from five to ten years, while the time horizon represented for the operationalenvironment is much shorter - from the current values of today up to sixty to ninetydays. That’s because operational applications must do lots of transaction processes, sofor performance they have to carry as few amount of data as possible. Thereforeoperational application data has a short time horizon as designed.
• Nonvolatile. We know the typical operational system only keeps data for a shortperiod of time, e.g., 3 to 6 months, as it is only interesting for the daily businessduring this time span. And data is changing all the time. However, in a data analysissituation, data is kept or a pretty longer period, and after the data is in the datawarehouse, there are no modifications to be made to this information, or very raremidiications.
Operational data vs. informational data
To compare data warehouse and operational databases, we also need to distinguish twokinds of data, operational data and informational data. Operational data is the data youuse to run your business, and is typically stored in relational databases, but may be storedin legacy hierarchical or flat file formats as well.
Informational data is the data stored in data warehouse, and it’s typically in a format thatmakes analysis much easier. Analysis can be in the form of decision support, reportgeneration, executive information systems, and more in-depth statistical analysis.Informational data comes from operational data, after some preprocessing, like datacleaning, integrating.

Towards Framework for the Virtual Data Warehouse
Yuan Ji Page 6 6/13/2003
OLTP vs. OLAP
Not only data are different in data warehouses and in operational systems, but also thetools. The data warehouse supports on-line analytical processing (OLAP), which requiresquite different functions from the on-line transactional processing (OLTP) applications.
OLTP applications typically automate structured and repeated data processing tasks forday-to-day operations of companies such as sales transactions, banking transactions.These tasks consist of short, atomic, isolated transactions with detailed, up-to-date dataand often by reading or writing a few records in their relational databases. Consistencyand recoverability of the database are critical, and maximizing transaction throughput isthe key performance issue.
Data warehouses, in contrast, are targeted for decision support, and are maintainedseparately from the companies’ operational databases. OLAP tools only handle historical,summarized and consolidated rather than detailed, individual records.
Advantage of Data Warehouse
[Sakaguchi96] surveyed 456 articles about data warehouse and gave the followingadvantage of data warehouse from those articles:
• Simplicity . This is the highest frequently mentioned advantage. Because of itssubject-oriented feature, data warehouses provide a single image of business objectby integrating various operational data sources. So it makes existing legacy systemsstill useful and combines inconsistent data from many legacy systems into onecoherent set.
• Quality Data. Data warehouse gives better quality data such as consistency,accuracy, and documentation.
• Fast Access. Since data warehouses integrate all data from different data sources inone place, users don’t need to login many systems, and response time should bereduced.
• Easy to Use. Because data warehouses copy some of the operational data and put in aseparate database, queries from users do not interfere with normal operations, andwith the help of OLAP tools, it’s much easier for decision makers to access businessdata.
• Separate decision-support operation from production operation.As we saidbefore, data warehouses separate operational, continually updated transaction datafrom historical, more static data required for business analysis. So managers andanalysts can use historical data in data warehouse for their decision-making activitieswithout slowing doing down the production operation in operational systems.

Towards Framework for the Virtual Data Warehouse
Yuan Ji Page 7 6/13/2003
• Gives competitive advantage. Data warehouses help business entities become morecompetitive, better understand customers, and more rapidly meet market demands byproviding better-organized information.
• Ultimate distributed database. Data warehouses gather information from disparateand potentially incompatible locations throughout the company and put it to good use.And we can use middle-ware or other client/server tools to link hose disparate datasources to an ultimate distributed database.
• Operation cost.After building a real data warehouse, it becomes easier to integratenew operational systems, and information-technology group in the company willgenerally require fewer resources.
Disadvantage of data warehouse
• Complexity and anticipation in development. You cannot just buy a datawarehouse; you have to build one because each warehouse has a unique architectureand a set of requirements from the individual needs of the organization. That meansyou cannot apply existing data warehouse to new situation; you have to create fromscratch.
• Takes time to build. To build a data warehouse takes time. Maybe after you finished,the data warehouse was out of date.
• Expensive to build. Data must be moved or copied from existing databases,sometimes manually, and data needs to be preprocessed into a common format. Datapreprocessing may includes data cleaning, integration, transformation, reduction ordiscretization. And these tasks are very expensive.
• Lack of API. Data warehousing software still lack a set of application programminginterfaces (API) like ODBC in relational databases.
• End-user training. Users of data warehouse require training to capitalize onthose data analysis provided by data warehouse.
1.2 Data Warehouse Architectures
The data warehouse can be architected in a variety of ways:
Data mart
Data marts, or localized data warehouses, are small sized data warehouses, and typicallycreated by individual departments or divisions to provide their own decision supportactivities. For example, a data mart can be created for specific products or functions, likeelectronics or customer management. In another example, data mart may be created for

Towards Framework for the Virtual Data Warehouse
Yuan Ji Page 8 6/13/2003
user populations with the same technical environments like Windows system, Unixsystem, etc.
These data marts come from operational databases in departments or regions ofcompanies, and may also pull some data from other departments or divisions. Afterfinished building them, these data marts are no longer coordinating, because differentdata mart has different structure, and user requirements focus in different areas. Maybesome of them can communicate with each other for consolidation and global reporting,but they are independent data warehouses.
The purpose to build a data mart is to get prototype as soon as possible without waitingfor a larger corporate data warehouse, because it’s small and easy to develop. Stand-alonedata marts can be used by organizations with very independent and "nonintersecting"departments as a starting point in an overall strategy for a centralized corporate datawarehouse. But after having several data marts, organizations couldn’t use themcorporately, because they are not consistent with each other. So data marts are only usedbefore building real data warehouse for fast prototype and evaluation.
Central data warehouse
The centralized data warehouse, popularized by IBM's Information Warehouse, is whatwe called data warehouse in common meaning. This central data warehouse copies andstores all operational and external data and adheres to a single, consistent enterprise datamodel. This central data warehouse may be generated from many individual data martsfor better performance and easy accessibility.
Since central data warehouse only has one data model, the data are consistent andcomplete to users in this architecture. So users only have one environment to logon,without worrying about data in different platforms and environments. And most of theprocessing is done at the corporate site, therefore it’s very useful or enterprises.
The main drawback of the central data warehouse is that, as we talked before, it is quitedifficult to develop a global data model for most organizations, because finding a singlestructure for everything is tough. It is also difficult to agree on a corporate wide level ofdetail and naming conventions. Organizations must also carefully manage theperformance and end-user access to centralized warehouses to ensure that the userscontinue to rely on the centralized data warehouse
Distributed data warehouse
Like distributed file systems and distributed database systems, data warehouses can bedistributed in an enterprise. These distributed data warehouses (distributed data marts) areconsist of many local data warehouses (data marts) and can be accessed by the end usersthrough a "warehouse front end". This front end is a kind of software with a global dataimage. It also knows the location and format of the needed data and how to send the

Towards Framework for the Virtual Data Warehouse
Yuan Ji Page 9 6/13/2003
queries to the final destination. When user asks for something, this software will find thelocal data warehouse to perform the query and get the result back.
With the benefits of distribution, distributed data warehouses may be more flexible, havehigher performance and load balancing. Besides, it can be designed to match the topologyof many organizations, such as a corporate data warehouse at the corporate site andregional data warehouses (the data marts) at the branch offices. So corporate queries willgo to corporate ones, and local queries will go to regional ones. And differenttechnologies can e applied to different data warehouses to better match their subjects.
Distributed data warehouse still need a global data model, which is, like central datawarehouse, hard to develop. Besides, global dictionary and topological information makeit even more complicated. Another disadvantage is performance. If the data warehousesare widely distributed, significant performance degradation and service outages canoccur. So it requires considerable trade-offs in data distribution and query optimization.”
Middle-ware approach: Virtual Data Warehouse
All above three architectures need creating real data warehouse systems, that is, you haveto get system requirements, analyze existing database or legacy systems, develop datawarehouse model for the local divisions or the whole enterprise. This is a very timeconsuming task and existing systems are outside of the new data warehouse. How tobuild a data warehouse connected with run-time database or legacy systems becomes aninteresting topic in the early 1990s, and middleware approach provides an alternative totraditional data warehousing, called virtual data warehouse.
Generally, virtual data warehouses use middleware to build direct connections amongdisparate applications, whereas traditional data warehouse provides a central repositoryfor enterprise data. Middleware is software acting as data hubs and allowing access to thecorporate data stored in heterogeneous data sources, like relational databases, legacysystems.
The most popular approach of virtual data warehouse is “wrapper” or “surround’ datawarehouse, that is the old legacy operational data sources are “wrapped” or “surrounded”by middleware where there are no changes made to the underlying operational systems.Ideally, no preprocessing is required to old system; no programs need be coded totransform legacy data; no integrating and cleaning. Instead, you just buy some softwarepackages that can “wrap” your legacy systems to read data from them, very cheap andfast. And like distributed data warehouse, virtual data warehouse still relies on thecreation of an independent meta-data definition of the corporate data, or global datamodel, and therefore, as the same easy-of-use advantages without the complexity ofbuilding a traditional data warehouse system.
However, this approach was criticized by Inmon in the “Virtual Data Warehouse: TheSnake Oil Of The Nineties”[Inmon96]. “…[Snake oil] was pleasing at the moment it was

Towards Framework for the Virtual Data Warehouse
Yuan Ji Page 10 6/13/2003
consumed. But it had no real curative effects, and ultimately was a disappointment tothose who bought it in the hopes that it would do something real.”[Inmon96]
Inmon indicated virtual data warehouse approach failed in several fundamental ways:
• Performance. Operational systems are running for transaction tasks, but OLAPtools may ask for 10,000,000 rows of data in the middle of the on-line transactionprocessing, and no good database designer wants to design databases for that.
• Historical data. Time-variant of data warehouse means a rich amount ofhistorical data, typically 5 to 10 years worth, which providesa foundation foranalysis and slicing_and_dicing data. But operational systems under virtual datawarehouse only contain a minimal amount of history – 30 to 60 days typically. Assuch it cannot organize and manage the historical data because no historical datathere.
• Data structure. The structures in the operational systems are designed to suit theneeds of operational processing, without any idea of data analysis, and the“wrapper” software around them can do nothing for optimizing the structure ofthe data for OLAP.
• Integration . The middleware generally will give you access only to data in itsraw form. There is no integration in the legacy systems beneath the virtual datawarehouse, so OLAP tools that accesses the old legacy data must do theintegration by their own.
• Aggregation. Data warehouse contains summary data, while operational systemdoes not.
Those significant disadvantages impeded the development of virtual data warehouse.
Hybrid Virtual Data Warehouse
However, virtual data warehouse techniques are still attracting to us. So we consideredmixing distributed data warehouse and pure virtual data warehouse to hybrid virtual datawarehouse. According to the name, hybrid virtual data warehouse also works likemiddleware, but the data sources may be data marts or legacy systems. In our approach,historical data is stored in local data warehouses or corporate data warehouses, and wecan also connect to operational system for fresh data.
Since most data comes from data marts, only small part of it is pulled from legacysystem, the performance is not a big issue. We may still have the problem of datastructure, integration, thus the middleware has to be designed carefully, and we can usethe functionality in the OLAP model to do data cleansing.
1.3 Multidimensional Data Model and OLAP operations
Measures and dimensions

Towards Framework for the Virtual Data Warehouse
Yuan Ji Page 11 6/13/2003
The most popular conceptual model for OLAP is the multidimensional view of data in thewarehouse[Chaudhuri97]. For example, we want to build a data warehouse for a grocerystore company, the everyday transaction records contain which customer bought whichproduct at what time. The goods price and soled item amounts are called numericmeasuresthat are the objects of analysis in a multidimensional data model. Thecategorical attributes like product, date, and customer are calleddimensions. Each of thenumeric measures depends on a set of dimensions and the dimensions together areassumed to uniquely determine the measure. Thus the multidimensional data views ameasure as a value in the multidimensional space of dimensions.
Dimensions usually have associated with hierarchies, for example, the Store dimensionmay consist of five aggregation levels: store name, city, region, country, and continent.And the attributes or levels of this dimension may be related via a hierarchy ofrelationship, as above figure 1.1 showed.
Time is a special dimension that is of particular significance to decision support, becausetime dimension has partial order. So it is often treated differently. As in figure 1.2, Timedimension have Year, Quarter, Month, Week and Day levels. But the year can be divided
All Stores
North America Europe Continent
Country
Region
U.S.
WestCentral
East
Seattle Denver
B.C.Alberta Ontario
City
Canada
Boston Vancouver Edmonton Toronto
Store
Store1 Store2 Store4Store3 Store5 Store6
Figure 1.1 Store Hierarchy

Towards Framework for the Virtual Data Warehouse
Yuan Ji Page 12 6/13/2003
into weeks, then days, or quarters, months then days. So we may have multiple routesfrom one level to another.
Multidimensional data cube
Now we have the concept of data cube. The OLAP data cube can be conceptually viewedas a multi-dimensioned cube representing any number of descriptive categories(dimensions) and quantitative values (measures) as following figure 1.3. The OLAP datacube contains summaries of selected detail information from your existing database andsaves it as a multi-dimensional array, rather than the common 2-dimension relationaltables.
OLAP operations
Having multidimensional data cube, an analyst might want to see a subset of it with someattributes and restricted values. Or he/she might need other interactive data querying.These operations, which are part of decision support, are called On-Line AnalyticalProcessing (OLAP).
Year Quarter Month Day
Week
Figure1.2 Time Dimension Partial Order
Pro
duct
Store
Store 1Store 2
Store 3Store 4
Seafoo
Meat
Fruit
Milk
Cereal
Vegetab
Figure 1.3 Multidimensional data cube
TimeJan Feb Mar Apr Jun

Towards Framework for the Virtual Data Warehouse
Yuan Ji Page 13 6/13/2003
To rotate the data cube to show a particular face is calledpivoting. This operation is oftensupported by the multidimensional spreadsheet applications. For example, we may selecttow dimensions Store (in tore level) and Time (in year level) for pivoting, and aggregatesales measure. So the aggregated values are displayed in the two dimensionalspreadsheet, with store names as row headers and years as column headers. The value inthe grid (x,y) coordinate corresponds to the aggregated sales value of store x and year y.
Other operators related to pivoting arerollup or drill-down. Rollup corresponds toaggregating current data on one of the dimensions, for example, aggregating the salesdata in Store dimension from city to region. The drill-down operation is the converse ofrollup. Thus, drilling-down the Store dimension from region to city gets the sales valuefor each city, and further drill-down will get the sales or each individual stores.
Slice_and_dicecorresponds to reducing the dimensionality of the data, i.e., selectingsome subset of the cube. For example, if we slice_and_dice data cube in figure1.3 for aspecific product, we can get a table with dimensions store and month.
Database design
Database designers in OLTP environment often use Entity Relationship (ER) diagramsand normalization techniques. However, the database schemas created by ER diagramare not suitable for decision support systems, where querying and loading aggregateddata need more efficient structure. Most data warehouses use astar schemato representthe multidimensional data model. The database consists of a single fact table and a singletable for each dimension. Each tuple in the fact table consists of a pointer (foreign key) toeach of the dimensions that provide its multidimensional coordinates, and stores thenumeric measures for those coordinates. Each dimension table consists of columns thatcorrespond to attributes of the dimension. Figure 1.4 shows an example of a star schema.
DateStoreIDProductIDCustomerIDUnit_salesStore_cost
DateMonthYear
SoreIDCityRegionCountryContinent
Date
Store
ProductIDProductNameSubCategoryCategory
Product
CustomerIDCustomerNameCityCountry
Customer
Fact Table
Figure 1.4 Star Schema

Towards Framework for the Virtual Data Warehouse
Yuan Ji Page 14 6/13/2003
Implementation Architectures
There are two main approaches used to build multidimensional databases. One approachmaintains the data as k-dimensional matrix based on a non-relational specialized storagestructure, and stores into Multidimensional OLAP (MOLAP) servers. And while buildingthe MOLAP, the database designer also compute all useful aggregations for roll-ups, soroll-ups and drill-downs are answered in the interactive time.
Another approach implements data warehouse on a relational backend, called RelationalOLAP (ROLAP) servers. These ROLAP servers support extensions to SQL and useindexes built on materialized views to efficiently do operations.
Towards Framework for the Virtual Data Warehouse
Yuan Ji Page 15 6/13/2003
2. Data Warehouse Query Language
To end users, the data in data warehouse is in multidimensional status, no matterphysically stored in ROLAP or MOLAP servers. On one hand, decision makers want todo OLAP operations by graphical user interface tools. On the other hand, sophisticatedusers may need a declarative, igh-level query language to perform complex queries.Many extended SQL languages or multidimensional query languages are proposed inrecent years. Here we will introduce Cube operator and two other query models.
2.1 SQL and Data Cube Operator
Gray et al. [Gray95] first proposed an extension to SQL with aCubeoperator to supportmultidimensional query.
SQL aggregation function
Data warehouse usually refers to huge amounts of data, and data analysis applicationslook for usual patterns in those data, so they can extract relevant data from thewarehouse, aggregate it and analyze the results.
Data extraction and aggregation are common in SQL statements. The SQL standardprovides five functions to aggregate the values in a table:COUNT(), SUN(), MIN(),MAX() , and AVG(). In addition, SQL allows aggregation over distinct values byDISTINCT . In many SQL systems, even more functions are provided, such as statisticalfunctions (median, standard deviation, variance, etc.), physical functions (center of mass,angular momentum, etc.), financial analysis (volatility, Alpha, Beta, etc.), or even user-defined functions.
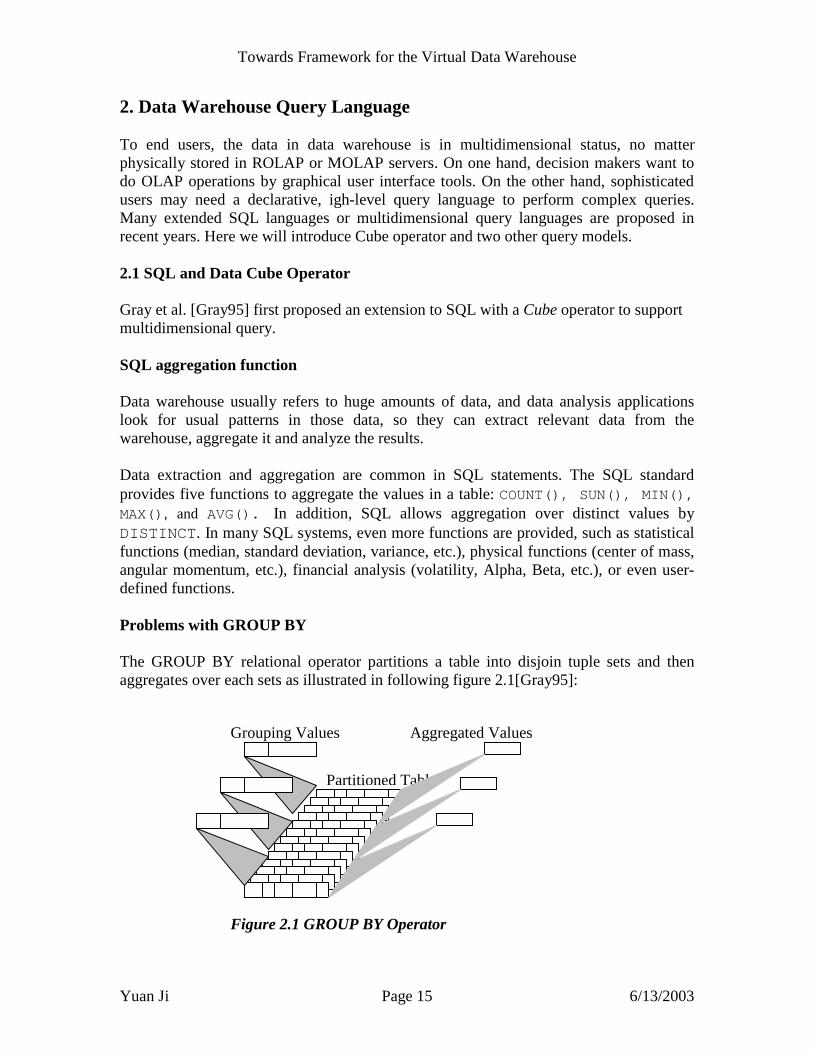
Problems with GROUP BY
The GROUP BY relational operator partitions a table into disjoin tuple sets and thenaggregates over each sets as illustrated in following figure 2.1[Gray95]:
Grouping Values
Partitioned Table
Aggregated Values
Figure 2.1 GROUP BY Operator

Towards Framework for the Virtual Data Warehouse
Yuan Ji Page 16 6/13/2003
There are three common difficulties in data analysis:
1. Histograms. The standard SQLGROUP BYoperator does not allow a directconstruction of histograms (aggregation over computed categories).
2. Roll-up Totals and Sub-Totals for Drill-downs. You have to store each leveli.e. subtotal of the aggregation.
3. Cross Tabulations. Building a cross-tabulation with SQL is even more dauntingsince the result is not a really relational object.
Data Cube operator
Jim Gray et al. [Gray95] proposed an extension to SQL with a new operator, Cube, togeneralize the N-dimensional group-by function.
The data cube operator builds a table containing all the aggregate values. The totalaggregate is represented as the tuple:
ALL , ALL, ALL, …, ALL, f(*)Wheref(*) is an aggregation function.
The original SQLGROUP BYsyntax is:GROUP BY{<column name> [collate clause] , …}
And the extended SQL GROUP BY operator becomes:GROUP BY
{ (<column name> | <expression> )[ AS <correlation name> ][ <collate clause], …}[ WITH (CUBE | ROLLUP)])
For example, we have a relational table of SALES of cars (example comes from[Gray95])
Table 1 SALESModel Year Color SalesChevy 1990 red 5Chevy 1990 white 87Chevy 1990 blue 62Chevy 1991 red 54Chevy 1991 white 95Chevy 1991 blue 49Chevy 1992 red 31Chevy 1992 white 54

Towards Framework for the Virtual Data Warehouse
Yuan Ji Page 17 6/13/2003
Chevy 1992 blue 71Ford 1990 red 64Ford 1990 white 62Ford 1990 blue 63Ford 1991 red 52Ford 1991 white 9Ford 1991 blue 55Ford 1992 red 27Ford 1992 white 62Ford 1992 blue 39
And the SQL statement is:SELECT Model, Year, Color, SUM(sales) AS SalesFROM SalesWHERE Model in {‘Ford’, ‘Chevy’}
AND Year BETWEEN 1990 AND 1992GROUP BY Model, Year, Color WITH CUBE
The result DATA CUBE table is like this:
Table 2 Data CubeModel Year Color SalesChevy 1990 blue 62Chevy 1990 red 5Chevy 1990 white 95Chevy 1990 ALL 1554Chevy 1991 blue 49Chevy 1991 red 54Chevy 1991 white 95Chevy 1991 ALL 198Chevy 1992 blue 71Chevy 1992 red 31Chevy 1992 white 54Chevy 1992 ALL 156Chevy ALL blue 182Chevy ALL red 90Chevy ALL white 236Chevy ALL ALL 508Ford 1990 blue 63Ford 1990 red 64Ford 1990 white 62Ford 1990 ALL 189Ford 1991 blue 55Ford 1991 red 52Ford 1991 white 9Ford 1991 ALL 116Ford 1992 blue 39Ford 1992 red 27

Towards Framework for the Virtual Data Warehouse
Yuan Ji Page 18 6/13/2003
Ford 1992 white 62Ford 1992 ALL 128Ford ALL blue 157Ford ALL red 143Ford ALL white 133Ford ALL ALL 433ALL 1990 blue 125ALL 1990 red 69ALL 1990 white 149ALL 1990 ALL 343ALL 1991 blue 106ALL 1991 red 104ALL 1991 white 110ALL 1991 ALL 314ALL 1992 blue 110ALL 1992 red 58ALL 1992 white 116ALL 1992 ALL 284ALL ALL blue 339ALL ALL red 233ALL ALL white 369ALL ALL ALL 941
CUBEoperator first aggregates over all the<select list> attributes, such as Model,Year, Color here, as in a standardGROUP BY. The result is the last record of the abovetable. Then it substitutesALL for each aggregation columns with attribute values – superaggregation of the global cube. If there are N attributes in the select list, there will be
12 −N super-aggregate values. And suppose the different value account of each attributesare 1C , 2C , …, NC then the cardinality of the resulting cube relation is∏ + )1( iC . For
above example, the table 1 has 18332 =×× rows, while the derived data cube table 2 has48443 =×× rows. And the respective sets are:
Model.ALL = ALL(Model) = {Chevy, Ford}Year.ALL = ALL(Year) = {1990, 1991, 1992}Color.ALL = ALL(Color) = {red, white, blue}
TheALL value is a non-value, likeNULL, andALL becomes a new keyword denoting theset value.
If the application wants only a roll-up or drill-down report, the full cube is too huge tocompute. It is reasonable to offer another functionROLLUPin addition toCUBE. ROLLUPproduces just the super-aggregates:
(f1, f2, …, ALL),...
(f1, ALL, …, ALL),(ALL, ALL, …, ALL).

Towards Framework for the Virtual Data Warehouse
Yuan Ji Page 19 6/13/2003
After defining theCUBEoperator, they also discussed how to address the data cube andproposed some ways to compute the data cube.
2.2 Agrawal’s Multidimensional Data Model
SQL extension with CUBE operator cannot solve all difficulties in multidimensionaldatabases. So several new multidimensional data models and query languages areproposed. Rakesh Agrawal et al. proposed a data model and few algebraic operations formultidimensional databases [Agrawal97].
Data Model
Their data model is derived from multidimensional cube model, and has someoutstanding features [Agrawal97]:
• It is a multidimensional cube with a set of basic operations designed to unify thedivergent styles and to extend the current functionality.
• It treats all dimensions and measures symmetrically. The model also is veryflexible in providing support for multiple hierarchies along each dimension andsupport for ad hoc aggregates.
• The input of each operator is defined on the cube and output of it is also a newcube. Thus the operators are closed and can be freely reordered.
• It keeps the operators number minimal. That means no operator can be expressedin terms of others nor can any one be dropped without sacrificing functionality.
• The modeling framework separates the front-end graphical user interface used bya business analyst from the backend storage system used by the corporation.
The most interesting part of the model is symmetric treatment to dimensions andmeasures. It makes the logical model nice to look at, and operations on the logical modelonly need to handle one type of data. However, it might make the cube much larger thanthe original one, and harder to implement. The model also provides support for multiplehierarchies along each dimension, but it’s not clear in the paper.
In the logical model, data is organized in one or more multidimensional cubes. A cubehas the following components:
• k dimensions.A name iD and a domain idom from which values are taken for
each dimension.• Elements.It is a mapping )(CE from ki domdomdom ×⋅⋅⋅×× 2 to an n-tuple, 0 or
1. The element at ‘position’ kdd ,...,1 of cube C is ),...,)(( 1 kddCE . Therefore, the
model does not require the dimensions to have a ranked, discrete domain.• An n-tuple of names that describes the n-tuple element of the cube.
In this model, measures are also dimensions, so the data cube elements is different fromtraditional cube values, and cube has more logical dimensions than physical one. Theelements of a cube can be 0, 1 or an n-tuple >< nXX ,...,1 . A 0 of the element
corresponding to ),...,)(( 1 kddCE means that combination of dimension values does not

Towards Framework for the Virtual Data Warehouse
Yuan Ji Page 20 6/13/2003
exist in the database. A 1 indicates the existence of that particular combination. And an n-tuple indicates that additional information is available for it. 1 and n-tuple cannot bemixed in one cube, that is if any element is 1, none element canbe n-tuple, and vice-versa.Empty cube is that all the elements of a cube are 0.
Operators
The operators use a cube C withk dimensions as ki DD ,..., . iD also refers to the domain
of dimension iD or we use )(Cdomi if it’s not clear in the context. The lower case letters
like a, b, c refer to constants.
First tow new function elemf and mergef are specified. elemf , also calledelement combining
function, combine several element values into one value. Andmergef , dimension merging
functions, can merge values along a dimension.
Here are the operators defined in [Agrawal97]:• Push. The push operation converts dimensions into elements that can then be
manipulated using function mergef . This operator is needed to allow dimensions
and measures to be treated uniformly.• Pull. The converse of the push operation is pull. Pull creates a new dimension for
a specified member of the elements. The operator is useful to convert an elementinto a dimension so that the element can be used for merging or joining.
• Destroy Dimension. This operation eliminates a dimension D that only has onevalue in its domain. The presence of a single value implies that for the remainingk - 1 dimensions, there is a uniquek – 1 dimensional cube. So removing it we geta uniquek –1 dimensional cube.
• Restriction. This operator removes the cube values of operated dimension thatdoes not satisfy a stated condition.
• Join. The join operator is used to relate information in two cubes. For example,joining an m-dimensional cube C1 with ann-dimensional cube C2 onkdimensions, calledjoining dimensions, will get a new cube aC with m+n-k
dimensions.• Merge. It is an aggregation operation. Merging elements on one dimension can
probably produce a smaller domain dimension, if multiple elements in the originalcube are mapped to the same eleet in the new cube.
The operators proposed in [Agrawal97] have similarity with relational algebra by design.The authors wanted to explore how much of the functionality of current multidimensionalproducts can be abstracted in terms of relational algebra. And by developing operatorsthat can be translated into SQL, they hope to create a fast path for providing OLAPcapability on top of relational database system.

Towards Framework for the Virtual Data Warehouse
Yuan Ji Page 21 6/13/2003
2.3 Cabibbo’s Multidimensional data modelMDMDMDMD and Query Language
Another good multidimensional data model isMD proposed by Cabibbo, et al,[Cabibbo97] [Cabibbo98] [Cabibbo00]. They also introduced three query languageMD-A, MD-C,, andMD-G based on this data model.
The MDMDMDMD data model
Their main contribution isMD, a logical model for OLAP databases “that, unlike othermultidimensional data models, is independent of any specific implementation and as suchprovides a clear separation between practical and conceptual aspects.”[Cabibbo00]
The Multidimensional data model (MD for short) is much different from other datamodels we talked before.MD doesn’t use cube to represent multidimensional data, but f-table, which has more meanings than that in star-schema. Each f-table not only representsa traditional fact table, but also is a function, from coordinates to measures. So the ‘f’ inthe term f-table stands for “function” and “fact”.
Another main construct inMD is dimension, which is the same in cube models.Dimensions are the categories we used to analyze business data. Each dimension has ahierarchy of levels, with descriptions associated. And values of different levels are relatedby roll-up functions, soMD also support partial orders.
MD model consists of several concepts [Cabibbo00]:
• Level. An MD level l is a countable set of values. Different levels are associated withpair wise disjoint sets of values.
• Dimension. An MD dimension is a triple (L, ≤, R) of a finite set of levels; a partialorder on the levels and a family of roll-up functions.
• Scheme. An MD scheme is a triple (D, F, LD) of a finite set of dimensions; a finiteset of f-table schemes and a finite set of level descriptions.
• Coordinate and Instance. Let S=(D, F, LD) be anMD scheme and f[A1,:l1, …,An:ln]:l 0 be an f–table schema inF. A (symbolic)coordinateover an f-table schemef[A 1,:l1, …, An:ln]→ÿM1:l1’, …, M m:lm’ � in F is a function mapping each attributename Ai(1≤ i ≤ n) to an element in li. An instance over f is a partial function that mapscoordinates over f to tuples over <M1,:l1’, …, Mm:lm’>.
Example
We continue using a chain grocery store company as an example to explain theMDmodel. Suppose the grocery store business data has dimensions liketime, product andlocation. The time dimension may be organized in levelsday, month, quarter, year andweek. For instance, April 20, 2000 is an element of the levelday. Elements of leveldayroll-up to elements of levelmonth, but also to elements of levelweek.

Towards Framework for the Virtual Data Warehouse
Yuan Ji Page 22 6/13/2003
Above figure 2.2 shows theMD scheme, over dimensions time, location and product.This scheme has two f-tables, named SALES and COSTOFITEM, and one level description,address. The f-table SALES describes some summary data for the sales transactions,organized along dimensionstime (at day level),location (at store level), andproduct (atitem level). The measures for this f-table areNSales(the number of items sold) andIncome(the gross income), both having typenumeric. Because the costs of items arechanging from month-to-month, we use the f-table COSTOFITEM to represent. The leveldescriptionaddressis used to associate textual information to the elements of the levelstore.
A possible instance for this model scheme example is shown in figure 2.3.
year
quarterweek
month
day
Time
country
city
store
Location
item
Product
dimensions
f-table scheme
SALES[Period:day, Product: item, location: store] → ÿNSales: numeric, Income: numeric�
COSTOFITEM[Product: item, Month: month]→ÿCost: numeric�
Level Description
Address (store) : string
Figure 2.2 The Grocery Store Scheme Example
type
category

Towards Framework for the Virtual Data Warehouse
Yuan Ji Page 23 6/13/2003
Note that two different representations for f-tables are used in the figure. A symboliccoordinate over the f-table SALES is [day : April 1, 2000, item : milk, location : SEdmonton]. The actual instance associates with this entry the value 3 for the measureNSalesand the value 12.98 for the measureIncome. The figure also shows a tabularrepresentation for the level descriptions address.
It is apparent that the notion of “symbolic coordinate” is related with that of “tuple” in therelational model. It can also be noted that the notation used for symbolic coordinatesresembles subscripting into a multi-dimensional array (although in a non-position way).
SALES
Period Product Location NSales Income
April 1, 2000 milk S Edmonton 3 12.98
April 1, 2000 egg S Edmonton 10 51.34
April 1, 2000 bread W Edmonton 3 4.67
April 1, 2000 banana W Edmonton 23 4.54
May 1, 2000 milk S Edmonton 3 14.21
May 1, 2000 egg S Edmonton 6 20.11
May 1, 2000 milk Calgary 3 14.21
May 15, 2000 bread Calgary 2 2.56
May 15, 2000 egg W Edmonton 5 25.53
COSTOFITEM
Cost April-2000 May-2000 June-2000
milk 3.99 4.39 4.99
egg 1.99 2.29 2.59
bread 0.99 1.99 2.49
banana 0.39 0.49 0.59
AddressStore
S Edmonton Calgary Trail
W Edmonton Stony Plain Rd
Calgary 23 Ave.
Figure 2.3. Instance of Grocery Store Scheme

Towards Framework for the Virtual Data Warehouse
Yuan Ji Page 24 6/13/2003
Querying MDMDMDMD database
An MD query is a mapping from instances over an inputMD scheme to instances over anoutputMD scheme. The input and output schemes are defined over the same dimensionsbut different f-tables.
[Cabibbo00] introduced three query languageMD-A, MD-C,, andMD-G. Before wediscuss these query languages, we assume there is an f-table EDMONTONSALES (the outputf-table) with scheme:
EDMONTONSALES [Period : day, Product: item, Location: store] →ÿNSales: numeric� ,
This output f-table represents the number of sales for each item in each day, only for thestores in Edmonton. This sales data can be calculated from the input f-table SALES, havingscheme
SALES[Period: day, Product: item, location: store] → ÿNSales: numeric, Income: numeric�
Algebraic query languageMDMDMDMD----AAAA
Like relational algebra query language,MD-A is an algebra based on a set of operationsover f-tables, manipulating the –tables in procedural way. The operators includeCartesian Product, Natural Join, Roll-up, Level Description, Selection, Simple Projection,Aggregation, Abstraction.
Because we want the sales data for stores in Edmonton, we first extend the input f-tablewith a new attribute over the levelcity by roll-up operator )(2:2
1:1 FlAlAρ . Then we perform a
selection over the new attribute city, which equals “Edmonton”, and finally project outthe additional attribute and unneeded measures. The algebra expression is as following:
[ ] ( )( )( )SALEScityCitystoreLocationEdmontonCityNSalesLocationoductPeriod
::,Pr, ρσπ =→
Calculus query languageMDMDMDMD----CCCC
The calculus query languageMD-C is a first-order calculus for f-tables, and allowsexpressing queries in a declarative way.
An MD-C query whose output f-table has scheme f[A1:l1, …, An, ln] →ÿM1:l1’, …,Mm:lm’ � can be specified by means of an expression of the following form:
{x 1, …, xn: y1, …, ym | ψ(x1, …, xn, y1, …, ym)}
The query EDMONTONSALES can be specified by means of the following calculusexpression:

Towards Framework for the Virtual Data Warehouse
Yuan Ji Page 25 6/13/2003
{day, item, store: NSales |∃income(SALES[ day, item, store]= ÿNSales, Income � ∧
( ) Edmontonstorecitystore =ρ )}
Graphical query languageMDMDMDMD----GGGG
The graphical query languageMD-G provides an interactive way for end-users to queryon a multidimensional database. It describes anMD-G f–table with a graph called f-graph.For example, the f-graph for SALES is shown in figure 2.4.
The central, rectangular node isf-nodeto represent the f–table. Ovals denote levels ofdimensions and parallelograms denote level descriptions. An arc between two levelsrepresents a roll-up function, and arc between an f-node and a measure node associatesthe f-table with measure.
In MD-G, the query is specified by means of several f-graphs to restructure schema. ForEDMONTONSALES example, the input –graph is in figure 2.4, and the restructuring graph isshown on the bottom of figure 2.5, and the output f-graph is shown on the bottom offigure 2.5.
Product
Product:item
type
category
Location:store
city
country address
Period:day
month
quarter
year
week
SALES
NSales Income
Figure 2.4 f-grpah for SALES
location time

Towards Framework for the Virtual Data Warehouse
Yuan Ji Page 26 6/13/2003
MD model is independent of any specific implementation, but we can note it closelyrelated to relational model. The f-table can be stored into relational tables, so it’s easy toimplement on the top of RDBMS.
NSales
Product:item
Product
type
category
Location:store
City=Edmonton
country address
Period:day
month
quarter
year
week
SALES
Income
Figure 2.5 Graphical Query forEDMONTONSALES
location time
Product
Product:item
type
category
Location:store
city
country address
Period:day
month
quarter
year
week
EDMONTON
SALES
NSales
location time
Towards Framework for the Virtual Data Warehouse
Yuan Ji Page 27 6/13/2003
2.4 Microsoft SQL Server Multidimensional Expressions (MDX)
The two models discussed above come from academic, and no implementation has beendone based on them. Here we will take a look at a commercial software product,Microsoft SQL Server OLAP Services, which provides fast and efficient responds to userqueries on multidimensional data.
How multidimensional data is stored in MS SQL Server is unclear, but they provide aquery language to access it, full-fledged, highly functional expression syntax:multidimensional expressions (MDX) [Nolan99].
Since our XMDQL is mostly generated by the idea of MDX, we will discuss MDX in alot more details. Before we introduce MDX expressions, the concepts used in MDX arealmost the same as those we talked before, like cube, dimension, measure and level.
The data model is similar to data cube model, multidimensional cube with dimensions todescribe category information and measures to identify the numerical values. Eachdimension also contains a hierarchy of levels to view data granularly -- each level in adimension is of a finer grain than its parent. But MDX doesn’t support partial order, sothere is only one way from op level to bottom level. In MDX, measures can be alsoviewed as dimension, special dimension.
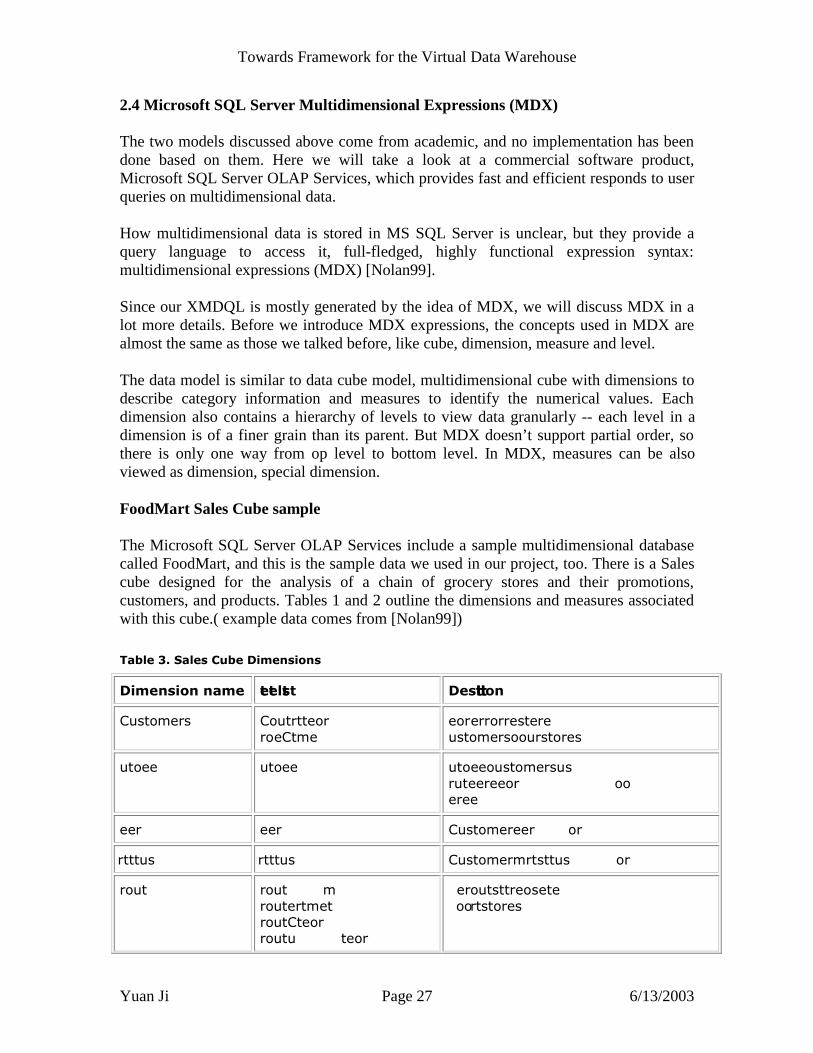
FoodMart Sales Cube sample
The Microsoft SQL Server OLAP Services include a sample multidimensional databasecalled FoodMart, and this is the sample data we used in our project, too. There is a Salescube designed for the analysis of a chain of grocery stores and their promotions,customers, and products. Tables 1 and 2 outline the dimensions and measures associatedwith this cube.( example data comes from [Nolan99])
ÿþýüûúùøú÷þüûöúõôýûúóòñûðöòïðöú
óòñûðöòïðúðþñûú �û�ûü�ö� ú óûö��ò��òïð ú
ÿþýüûúùøý� ÿûþ�üø����ü�üù�ûø��øû����ù��ÿ�ü�����úù �
�ùû�ø���� �� � ���ùø�ø��� � �ûø�øù��ýüùøù���þýüûúùøý�û��ûþø�ýüûøùý� �
��þ��ü�û���ù�ù� � ��þ��ü�û���ù�ù� � ��þ��ü�û���ù�ù��û���þýüûúùø��ýþ����ý���ø��þ�üù��ù�øùù��ûø��� � � � �� ��ûû���ù�øùù�� �
�ù��ùø � �ù��ùø � ÿþýüûúùø��ù��ùø� �����ûø��� � �
��ø�ü�� ��ü�üþý � ��ø�ü�� ��ü�üþý � ÿþýüûúùø�ú�ø�ü�� �ýü�üþý� �����ûø���� �
�øû�þ�ü � �øû�þ�ü�� �ú�����øû�þ�ü��ù��øüúù�ü��øû�þ�ü�ÿ�üù�ûø���øû�þ�ü��þ� ��üù�ûø��
� �ù��øû�þ�üý�ü��ü��øù�û��ý��ù�� ��ü�ù�� ûû���øü�ýüûøùý� �

Towards Framework for the Virtual Data Warehouse
Yuan Ji Page 28 6/13/2003
� ø������úù��øû�þ�ü���úù �
�øûúûü�û���ù�� � � �ù�� ��� � �ù � � �ù�úù����þýù���ûø����øûúûü�û���ýþ����ý���� � �����ùø��� ���û��ûø�� ù�ù��ý�û�� �
�øûúûü�û�ý � �øûúûü�û����úù � � �ù�ü���ùý��øûúûü�û��ü��ü�üø���ùøù��ü�ù�ý��ù� �
�üûøù � �üûøù�ÿûþ�üø���üûøù�� ù��û���üûøù�ÿ�ü���üûøù���úù �
�ùû�ø���� �� � ���ùø�ø��� � �ûø��� ��ùøù�ü�ýüûøùý����ü�ù����� � �� �ûþ�üø���� ù��û�����ü�� � �
�üûøù��� � ù�� � �� �� � � �üûøù��� þ�øù�� ùùü� � øù��û��þ��ù��� ��ýüûøù��� � �ý� þ�øù��ùùü� �
�üûøù�� ��ù � �üûøù�� ��ù � � ��ù�û��ýüûøù��ýþ����ý�� �ù�þ� ù��þ�ùøú�ø� ùü��ûø���ú�����øû�ùø��� �
� �úù� � � ù�øý���þ�øüùøý���û�ü�ý � � �úù��ùø�û����ù��ü�ù�ý��ù���ý�ú��ù� �
� ù�ø���� � �ûúù � � ù�ø���� � �ûúù � � ��ûúù�û���þýüûúùø� �
�
ÿþýüûú�øú÷þüûöúõôýûú�ûþöô�ûöú
�ûþöô�ûúðþñûú
óûö��ò��òïð ú
� � �ü��� �ùý � �þú� ùø�û��þ��üý�ýû��� �
�üûøù�ÿûýü � ÿûýü�û���ûû�ý�ýû��� �
�üûøù����ùý � � ��þù�û��ý��ùý�üø��ý��ü�û�ý� �
�� �ùý�ÿûþ�ü � �þú� ùø�û��ý��ùý�üø��ý��ü�û�ý� �
�üûøù����ùý��ùü � � ��þù�û��ý��ùý�üø��ý��ü�û�ý��ùýý��ûýü�û���ûû�ý�ýû��� �
� � �ùý�� �ùø��ù � �üûøù�ý��ùý� ý��ùý��ûþ�ü��� � � �ý��ý������ �þ��üù��úù�ýþøù�� �
MDX syntax
If we want a table like report for measure values on two cube dimensions, we can write asimple MDX expression like this:
SELECT axis specification ON COLUMNS,axis specification ON ROWSFROM cube_nameWHERE slicer_specification

Towards Framework for the Virtual Data Warehouse
Yuan Ji Page 29 6/13/2003
Because most queries just want few dimensions projected on return cubes’ axis, so MDXuseCOLUMNSto indicate first dimension,ROWSto state second dimension. If more thantow dimensions returned, the named axis wouldPAGES, CHAPTERSand, finally,SECTIONS. If you desire more generic axis terms over the named terms, you can usethe AXIS(index) naming convention, with zero-based index referred to the axis. Theaxis specification is used to select members from cube dimensions. The slicerspecification onWHEREclause is used to define the slice of the cube to be viewed.
The simplest form of an axis specification is taking the MEMBERS of the requireddimension, including those of the special Measures dimension. For example, if we wantto get all recorded measures for each store, the MDX expression is:
SELECT Measures.MEMBERS ON COLUMNS,[Store].MEMBERS ON ROWSFROM [Sales]
It will display all measure values for the stores hierarchy for each stores and everydefined summery level.
We can also only select a single member of a dimension, like this expression:
SELECT Measures.MEMBERS ON COLUMNS,{[Store].[Store State].[CA], [Store].[Store State].[WA]} ON ROWSFROM [Sales]
It queries the measures for the stores summarized for the states of California andWashington. If we want to query measures for cities in these two states, we would querythe CHILDREN of the required members:
SELECT Measures.MEMBERS ON COLUMNS,{[Store].[Store Region].[CA].CHILDREN,
[Store].[Store Region].[WA].CHILDREN} ON ROWSFROM [Sales]
So we have two functions, MEMBERS and CHILDREN. MEMBERS function returnsthe members for the specified dimension or dimension level, and CHILDREN functionreturns the child members for a particular member within the dimension.
And DESENDANT function can drill down to a lower level within a dimension. Besides,MDX provides many functions to navigate the hierarchy, to calculate members and toanalysis tie period.
Slicer specifications
In the WHEREclause, the slicer specification summarizes the slice of the cube to beviewed. And it is often used to select measures to be viewed because measures are

Towards Framework for the Virtual Data Warehouse
Yuan Ji Page 30 6/13/2003
together another dimension. For instance, we want to get sales average for the stores atstate level, cross-referenced against the store type, the expression is:
SELECT {[Store Type].[Store Type].MEMBERS} ON COLUMNS,{[Store].[Store State].MEMBERS} ON ROWSFROM [Sales]WHERE (Measures.[Sales Average])
Another example, if w only want the sales averages for the year 1999, theWHEREclausewould be written as:
WHERE (Measures.[Sales Average], [Time].[Year].[1997])
It is important to note that slicing is not the same as filtering. Slicing does not affectselection of the axis members, but rather the values that go into them. This is differentfrom filtering, because filtering reduces the number of axis members.

Towards Framework for the Virtual Data Warehouse
Yuan Ji Page 31 6/13/2003
3. Other Related Technologies
3.1 XML
“The Extensible Markup Language (XML) is the universal format for structureddocuments and data on the Web.”[W3C00]
The Extensible Markup Language (XML) is descriptively identified in the XML 1.0W3C Recommendation as “an extremely simple dialect [or ‘subset’] of SGML”[W3C98]the goal of which “is to enable generic SGML to be served, received, and processed onthe Web in the way that is now possible with HTML,”[W3C98] for which reason “XMLhas been designed for ease of implementation, and for interoperability with both SGMLand HTML.”[W3C98]
Inherited from SGML, XML is a method for putting structured data in a text file. TheXML documents are self-described, so both human and machine can understand. Andmost important, XML documents are platform independent, language independent, soonce written, they can be used everywhere. That’s why XML is often used fortransferring data between different heterogeneous systems.
3.2 CORBA
CORBA is an acronym for Common Object Request Broker Architecture, defined byObject Management Group (OMG). CORBA is “an open, vendor-independentarchitecture and infrastructure that computer applications use to work together overnetworks”[OMG01]. CORBA-based programs from any vendor, on any computer,operating system, programming language, and network, can communicate with eachother. Because of its vendor-independent feature, CORBA is often chosen as themiddleware for large enterprise.
CORBA applications are composed ofobjects, individual units of running software thatcombine functionality and data. IDL (Interface Definition language) is used to define theinterface of the object requests. The created file that defines the object export methodsand is written in IDL does not contain the actual implementation of the algorithms. Theimplementation of the interface is defined using Java or other language outside of theIDL and build on the framework created by some IDL converter.
3.3 SOAP
Remote objects like CORBA objects can give a program almost unlimited power overnetwork, However, in Internet, most firewalls block non-HTTP request, so we have tofind another way to do distributed computing on Internet.
SOAP (Simple Object Access Protocol) defines the use of XML and HTTP to accessservices, objects, and servers in a platform-independent manner. It “provides a simpleand lightweight mechanism for exchanging structured and typed information betweenpeers in a decentralized, distributed environment using XML.”[W3CSOAP00]

Towards Framework for the Virtual Data Warehouse
Yuan Ji Page 32 6/13/2003
Like CORBA, SOAP is a protocol that acts as the glue between heterogeneous softwarecomponents. If developer can agree on HTTP and XML, SOAP offers a mechanism forbridging competing technologies in a standard way.
SOAP consists of three parts[W3CSOAP00]:
• The SOAP envelope construct defines an overall framework for expressingwhatis in a message;who should deal with it, andwhether it is optional or mandatory.
• The SOAP encoding rules defines a serialization mechanism that can be used toexchange instances of application-defined datatypes.
• The SOAP RPC representation defines a convention that can be used to representremote procedure calls and responses.
3.4 Jakarta Tomcat
Jakarta is the name of an project committed to open source development. ApacheSoftware Foundation currently oversees the project. The group in responsible fordeveloping a number of deferent produces, one being Tomcat. Tomcat is a web serverextension that implements Sun Microsystems’s Java Servlet 2.2 API specification.Servlets are written using only the Java programming language. Servlet allows a webserver to be extended such that it can provide additional services. One such service is thecreation of dynamic web pages that are returned to the web browser. Servlets areassociated with a particular URL.
A servlet is used to extend the capability of a web server. The web server receives a GETconnection request from a specific web browser. The GET request can contains aspecific URL and html action request is received by the web server and invokes the Javaservlet code corresponding to the URL and html action request. This provides the webserver extensions. The servlet contains the ability to respond to the request. A servicemethod within the HttpServlet API is called which hands off the client request accordingto the type of the HTTP request.
By extending the HttpServlet Java API, doGet and doPost methods are defined. ThedoGet method responds to HTTP GET request, which is normal, a request for a webpage. The doPost method responds to the HTTP POST command, which is produced as aresponse of a button press where the button resides on the web pages of the client’s webbrowser in order to submit information to the web server.
Servlets allow the web server to create dynamic web pages based on some user input. Inthis manner servlets are similar to CGI. The POST and GET HTTP request allowsparameters to be passed from the web client to servlet via the web server, the servlet onceinvoked responds to the HTTP request. Using servlets to create dynamic web pages, the

Towards Framework for the Virtual Data Warehouse
Yuan Ji Page 33 6/13/2003
response is a web page generated by the servlet. The web page is written to JavaPrintWriter stream object that hands the servlet generated web page back to the client.
Servlets are written in Java and overcome some of the drawbacks of CGI. Java allowsfor the portably of the byte code across many platforms where CGI written in the C, C++programming language must be recompiled in order to run on various platforms. UnlikeC, C++, the Java language does not suffer as much from the same issues. Java contains abuild in garbage collection method that frees memory still allocated by references thathave gone out of scope. Memory management in C, C++ CGIs could easily containmemory leaks. C, C++ CGI sometimes provided for possible security breaches becausebounds checking were not done property on the values submitted by the web browser.This led to root exploits on the system. Java utilizes dynamically allocating objects(vectors, strings, et) to handle varying sizes of inputs to the servlets.
3.5 Xerces Java Parser
In our implementation, we use Apache Xerces Java parser 1.3 to parse XML documents.It supports XML 1.0 recommendation and contains advanced parser functionality, such asXML Schema, DOM Level 2, and SAX 2.0, in addition to supporting the industry-standard DOM Level 1 and SAX 1.0.
Xerces Java parser provides standard W3C DOM API and javax.xml.parsers API, and weuse it as a standard XML parser, so it can be changed to any other XML parser for Java,such as those made by SUN, IBM or Oracle.
3.6 Apache SOAP
For SOAP (Simple Object Access Protocol) usage, we choose Apache SOAPimplementation. It is based on the IBM SOAP4J implementation. IBM donated their codeto the Apache Software Foundation, and the open source community quickly embracedthe project and has been working nonstop on bug fixes, enhancements, and newfunctionality.
The Apache SOAP service can be running under any servlet containers, and it works verywell with Jakarta Tomcat, although it’s not easy to set up the server and try your firstSOAP program.

Towards Framework for the Virtual Data Warehouse
Yuan Ji Page 34 6/13/2003
4. Virtual Data Warehouse System Design
4.1 System Architecture
Figure 4.1. Virtual Data Warehouse Architecture
Warehouse Interface(Java API)
DCC-Shell
Data Source 1
SchemaData Cube Constructor
Data Source 2
CO
RB
A
SO
AP
QueryExecuter
Schema TransactionData 2
QueryEngine
Schema TransactionData 1
Query Distributor
ORB Client SOAP Client
SOAP ServerORB Server
SOAP ServerORB Server
ORB Client SOAP Client
Visualization Control Unit

Towards Framework for the Virtual Data Warehouse
Yuan Ji Page 35 6/13/2003
The Virtual Data Warehouse (VDW) is a conceptualization of a centralized datawarehouse that includes a set of distributed data sources and a shell (DCC-Shell) that isresponsible for managing and querying these sources. The DCC-Shell does not store anyactual transaction data. Instead, these transaction data are left on the distributed sitescontaining them while the DCC builds and updates a global multidimensional model ofthe available dimensions and measures, hence the name “virtual warehouse”. Thisapproach provides the VDW clients constantly updated views of any constructed cubiodin a manner that makes the source distribution transparent to the user. Although the DCC-Shell does not store raw data, it maintains a pool of meta-data (cube schema) that issynchronized with all data sources. This global schema is prepared when constructing theVDW, and if any parts are changed, all sites must be updated to avoid inconsistencies.Although this approach is hard to maintain, it’s much easier to implement. Besides meta-data, DCC-Shell also stores a resource allocation table that includes informationpertaining to the location, data organization, and the communication method of each datasources. All the meta-data and resource allocation data are written in XML format, so it iseasy to understand and maintain, therefore makes the whole system extensible andflexible.
Virtual data warehouse, like traditional warehouse, or database, must provide services,and we call them queries. Right now there are three classes of query functions availableto a client.
We classify the query into three kinds, warehouse query, cube schema query and cubedata query.
• Warehouse query: user requests basic info about the warehouse, and results arewarehouse name, description, how many data cubes it has, the size of each cube.It is useful when a client first accesses the VDW to get brief idea of it.
• Cube schema query: user asks for the meta-data of one specific cube, and resultsare cube description, measurement, dimension, etc.
• Cube data query: It is used to obtain an entire N-dimensional cube or any subsetof it. This is particularly useful in applications such as the VCU that handles onlyone 3D cube per visualization session. Just like meta-data storage, all queryrequests and responds are in XML format.
4.2 Schema Repository
“Data warehouses are based on a multidimensional data model. This model views data inthe form of a data cube.” A cube is defined by dimensions and facts. In our system, acube has schema part and fact data part, and how to design cube schema in XMLbecomes one important issue.
First, a cube schema has name property and sub elements of measures and dimensions,which are sets of measures and dimensions:

Towards Framework for the Virtual Data Warehouse
Yuan Ji Page 36 6/13/2003
<!ELEMENT CubeSchema (Measures, dimensions)><!ELEMENT Measures (Measure*)><!ELEMENT Dimensions (Dimension*)>
Each Measure element has name, aggregationFunction as properties, and Title, DataTypesub-elements:
<!ELEMENT Measure (Title, DataType)><!ATTLIST Measure name NMTOKEN ><!ELEMENT Title (#PCDATA)><!ELEMENT DataType (#PCDATA)>
For example, we have following measures:
<Measures><Measure name="Unit_Sales" aggregationFunction="SUM">
<Title>Unit Sales</Title><DataType>double</DataType>
</Measure><Measure name="Store_Cost" aggregationFunction="SUM">
<Title>Store Cost</Title><DataType>double</DataType>
</Measure><Measure name="Store_Sales" aggregationFunction="SUM">
<Title>Store Sales</Title><DataType>double</DataType>
</Measure><Measure name="Sales_Count" aggregationFunction="Count">
<Title>Store Cost</Title><DataType>double</DataType>
</Measure></Measures>
Next comes the most difficult part, dimensions. “The dimensions of a cube representdistinct categories for analyzing business data. Categories such as time, geography, orproduct line breakdowns are typical cube dimensions.”
Typically, a dimension is organized into a hierarchical data structure, and may has partialor total ordering. To simplify the problem, we design the dimension with total ordering,and save partial ordering info as properties of dimension units.
Here we try to define dimension by example of store. The concept hierarchy of storelocation can have many levels of categories, such as continent, country, region and city,as in the following figure:
So we can write down the dimension of store:<Dimension name=”Store” allLevel="yes" allCaption="All Store">
<Description>The store schema</Description><Levels number=”5”>
<Level name=”Continent” Title=”Store Continent”/><Level name=”Country” Title=”Store Country”/><Level name=”Region” Title=”Store Region”/><Level name=”City” Title=”Store City”/><Level name=”Store” Title=”Store Name” type=”base”>

Towards Framework for the Virtual Data Warehouse
Yuan Ji Page 37 6/13/2003
<Property name=”Store_Manager” type=”String”/></Level>
<Levels>
<Unit name=”N_America” ><Unit name=”USA”>
<Unit name=”West”><Unit name=”Seattle”>
<BaseUnit name=”Store1” baseID=”1”><Property name=”Store_Manager”>Bill Gates</Property>
</BaseUnit></Unit>
</Unit><Unit name=”Central”>
<Unit name=”Denver”><BaseUnit name=”Store2” baseID=”2”/>
</Unit></Unit><Unit name=”East”>
<Unit name=”Boston”><BaseUnit name=”Store3” baseID=”3”/>
</Unit></Unit>
</Unit><Unit name=”Canada”>
<Unit name=”BC”><Unit name=”Vancouver”>
<BaseUnit name=”Store4” baseID=”4”/></Unit>
</Unit><Unit name=”Alberta”>
<Unit name=”Edmonton”><BaseUnit name=”Store5” baseID=”5”/>
</Unit></Unit><Unit name=”Ontario”>
<Unit name=”Toronto”><BaseUnit name=”Store6” baseID=”6”>
<Property name=”Store_Manager”>Stockwell Day</Property></BaseUnit>
</Unit></Unit>
</Unit></Unit><Unit name=”Europe”></Unit>
</Dimension>
We can also write down another dimension for product:
<Dimension name=”Product” allLevel="yes" allCaption="All Product"><Description>The product schema</Description><Levels number=”3”>
<Level name=”Category” Title=”Product Category”/><Level name=”Type” Title=”Product Type”/><Level name=”Product” Title=”Product Name” type=”base”/>
<Levels>
<Unit name = “Office” ><Unit name = “Computer”>
<BaseUnit name = “IBM” baseID = “0”/>

Towards Framework for the Virtual Data Warehouse
Yuan Ji Page 38 6/13/2003
<BaseUnit name = “Compaq” baseID = “1”/><BaseUnit name = “Apple” baseID = “2”/>
</Unit><Unit name = “Fax”>
<BaseUnit name = “Panasonic” baseID = “3”/><BaseUnit name = “Brothers” baseID = “4”/>
</Unit><Unit name = “Copier”>
<BaseUnit name = “Cannon” baseID = “5”/><BaseUnit name = “Xerox” baseID = “6”/>
</Unit></Unit><Unit name = “Appliance”>
<Unit name = “Kitchen”><BaseUnit name = “Brown” baseID = “7”/><BaseUnit name = “Sharp” baseID = “8”/>
</Unit><Unit name = “House”>
<BaseUnit name = “GE” baseID = “9”/></Unit>
</Unit><Unit name = “Entertainment”>
<Unit name = “TV”><BaseUnit name = “27” baseID = “10”/><BaseUnit name = “37” baseID = “11”/>
</Unit><Unit name = “Stereo”>
<BaseUnit name = “100W” baseID = “12”/><BaseUnit name = “500W” baseID = “13”/>
</Unit></Unit>
</Dimention>
Above two examples are common dimensions, and we also have some specialdimensions, such as time. Time’s concept hierarchy can be presented as partial orderingor total ordering.
In figure 1.2, day has two ways to roll up, either to month or to week, so this hierarchycannot be presented by tree structure. But if we put week into day level as a property, wewill make it a total order. Here is an example of Time dimension schema in XML:
<Dimension name="Time" special="time"allLevel="no" allCaption="All Level">
<Description>Time dimension for Cube</Description><Levels number="3">
<Level name="Year" Title="Year"/><Level name="Quarter" Title="Quarter"/><Level name="Month" Title="Month"/><Level name="Day" Title="Day" type="base">
<Property name="Day_of_Week" type="String" /></level>
</Levels><Unit name="1997">
<Unit name="Q1"><Unit name="January">
<Unit name="1" baseID="367"> <Property>Wednesday</Property></Unit><Unit name="2" baseID="368"> <Property>Thursday</Property></Unit><Unit name="3" baseID="369"> <Property>Friday</Property></Unit>
………
Towards Framework for the Virtual Data Warehouse
Yuan Ji Page 39 6/13/2003
</Unit></Unit>
</Diemnsion>
4.3 XML Multi-Dimensional Query Language (XMDQL)
We propose an XML-based query language, XMDQL, to interact with the VDW in orderto manage and access the available data. The concept of a special multidimensional querylanguage was first proposed (still not finalized) by Pilot software [16] as an industrystandard. In OLAP terminology this type of query is equivalent to slicing and dicing thedata cube. The result of executing an XMDQL query is a cell, a two-dimensional slice, ora multidimensional sub-cube. XMDQL provides functionality similar to that ofMicrosoft’s MDX (Multidimensional Expressions), but it is formatted in XML and theresult is also XML document.
basic format
To specify a cube, XMDQL must contain information about following subject:• The virtual cube that query is on.• Dimensions projected in result cube.• Slices in each dimension to present and sort order.• The members from a nonprojected dimension on which data will be filtered for
members from projected dimensions.
XMDQL has this basic forms:
<XMDQL><SELECT>
project dimensions and slices</SELECT><FROM>
witch cube to query</FROM><WHERE>
filtering constrains</WHERE>
</XMDQL>
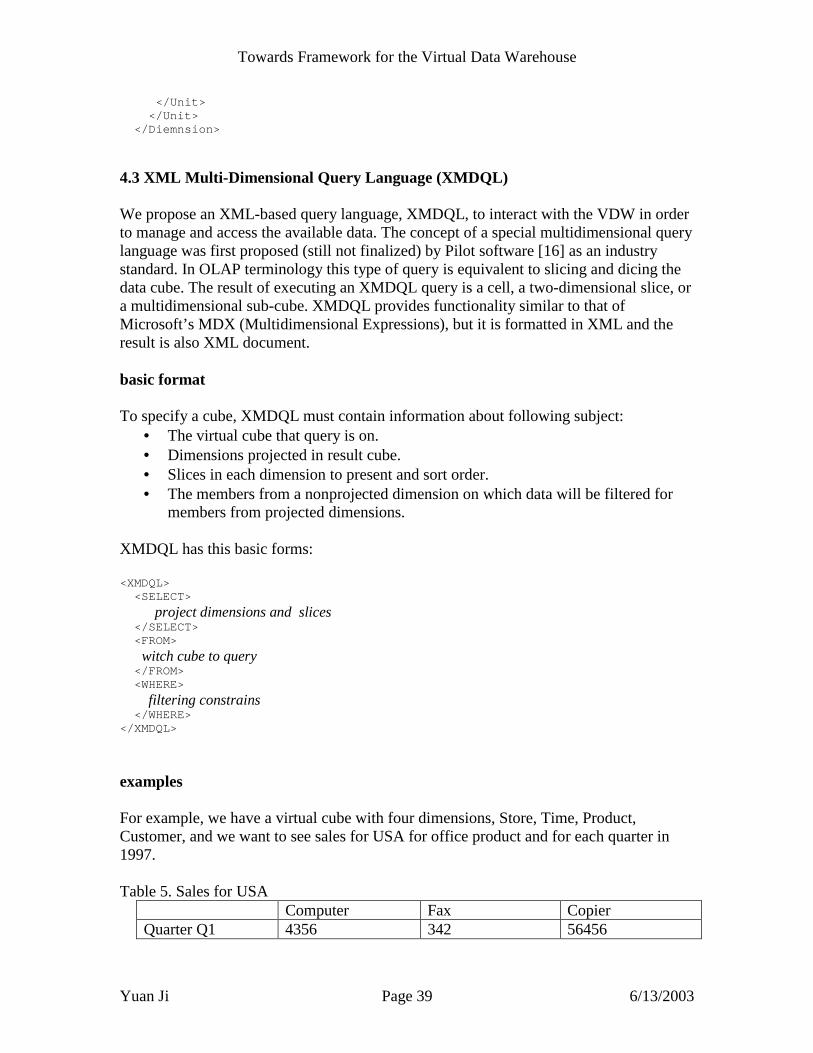
examples
For example, we have a virtual cube with four dimensions, Store, Time, Product,Customer, and we want to see sales for USA for office product and for each quarter in1997.
Table 5. Sales for USAComputer Fax Copier
Quarter Q1 4356 342 56456

Towards Framework for the Virtual Data Warehouse
Yuan Ji Page 40 6/13/2003
Quarter Q2 556 945 234Quarter Q3 8754 656 3324Quarter Q4 456 786 4334
In this example, the product and time dimension are projected dimensions, and each hasone slice. Store dimension is used in WHERE part as filter.
<XMDQL><SELECT>
<Measure name=”Store_Sales”><Axis dimension=”Product”>
<Slice type=”mono” title=”${name}”><Path>Office.*</Path>
</Slice></Axis><Axis dimension=”Time”>
<Slice type=”mono” title=”Quarter ${name}”><Path>1997.*</Path>
</Slice></Axis>
</SELECT><FROM>
<Cube name=”AllElectronics”/></FROM><WHERE>
<Condition dimension=”Store”><Path>N_America.USA</Path>
</Condition></WHERE>
</XMDQL>
In XMDQL, we introducepath in Slice, to indicate how to retrieve data. Thepath=”Office.*” means show all children of Office, so the generated set is{Computer, Fax, Copier}. Therefore, in the axis of dimension Product, only the sales ofcomputer, fax and copier are presented. In time axis,path=”1997.*” , and below1997, there are 4 children, Q1, Q2, Q3 and Q4. In WHERE part, the condition has onedimension filter, meaning only sales in USA stores are retrieved.
The path is a dot separated dimension unit name stream, and shows a route in the concepthierarchy. The ‘*’ means all children of the unit. If we want to see sales on all product,we set path=”*”. Path uses ‘{}’ to query on level. For example, if we want to see sales oneach product type, the path is set to “{Type}”, so the return set of dimension Product is{Computer, Fax, Copier, Kitchen, House, TV, Stereo}. SeePath Syntaxfor formaldefinition of path.
The Slice element sets the member or members of dimension to project on axis. We canselect more than one slice in one dimension. For example, we want the time axis hasthese units:January, February, March, Q2, Q3, October, November, December.The query can be as following:
<Axis dimension=”Time”><Slice type=”mono” title=”1997 ${name}” >

Towards Framework for the Virtual Data Warehouse
Yuan Ji Page 41 6/13/2003
<Path>1997.Q1.*</Path></Slice><Slice type=”mono” title=”1997 Quarter %{name}” >
<Path>1997.Q2</Path><Path>1997.Q3</Path>
</Slice><Slice type=”mono” title=”1997 ${name}” >
<Path>1997.Q4.*</Path></Slice>
</Axis>
We can also customize new units in slice. For example, we want see total sales of USAand Canada, so Slice is:
<Slice type=”sum” title=”USA and Canada”><Path>N_America.USA</Path><Path>N_America.Canada</Path>
</Slice>
Thetype attribute ofSlice can bemono, sum, etc.sum means aggregating the totaldata in all paths and displaying as one projected unit.
Path syntax
Path is used to indicate the units projected on one axis. We define a path is consisted ofseveral path nodes separated by “.” Tokens.
Path ::= PathNode ( SEPARATE_TOKEN PathNode ) *SEPARATE_TOKEN ::= ‘ . ’PathNode ::= ( ‘ { ‘ LevelName ‘ } ’ )? ( UnitName )? ( ‘ [ ‘ Condition‘ ] ’ )?LevelName ::= name string of level.UnitName ::= name string of unit.Condition ::= Boolean expression on properties of unit.
Examples:1997.{Day} : see data of each day of 1997.1997.{month}.13 : see data of each month’s 13.1997.{month}.13[day_of_week=”Friday”] : see data of each 13 Friday in 1997.{Store}[manager=”Tom”] : see data of stores whose manager is Tom.
XMDQL DTD
<!ELEMENT XMDQL (SELECT, FROM, WHERE?)><!ELEMENT SELECT (Measure+, Axis+)><!ELEMENT FROM (Cube)><!ELEMENT WHERE (Condition+)>
<!ELEMENT Measure EMPTY><!ATTLIST Measure name CDATA>
<!ELEMENT Axis (Slice+)><!ATTLIST Axis dimension CDATA>

Towards Framework for the Virtual Data Warehouse
Yuan Ji Page 42 6/13/2003
<!ELEMENT Slice (Path+)><!ELEMENT Slice type “mono|sum” “mono”
title CDATA >
<!ELEMENT Path (#PCDATA)>
<!ELEMENT Cube EMPTY><!ELEMENT Cube name NMTOKEN>
<!ELEMENT Condition (Path+)><!ATTLIST Condition dimension CDATA
type “include|exclude” “include” >
4.4 Query Distribution and Execution
According to figure 2.1, the query is received by DCC-Shell interface, and sent to DataCube Constructor, then sent to Query Distributor. The Query Distributor analyzes thequery and finds which data marts contain the cube data, then distributes the query tothem.
The question is how to store the cube data distribution information so distributor caneasily figure out the Data Marts to communicate.
Because we assume the cube schema is stored in each site with same copies, only factdata are distributed. And another assumption is that we distribute data on only onedimension. For example, the sales data of USA stores are in Data Mart 1, and Canada inData Mart 2.
So we can save the distribution info in XML like:
<Distribution dimension=”Store”><Component path=”N_America.USA”
mart=”DataMart1”>USA sales data</Component><Component path=”N_America.Canada
mart=”DataMart1”>Canada sales data</Component></Distribution>
Suppose we have distribution component set Ddist = {C1, C2, …, Cn }, each Ci related to abranch of concept hierarchy tree, and there is no overlap between them. And we can alsodefine dimensions in SELECT or WHERE part of XMDQL as set Dquery, for eachdimension, Dj={sj1, sj2, …, sjmj}, s is slice. For Dj=Ddist, we check if Ci embrace one slice,add the data source i. If no Dj equals to Ddist, add all data sources.
In the distribution algorithm, we should also consider function slice and complexWHERE conditions.

Towards Framework for the Virtual Data Warehouse
Yuan Ji Page 43 6/13/2003
Assume the XMDQL query has no function slice and no complex condition in WHERE,and the projected dimensions are sliced into display units. For each unit, let set U includeall base unit ID below it, so we get :
PD1 : U 11, U 12, U 13, …, U 1m1
PD2 : U 21, U 22, U 23, …, U 2m2…PDn : U n1, U n2, U n3, …, U nmn
So every cell in result cube has baseID set {U}. And for conditions, we also have:CD1 : U’ 11, U’ 12, U’ 13, …, U’ 1m1
CD2 : U’ 21, U’ 22, U’ 23, …, U’ 2m2…CDn : U’ n1, U’ n2, U’ n3, …, U’ nmn
Then scan through fact table with each record. If one record’s dimension baseIDs belongto one cell’s baseID set, and obey the condition, add the measure value to this cell.
Here we suppose local data marts store cube fact data as tables. The fact tables maybesaved in database, such as DB2, Oracle. So we can create some stored procedures toretrieve data.
The algorithm for this query engine needs more study in the future.Combining cubes from distributed data marts into result cube may be as easy as sum cellvalues of each cube if there is no function slice.
The returned cube should include axis information and measure data. Following examplein table 5, we can write cube as this:
<CubeData><Measure name=”Store_Sales”><Axis>
<Dimension name=”Time”><Unit path=”1997.Q1”/><Unit path=”1997.Q2”/><Unit path=”1997.Q3”/><Unit path=”1997.Q4”/>
</Dimension><Dimension name=”Product”>
<Unit path=”Office.Computer”/><Unit path=”Office.Fax”/><Unit path=”Office.Copier”/>
</Dimension></Axis><Data>
<D1><D2>43 45 567</D2><D2>56 44 77</D2><D2>22 87 345</D2><D2>45 76 34 234</D2>
</D1></Data>
</CubeData>

Towards Framework for the Virtual Data Warehouse
Yuan Ji Page 44 6/13/2003
4.5 Implementation interface
Finally, we implemented the XMDQL query engine by Java language, and set up aCORBA server as Virtual Data Warehouse. For time limit, we only set up one SOAPserver as data source to store transaction data. The fact data was saved as local files andorganized in a special format so XMDQL query engine could get the data quickly.
Because DIVE-ON system was not ready then, we used Jakarta Tomcat to create a website to provide XMDQL query tools by a simple interface. User can visit the web page ofthis site to input XMDQL string, in XML format, and submit the query. The query wasposted to servlet inside Tomcat web server, then the servlet sent the query string to ourvirtual data warehouse ORB server. The DCC-Shell did the query distribution andforwarded query string to another SOAP server.
Now the interface only lets users do multidimensional data query on two dimensions, andthe return values are displayed in a table format. But the VDW can handle any XMDQLquery with unlimited number of dimensions (not exceeding cube dimension number). Theresponse time is pretty good, almost as good as MS SQL OLAP server.
Figure 4.2 XMDQL Query Interface

Towards Framework for the Virtual Data Warehouse
Yuan Ji Page 45 6/13/2003
5. Conclusion and Future Work
In this report, we discussed the concept of data warehouse as well as data model andquery language of multidimensional databases. We also designed and implemented avirtual data warehouse with java language and CORBA, SOAP techniques. The maincontributions of our work are applying XML technology to data warehouse and a newmultidimensional data query language XMDQL.
There are many areas of this work that offer opportunities for future work. We didn’thave enough time to investigate how to implement different wrapper for different datasource, such as many legacy systems, so translating XMDQL to local system querylanguage is a big issue for further study. And many interesting topics will appear like run-time data cleaning, integration and performance. Another opportunity will be efficientlypassing cube data between DCC-Shell and data sources, for right now cube data areformatted in XML document, and the size is too big for ordinary queries.
References[Agrawal97] Rakesh Agrawal, Ashish Gupta, Sunita Sarawagi, ModelingMultidimensional Databases. ICDE 1997http://www.almaden.ibm.com/cs/people/ragrawal/papers/md_model_rj.ps
[Cabibbo97] Luca Cabibbo, Riccardo Torlone,Querying Multidimensional Databases.DBPL 1997
[Cabibbo98] Luca Cabibbo, Riccardo Torlone,A Logical Approach to MultidimensionalDatabases. EDBT 1998.
[Cabibbo00] Luca Cabibbo, Riccardo Torlone,Query Language for MultidimensionalData. Rapporto tecnico InterData T4-R22, 2000
[Chaudhuri97] Surajit Chaudhuri, Umeshwar Dayal, An Overview of Data Warehousingand OLAP Technology. SIGMOD Record 26(1): 65-74 (1997)
[Gray95] Jim Gray, Adam Bosworth, et al. Data Cube: A Relational AggregationOperator Generalizing Group-By, Cross-Tab, and Sub-Totals. Microsoft TechnicalReport MSR-TR-95-22 Nov. 1995
[Hammond99]Mark Hammond,Survey traces huge growth in data warehouse market.EWeek Dec. 13, 1999.
[Holland00] Paul Holland,Virtues of a Virtual Data Warehouse. EarthWeb.com March2000.
[Inmon92] W.H. Inmon,Building the Data Warehouse. John Wiley, 1992.
[Inmon96] W.H. Inmon,Virtual Data Warehouse: The Snake Oil Of The Nineties. DataManagement Review, April, 1996.
[Jordan95] Sara Jordan and John Wheeler,The Virtual Data Warehouse.http://www.ornl.gov/cim/vdwtxt.htmDec. 19, 1995

Towards Framework for the Virtual Data Warehouse
Yuan Ji Page 46 6/13/2003
[Kimball96 ]Ralph Kimball,The Data Warehouse Toolkit : Practical Techniques forBuilding Dimensional Data Warehouses. John Willy & Sons 1996.
[Nolan99] Carl Nolan,Introduction to Multidimensional Expressions (MDX).Aug. 1999
[OMG01] CORBA Basic, http://www.omg.org/gettingstarted/corbafaq.htm, April, 2001
[Orr96 ] Ken Orr,Data Warehousing Technology. 1996
[Sakaguchi96] Torus Sakaguchi, Mark Frolick,A Review of the Data WarehousingLiterature.http://www.nku.edu/~sakaguch/dw-web.htm1996
[Trujillo99 ] Juan Carlos Trujillo,The GOLD model: An Object Orientedmultidimensional data model for multidimensional databases. ECOOP Workshop forPhD Students in OO System 1999: 24-30http://www.comp.lancs.ac.uk/computing/users/marash/PhDOOS99/Paper17_Juan_Trujillo.pdf
[W3CSOAP00] Don Box, et al.Simple Object Access Protocol (SOAP) 1.1http://www.w3.org/TR/SOAP/may, 2000
[W3CXML00 ]Extensible Markup Language (XML)http://www.w3c.org/xml, 2000
[W3CXML98 ] Tim Gray, et al.Extensible Markup Language (XML)1.0 (SecondEdition)http://www.w3.org/TR/REC-xml, Oct. 1998