towards the proteome of the marine bacterium rhodopirellula baltica: mapping the soluble proteins
TRANSCRIPT

REGULAR ARTICLE
Towards the proteome of the marine bacterium
Rhodopirellula baltica: Mapping the soluble proteins
Dörte Gade1, Dorothea Theiss2, Daniela Lange1, Ekaterina Mirgorodskaya2,Thierry Lombardot1, Frank Oliver Glöckner1, Michael Kube2,Richard Reinhardt2, Rudolf Amann1, Hans Lehrach2, Ralf Rabus1 and Johan Gobom2
1 Max Planck Institute for Marine Microbiology, Bremen, Germany2 Max Planck Institute for Molecular Genetics, Berlin, Germany
The marine bacterium Rhodopirellula baltica, a member of the phylum Planctomycetes, has dis-tinct morphological properties and contributes to remineralization of biomass in the naturalenvironment. On the basis of its recently determined complete genome we investigated its pro-teome by 2-DE and established a reference 2-DE gel for the soluble protein fraction. Approxi-mately 1000 protein spots were excised from a colloidal Coomassie-stained gel (pH 4–7), ana-lyzed by MALDI-MS and identified by PMF. The non-redundant data set contained 626 distinctprotein spots, corresponding to 558 different genes. The identified proteins were classified intorole categories according to their predicted functions. The experimentally determined and thetheoretically predicted proteomes were compared. Proteins, which were most abundant in 2-DEgels and the coding genes of which were also predicted to be highly expressed, could be linkedmainly to housekeeping functions in glycolysis, tricarboxic acid cycle, amino acid biosynthesis,protein quality control and translation. Absence of predictable signal peptides indicated a locali-zation of these proteins in the intracellular compartment, the pirellulosome. Among the identi-fied proteins, 146 contained a predicted signal peptide suggesting their translocation. Some pro-teins were detected in more than one spot on the gel, indicating post-translational modification.In addition to identifying proteins present in the published sequence database for R. baltica, analternative approach was used, in which the mass spectrometric data was searched against amaximal ORF set, allowing the identification of four previously unpredicted ORFs. The 2-DEreference map presented here will serve as framework for further experiments to study differ-ential gene expression of R. baltica in response to external stimuli or cellular development andcompartmentalization.
Received: September 1, 2004Revised: November 16, 2004
Accepted: December 14, 2004
Keywords:
MALDI-MS / PMF / Rhodopirellula baltica / 2-DE
3654 Proteomics 2005, 5, 3654–3671
1 Introduction
Since the pioneering determination of the Haemophilus influ-enzae [1] and Mycoplasma pneumoniae [2] genomes, more than250 complete genomes from bacteria have been reported (for
detailed information see e.g., www.genomesonline.org). Eventhough a given genome represents the blueprint of life, thereis a need for functional analysis on the transcriptional andproteomic level in order to define (i) which of the predictedgenes can be expressed in principle, and (ii) the physiologicalconditions inducing their expression. In contrast to thenumerous publicly available genome sequences, only fewproteomes (protein maps) have been reported to date. More-over, only a limited number of proteins is usually identifiedand annotated. Among the comprehensive protein maps are
Correspondence: Dr. Ralf Rabus, Max Planck Institute for MarineMicrobiology, Celsiusstr. 1, D-28359 Bremen, GermanyE-mail: [email protected]: 149-421-2028-580
2005 WILEY-VCH Verlag GmbH & Co. KGaA, Weinheim www.proteomics-journal.de
DOI 10.1002/pmic.200401201

Proteomics 2005, 5, 3654–3671 Microbiology 3655
those for the very well-studied standard bacteria Escherichiacoli [3–5] and Bacillus subtilis [6, 7], some pathogens like, e.g.,Mycoplasma pneumoniae [8–10], Staphylococcus aureus [11, 12],Haemophilus influenzae [13–15] and Pseudomonas aeruginosa[16], and some biotechnologically relevant bacteria such asCorynebacterium glutamicum [17] and Streptomyces coelicolor[18].
Protein maps are most often constructed by applying 2-DE in combination with MS analysis. 2-DE is a well-estab-lished technique for high-resolution separation of proteinsfrom complex mixtures [19]. Electrophoretically separatedproteins are excised from stained 2-DE gels and cleavedenzymatically (e.g., by trypsin) to defined fragments. Themasses of the generated peptides, determined by MS, con-stitute a PMF of the protein. For protein identification, thePMF is compared to sets of masses calculated for eachprotein sequence in a database, based on the known cleav-age specificity of the protease used [20–22]. MALDI-MS[23] has become the most widely used technique for pro-tein identification. Automation allows a high throughput atthe level of spot excision, sample processing and MS ana-lysis.
Over the last one to two decades, the impact of micro-bial activity on environmental processes has been increas-ingly recognized. This led recently to the initiation of ge-nome projects on environmentally relevant bacteria. Ge-nomes of such bacteria in conjunction with functionalanalysis will provide new insights into the molecular basisof microbial activity (and its control) in the natural envi-ronment. The first examples are the complete genomesequences of Synechocystis sp. [24] (www.kazusa.or.jp), Cau-lobacter crescentus [25] (www.tigr.org) and Rhodopirellula bal-tica [26] (www.regx.de). With 7.145 Mb and 7325 ORF, thegenome of R. baltica represents one of the largest bacterialgenomes sequenced so far. In the case of C. crescentus, aprotein map with 295 identified proteins has only veryrecently been reported [27], whereas 57 membrane proteinswere identified from Synechocystis sp. strain PCC6803 [28].R. baltica is a marine, aerobic bacterium that has been iso-lated from the Baltic Sea. It belongs to the phylogeneticdistinct group of Planctomycetes [29], members of which areknown to be globally distributed and suggested to beinvolved in carbon remineralization. Interest in this groupof bacteria also comes from their unusual morphologicalproperties. The cells reproduce via budding and display acomplex life cycle. R. baltica cells can occur in two morpho-types, i.e., as single motile cells or attached to each other inaggregates. Peptidoglycans appear to be absent from theproteinaceous cell wall. Individual cells are organized inmembrane-defined compartments including a membrane-engulfed nucleoid, termed pirellulosome [30, 31].
To study molecular physiology, cellular development andcompartmentalization of this bacterium, we established a 2-DE map of soluble proteins in the pH range of 4 to 7. Themaster gel contains 626 annotated proteins, which wereidentified by PMF.
2 Materials and methods
2.1 Growth of cells and preparation of soluble
proteins
Cells of R. baltica (DSM 10527) were grown in mineral me-dium with ribose (10 mM), glucose (10 mM) or N-acet-ylglucosamine (10 mM) as sole source of organic carbon [32].Harvesting of cells was essentially performed as previouslydescribed [32]. Cells were harvested in the exponentialgrowth phase by centrifugation (10 0006g, 15 min, 47C).The pellets were washed with 100 mM Tris/HCl pH 7.5 con-taining 5 mM MgCl2. Cell pellets were directly frozen inliquid nitrogen and stored at 2807C until cell breakage and2-DE. Prior to cell breakage, pellets were resuspended in1 mL lysis buffer (7 M urea, 2 M thiourea, 2% DTT,2% CHAPS, 0.5% carrier ampholytes; Amersham Bio-sciences, Freiburg, Germany). Cell breakage was performedwith the PlusOne grinding kit (Amersham Biosciences)following the manufacturer’s instructions. Removal of celldebris, DNA and membranes by centrifugation (100 0006g,1 h, 157C) yielded the fraction of soluble proteins. The pro-tein content of this fraction was determined using the meth-od described by Bradford [33].
2.2 2-DE, staining, and image acquisition
2-DE was essentially performed as described before [19, 32,34]. In brief, IEF was performed using the IPGphor systemand 24 cm long IPG strips (linear pH gradient from 4 to 7;Amersham Biosciences), followed by equilibration of the gelswith DTT and iodoacetamide. The second dimensionseparation was then performed using the Ettan Dalt system(Amersham Biosciences) and gels made of 375 mM Tris/HCl, 0.1% SDS and 12.5% Duracryl (Genomic Solutions,Ann Arbor, Michigan, USA). The protein load for preparativegels was 400 mg. Proteins were visualized using colloidalCoomassie (method modified from [35]). For image acquisi-tion the gels were digitalized with the Image Scanner(Amersham Biosciences).
2.3 Gel sample excision and processing
Excision and processing of the gel samples for PMF wasperformed as described previously [36], with some modifica-tions. Protein spots were sampled from the gel using anautomatic excision workstation (Proteineer; Bruker Dal-tonics, Bremen, Germany). The excision head was equippedwith a single needle with a diameter of 2 mm. The excisedgel spots were delivered into 96-well polypropylene micro-titer plates (MTP) (Costar Thermowell, Cornis, NY, USA),pre-treated by punching two holes (d , 0.5 mm) in the bot-tom of each well. This preparation allows removal of thewashing solutions and reagents used throughout the diges-tion procedure by simple flow-through centrifugation, whileretaining the gel particles in the wells. To protect the pierced
2005 WILEY-VCH Verlag GmbH & Co. KGaA, Weinheim www.proteomics-journal.de

3656 D. Gade et al. Proteomics 2005, 5, 3654–3671
96-well MTP from environmental contamination, they wereplaced in a second 96-well MTP and covered by a lid. Thesecond MTP also serves as collector for liquid removed bycentrifugation. To ensure that no liquid from the collectionMTP reaches or contaminates the pierced MTP, a spacer wasplaced between these two MTP. Following excision, all liquidwas removed from the gel pieces by centrifugation and thesample plates were stored at 2807C prior to further proces-sing.
Prior to digestion the gel particles were washed by incu-bation for 2630 min in 100 mL 50% ethanol v/v. Followingremoval of the washing solution by centrifugation, residualwater was expelled from the gel particles by incubation for5 min in 100% ethanol. The sample plates were then placedwithout lid in a laminar flow-bench for 15 min to allow eva-poration of the ethanol. An aliquot of freshly prepared,cooled trypsin (Roche, recombinant porcine) solution (5 mL,10 ng/mL, 50 mM NH4HCO3, pH 7.8) was added to eachsample. The sample plates were immediately placed in arefrigerator and incubated at 47C for 30 min. Thereafter, analiquot of digestion buffer (50 mM NH4HCO3, pH 7.8) wasadded to each sample, and the MTP were placed in a humi-dified box and incubated for 4 h at 377C.
2.4 MALDI-MS
Protein digests were prepared for MALDI using the a-cyano-4-hydroxycinnamic acid affinity sample preparation tech-nique described previously [37]. Mass analysis of positivelycharged ions was performed on an Ultraflex LIFT and aReflex III instrument (Bruker Daltonics) operated in thereflector mode and using delayed ion extraction. Positivelycharged ions in the mass range 700–3 500 Da were analyzed.
2.5 Data processing and protein identification
The success rate and confidence of protein identification byPMF depends to a high degree on the accuracy of the massmeasurement. High mass accuracy by MALDI-TOF MS wasachieved by using internal reference compounds for spectracalibration. To calibrate the large number of spectra acquiredin this study, the following procedure was developed. First,the acquired MALDI-TOF spectra were calibrated externallyusing a polynomial function according to a previouslydescribed procedure [38]. This calibration ensures a max-imum error of 500 ppm over the entire MALDI sample sup-port. For a subsequent internal mass correction, each spec-trum was searched for signals corresponding to knownreference compounds. Three peptides (Angiotensin I, MH1
1296.68; Neurotensin 1–13, MH1 1 672.9150; ACTH 18–39,MH1 2 465.1989; monoisotopic mass values), which weremixed into the MALDI matrix solution, and two abundantsignals corresponding to trypsin autoproteolysis (MH1
842 510 and 2 211.1045, respectively) were used as internalreferences. For the spectra in which at least three of thesecompounds were detected, a linear regression of the relative
errors for the reference signals versus their calculated m/zvalues was determined. If the standard deviation of theregression line was below 10 ppm, the regression functionwas used for correction of the externally calibrated massvalues. If a detected calibrant had a relative error .2 SD itwas discarded and the linear regression calculated again.
In some cases a sufficient number of reference masseswas not detected, and in other cases, an analyte signal with amolecular mass close to the reference compound was erro-neously selected as a calibrant. For example, an analyte sig-nal that partially overlapped with the trypsin autoproteolysissignal of m/z 842 510 was erroneously selected as a calibrant.The resulting standard deviation of the linear regression was17.7 ppm, and the calibration thus discarded. Out of384 spectra acquired on one MALDI sample support,190 fulfilled the criteria for internal mass correction. Theremaining 194 spectra were calibrated with background sig-nals of unknown identity, as follows: using the internallycalibrated spectra, a histogram was constructed of the abun-dance of signals with mass differences within Dm/z 0.05.Mass values within this interval, detected in .25 spectra inthe data set were averaged and added to the list of referencemasses. Using the new list of internal reference masses, theinternal correction procedure was repeated with the remain-ing 194 spectra, this time with the requirement that at leastsix signals in each spectrum should match values in thecalibrant list. Following this second round of internal cor-rection, all the remaining spectra were successfully cali-brated.
The presence of background signals in the spectradecreases the specificity of the database search. Backgroundsignals were assigned as described in the previous section,and removed from the data set. In addition, sodium- andpotassium-cationized molecular ions, appearing as satellitesignals to the protonated peptide molecular ion signal withDm/z 21 982 and 38.090, respectively, were removed.
Database searching was performed using the softwareMASCOT (Matrix Science, London, UK) [39]. The publishedORF set of R. baltica (BX119912) was searched using the fol-lowing settings: mass error tolerance: 50 ppm; fixed mod-ifications: Cys-carbamidomethylation; variable modifica-tions: oxidation; one tolerated missed cleavage. Under theseconditions, a probability based MOWSE score .51 was con-sidered significant (p , 0.05).
2.6 Generation of theoretical 2-DE gels
The published ORF set of R. baltica (Acc. BX119912) wasused to create the theoretical 2-DE gels. Mr and pI were cal-culated for each predicted protein using the program pepstatsfrom emboss (www.hgmp.mrc.ac.uk/Software/EMBOSS)[40]. The annotation of the published ORF set was scannedfor the keywords “conserved hypothetical” and “hypothetical”in the product key of the description, generating the con-served hypothetical and hypothetical groups. The remainingproteins were sorted into the group assigned function.
2005 WILEY-VCH Verlag GmbH & Co. KGaA, Weinheim www.proteomics-journal.de

Proteomics 2005, 5, 3654–3671 Microbiology 3657
2.7 Construction of a maximal ORF set
In order to identify proteins encoded by genes that are notpresent in the published ORF set of R. baltica (BX119912),the following strategy was employed. Based on the genomicsequence of R. baltica, a new ORF set was constructed bymeans of a PERL script according to the following steps.First, the positions of all stop codons in the genome weredetermined. For each stop codon, all theoretically possiblereading lengths with a minimal ORF length of 102 baseswere calculated by extending their sequences from the stopcodon to all possible start codons detectable until the nextstop codon. The resulting ORF list, denoted Maximum ORFSet (MOS), comprised 578 949 sequences and represents themaximal coding capacity of the genome. The MOS wastranslated into amino acid sequences and used as databasefor protein identification by PMF using data from all threeanalyzed 2-DE gels, as described in the Section 3.
2.8 Signal peptides and gene expression levels
predictions
Signal peptides were predicted by analyzing each theoreticalprotein encoded by the R. baltica genome with the programSignalP 2.0 [41]. From this data set proteins were extractedwhich corresponded to identified 2-DE-separated proteinsby means of a custom PERL script (using the GenDB sys-tem) [42]. Proteins with SignalP scores .0.75 were con-sidered as potentially translocated. Expression level predic-tion based on codon usage optimization was calculated foreach gene in the R. baltica genome according to the methoddescribed by Karlin et al. [43]. Highly expressed referencegenes including ribosomal proteins, translation factors andchaperonins were extracted from the published annotationof R. baltica [26].
3 Results and discussion
3.1 Comparison of theoretical and experimental
proteome
Three different theoretical proteome maps of R. baltica werecreated: one for proteins with “assigned function” (Fig. 1A),one for “conserved hypothetical” proteins (Fig. 1B) and onefor “hypothetical proteins” (Fig. 1C). Proteins with assignedfunction are homologous to proteins with known functions.Conserved hypothetical proteins cannot be assigned to anyfunction, however they have homologs in genomes of otherorganisms. Hypothetical proteins are also of unknown func-tion, but they are to date not known from any organism otherthan R. baltica.
An overlay of these three maps represents the completetheoretical proteome map predicted from the annotated ge-nome sequence. Remarkably, it shows a different isoelectric
distribution pattern than those of previously reported bacte-rial and archaeal proteomes [44, 45]. Typically, prokaryotictheoretical proteome maps display a bimodal distributionwith two protein-rich areas in the acidic and alkaline ranges,separated by a pronounced protein-depleted area aroundpH 7. In contrast, R. baltica displays a trimodal distributionwith a third area of protein abundance in the neutral range.A protein peak around pH 7 has previously only beendescribed for eukaryotic proteomes [45]. It is assumed thatthe bi- or trimodality of protein pI reflects the subcellularlocalization of the proteins. While cytoplasmic proteins typi-cally have pI values of around 5, integral membrane proteinstend to have pI values of around 9. Proteins belonging tothese two groups can be found in all genomes in large num-bers. The nuclear proteins apparently form the third clusterin eukaryotic proteomes [45]. While a large number of pro-teins with neutral pI are predicted, the analyzed 2-DE gel(Fig. 1D–F, Fig. 2B and D) reveals only a limited number ofproteins close to pH 7. Notably, the theoretical proteome ofR. baltica contains a large number of predicted proteins withpI higher than 10, while the alkaline proteins of well-studiedbacteria such as E. coli center around pI 9.
Functions could be assigned to only 32% of the predictedproteins of R. baltica. Out of these, the majority is predictedto fall into the acidic region of the theoretical 2-DE gel. Thus,the applied IEF conditions are apparently well suited to studythis group of proteins. For the conserved hypothetical pro-teins (amounting to 14% of the predicted proteins) a similarsituation was observed.
More than half (54%) of all predicted proteins belong tothe hypothetical proteins, which are unique to R. baltica.However, these proteins are apparently under-represented inthe set of proteins identified in this study. The theoretical 2-DE gel displayed in Fig. 1C reveals that the majority of hy-pothetical proteins have theoretical pI above 7, in fact, 37%of them have pI of greater than 10. Since a pH gradient from4 to 7 was used in this study, these alkaline proteins could notbe detected. Remarkably, many of the predicted alkaline pro-teins have rather low molecular mass (below 10 kDa), prob-ably hampering their isolation by conventional 2-DE. A con-tribution of ORF overprediction to the high number of hy-pothetical proteins cannot be excluded at present.Nevertheless, it is tempting to speculate that R. balticarecruits hypothetical proteins for specific functions, e.g., incellular development or translocation of proteins and solutesacross the complex membrane structure.
3.2 Master gel
The soluble protein fraction of R. baltica grown understandard conditions was visualized using 2-DE with immo-bilized pH gradients from 4 to 7. This fraction should repre-sent the major part of the cytosolic proteins. Under theseconditions, approximately 2000 proteins of R. baltica can beseparated and detected, when highly sensitive protein stainssuch as silver or fluorescent dyes are applied (see accom-
2005 WILEY-VCH Verlag GmbH & Co. KGaA, Weinheim www.proteomics-journal.de

3658 D. Gade et al. Proteomics 2005, 5, 3654–3671
Figure 1. Theoretical 2-DE gels of proteins predicted from the genome of R. baltica (A–C) and the subset of proteins experimentallyidentified in this study (D–F). Isoelectric points and molecular weights were calculated using the “pepstats” program module ofemboss. Proteins with functional assignment (A and D), conserved hypothetical proteins (B and E), hypothetical proteins (C and F).
panying publication). Figure 2A-D show the colloidal Coo-massie-stained master gel from R. baltica cells grown withribose. From the approximately 1000 excised gel samples,626 proteins, represented by different spots on the gel, wereidentified by means of PMF (p , 0.05). Since some 30 pro-teins occurred as at least two spots, the actual number ofdistinct identified ORFs amounted to 558. The identifiedproteins were annotated in the master gel sections with thepublished gene numbers (Fig. 2A–D) and grouped accord-ing to functional categories (Table 1). Predicted functions ofeach identified protein are given in Table 2. To verify theidentifications of the master gel, 2-DE and MS analysis ofcells grown with glucose and N-acetylglucosamine, respec-tively, were analyzed in parallel (Table 2). Among the 558identified gene products 301 (54%) were identified from atleast two independent 2-DE gels.
Newly developed software was used for processing of thecalibrated mass spectrometric data. This included filtering ofsodium and potassium adduct signals, filtering of non-peptide-derived masses, filtering of signals derived from known con-taminants such as trypsin autoproteolysis products, and statis-tical filtering of frequently occurring m/z values representingunknown gel sample contaminants. This processing improvesthe quality of the input data for the database search, therebyincreasing the number of identified proteins and their respec-tive scores. For example, in a subset of 384 samples prepared onone MALDI target, 205 spectra (53%) resulted in a significantidentification score when filtering of the data was not applied.With filtering, the number of significant identification resultsincreased to 262 (68%). Concomitantly, the average MOWSEscore of the identified proteins increased from 99 to 119,thereby improving the certainty of the identification results.
2005 WILEY-VCH Verlag GmbH & Co. KGaA, Weinheim www.proteomics-journal.de

Proteomics 2005, 5, 3654–3671 Microbiology 3659
Figure 2.
2005 WILEY-VCH Verlag GmbH & Co. KGaA, Weinheim www.proteomics-journal.de

3660 D. Gade et al. Proteomics 2005, 5, 3654–3671
Figure 2. Annotated sections (A–D) of the master gel of soluble proteins of R. baltica grown with ribose. Assignednumbers represent genes. Table 2 lists the identified proteins according to functional classes and provides for eachprotein information on functional prediction, quality/reproducibility of identification, and prediction of signalpeptides and expression level.
2005 WILEY-VCH Verlag GmbH & Co. KGaA, Weinheim www.proteomics-journal.de
Proteomics 2005, 5, 3654–3671 Microbiology 3661
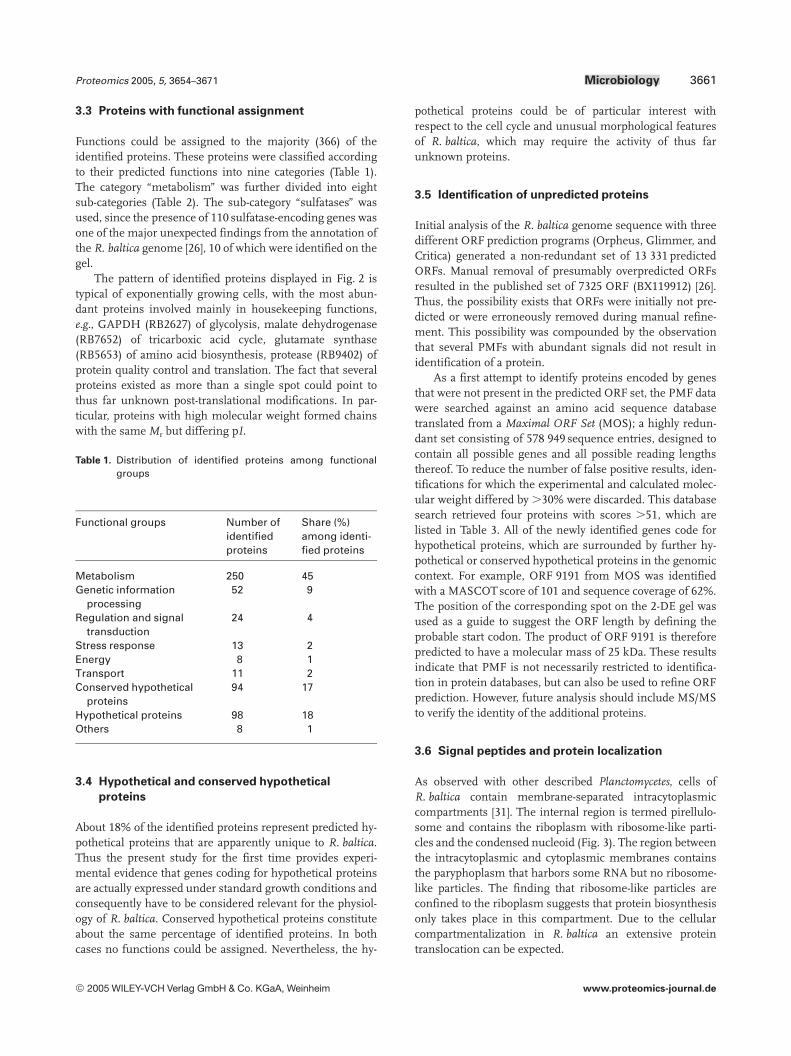
3.3 Proteins with functional assignment
Functions could be assigned to the majority (366) of theidentified proteins. These proteins were classified accordingto their predicted functions into nine categories (Table 1).The category “metabolism” was further divided into eightsub-categories (Table 2). The sub-category “sulfatases” wasused, since the presence of 110 sulfatase-encoding genes wasone of the major unexpected findings from the annotation ofthe R. baltica genome [26], 10 of which were identified on thegel.
The pattern of identified proteins displayed in Fig. 2 istypical of exponentially growing cells, with the most abun-dant proteins involved mainly in housekeeping functions,e.g., GAPDH (RB2627) of glycolysis, malate dehydrogenase(RB7652) of tricarboxic acid cycle, glutamate synthase(RB5653) of amino acid biosynthesis, protease (RB9402) ofprotein quality control and translation. The fact that severalproteins existed as more than a single spot could point tothus far unknown post-translational modifications. In par-ticular, proteins with high molecular weight formed chainswith the same Mr but differing pI.
Table 1. Distribution of identified proteins among functionalgroups
Functional groups Number ofidentifiedproteins
Share (%)among identi-fied proteins
Metabolism 250 45Genetic information
processing52 9
Regulation and signaltransduction
24 4
Stress response 13 2Energy 8 1Transport 11 2Conserved hypothetical
proteins94 17
Hypothetical proteins 98 18Others 8 1
3.4 Hypothetical and conserved hypothetical
proteins
About 18% of the identified proteins represent predicted hy-pothetical proteins that are apparently unique to R. baltica.Thus the present study for the first time provides experi-mental evidence that genes coding for hypothetical proteinsare actually expressed under standard growth conditions andconsequently have to be considered relevant for the physiol-ogy of R. baltica. Conserved hypothetical proteins constituteabout the same percentage of identified proteins. In bothcases no functions could be assigned. Nevertheless, the hy-
pothetical proteins could be of particular interest withrespect to the cell cycle and unusual morphological featuresof R. baltica, which may require the activity of thus farunknown proteins.
3.5 Identification of unpredicted proteins
Initial analysis of the R. baltica genome sequence with threedifferent ORF prediction programs (Orpheus, Glimmer, andCritica) generated a non-redundant set of 13 331 predictedORFs. Manual removal of presumably overpredicted ORFsresulted in the published set of 7325 ORF (BX119912) [26].Thus, the possibility exists that ORFs were initially not pre-dicted or were erroneously removed during manual refine-ment. This possibility was compounded by the observationthat several PMFs with abundant signals did not result inidentification of a protein.
As a first attempt to identify proteins encoded by genesthat were not present in the predicted ORF set, the PMF datawere searched against an amino acid sequence databasetranslated from a Maximal ORF Set (MOS); a highly redun-dant set consisting of 578 949 sequence entries, designed tocontain all possible genes and all possible reading lengthsthereof. To reduce the number of false positive results, iden-tifications for which the experimental and calculated molec-ular weight differed by .30% were discarded. This databasesearch retrieved four proteins with scores .51, which arelisted in Table 3. All of the newly identified genes code forhypothetical proteins, which are surrounded by further hy-pothetical or conserved hypothetical proteins in the genomiccontext. For example, ORF 9191 from MOS was identifiedwith a MASCOT score of 101 and sequence coverage of 62%.The position of the corresponding spot on the 2-DE gel wasused as a guide to suggest the ORF length by defining theprobable start codon. The product of ORF 9191 is thereforepredicted to have a molecular mass of 25 kDa. These resultsindicate that PMF is not necessarily restricted to identifica-tion in protein databases, but can also be used to refine ORFprediction. However, future analysis should include MS/MSto verify the identity of the additional proteins.
3.6 Signal peptides and protein localization
As observed with other described Planctomycetes, cells ofR. baltica contain membrane-separated intracytoplasmiccompartments [31]. The internal region is termed pirellulo-some and contains the riboplasm with ribosome-like parti-cles and the condensed nucleoid (Fig. 3). The region betweenthe intracytoplasmic and cytoplasmic membranes containsthe paryphoplasm that harbors some RNA but no ribosome-like particles. The finding that ribosome-like particles areconfined to the riboplasm suggests that protein biosynthesisonly takes place in this compartment. Due to the cellularcompartmentalization in R. baltica an extensive proteintranslocation can be expected.
2005 WILEY-VCH Verlag GmbH & Co. KGaA, Weinheim www.proteomics-journal.de

3662 D. Gade et al. Proteomics 2005, 5, 3654–3671
Table 2. Predicted functions of proteins annotated in the mastergel (see Fig. 2A–D)a)
ORF Putative Function sp PHX Score *
Metabolism (250 proteins)
C-compound and Carbohydrate
201 Sugar phosphate isomerase/epimerase
190 1
307 NAD dependent malicenzyme
+ 201 2
344 Xanthan lyase + 132399 Glucose-6-phosphate
isomerase139 1
548 1,4-alpha-glucan branchingenzyme
233 2
856 L-Lactate/malate dehydro-genase
+ 131
1210 Hexulose-6-phosphateisomerase
+ 105 1
1231 Dihydrolipoamide dehydro-genase
+ 135 2
1358 ADP-glucose pyro-phosphorylase
198
1412 Inositol monophosphatase 124 11593 Isocitrate dehydrogenase 192 21988 Glucose dehydrogenase + 2832114 Aconitate hydratase + 178 22160 Alpha-Amylase + 2292373 Formaldehyde dehydroge-
nase+ 213 2
2403 D-mannonate oxidore-ductase
150
2518 GDP-mannose 4,6 dehy-dratase
+ 162 2
2627 Glyceraldehyde 3-phosphatedehydrogenase
+ 230 2
2638 Glycogen branching enzyme 133 12658 Xylose isomerase + 196 22817 6-Phosphogluconate dehy-
drogenase+ 194 2
3193 Transaldolase + 233 23239 D-tagatose 3-epimerase + 54 13265 Glucose-fructose oxidore-
ductase117
3423 Pyruvate dehydrogenase, E2component
+ 144 2
3424 Pyruvate dehydrogenase, E1component
+ 288
3488 Sorbitol dehydrogenase 2443499 Ribokinase 1244131 Alcohol dehydrogenase 108 24654 Sugar phosphate isomerase/
epimerase+ 124 2
5200 Alpha-Amylase 1295243 Endo-1,4-beta-xylanase B 72 25321 Myo-inositol catabolism
protein IolH99
5948 Alcohol dehydrogenase 157 26061 Phosphomannomutase 310 2
Table 2. Continued
ORF Putative Function sp PHX Score *
6254 Mannose-1-phosphateguanylyltransferase
80
6394 2-Hydroxy acid dehydroge-nase
162 2
6683 Citrate synthase 150 26690 Fructose-1,6-bisphosphate
aldolase+ 130 2
6729 Deoxyribose-phosphatealdolase
+ 55 1
6759 Methenyltetrahydrome-thanopterin cyclohy-drolase
60
6807 Sialic acid-specific9-O-acetylesterase
+ 131
6841 UDP-N-Acetylglucosaminepyrophosphorylase
142 1
6977 UDP-N-Acetylhexosaminepyrophosphorylase
158 2
7095 Triosephosphate isomerase + 109 27294 Glucose 1-dehydrogenase 159 17572 6-Phosphofructokinase, py-
rophosphate-dependent+ 105 1
7652 Malate dehydrogenase + 138 28073 Alpha-L-arabinofuranosi-
dase II+ 151 2
8248 Carboxymethylenebutenol-idase
112
8541 Endoglucanase + 147 28562 Phosphoglycerate mutase 828731 2-keto-3-deoxygluconate
kinase+ 91 2
8924 Phosphonopyruvate de-carboxylase 1
+ 131 2
8941 Ketoglutarate semialdehydedehydrogenase
67 2
9089 6-Phosphogluconolactonase 117 29651 Sialic acidspecific 9-O-acetyl-
esterase80
10002 Glucose dehydrogenase + 133 210048 Sialic acidspecific 9-O-acetyl-
esterase+ 140
10092 Hydratase, aerobic aromatecatabolism
74 2
10124 Polyvinylalcoholdehydrogenase
+ 147
10127 PQQ-dependent glucosedehydrogenase
+ 89 2
10144 Endo-1,4-beta-xylanase B + 12110172 Aldehyde dehydrogenase + 218 210277 Pyruvate kinase 138 210500 Phosphoglycerate kinase + 142 210554 Succinate dehydrogenase
subunit A+ 238 2
10591 PPi-Phosphofructokinase + 164 210617 Succinyl-CoA synthetase
beta subunit+ 99 2
2005 WILEY-VCH Verlag GmbH & Co. KGaA, Weinheim www.proteomics-journal.de

Proteomics 2005, 5, 3654–3671 Microbiology 3663
Table 2. Continued
ORF Putative Function sp PHX Score *
10619 Succinyl-CoA synthetasealpha subunit
+ 103 2
10817 Ribose 5-phosphate epime-rase
+ 81
12361 Ribokinase family sugarkinase
175 2
12381 Enolase + 212 212740 Gluconolactonase precursor 10112921 Transketolase + 151 213260 Alcohol dehydrogenase 7313264 Acetyl-coenzyme A syn-
thetase220 2
Amino Acids and Proteins
1225 Dipeptidyl peptidase IV + 1581317 2-Isopropylmalate synthase 1471359 Serine protease 156 21411 Dihydrodipicolinate
synthase+ 178 2
1732 Beta-Alanine synthetase + 731898 Dehydroquinate synthase 1012261 Carboxypeptidase-related
protein+ 187 1
2278 3-Phosphoshikimate1-carboxyvinyltransferase
131
2552 N-Acetyl-gamma-glutamyl-phosphate reductase
+ 172 1
2661 UDP-N-Acetyl-enolpyruvoylglucosaminereductase
63 2
2746 Dihydrodipicolinatesynthase
100
3824 L-Aspartate oxidase 1763842 Dipeptidyl peptidase IV + 2204282 Matrix metalloproteinase-11 714394 Proteinase + 654928 Aminopeptidase 2445444 S-Adenosylmethionine syn-
thetase+ 234 2
5560 Tryptophan synthase alphachain
126 2
5653 NADH-Glutamate synthasesmall chain
+ 134 1
5720 Amidohydrolase 745986 Ornithine carbamoyltrans-
ferase151
6248 Phosphoglycerate dehydro-genase
149 2
6285 Adenosylhomocysteinase + 152 26300 Glutamine amido-transferase 1196821 Aspartate aminotransferase + 88 16932 Cysteine synthase 126 27359 Gamma-glutamyl phosphate
reductase+ 99 1
7375 Aminopeptidase T 115 1
Table 2. Continued
ORF Putative Function sp PHX Score *
7584 Glycine dehydrogenase (de-carboxylating) subunit 2
154
7587 Aminotransferase-glycinecleavage system T protein
238
7590 Proteinase 174 27823 Transaminase 1237941 cysN/cysC bifunctional
enzyme245 2
8080 Phosphoribosylformimino-5-aminoimidazole carbox-amide botide isomerase,biosynthesis of histidine
127
8126 Branched-chain amino acidaminotransferase
+ 111 2
8219 Aspartate aminotransferase 135 28262 Proline dehydrogenase 1478293 Argininosuccinate synthase + 144 28633 Acetylornithine aminotrans-
ferase+ 119
8926 Aspartokinase + 939029 Metalloproteinase 200 29107 Chorismate mutase 1509402 Protease + 170 19674 X-Pro dipeptidyl-peptidase + 134 19795 Aspartate-semialdehyde
dehydrogenase+ 117 2
9857 5-Methyltetrahydrofolate-homocysteine methyl-transferase
117
9869 Acetohydroxy acid iso-meroreductase
+ 170 2
10112 Imidazole glycerol phosphatesynthase subunit hisF
221 2
10114 Indole-3-glycerol phosphatesynthase
+ 161
10180 Peptidase + 173 210272 Pteridine reductase 136 110287 Dihydropicolinate synthase + 166 210586 Aminopeptidase 165 110826 ATP-dependent clp protease
proteolytic subunit120 2
10829 ATP-dependent clp proteaseproteolytic subunit
+ 88 1
10894 Threonine synthaseprecursor
+ 109 2
11847 Methionine sulfoxidereductase
+ 81
11878 Methionine sulfoxidereductase
56
11879 Periplasmic serine proteinase + 9111919 Dihydroxy acid dehydratase 5911959 Dihydrodipicolinate
reductase114 2
12087 Dihydroxy acid dehydratase + 94 212107 Cytosol aminopeptidase + 165 2
2005 WILEY-VCH Verlag GmbH & Co. KGaA, Weinheim www.proteomics-journal.de

3664 D. Gade et al. Proteomics 2005, 5, 3654–3671
Table 2. Continued
ORF Putative Function sp PHX Score *
12113 Carbamoyl-phosphate syn-thase large chain
+ 177 2
12133 Succinyl-diaminopimelatedesuccinylase
+ 178 1
12148 Periplasmic tail-specificproteinase
+ + 287 2
12337 Prolyl endopeptidase + + 240 212510 Phospho-2-dehydro-3-
deoxyheptonate aldolase143
12597 3-Isopropylmalate dehydro-genase
131
12656 3-Isopropylmalate dehy-dratase large subunit
226 2
12905 Acetolactate synthase IIIprecursor
+ 172 2
Nucleotides
1964 DNA-directed RNA poly-merase alpha chain
+ 191 2
256 Formyltetrahydrofolatedeformylase
145
1386 Nucleoside hydrolase + 1281784 UDP-glucose 6-dehydro-
genase195 2
1819 UDP-glucose 4-epimerase 176 23751 UDP-glucose 4-epimerase 146 24043 Glucose-1-phosphate thymi-
dylyltransferase89
4752 Dihydroorotate dehydro-genase
101
5395 Phosphoribosylformyl-glycinamidinesynthase II
+ 367 2
5603 ATP phosphoribosyltrans-ferase
189 2
5695 Beta-alanine synthetase 173 15847 Adenine phosphoribosyl-
transferase92 2
6135 Phosphoribosylamino-imidazole carboxylasecatalytic subunit
67
6302 ADP-ribose pyrophosphatase 796328 Adenylyl cyclase 1076524 Hypoxanthine-guanine phos-
phoribosyltransferase79
6616 Phosphoribosylamine-gly-cine ligase
+ 99 1
7468 Methylentetrahydrofolatecyclohydrolase
59
8374 GMP synthase + 265 28613 Phosphoribosylform-
ylglycinamidine synthase I133 2
8748 Dihydroorotate dehydro-genase
+ 65
Table 2. Continued
ORF Putative Function sp PHX Score *
10113 Bifunctional purine biosyn-thesis protein purH
+ 224 2
10192 Dihydroorotase + + 96 210510 Cytidylate kinase + 8911832 Nucleoside diphosphate
kinase+ 71 2
12745 Phosphoribosylformyl-glycinamidine cyclo-ligase
109 2
Lipids, Fatty Acids and Isoprenoids
314 Malonyl CoA-acyl-carrier-protein transacylase
+ 101 2
320 3-Oxoacyl-(acyl-carrier-pro-tein) synthase
173 2
1586 3-Oxoacyl-(acyl-carrier-pro-tein) synthase II
104 2
1839 Thiamine biosynthesis lipo-protein apbE
136 2
2144 Geranylgeranyl pyro-phosphate synthetase pre-cursor
78
2579 Ethanolamine utilization pro-tein EutE
+ 67
2825 Glycerophosphodiesterphosphodiesterase
113 1
4527 3-Oxoacyl-(acyl-carrier-pro-tein) synthase
+ 177 1
6272 3-Oxoacyl-(acyl-carrier-pro-tein) synthase
97
6464 Sulfolipid biosynthesis pro-tein
85
7171 3-Oxoacyl-(acyl-carrier-pro-tein) synthase
+ 219 2
7812 Enoyl-CoA hydratase/isom-erase
95
8125 Trans-2-enoyl-(acyl-carrier-protein) reductase
+ 75 2
8550 Biotin carboxylase + 212 210466 Probable beta-
hydroxyacylACP dehy-dratase
+ 72 1
10790 Enoyl-(acyl-carrier-protein)reductase (NADH)
+ 127 2
12812 3-Oxoacyl-(acyl-carrier-pro-tein) synthase III
60
Vitamins, Cofactors and Prosthetic Groups
24 L-sorbosone dehydrogenase 197 2309 Magnesium protoporphyrin
chelatase95 2
536 Pyridoxal phosphate biosyn-thetic protein
128 1
2143 1-Deoxy-D-xylulose 5-phos-phate synthase
226
2005 WILEY-VCH Verlag GmbH & Co. KGaA, Weinheim www.proteomics-journal.de

Proteomics 2005, 5, 3654–3671 Microbiology 3665
Table 2. Continued
ORF Putative Function sp PHX Score *
6809 Thiamine-monophosphatekinase
69 1
6831 Glutamate-1-semialdehyde2,1-aminomutase
89 1
6964 L-sorbosone dehydro-genase
+ 123
9090 3-Methyl-2-oxobutanoatehydroxymethyltransferase
64
10006 Pyridoxamine oxidase 7111582 Cysteine desulfurase 86 112480 Riboflavin biosynthesis
protein RibA+ 91
Sulfatases
198 N-acetylgalactosamine-4-sulfatase precursor
+ 129
1610 Arylsulfatase + 1002367 Sulfatase + + 1213403 N-acetylgalactosamine
6-sulfatase+ 65
3877 Arylsulfate sulphohydrolase + 1374017 Sulfatase 1147481 Arylsulphatase A + + 1629498 Arylsulfatase + + 139 210599 Sulfatase 1 precursor + 16111502 Alkylsulfatase + 60 2
Inorganic Compounds
5869 Bacterioferritin comigratoryprotein
79
6049 Adenylylsulfate kinase 1107247 Glutamine synthetase II + 136 27465 Sulfite reductase + 6511670 Ferric enterobactin esterase-
related protein117
Others
203 Oxidoreductase 154 21555 NADH-dependent dehydro-
genase+ + 154 2
1608 Esterase + 125 21939 Oxidoreductase + 2122242 Oxidoreductase + 164 13317 NADH-dependent dehydro-
genase+ 108
3330 Dehydrogenase + 104 13405 Hydrolase + 275 24404 Oxidoreductase 124 24432 Oxidoreductase + 67 15332 Phosphoesterase 535365 NADH-dependent dehydro-
genase+ + 165 2
6199 Dehydrogenase + + 94 26985 NADH-dependent dehydro-
genase+ 86
Table 2. Continued
ORF Putative Function sp PHX Score *
7081 Oxidoreductase 717482 CDP-tyvelose epimerase + 183 27548 Syringomycin biosynthesis
enzyme 2133 2
8679 Oxidoreductase 1218728 Oxidoreductase + 119 28781 NADH-dependent oxidore-
ductase+ 182
8799 NADH-dependent dehydro-genase
159 2
8937 NADH-dependent dehydro-genase
94
9168 Nucleotide sugar epimerase 68 29584 Oxidoreductase 749586 Oxidoreductase 1169971 NADH-dependent dehydro-
genase+ + 116 1
10503 NADH-dependent oxidore-ductase
+ 142 2
10652 C-methyltransferase 103 110967 Oxidoreductase + 9110971 Dehydrogenase 96 111146 Hydrolase 9911859 Hydrolase 16712019 Oxidoreductase 74 112564 NADH-dependent dehydro-
genase+ 139 1
Stress Response (13 proteins)
390 Alkylhalidase, dehalogenase 1672244 Glutathione peroxidase + + 752799 General stress protein 69 107 24586 Thiol peroxidase + 92 26384 Thioredoxin related protein + 1166688 Superoxide dismutase, Mn
family+ 86 2
7223 Thioredoxin reductase + 76 28238 Peroxiredoxin 2 + 72 28674 Thioredoxin + + 1458870 Multidrug resistance protein + 127 110727 Manganese-containing cata-
lase73 2
11150 Xenobiotic reductase B 114 112541 Thioredoxin + 214 2
Transport (11 proteins)
1248 ATPase component; multi-drug transport system
+ 117 2
1517 ATP-binding protein, lipo-protein releasing system
75
4866 ATP-binding protein, lipo-protein releasing system
69
5795 PTS system, fructose-specificIIABC component
114 2
6236 ATP-binding protein, ABC-transport system
147 2
2005 WILEY-VCH Verlag GmbH & Co. KGaA, Weinheim www.proteomics-journal.de

3666 D. Gade et al. Proteomics 2005, 5, 3654–3671
Table 2. Continued
ORF Putative Function sp PHX Score *
7166 ATP-binding protein, ABC-transport system
89 1
7211 ATP-binding protein, phos-phate transport
186
9998 ATP-binding protein, ABC-transport system
+ 67
10709 Periplasmic dipeptide trans-port protein precursor
+ 203
11930 ATP-binding protein, ABC-transport system
158 2
12859 ATP-binding protein, oli-gopeptide transport
124
Genetic Information Processing (52 proteins)
539 Competence-damage in-ducible protein CinA
93 1
1270 Translation initiation inhibitor + 651485 DNA polymerase beta family 1931964 DNA-directed RNA poly-
merase alpha chain+ 191 2
2543 30S ribosomal protein S1 + 159 23446 Peptidyl-prolyl cis-trans
isomerase cyp2100 2
3886 Ribosome recycling factor 106 24143 Glutamyl-tRNA amidotrans-
ferase subunit A127 2
4395 Macrophage infectivity po-tentiator (map) protein
+ 83
4675 Cysteinyl-tRNA synthetase 108 25178 Prolyl-tRNA synthetase 218 25414 DNA-directed RNA poly-
merase beta chain+ 53
5434 Elongation factor G + 126 15681 Trigger factor + 142 25697 Thiol-disulfide interchange
protein52
5747 Arginyl-tRNA synthetase 205 15754 DnaK 97 15778 Alkaline phosphatase 2345804 Polyribonucleotide nu-
cleotidyltransferase+ 56
5813 Alkaline phosphatase D + 1056123 Protein disulfide-isomerase + 201 26436 Tryptophan-tRNA synthetase 79 17112 Phenylalanyl-tRNA syn-
thetase beta chain131
7114 Phenylalanyl-tRNA syn-thetase alpha chain
129 1
7237 DNA mismatch repair proteinMUTS
+ 98
7244 Peptidylprolyl cis-transisomerase
61 1
7821 Elongation factor G + + 253 27894 Elongation factor Tu + 187 28253 Aspartyl-tRNA synthetase + 249 28328 CMP-binding protein + 151
Table 2. Continued
ORF Putative Function sp PHX Score *
8649 Peptidylprolyl cis-transisomerase
+ + 100
8889 Alkaline phosphatase Dprecursor
+ 132
8919 Leucyl-tRNA synthetase + 1728966 60 kDa chaperonin + 198 28970 60 kDa chaperonin + 148 28974 GrpE chaperone + 579103 ATPases with chaperone ac-
tivity, ATP-binding subunit155 1
9105 DnaK + 1689917 Single-strand binding protein 1109923 50S ribosomal protein L25 + 117 29927 ATP-dependent Clp protease
ATP-binding subunit+ 89
10108 DNA polymerase III, betachain
212 1
10129 Macrophage infectivitypotentiator (map)protein
+ + 76
10629 GroEL + 172 210640 Elongation factor Ts + 211 210852 Glutamyl-tRNA amidotrans-
ferase subunit B+ 114 2
10883 Lysyl-tRNA synthetase + + 153 212577 Elongation factor P 9012626 DNA-directed RNA poly-
merase alpha chain+ 287 2
12799 DNA polymerase I + 20512854 Methionyl-tRNA formyltrans-
ferase159 2
12856 Peptide deformylase + 121 1
Regulation and Signal Transduction (24)
983 Phosphoprotein kinase + 1891140 Response regulator 1011321 Transcription repressor 931483 Sensor histidine kinase/re-
sponse regulator58
2743 Nitrate/nitrite regulatoryprotein NarP
+ 159 2
4081 Regulatory protein 146 24136 Regulatory components of
sensory transductionsystem
+ 53
4487 Nitrogen assimilation regula-tory protein
168 2
5905 Phosphoprotein phos-phatase
60
6403 Response regulator 119 16486 Phosphoprotein kinase + 1656491 RNA polymerase subunit
sigma54134
6603 MoxR-related protein + 164 17123 Response regulator 567541 Phosphoprotein kinase + + 171 2
2005 WILEY-VCH Verlag GmbH & Co. KGaA, Weinheim www.proteomics-journal.de

Proteomics 2005, 5, 3654–3671 Microbiology 3667
Table 2. Continued
ORF Putative Function sp PHX Score *
7898 Transcription antiterminatorNusG
+ 109 1
8173 MoxR-related protein 1139108 MoxR-related protein 109 29110 Phosphoprotein kinase 162 210491 Two-component system re-
gulatory protein71
10517 Methanol dehydrogenaseregulation homolog YeaC
134 1
10839 Phosphoprotein kinase 10111660 Phosphoprotein kinase + 21812952 Two-component system,
regulatory protein69
Energy (8 proteins)
1831 Na+-translocatingNADH:ubiquinone oxido-reductase NqrA
220 2
1833 Na+-translocatingNADH:ubiquinoneoxidoreductase NqrC
+ + 106
4399 Quinone oxidoreductase 185 17084 Pyrophosphatase 16510215 H+-transporting ATP syn-
thase alpha chain+ 124 2
10217 H+-transporting ATP syn-thase beta chain
+ 307 2
11946 Thermophilic NAD(P)H-flavinoxidoreductase
125 2
11985 Quinone oxidoreductase 191 1
Others (8 proteins)
3895 Internalin + 934879 Nodulin-26 117 110228 Twitching motility protein
PilB, biogenesis of pili+ 118
10338 FlbA protein, biogenesis offlagellae
88
10463 Ferredoxin-NADP reductase 14510905 Phosphoesterase PH1616 + 132 110907 Phosphoesterase PH1616 143 212774 Type IV fimbrial assembly
protein PilB269 1
Conserved Hypothetical Proteins (94 proteins)
85 Conserved hypotheticalprotein
+ 114
452 Conserved hypotheticalprotein
215 1
457 Conserved hypotheticalprotein
183
520 Conserved hypotheticalprotein
145 1
538 Conserved hypotheticalprotein
232 2
Table 2. Continued
ORF Putative Function sp PHX Score *
569 Conserved hypotheticalprotein
+ + 74 2
1044 Conserved hypotheticalprotein
221 1
1109 Conserved hypotheticalprotein
+ + 70 2
1703 Maf protein 561731 Conserved hypothetical
protein75
1739 Conserved hypotheticalprotein
67
1753 Conserved hypotheticalprotein
+ 76 2
1854 Conserved hypotheticalprotein
144
2435 Conserved hypotheticalprotein
+ 157
2680 Conserved hypotheticalprotein
+ 91 1
2714 Conserved hypotheticalprotein
122
2908 Conserved hypotheticalprotein
+ 76
2912 Conserved hypotheticalprotein
+ 143 2
2976 Conserved hypotheticalprotein
102
3221 Conserved hypotheticalprotein
161
3509 Conserved hypotheticalprotein
+ 183
3599 Ring canal kelch protein + 1333924 Conserved hypothetical
protein107 1
3944 Conserved hypotheticalprotein
+ 167 2
4127 Conserved hypotheticalprotein
+ 99
4129 Conserved hypotheticalprotein
+ 105 2
4278 Conserved hypotheticalprotein
81
4347 Conserved hypotheticalprotein
+ 109
4485 Conserved hypotheticalprotein
86 2
4532 Conserved hypotheticalprotein
+ 83
4738 Conserved hypotheticalprotein
130 2
4742 Conserved hypotheticalprotein
89 1
5186 Conserved hypotheticalprotein
55 1
5313 Conserved hypotheticalprotein
+ 157
2005 WILEY-VCH Verlag GmbH & Co. KGaA, Weinheim www.proteomics-journal.de

3668 D. Gade et al. Proteomics 2005, 5, 3654–3671
Table 2. Continued
ORF Putative Function sp PHX Score *
5511 Conserved hypotheticalprotein
161
5788 Conserved hypotheticalprotein
+ + 58
5952 Conserved hypotheticalprotein
+ 133
6120 TolB protein + 105 26395 Conserved hypothetical
protein65 2
6409 Conserved hypotheticalprotein
+ 113
6416 Conserved hypotheticalprotein
133 1
6417 Conserved hypotheticalprotein
81 2
6530 Conserved hypotheticalprotein
70
7091 Conserved hypotheticalprotein
84
7120 Conserved hypotheticalprotein
+ 102 1
7292 Conserved hypotheticalprotein
86
7538 Conserved hypotheticalprotein
+ 158 1
7619 Conserved hypotheticalprotein
79 2
7789 TolB protein [precursor] 617822 Conserved hypothetical
protein96 2
8031 Conserved hypotheticalprotein
+ 122 1
8188 Conserved hypotheticalprotein
58
8202 Conserved hypotheticalprotein
+ 86
8246 Conserved hypotheticalprotein
+ 184 2
8266 Conserved hypotheticalprotein
+ 60 1
8291 Conserved hypotheticalprotein
53
8456 Conserved hypotheticalprotein
73
8501 Conserved hypotheticalprotein
+ 158
8557 Conserved hypotheticalprotein
130
8565 Conserved hypotheticalprotein
+ 136 2
8639 Conserved hypotheticalprotein
+ 168 2
8677 Conserved hypotheticalprotein
152
8783 Conserved hypotheticalprotein
102
Table 2. Continued
ORF Putative Function sp PHX Score *
9132 Conserved hypotheticalprotein
+ 138 2
9261 Conserved hypotheticalprotein
+ 139
9262 Conserved hypotheticalprotein
+ 113 1
9367 Conserved hypotheticalprotein
+ 64
9386 FixW protein + + 64 29438 Conserved hypothetical
protein+ 134 2
9546 Conserved hypotheticalprotein
+ 91 1
9606 Conserved hypotheticalprotein
+ 78
9849 Conserved hypotheticalprotein
+ + 175
9992 Conserved hypotheticalprotein
+ 151
10028 Conserved hypotheticalprotein
77 1
10061 Conserved hypotheticalprotein
123 2
10078 Conserved hypotheticalprotein
+ 299
10088 Conserved hypotheticalprotein
100 1
10103 Conserved hypotheticalprotein containing kelch-motif
+ + 102
10195 Conserved hypotheticalprotein
+ + 90 2
10235 Conserved hypotheticalprotein
56
10359 Conserved hypotheticalprotein
129
10478 Conserved hypotheticalprotein
+ 140 2
10789 Conserved hypotheticalprotein
+ 96
10987 Conserved hypotheticalprotein
113
11183 Conserved hypotheticalprotein
181 2
11262 Conserved hypotheticalprotein
101 1
11494 Conserved hypotheticalprotein
+ 60
11505 Conserved hypotheticalprotein
+ + 68
11728 Conserved hypotheticalprotein
+ 177 2
11811 Conserved hypotheticalprotein
+ 70
11998 Conserved hypotheticalprotein
+ + 156 2
2005 WILEY-VCH Verlag GmbH & Co. KGaA, Weinheim www.proteomics-journal.de
Proteomics 2005, 5, 3654–3671 Microbiology 3669
Table 2. Continued
ORF Putative Function sp PHX Score *
12056 Conserved hypotheticalprotein containing TPRdomain
+ 281 2
12301 Conserved hypotheticalprotein
+ + 79
12891 Conserved hypotheticalprotein
95
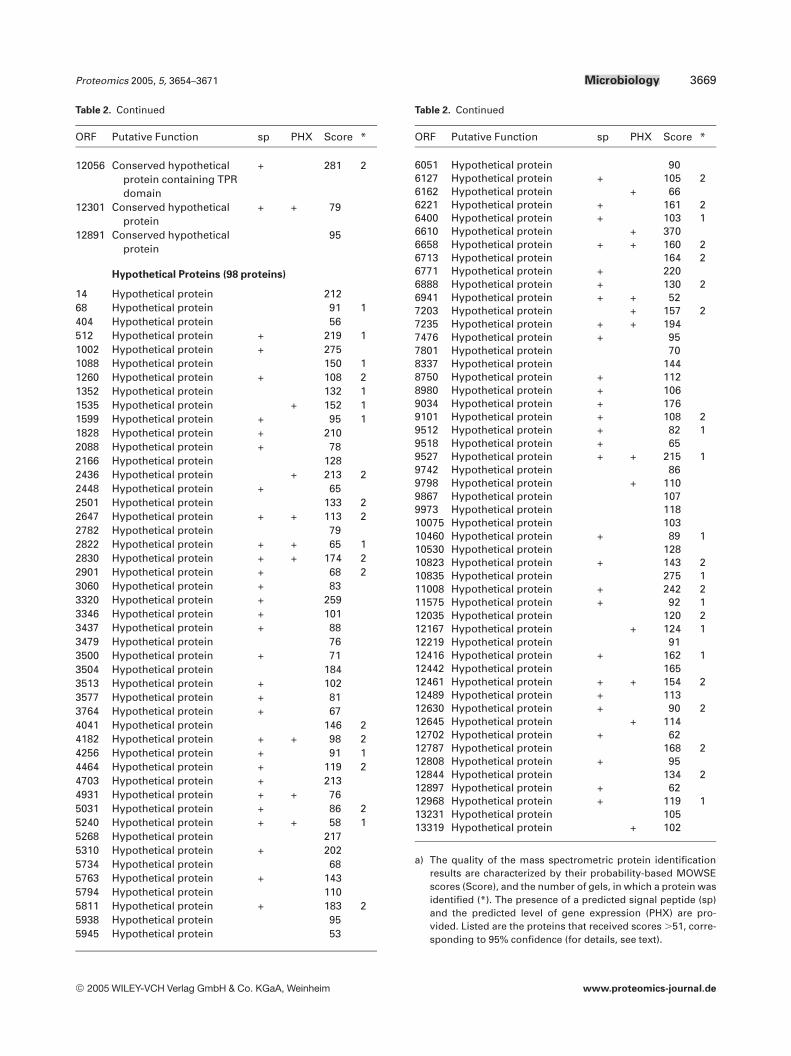
Hypothetical Proteins (98 proteins)
14 Hypothetical protein 21268 Hypothetical protein 91 1404 Hypothetical protein 56512 Hypothetical protein + 219 11002 Hypothetical protein + 2751088 Hypothetical protein 150 11260 Hypothetical protein + 108 21352 Hypothetical protein 132 11535 Hypothetical protein + 152 11599 Hypothetical protein + 95 11828 Hypothetical protein + 2102088 Hypothetical protein + 782166 Hypothetical protein 1282436 Hypothetical protein + 213 22448 Hypothetical protein + 652501 Hypothetical protein 133 22647 Hypothetical protein + + 113 22782 Hypothetical protein 792822 Hypothetical protein + + 65 12830 Hypothetical protein + + 174 22901 Hypothetical protein + 68 23060 Hypothetical protein + 833320 Hypothetical protein + 2593346 Hypothetical protein + 1013437 Hypothetical protein + 883479 Hypothetical protein 763500 Hypothetical protein + 713504 Hypothetical protein 1843513 Hypothetical protein + 1023577 Hypothetical protein + 813764 Hypothetical protein + 674041 Hypothetical protein 146 24182 Hypothetical protein + + 98 24256 Hypothetical protein + 91 14464 Hypothetical protein + 119 24703 Hypothetical protein + 2134931 Hypothetical protein + + 765031 Hypothetical protein + 86 25240 Hypothetical protein + + 58 15268 Hypothetical protein 2175310 Hypothetical protein + 2025734 Hypothetical protein 685763 Hypothetical protein + 1435794 Hypothetical protein 1105811 Hypothetical protein + 183 25938 Hypothetical protein 955945 Hypothetical protein 53
Table 2. Continued
ORF Putative Function sp PHX Score *
6051 Hypothetical protein 906127 Hypothetical protein + 105 26162 Hypothetical protein + 666221 Hypothetical protein + 161 26400 Hypothetical protein + 103 16610 Hypothetical protein + 3706658 Hypothetical protein + + 160 26713 Hypothetical protein 164 26771 Hypothetical protein + 2206888 Hypothetical protein + 130 26941 Hypothetical protein + + 527203 Hypothetical protein + 157 27235 Hypothetical protein + + 1947476 Hypothetical protein + 957801 Hypothetical protein 708337 Hypothetical protein 1448750 Hypothetical protein + 1128980 Hypothetical protein + 1069034 Hypothetical protein + 1769101 Hypothetical protein + 108 29512 Hypothetical protein + 82 19518 Hypothetical protein + 659527 Hypothetical protein + + 215 19742 Hypothetical protein 869798 Hypothetical protein + 1109867 Hypothetical protein 1079973 Hypothetical protein 11810075 Hypothetical protein 10310460 Hypothetical protein + 89 110530 Hypothetical protein 12810823 Hypothetical protein + 143 210835 Hypothetical protein 275 111008 Hypothetical protein + 242 211575 Hypothetical protein + 92 112035 Hypothetical protein 120 212167 Hypothetical protein + 124 112219 Hypothetical protein 9112416 Hypothetical protein + 162 112442 Hypothetical protein 16512461 Hypothetical protein + + 154 212489 Hypothetical protein + 11312630 Hypothetical protein + 90 212645 Hypothetical protein + 11412702 Hypothetical protein + 6212787 Hypothetical protein 168 212808 Hypothetical protein + 9512844 Hypothetical protein 134 212897 Hypothetical protein + 6212968 Hypothetical protein + 119 113231 Hypothetical protein 10513319 Hypothetical protein + 102
a) The quality of the mass spectrometric protein identificationresults are characterized by their probability-based MOWSEscores (Score), and the number of gels, in which a protein wasidentified (*). The presence of a predicted signal peptide (sp)and the predicted level of gene expression (PHX) are pro-vided. Listed are the proteins that received scores .51, corre-sponding to 95% confidence (for details, see text).
2005 WILEY-VCH Verlag GmbH & Co. KGaA, Weinheim www.proteomics-journal.de

3670 D. Gade et al. Proteomics 2005, 5, 3654–3671
Table 3. Proteins (new ORF) specifically identified from the Maximal ORF Set (MOS)
ORF no. Start Stop Length(aa)
MASCOTscore
Predictedfunction
Genetic context
pir.6532c 1798993 1799565 290 61 Hypothetical Methionine aminopeptidase,hypotheticals; other strand:ribose-regulated sugar-ADH
pir.8508 2358829 2359248 139 60 Hypothetical Mostly hypotheticals
pir.9191c 2546400 2546921 173 101 Hypothetical Mostly hypotheticals, down-stream of possible adenylatecyclase
pir.15895 4437587 4438426 279 56 Hypothetical Mostly hypotheticals; upstreamof D-tyrosyl-tRNA(Tyr)-deacylase
Figure 3. Intracellular compartmentalization of R. baltica andpossible location of identified proteins (Bar = 0.2 mm).
According to the signal hypothesis [46], the majority ofsecreted proteins have a signal peptide, which is found in1160 (16%) of the predicted proteins in R. baltica. Out of the558 identified proteins annotated in the master gel 146 (26%)possess a signal peptide (Table 2). Since the applied methodsfor cell breakage did not separate riboplasmic from par-yphoplasmic proteins one can conclude that the 146 signalpeptide containing proteins have potentially been secretedand are actually localized in the paryphoplasm or are cell wallassociated.
For 58% (57 proteins) of the hypothetical proteins a sig-nal peptide was predicted. Thirty-six (about 38%) of the94 conserved hypothetical proteins are secreted according tothe signalP prediction. Secreted proteins with functionalassignment are mainly dehydrogenases, hydrolases forextracellular macromolecules or involved in signal transduc-tion (phosphoprotein kinases). In contrast, the enzymesperforming housekeeping functions seem to be confined tothe riboplasm (no signal peptide). Interestingly, nine of the10 identified sulfatases have a signal peptide prediction. TheR. baltica genome encodes 110 sulfatases, which are sug-gested to function in extracellular degradation of sulfatedglycopolymers such as, e.g., carrageen [26]. Thus, the identi-fied sulfatases could be in the process of being excreted,since proteins already excreted to the extracellular spacewould have been lost under the applied conditions of cell
harvesting. Expression of sulfatase encoding genes mightnot require the presence of sulfated substrates, since thestudied R. baltica cells were grown with ribose as only sourceof organic carbon. In some cases the correctness of the signalpeptide prediction is questionable, e.g., for the elongationfactor G and lysyl-tRNA synthase. Both enzymes play animportant role in protein synthesis, a process that shouldexclusively take place in the riboplasm. Thus the presence ofa signal peptide alone does not allow defining the exact targetregion of translocation. Future research on secreted proteins(secretome) will have to differentiate the different compart-ments present in R. baltica cells.
3.7 Predicted highly expressed (PHX) genes
Among the 30 most abundant proteins on the master gel ofR. baltica, 27 were encoded by genes that were predicted to behighly expressed (PHX) according to codon usage adapta-tion. Thus, a correlation between experimentally determinedprotein abundance and codon usage features as it already hasbeen shown for fast-growing bacteria [43] could also beobserved for R. baltica, a slowly growing environmental bac-terium (doubling times between 10–14 h, [32]). However,there are some exceptions where the genes of proteinsappearing as highly abundant on 2-DE gels are not PHX; thisapplies mainly for proteins that were, e.g., specificallyinduced during growth with ribose (see accompanying pub-lication) or proteins affiliated with lipid metabolism.
4 Concluding remarks
With more than 550 identified gene products, the presentstudy established a solid proteomic framework for furtheranalysis of differential gene expression in R. baltica. Con-sidering the nutritional specialization of this bacterium onthe utilization of carbohydrates, we will be able to reconstructthe major catabolic routes which are operative in R. balticaand to learn about the potential of this bacterium to regulate
2005 WILEY-VCH Verlag GmbH & Co. KGaA, Weinheim www.proteomics-journal.de

Proteomics 2005, 5, 3654–3671 Microbiology 3671
the expression of catabolic genes in response to the avail-ability of respective growth substrates (see accompanyingpublication). The master gel will also be beneficial for theidentification of proteins involved in cell cycle and develop-ment. Such proteins should be related to the two morpho-types (single cells versus aggregates) as well as to differentgrowth stages.
We thank Alfred Beck and Thomas Kreitler for bioinfor-matics support. We are indebted to Friedrich Widdel for con-tinuous support of proteomic work at the MPI in Bremen. Thisstudy was supported by the Max Planck Society.
Addendum in proof
A recent proteomic study revealed growth phase dependentregulation of protein composition in R. baltica (Gade, D.,Stührmann, T., Reinhardt, R., Rabus, R., Environ. Microbiol.2005, 7, 1074–1084).
5 References
[1] Fleischmann, R. D., Adams, M. D., White, O., Clayton, R. A. etal., Science 1995, 269, 496–512.
[2] Himmelreich, R., Hilbert, H., Plagens, H., Pirkl, E. et al.,Nucleic. Acids Res. 1996, 24, 4420–4449.
[3] Tonella, L., Walsh, B. J., Sanchez, J. C., Ou, K., et al., Elec-trophoresis 1998, 19, 1960–1971.
[4] Tonella, L., Hoogland, C., Binz, P.-A., Appel, R. D. et al., Pro-teomics 2001, 1, 409–423.
[5] Molloy, M. P., Herbert, B. R., Slade, M. B., Rabilloud, T. et al.,Eur. J. Biochem. 2000, 276, 2871–2881.
[6] Ohlmeier, S., Scharf, C., Hecker, M., Electrophoresis 2000,21, 3701–3709.
[7] Büttner, K., Bernhardt, J., Scharf, C., Schmid, R. et al., Elec-trophoresis 2001, 22, 2908–2935.
[8] Regula, J. T., Ueberle, B., Boguth, G., Görg, A. et al., Elec-trophoresis 2000, 21, 3765–3780.
[9] Regula, J. T., Boguth, G., Görg, A., Mayer, F. et al., Micro-biology 2001, 147, 1045–1057.
[10] Ueberle, B., Frank, R., Herrmann, R., Proteomics 2002, 2,754–764.
[11] Cordwell, S. J., Larsen, M. R., Cole, R. T., Walsh, B. J.,Microbiology, 2002, 148, 2765–2781.
[12] Hecker, M., Engelmann, S., Cordwell, S. L., J. Chromatogr. B2003, 787, 179–195.
[13] Fountoulakis, M., Takacs, B., Langen, H., Electrophoresis1998, 19, 761–766.
[14] Fountoulakis, M., Juranville, J. F., Roder, D., Evers, S. et al.,Electrophoresis 1998, 19, 1819–1827.
[15] Langen, H., Takács, B., Evers, S., Berndt, P. et al., Electro-phoresis 2000, 21, 411–429.
[16] Nouwens, A. S., Willcox, M. D., Walsh, B. J., Cordwell, S. J.,Proteomics 2002, 2, 1325–1346.
[17] Hermann, T., Pfefferle, W., Baumann, C., Busker, E. et al.,Electrophoresis 2001, 22, 1712–1723.
[18] Hesketh, A. R., Chandra, G., Shaw, A. D., Rowland, J. J. et al.,Mol. Microbiol. 2002, 46, 917–932.
[19] Görg, A., Obermaier, C., Boguth, G., Harder, A. et al., Elec-trophoresis 2000, 21, 1037–1053.
[20] Pappin, D. J. C., Højrup, P., Bleasby, A. J., Curr. Biol. 1993, 3,327–332.
[21] Henzel, W.J., Billeci, T.M., Stults, J.T., Wong, S.C. et al. Proc.Natl. Acad. Sci. USA 1993, 90, 5011–5015.
[22] Mann, M., Højrup, P., Roepstorff, P., Biol. Mass Spectrom.1993, 22, 338–345.
[23] Karas, M., Hillenkamp, F., Anal. Chem. 1988, 60, 2301–2303.
[24] Kaneko, T., Sato, S., Kotani, H., Tanaka, A. et al., DNA Res.1996, 3, 109–136.
[25] Nierman, W. C, Feldblyum, T. V., Laub, M. T., Paulsen, I. T. etal., Proc. Natl. Acad. Sci. USA 2001, 98, 4136–4141.
[26] Glöckner, F. O., Kube, M., Bauer, M., Teeling, H. et al., Proc.Natl. Acad. Sci. USA 2003, 100, 8298–8303.
[27] Vohradsky, J., Janda, I., Grünenfelder, B., Berndt, P. et al.,Proteomics 2003, 3, 1874–1882.
[28] Huang, F., Parmryd, I., Nilsson, F., Persson, A. L. et al., Mol.Cell. Proteomics 2002, 1, 956–966.
[29] Schlesner, H., Bartels, C., Tindall, B. J., Gade, D. et al., Int. J.Syst. Evol. Microbiol. 2004, 54, 1567–1580.
[30] Lindsay, M., Webb, R. I., Fuerst, J. A., Microbiology 1997,143, 739–748.
[31] Lindsay, M., Webb, R. I., Strous, M., Jetten, M. S. M. et al.,Arch. Microbiol. 2001, 175, 413–429.
[32] Rabus, R., Gade, D., Helbig, R., Bauer, M. et al., Proteomics2002, 2, 649–655.
[33] Bradford, M. M., Anal. Biochem. 1976, 72, 248–254.
[34] Gade, D., Thiermann, J., Markowsky, D., Rabus, R., J. Mol.Microbiol. Biotechnol. 2003, 5, 240–251.
[35] Dorothy, N. S., Littmann, B. H., Reilly, K., Swindell, A. C.,Buss, J. M., Anderson, N. L., Electrophoresis 1998, 19, 355–363.
[36] Nordhoff, E., Egelhofer, V., Giavalisco, P., Eickhoff, H. et al.,Electrophoresis 2001, 22, 2844–2855.
[37] Gobom, J., Schuerenberg, M., Mueller, M., Theiss, D. et al.,Analyt. Chem. 2001, 73, 434–438.
[38] Gobom, J., Mueller, M., Egelhofer, V., Theiss, D. et al., Anal.Chem. 2002, 74, 3915–3923.
[39] Perkins, D. N., Pappin, D. J., Creasy, D. M., Cottrell, J. S.,Electrophoresis 1999, 20, 3551–3567.
[40] Rice, P., Longden, I., Bleasby, A., Trends Genet. 2000, 16,276–277.
[41] Nielsen, H., Engelbrecht, J., Brunak, S., von Heijne, G., Pro-tein Eng. 1997, 10, 1–6.
[42] Meyer, F., Goesmann, A., McHardy, A. C., Bartels, D. et al.,Nucleic Acids Res. 2003, 31, 2187–2195.
[43] Karlin, S., Mrázek, J., Campell, A., Kaiser, D., J. Bacteriol.2001, 183, 5025–5040.
[44] VanBogelen, R. A., Schiller, E. E., Thomas, J. D., Neidhardt, F.C., Electrophoresis 1999, 20, 2149–2159.
[45] Schwartz, R., Ting, C. S., King, J., Genome Res. 2001, 11,703–709.
[46] Blobel, G., Chembiochemistry 2000, 1, 86–102.
2005 WILEY-VCH Verlag GmbH & Co. KGaA, Weinheim www.proteomics-journal.de