towed glider air launch system spacetech2016 5.2.2016 · pdf filetowed glider air launch...
TRANSCRIPT

GAME CHANGING DEVELOPMENT PROGRAM NEW START PROPOSAL
NASA Space Technology Mission Directorate 2016 5/24/2016
Towed Glider Air Launch System
Gerald D. (Jerry) Budd, Project Manager NASA Armstrong Flight Research Center, Edwards, CA 661-276-3377 (office) 661-607-1483 (cell) [email protected]
Darryl W. Webb, Senior Project Leader Economic Market & Analysis Center The Aerospace Corporation, El Segundo, CA 310-336-2456 (office) [email protected]
https://ntrs.nasa.gov/search.jsp?R=20160006964 2018-05-26T11:22:02+00:00Z

TGALS – Towed Glider Air Launch System NASA Space Technology Mission Directorate 2016
TOWED GLIDER LAUNCH PLATFORM ANIMATION
2
A remotely-piloted glider, towed by a modified cargo/passenger jet, releasing a launch vehicle with payload at 48K’, M=0.75, up to a 700 flight path angle, safely & effectively.

TGALS – Towed Glider Air Launch System NASA Space Technology Mission Directorate 2016 5/24/2016
TOWED GLIDER LAUNCH PLATFORM CONOPS
3
Launch Vehicle Ignition!
Glider Executes Pull-Up Maneuver !
Tow Line Released !
Tow Plane Pulls Glider to Altitude and Levels Off !
2nd Stage Burnout, Staging and Fairing
Deployment!
3rd Stage Burnout and
Staging!4th Stage Burnout!
Glider Returns Home!
Satellite Deployment!
1st Stage Burnout
and Staging!
Releases Launch Vehicle!
Glider’s Sustainer Rocket Motor
Started !
Take Off and Climb Out !
Note: Not to scale. Launch vehicle is notional.!
450 km, polar,
circular orbit!

TGALS – Towed Glider Air Launch System NASA Space Technology Mission Directorate 2016 5/24/2016 4
Sustainer Rocket Motor
Velocity
Li+
DragWeight
FlightPath
ClimbAngleupto700
HorizontalAxis
VerAcalAxis
SustainerRocketMotor
LocaAon:Mountedontopoftheglider
Purpose: Provides variable thrust on demand to change the Glider and LV orientation from horizontal to nearly vertical
Features:-Restartable-Thro6leablefrom~15%to100%-Controllable-IncreasesGliderfly-backrange
Profile:Starthorizontal,idlesustainermotor,beginpull-uptowards700climb,usesustainermotorvariablethrusttomaintainconstantairspeedduringclimb,stabilizeat700thenreleaseLV
The sustainer motor provides the energy to go from horizontal to nearly vertical so the LV is optimally oriented for launch

TGALS – Towed Glider Air Launch System NASA Space Technology Mission Directorate 2016 5/24/2016
Glider Design Creates Trade Space
5
Next Generation: Towed Glider
Towed Glider flexibility ensures design success
Open center wing design minimizes LV clearance issue
Glider can be sized to allow growth for future desired payloads
Payload max size virtually unconstrained due to glider geometry and ability to build to suit
Remote piloting eliminates need for human rating for the LV and the glider
Glider simple design is low maintenance
Minimal separation analysis required for un-crewed aircraft
TGALS – Towed Glider Air Launch System NASA Space Technology Mission Directorate 2016
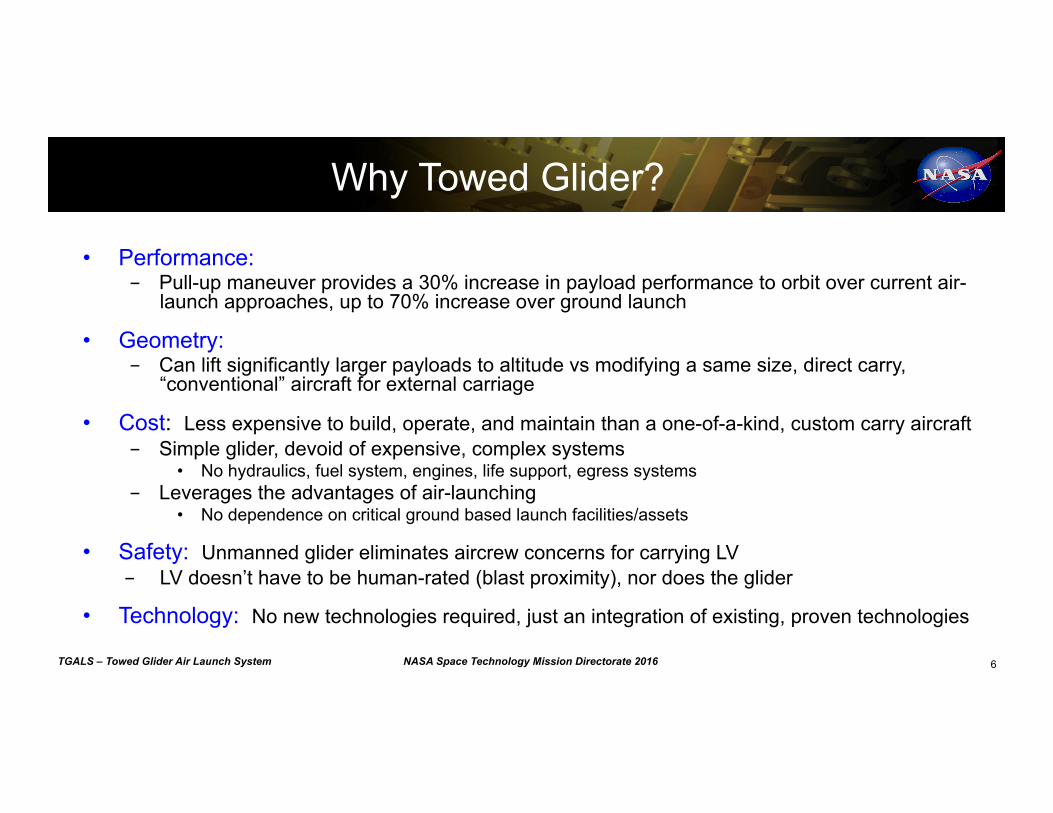
Why Towed Glider?
• Performance: - Pull-up maneuver provides a 30% increase in payload performance to orbit over current air-
launch approaches, up to 70% increase over ground launch
• Geometry: - Can lift significantly larger payloads to altitude vs modifying a same size, direct carry,
“conventional” aircraft for external carriage
• Cost: Less expensive to build, operate, and maintain than a one-of-a-kind, custom carry aircraft - Simple glider, devoid of expensive, complex systems
• No hydraulics, fuel system, engines, life support, egress systems - Leverages the advantages of air-launching
• No dependence on critical ground based launch facilities/assets
• Safety: Unmanned glider eliminates aircrew concerns for carrying LV - LV doesn’t have to be human-rated (blast proximity), nor does the glider
• Technology: No new technologies required, just an integration of existing, proven technologies
6

TGALS – Towed Glider Air Launch System NASA Space Technology Mission Directorate 2016 5/24/2016
Independent Concept Validation Studies
• NASA contracted with three separate entities in 2012 to study and assess the viability of
the Towed Glider Air Launch System Concept
- Georgia Tech University
- SAS/Rutan Designs
- Morgan Aircraft Co.
• All three studies concluded that:
- The concept is viable;
- It offers significant improvements in efficiency, performance, and cost, over current state of the art air
launch methods.
7
The studies showed the concept is do-able…next step is the Proof of Concept
Design Carry Efficiency: 1.85

TGALS – Towed Glider Air Launch System NASA Space Technology Mission Directorate 2016 5/24/2016
Aerospace Corp. Business Case Analysis • Aerospace Corp. is currently performing a study of TGALS to:
- Estimate the costs associated with the development, integration, and test of major TGALS components:
• Glider • Glider sustainer motor • Tow plane modifications • Launch Vehicle modifications • System operations costs
- Develop projections for potential TGALS launch rates under several different scenarios - Forecast TGALS financial performance within these scenarios, using both a traditional
government acquisition scheme as well as a private-public partnership mechanism proposed by AFRC, including the following metrics:
• Cash flow projections • Return on Investment (ROI) • Payback period • Net Present Value • Operating Margins
8

9
Business Case Analysis (BCA) – Modeling Approach BCA modeling predicts technology, industrial capability, development and acquisition cost, market size, capture rates, financials, uncertainty, and utility functions resulting in decision frameworks
1 5.00 Excellent4.00 Good3.00 Marginal2.00 Poor1.00 Inadequate
Utility Scoring Weighted ScoresCase 1 2 3 4 5 6
Candidate 1 Candidate 2 Candidate 3 Candidate 4 Candidate 5 Candidate 6
Wtg High
100% Composite 3.37 2.50 3.68 3.19 3.97 2.04
Low
20% ROI 5.00 3.00 3.50 5.00 4.50 2.00
5% NPV 1.00 4.00 4.50 1.00 4.50 1.00
20% Breakeven 4.00 2.00 2.50 4.00 5.00 4.00
5% Capture Rate 0.50 4.00 4.50 0.50 3.00 0.50
0% Competitive Posture
0% Market Health
10% Safety 4.00 3.50 4.00 2.00 4.00 3.60
5% Organization 2.00 2.00 2.50 2.00 3.00 2.00
10% Performance -1 5.00 2.50 3.00 5.00 5.00 2.30
10% Performance -2 3.00 2.50 4.00 3.00 3.50 3.00
5% Business Risk 4.20 1.00 4.00 4.20 3.50 1.50
5% Technical Risk 4.20 1.00 4.00 4.20 3.50 1.50
5% Risk Mitigation 4.20 2.00 4.00 4.20 4.20 1.00
y=36440ln(x)- 277055R²=0.7651
y=7E-233e0.2676xR²=0.8498
y=4280.6ln(x)- 32542R²=0.667
y=1E-127e0.1464xR²=0.5864
1
10
100
1000
10000
2000 2005 2010 2015 2020 2025 2030 2035
SatellitesLaun
ched
Year
Launchesof1-50kgSatellite
11-50 kgtypicallymanifested2perlaunch
1-10 kgtypicallymanifested5perlaunch
0
10
20
30
40
50
60
70
80
90
100
2010 2015 2020 2025 2030 2035 2040
MarketCaptureRate%
YearFromDesignInitiation
TouristMarketCaptureRate
High=80%by2024 Low =80%
by2032
High=30%by2020
Low=6%by2020
6.1912% 10.004%
6.8337% 9.5759%
7.4636% 8.2680%
7.6656% 8.3849%
7.7899% 8.2263%
6.0%
6.5%
7.0%
7.5%
8.0%
8.5%
9.0%
9.5%
10.0
%
10.5
%
19 irr
AM Cost Reduction / Dist
New Design / Dist
Design Complexity / Dist
Recommended profit rate = / Dist
Protos / Dist
19 irrInputs Ranked By Effect on Output Mean
Baseline = 7.9782%
-500
0
500
1,000
1,500
2,000
2,500
2015 2020 2025 2030 2035 2040 2045 2050
$inm
illions201
6
Year
CumulativeFinancials
PreTaxProfit
CumRevenue
CumExpenses
0
10
20
30
40
50
60
70
80
90
100
Expe
nditu
res
$ .
Program Months
Acceleration Costs
Produceability
Normal Funding
CAD,CAM,CAE,IDS (2)
IM&P - General (1) Performance (7)
Produceability (9)
Cost of Technology (8)
Design Cycle Experience (5)
Physical Characteristics (3)
Reliability & Safety (4)
ProgramStart
Criticality of Failure (6)
Design IOC
Produceability End
-
0.10
0.20
0.30
0.40
0.50
0.60
0.70
0.80
0.90
1.00
- 10,000 20,000 30,000 40,000
Valu
e
Cost
Cost Value Function
Technology forecasting Industry capability assessment
Market forecasting Price demand elasticity Competition effects Profit mark-up predictions
Competitive assessment Profit application feasibility Capture rate prediction
Profit/Loss, Breakeven, ROI, NPV Uncertainty, Sensitivity, Risk Value Utilities Management Decision Framework
Forecast AircraftMods
TowCable TowRetract Airframe Avionics SW Motor FuelTanks FuelSysAvionics&Power
1stStg 2ndStg 3rdStg 4thStg Fairing StgStr StageCabling Avionics
M Mode(0=str,1=el) 0.000 0.000 0.000 0.000 1.000 2.000 0.000 0.000 0.000 0.500 0.000 0.000 0.000 0.000 0.000 0.000 0.000 1.000MS MarketSegment 6 6 6 6 6 6 6 6 6 6 6 6 6 6 6 6 6 6AL Assemblylevel 4 4 4 4 4 4 4 4 4 4 4 4 4 4 4 4 4 4PPD PrimeprofitDev 0% 0% 0% 0% 0% 0% 0% 0% 0% 0% 0% 0% 0% 0% 0% 0% 0% 0%PPP PrimeProfitProd 0% 0% 0% 0% 0% 0% 0% 0% 0% 0% 0% 0% 0% 0% 0% 0% 0% 0%Buy Buy% 100% 100% 100% 80% 80% 35% 100% 100% 100% 80% 100% 100% 100% 100% 100% 100% 100% 80%YrDH EconYr$ 2016 2016 2016 2016 2016 2016 2016 2016 2016 2016 2016 2016 2016 2016 2016 2016 2016 2016IMP IM&PYr 1997 2005 2000 1990 2005 2016 2000 2016 2016 2010 2016 2016 2016 2016 2016 2016 2010 2010Pyr PerfTechYr 1997 2005 2000 1990 2005 2016 2000 2016 2016 2010 2016 2016 2016 2016 2016 2016 2010 2010CAD CADCAMYr 1997 2005 2000 1990 2005 2016 2000 2016 2016 2010 2016 2016 2016 2016 2016 2016 2010 2010EPCE Eng,PMCycleExpyr 2016 2016 2016 2016 2016 2016 2016 2016 2016 2016 2016 2016 2016 2016 2016 2016 2016 2016QNA QtyNHA 1 1 1 1 1 1 1 1 1 1 1 1 1 1 1 1 1 1DP Protos 1.00 3.00 3.00 2.00 2.00 1.00 1.00 2.00 2.00 2.00 8.00 8.00 8.00 8.00 8.00 4.00 4.00 4.00PBQ PlannedBuildQty 1 1 1 1 1 1 1 1 1 1 1 1 1 1 1 1 1 1PQ PriorQty 0 0 0 0 0 0 0 0 0 0 0 0 0 0 0 0 0 0BQ ProdBuildQty 1 1 1 1 1 1 1 1 1 1 1 1 1 1 1 1 1 1AR AnnualRate 1 1 1 1 1 1 1 1 1 1 8 8 8 8 8 8 8 8
HR HR HR NHR NHR NHR NHR NHR NHR NHR NHR NHR NHR NHR NHR NHR NHR NHRAir-Commercial Air-
CommercialAir-Commercial Air-Commercial Air-Commercial Air-
CommercialSupersonic-Commercial
Supersonic-Commercial
Supersonic-Commercial
Supersonic-Commercial
Non-HR,SL Non-HR,SL Non-HR,SL Non-HR,SL Non-HR,SL Non-HR,SL Non-HR,SL Non-HR,SL
S Size(kg)orSLOC 400 600 300 3,000 200 0 9 56 26 17 6,229 2,008 689 146 1,850 925 8 50Des DesignComplexity 0.59 0.12 0.55 1.29 0.82 0.55 0.20 0.50 1.00 1.00 0.41 0.41 0.41 0.41 0.35 0.35 0.35 0.35ND NewDesign 20% 31% 31% 100% 0% 100% 6% 100% 100% 75% 31% 31% 31% 31% 31% 31% 31% 8%R Redund% 0% 17% 17% 0% 0% 0% 0% 25% 0% 0% 0% 0% 0% 0% 0% 0% 17% 17%INT Integration(internal) 1.0 3.0 3.0 4.0 5.0 5.0 4.0 4.0 5.0 5.0 6.0 6.0 6.0 6.0 6.0 6.0 11.0 11.0
Epsilon-1(cplx) 0.047 0.001 0.002 0.008 0.019 0.273 0.089 0.003 0.003 0.009 0.006 0.006 0.009 0.019 0.001 0.001 0.004 0.014PIR%= 0.5% 0.5% 0.5% 0.5% 5.3% 10.1% 0.5% 0.5% 0.5% 2.9% 0.5% 0.5% 0.5% 0.5% 0.5% 0.5% 0.5% 5.3%CIC% 87% 87% 87% 87% 87% 87% 93% 93% 93% 93% 92% 92% 92% 92% 92% 92% 92% 92%Cummults 1.365 1.445 1.395 1.210 2.145 1.106 1.395 1.562 1.562 1.568 1.562 1.562 1.562 1.562 1.562 1.562 1.497 1.760T-1 4.801 0.130 0.134 3.232 1.826 0.000 0.609 0.089 0.048 0.110 4.891 2.196 1.569 1.072 0.312 0.133 0.028 0.405
NRCC NonRecCostCalib 0.50 1.00 1.00 1.00 1.00 1.00 1.00 1.00 1.00 1.00 3.00 3.00 3.00 3.00 1.00 1.00 1.00 1.00RCC ProdCostCalib 0.25 1.00 1.00 1.00 1.00 1.00 1.00 1.00 1.00 1.00 1.00 1.00 1.00 1.00 1.00 1.00 1.00 1.00NRC NonRecCost$m 0.627 0.007 0.037 11.331 - 0.001 0.014 0.040 0.057 0.238 2.220 0.997 0.712 0.487 0.040 0.017 0.004 0.039PRC PrototypeCost$m 1.200 0.313 0.322 5.623 3.176 0.000 0.609 0.165 0.089 0.204 30.467 13.681 9.773 6.680 1.942 0.449 0.096 1.371DC TotalDevCost$m 1.827 0.320 0.360 16.954 3.176 0.002 0.623 0.205 0.146 0.442 32.687 14.678 10.485 7.166 1.983 0.466 0.100 1.409RC ProductionCost$m 1.200 0.130 0.134 3.232 1.826 0.000 0.609 0.089 0.048 0.110 4.891 2.196 1.569 1.072 0.312 0.133 0.028 0.405TC TotalPredicted$m 3.027 0.450 0.493 20.185 5.002 0.002 1.231 0.293 0.194 0.552 37.578 16.874 12.054 8.239 2.295 0.598 0.128 1.814PAUC Prodauc$m 1.200 0.130 0.134 3.232 1.826 0.000 0.609 0.089 0.048 0.110 4.891 2.196 1.569 1.072 0.312 0.133 0.028 0.405
LaunchVehicleGlider LiquidRocket
ECFECF
TowAircraft
Alternative payload configurations Specific system components Design difficulty and inherited development

10
Cost and Revenue Estimate Major Components and Features
• Modeling of all major system components to reflect the acquisition and operations cost accurately
• Technology forecasting (methods, processes, computer aided design and manufacturing, etc.)
• Integration complexity
• Costs and reliability versus flight test program quality
• Operations model that depreciates system components, maintains, refurbishes and replaces within reasonable periods
• Organization complexity model reflecting system components and organizational layering
• Financial model reflects competitive pricing and investor returns
• Dashboard that compiles success metrics for technical and business factors, a control dashboard and system composite metrics
0
10
20
30
40
50
60
70
80
90
100
Expe
nditu
res
$ .
Program Months
Acceleration Costs
Produceability
Normal Funding
CAD,CAM,CAE,IDS (2)
IM&P - General (1) Performance (7)
Produceability (9)
Cost of Technology (8)
Design Cycle Experience (5)
Physical Characteristics (3)
Reliability & Safety (4)
ProgramStart
Criticality of Failure (6)
Design IOC
Produceability End
Organization Complexity Model
Industrial Base Capabilities Model

11
Business Case Analysis (BCA) Major Assumptions • General
• Program development is initiated in calendar year 2017 • All cost estimates in FY 2016 $m • Market assessments and financial returns include
operations to 2040 • Profit margins charged are reflective of marketplace
competitiveness • A reserve of 20% is included in provider launch and fixed
costs
• Flight Providers • New launch providers = 11 • Survival rate for new providers = 70 % • Total providers = 9 (competitive by payload class with
multiple manifesting) • Tax rate = 35%
• Flight Vehicle Operations
• No disruption due to catastrophic failures is included
FixedCost(annual)TOWACannualdepreciationGliderannualdepreciationHanger,OfficeandFacilitiesManagementandProcurementAdministrativeEngineeringEngineeringSupportMarketingandAdvertisingGroundcrewTowFlightcrewSoftwareMaintenanceFlightOpsTowACOperationsLiqRktConsumablesLiqRktRefurbperflightLiqRktReplacementsGliderMaintenanceLaunchVehiclePayloadIntegrationGrdStationTT&C&SpaceNetC-17FerriesAirportFeesLiabilityInsurance

12
Cost and Revenue Summary – Annual and Cumulative
Maximum investment Break-even
13
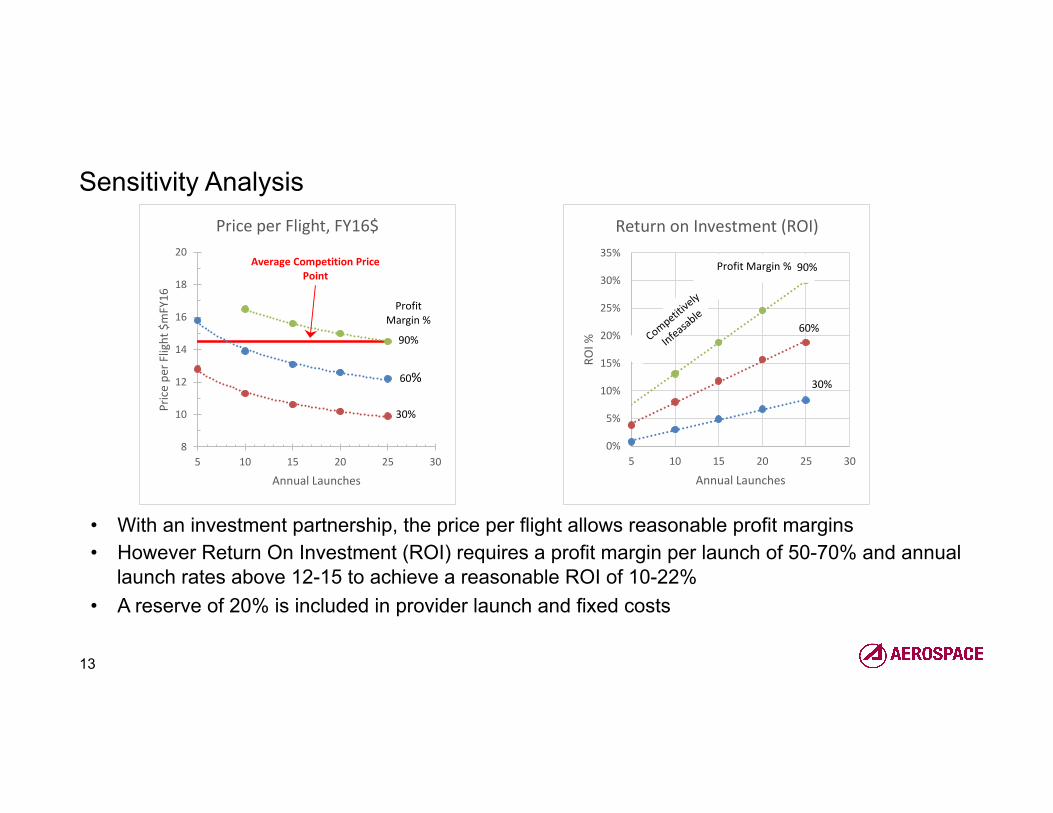
Sensitivity Analysis
0%
5%
10%
15%
20%
25%
30%
35%
5 10 15 20 25 30
ROI%
AnnualLaunches
ReturnonInvestment(ROI)
Profit Margin %
30%
90%
60%
8
10
12
14
16
18
20
5 10 15 20 25 30
Pricepe
rFlight$mFY16
AnnualLaunches
PriceperFlight,FY16$
ProfitMargin %
30%
60%
90%
AverageCompetitionPricePoint
• With an investment partnership, the price per flight allows reasonable profit margins • However Return On Investment (ROI) requires a profit margin per launch of 50-70% and annual
launch rates above 12-15 to achieve a reasonable ROI of 10-22% • A reserve of 20% is included in provider launch and fixed costs

14
Study Observations, Conclusions, and Recommendations
• Observations • Detailed modeling is important to differentiate design approaches • Multiple payload capacity capability for a single provider is difficult to characterize in the market
model due to self competing
• Market Analysis • Experienced and skilled market forecasting can miss actual launch rates by a large margin • Multiple manifesting and constellations complicate launch vehicle market forecasting • Competition price point determination is important in determining profit margin
• Results • The model is aiding in determining profitable approach, design, and heritage constraints • As usual flight rate is a large driver • Projected costs for the towed concept have the potential to be competitive • In an increasing market a reasonable ROI is possible

TGALS – Towed Glider Air Launch System NASA Space Technology Mission Directorate 2016 5/24/2016
Questions?
15

TGALS – Towed Glider Air Launch System NASA Space Technology Mission Directorate 2016
Towed Glider Technology is Scalable
Glider and Launch Vehicle Size/Weight
Pay
load
to O
rbit1
(lb m
)
Laun
ch V
ehic
le S
ize
(klb
m)
300
3750
20
85
250
~100’ Span Glider G-3 Tow Plane
~185’ Span Glider
757 Class Tow Plane
~250’ Span Glider
747 Class Tow Plane
Achievable with conventional aircraft for Tow Plane
1275
450 km polar, circular orbit1

TGALS – Towed Glider Air Launch System NASA Space Technology Mission Directorate 2016 5/24/2016
Its all about Weight Distribution…
17
Towing, on the ground, or in the air, is more efficient for moving large, heavy objects
Weight distributed across 32 tires
Simplified force vectors
Lift
Weight
Lift
Weight
Drag Drag Thrust Pull
Weight distributed across 2 airframes
Engines Fuel Hydraulics Crew Life Support Avionics
Launch Vehicle Avionics Sustainer Motor
Pull

TGALS – Towed Glider Air Launch System NASA Space Technology Mission Directorate 2016
Background: F-106 Tow Experiment (1997)
18