town of belmont...this report is intended solely for the information and use of belmont light and...
TRANSCRIPT

Name of officer to whom correspondence
should be addressed regarding this report: Christopher Roy, Manager
Official title: Manager Office address: 40 Prince Street
Belmont, MA 02478
Form AC-19
The Commonwealth of Massachusetts
2019
Town of Belmont
to the Department of Public Utilities
of Massachusetts for the Year ended December 31,
324 Grove Street Worcester MA, 01605 • 54 East Main Street Webster MA, 01570
Tel: 508.757.5957 • Fax: 1.508.422.0883 • Email: [email protected] • Web: www.gsamycpa.com The Never Underestimate The Value®
The Board of Commissioners Belmont Light Belmont, Massachusetts 02478 Management is responsible for the accompanying financial statements of Belmont Light, which comprise the balance sheet as of December 31, 2019, and the related statements of income and unappropriated retained earnings for the year then ended, included in the accompanying prescribed form in accordance with accounting principles generally accepted in the United States of America. We have performed a compilation engagement in accordance with Statements on Standards for Accounting and Review Services promulgated by the Accounting and Review Services Committee of the AICPA. We did not audit or review the financial statements included in the accompanying prescribed form nor were we required to perform any procedures to verify the accuracy or completeness of the information provided by management. Accordingly, we do not express an opinion, a conclusion, nor provide any form of assurance on these financial statements in the accompanying prescribed form. The financial statements included in the accompanying prescribed form are intended to comply with the requirements of the Massachusetts Department of Public Utilities, and are not intended to be a presentation in accordance with accounting principles generally accepted in the United States of America. This report is intended solely for the information and use of Belmont Light and the Massachusetts Department of Public Utilities, and is not intended to be and should not be used by anyone other than these specified parties. Goulet, Salvidio & Associates P.C.
Worcester, Massachusetts April 29, 2020
TABLE OF CONTENTS Page 2General Information 3
Schedule of Estimates 4
Customers in each City or Town 4
Appropriations Since Beginning of Year 5
Changes in the Property 5
Bonds 6
Town Notes 7
Cost of Plant 8- 8B
Comparative Balance Sheet 10-11
Income Statement 12
Earned Surplus 12
Cash Balances 14
Materials and Supplies 14
Depreciation Fund Account 14
Utility Plant-Electric 15-17
Production Fuel and Oil Stocks 18
Miscellaneous Nonoperating Income 21
Other Income Deductions 21
Miscellaneous Credits to Surplus 21
Miscellaneous Debits to Surplus 21
Appropriations of Surplus 21
Municipal Revenues 22
Purchased Power 22
Sales for Resale 22
Electric Operating Revenues 37
Sales of Electricity to Ultimate Consumers 38
Electric Operation and Maintenance Expenses 39-42
Taxes Charged During Year 49
Other Utility Operating Income 50
Income from Merchandising, Jobbing and Contract Work 51
Sales for Resale 52-53
Purchased Power (except Interchange) 54-55
Interchange Power 56
Electric Energy Account 57
Monthly Peaks and Output 57
Generating Station Statistics 58-59
Steam Generating Stations 60-61
Hydroelectric Generating Stations 62-63
Combustion Engine and Other Generating Stations 64-65
Generating Statistics (Small Stations) 66
Transmission Line Statistics 67
Substations 68
Overhead Distribution Lines Operated 69
Electric Distribution Services, Meters, and Line Transformers 69
Conduit, Underground Cable and Submarine Cable 70
Streetlamps 71
Rate Schedule Information 79
Signature Page 81
FOR GAS PLANTS ONLY: Page Page
Utility Plant - Gas 19-20 Gas Generating Plant 74
Gas Operating Revenues 43 Boilers 75
Sales of Gas to Ultimate Customers 44 Scrubbers, Condensers & Exhausters 75
Gas Operation & Maintenance Expenses 45-47 Purifiers 76
Purchased Gas 48 Holders 76
Sales for Resale 48 Transmission and Distribution Mains 77
Sales of Residuals 48 Gas Distribution Services, House
Record of Sendout for the Year in MCF 72-73 Governors and Meters 78
PAGES INTENTIONALLY OMITTED : 9, 13, 23 TO 36, 80

Annual Report of the Town of BELMONT
GENERAL INFORMATION Page 3
1. Name of town (or city) making report. Belmont
2. If the town (or city) has acquired a plant,
Kind of plant, whether gas or electric. Electric
Owner from whom purchased, if so acquired. Somerville Electric Light Company
Date of votes to acquire a plant in accordance with the provisions of
chapter 164 of the General Laws. March 2, 1896
Record of votes: First vote: Yes, ; No, Second vote: Yes, ; No,
Date when town (or city) began to sell gas and electricity, June 3, 1898
3. Name and address of manager of municipal lighting:
Christopher Roy 40 Prince Street Belmont, MA 02478
4. Name and address of mayor or selectmen:
Tom Caputo Town Hall 455 Concord Avenue Belmont, MA 02478
Adam Dash Town Hall 455 Concord Avenue Belmont, MA 02478
Roy Epstein Town Hall 455 Concord Avenue Belmont, MA 02478
5. Name and address of town (or city) treasurer:
Floyd Carman Town Hall Annex 19 Moore St. Belmont, MA 02478
6. Name and address of town (or city) clerk:
Ellen Cushman Town Hall 455 Concord Avenue Belmont, MA 02478
7. Names and addresses of members of municipal light board:
Tom Caputo Town Hall 455 Concord Avenue Belmont, MA 02478
Adam Dash Town Hall 455 Concord Avenue Belmont, MA 02478
Roy Epstein Town Hall 455 Concord Avenue Belmont, MA 02478
8. Total valuation of estates in town (or city) according to last State valuation
(taxable) $9,209,854,505
9. Tax rate for all purposes during the year: Residential $11.00
Open Space $11.00
Commercial/Industrial/Personal Property $11.00
10. Amount of manager's salary: $182,875
11. Amount of manager's bond: $0
12. Amount of salary paid to members of municipal light board (each): $0
Year Ended December 31, 2019
Annual Report of the Town of BELMONT Year Ended December 31, 2019 Page 4
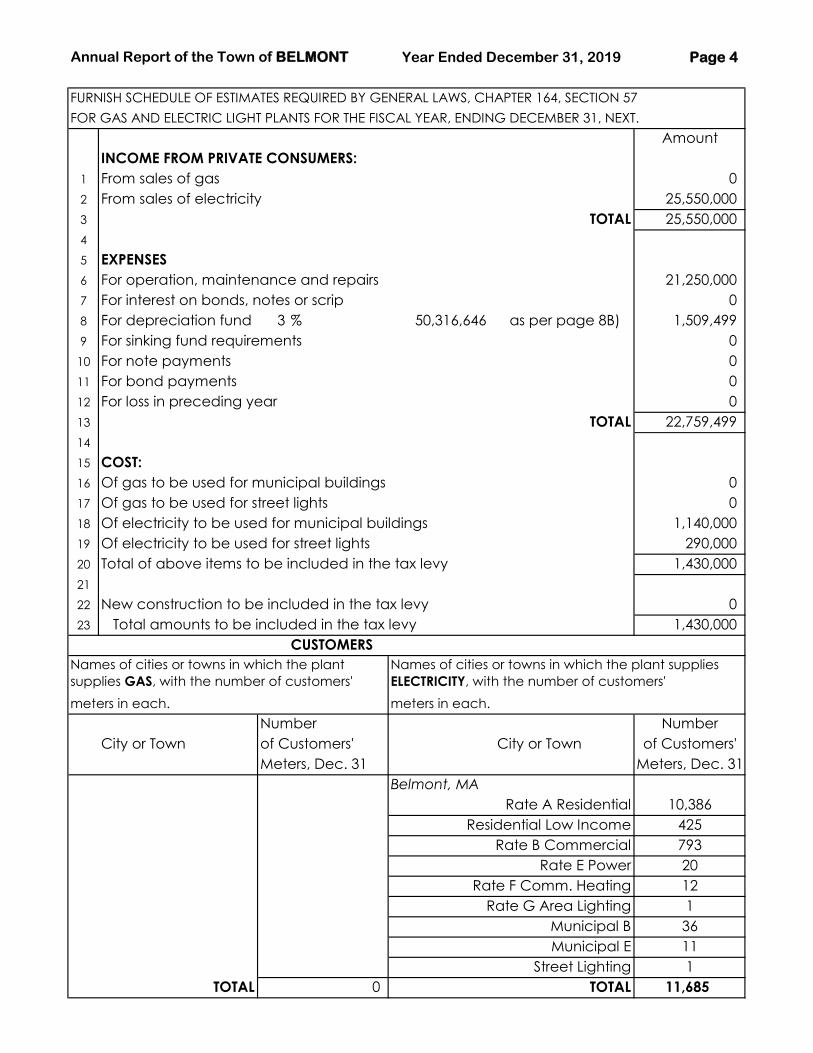
FURNISH SCHEDULE OF ESTIMATES REQUIRED BY GENERAL LAWS, CHAPTER 164, SECTION 57
FOR GAS AND ELECTRIC LIGHT PLANTS FOR THE FISCAL YEAR, ENDING DECEMBER 31, NEXT.
Amount
INCOME FROM PRIVATE CONSUMERS:
1 From sales of gas 0
2 From sales of electricity 25,550,000
3 TOTAL 25,550,000
4
5 EXPENSES
6 For operation, maintenance and repairs 21,250,000
7 For interest on bonds, notes or scrip 0
8 For depreciation fund ( 3 % 50,316,646 as per page 8B) 1,509,499
9 For sinking fund requirements 0
10 For note payments 0
11 For bond payments 0
12 For loss in preceding year 0
13 TOTAL 22,759,499
14
15 COST:
16 Of gas to be used for municipal buildings 0
17 Of gas to be used for street lights 0
18 Of electricity to be used for municipal buildings 1,140,000
19 Of electricity to be used for street lights 290,000
20 Total of above items to be included in the tax levy 1,430,000
21
22 New construction to be included in the tax levy 0
23 Total amounts to be included in the tax levy 1,430,000
CUSTOMERS
Names of cities or towns in which the plant Names of cities or towns in which the plant supplies
supplies GAS, with the number of customers' ELECTRICITY, with the number of customers'
meters in each. meters in each.
Number Number
City or Town of Customers' City or Town of Customers'
Meters, Dec. 31 Meters, Dec. 31
Rate A Residential 10,386
Residential Low Income 425
Rate B Commercial 793
Rate E Power 20
Rate F Comm. Heating 12
Rate G Area Lighting 1
Municipal B 36
Municipal E 11
Street Lighting 1
TOTAL 0 TOTAL 11,685
Belmont, MA
Annual Report of the Town of BELMONT Year Ended December 31, 2019 Page 5
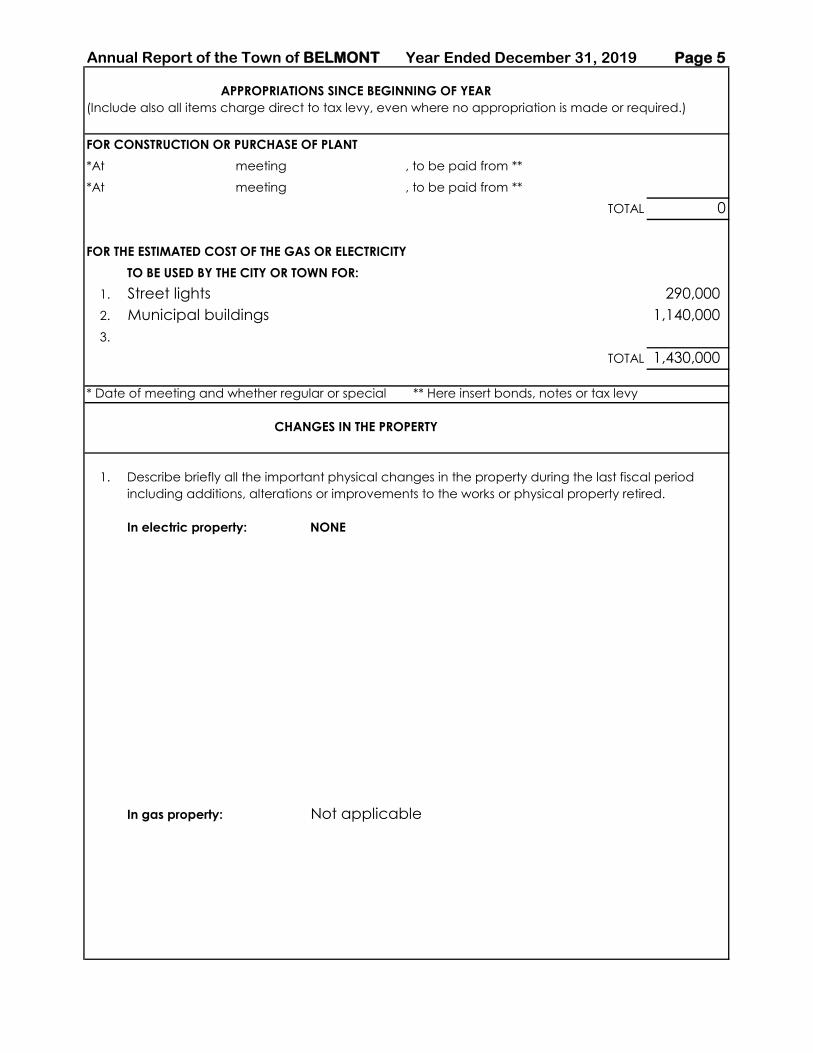
APPROPRIATIONS SINCE BEGINNING OF YEAR
(Include also all items charge direct to tax levy, even where no appropriation is made or required.)
FOR CONSTRUCTION OR PURCHASE OF PLANT
*At meeting , to be paid from **
*At meeting , to be paid from **
TOTAL 0
FOR THE ESTIMATED COST OF THE GAS OR ELECTRICITY
TO BE USED BY THE CITY OR TOWN FOR:
1. Street lights 290,000
2. Municipal buildings 1,140,000
3.
TOTAL 1,430,000
* Date of meeting and whether regular or special ** Here insert bonds, notes or tax levy
CHANGES IN THE PROPERTY
1. Describe briefly all the important physical changes in the property during the last fiscal period
including additions, alterations or improvements to the works or physical property retired.
In electric property: NONE
In gas property: Not applicable

Page 6 Annual Report of the Town of BELMONT Year Ended December 31, 2019
Bonds
(Issued on Account of Gas or Electric Lighting.)
Amount of Period of Payments Amount Outstanding
When Authorized* Date of Issue Original Issue ** Amounts When Payable Rate When Payable at End of Year
Reg. Adj. 3/9/1898 June 1, 1898 14,000$ NONE
Reg. Adj. 3/10/1898 April 1, 1913 2,500 NONE
Spec. 9/25/1913 October 1, 1915 2,500 NONE
Reg. Adj. 3/8/1915 April 1, 1915 4,000 NONE
Spec. 6/27/1916 September 1, 1916 6,000 NONE
Reg. Adj. 3/9/1925 March 1, 1925 30,000 NONE
Spec. 9/26/1939 October 1, 1939 100,000 NONE
Reg. Adj. 3/18/1940 April 14, 1940 50,000 NONE
Reg. Adj. 4/26/1999 September 9, 1999 2,000,000 200,000 9/00-9/09 4.2% to 4.6%
Every March and
Sept. NONE
Reg. TM 4/24/2006 240,000 BMLD's portion NONE
Spec.TM 2/8/2012 April 24, 2014 14,000,000 4/15/2032 2.75% to 4.00%
Semi-Annual, April
and October 11,000,000
Spec.TM 2/8/2012 April 24, 2014 12,100,000 4/15/2034 3.00% to 4.00%
Semi-Annual, April
and October 9,860,000
Spec.TM 2/8/2012 May 7, 2015 26,400,000 5/4/2016 0.7% Annual -
Spec.TM 2/8/2012 May 6, 2016 27,600,000 5/5/2017 1.07% Annual -
** Authorized but not issued
TOTAL 82,549,000$ TOTAL 20,860,000$
The bonds and notes outstanding at end of year should agree with the Balance Sheet.
When bond and notes are repaid report the first three columns only
* Date of meeting and whether regular or special
** List original issues of bonds and notes including those that have been repaid
Interest
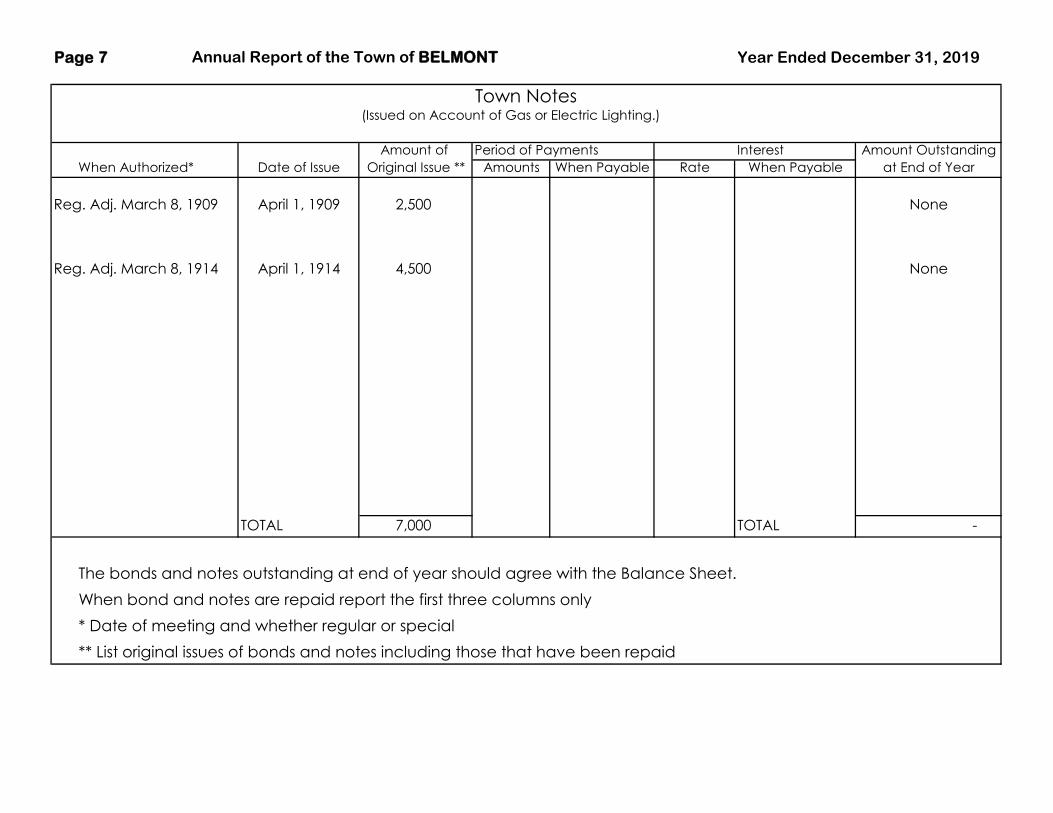
Page 7 Annual Report of the Town of BELMONT Year Ended December 31, 2019
Town Notes(Issued on Account of Gas or Electric Lighting.)
Amount of Period of Payments Interest Amount Outstanding
When Authorized* Date of Issue Original Issue ** Amounts When Payable Rate When Payable at End of Year
Reg. Adj. March 8, 1909 April 1, 1909 2,500 None
Reg. Adj. March 8, 1914 April 1, 1914 4,500 None
TOTAL 7,000 TOTAL -
The bonds and notes outstanding at end of year should agree with the Balance Sheet.
When bond and notes are repaid report the first three columns only
* Date of meeting and whether regular or special
** List original issues of bonds and notes including those that have been repaid

Page 8 Annual Report of the Town of BELMONT Year Ended December 31, 2019
1. Report below the cost of utility plant in service preceding year. Such items should be included effect of such amounts.
according to prescribed accounts in column (c) or (d) as appropriate. 4. Reclassifications or transfers within utility
2. Do not include as adjustments, corrections of 3 . Credit adjustments of plant accounts should be plant accounts should be shown in column (f).
additions and retirements for the current or the enclosed in parentheses to indicate the negative
Balance Balance
Line Account Beginning of Year Additions Retirements Adjustments Transfers End of Year
No. (a) (b) (c) (d) (e) (f) (g)
1 1. INTANGIBLE PLANT
2
3
4 0 0 0 0 0 0
5 2. PRODUCTION PLANT
6 A. Steam Production NONE
7 310 Land and Land Rights
8 311 Structures and Improvements
9 312 Boiler Plant Equipment
10 313 Engines and Engine Driven Generators
11 314 Turbogenerator Units
12 315 Accessory Electric Equipment
13 316 Miscellaneous Power Plant Equipment
15 Total Steam Production Plant 0 0 0 0 0 0
16 B. Nuclear Production Plant
17 320 Land and Land Rights
18 321 Structures and Improvements
19 322 Reactor Plant Equipment
20 323 Turbogenerator Units
21 324 Accessory Electric Equipment
22 325 Miscellaneous Power Plant Equipment
Total Nuclear Production Plant 0 0 0 0 0 0
TOTAL COST OF PLANT - ELECTRIC
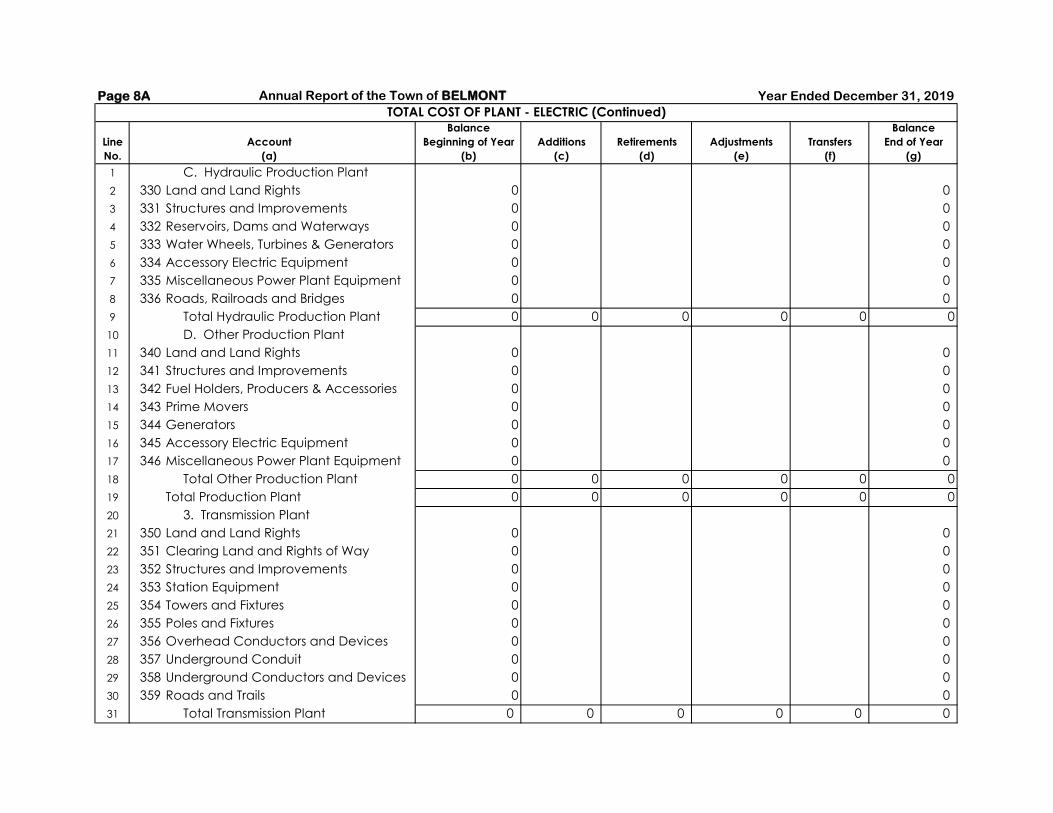
Page 8A Annual Report of the Town of BELMONT Year Ended December 31, 2019
Balance Balance
Line Account Beginning of Year Additions Retirements Adjustments Transfers End of Year
No. (a) (b) (c) (d) (e) (f) (g)
1 C. Hydraulic Production Plant
2 330 Land and Land Rights 0 0
3 331 Structures and Improvements 0 0
4 332 Reservoirs, Dams and Waterways 0 0
5 333 Water Wheels, Turbines & Generators 0 0
6 334 Accessory Electric Equipment 0 0
7 335 Miscellaneous Power Plant Equipment 0 0
8 336 Roads, Railroads and Bridges 0 0
9 Total Hydraulic Production Plant 0 0 0 0 0 0
10 D. Other Production Plant
11 340 Land and Land Rights 0 0
12 341 Structures and Improvements 0 0
13 342 Fuel Holders, Producers & Accessories 0 0
14 343 Prime Movers 0 0
15 344 Generators 0 0
16 345 Accessory Electric Equipment 0 0
17 346 Miscellaneous Power Plant Equipment 0 0
18 Total Other Production Plant 0 0 0 0 0 0
19 Total Production Plant 0 0 0 0 0 0
20 3. Transmission Plant
21 350 Land and Land Rights 0 0
22 351 Clearing Land and Rights of Way 0 0
23 352 Structures and Improvements 0 0
24 353 Station Equipment 0 0
25 354 Towers and Fixtures 0 0
26 355 Poles and Fixtures 0 0
27 356 Overhead Conductors and Devices 0 0
28 357 Underground Conduit 0 0
29 358 Underground Conductors and Devices 0 0
30 359 Roads and Trails 0 0
31 Total Transmission Plant 0 0 0 0 0 0
TOTAL COST OF PLANT - ELECTRIC (Continued)
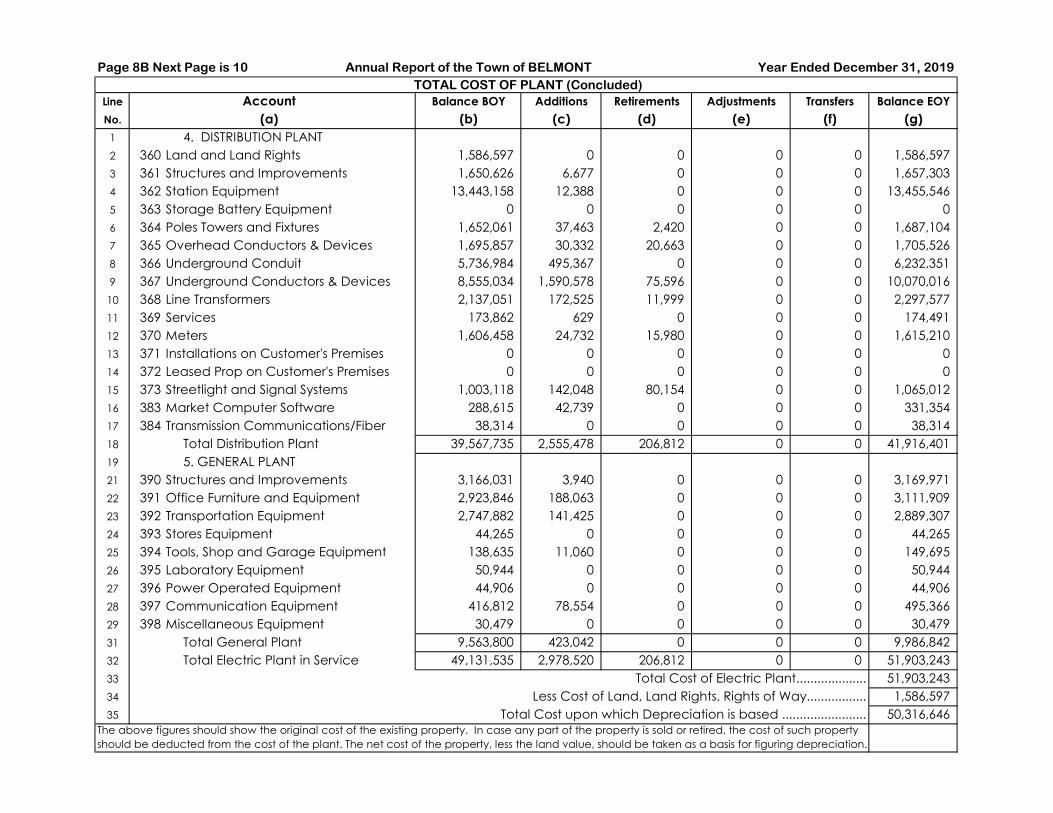
Page 8B Next Page is 10 Annual Report of the Town of BELMONT Year Ended December 31, 2019
Line Account Balance BOY Additions Retirements Adjustments Transfers Balance EOY
No. (a) (b) (c) (d) (e) (f) (g)
1 4. DISTRIBUTION PLANT
2 360 Land and Land Rights 1,586,597 0 0 0 0 1,586,597
3 361 Structures and Improvements 1,650,626 6,677 0 0 0 1,657,303
4 362 Station Equipment 13,443,158 12,388 0 0 0 13,455,546
5 363 Storage Battery Equipment 0 0 0 0 0 0
6 364 Poles Towers and Fixtures 1,652,061 37,463 2,420 0 0 1,687,104
7 365 Overhead Conductors & Devices 1,695,857 30,332 20,663 0 0 1,705,526
8 366 Underground Conduit 5,736,984 495,367 0 0 0 6,232,351
9 367 Underground Conductors & Devices 8,555,034 1,590,578 75,596 0 0 10,070,016
10 368 Line Transformers 2,137,051 172,525 11,999 0 0 2,297,577
11 369 Services 173,862 629 0 0 0 174,491
12 370 Meters 1,606,458 24,732 15,980 0 0 1,615,210
13 371 Installations on Customer's Premises 0 0 0 0 0 0
14 372 Leased Prop on Customer's Premises 0 0 0 0 0 0
15 373 Streetlight and Signal Systems 1,003,118 142,048 80,154 0 0 1,065,012
16 383 Market Computer Software 288,615 42,739 0 0 0 331,354
17 384 Transmission Communications/Fiber 38,314 0 0 0 0 38,314
18 Total Distribution Plant 39,567,735 2,555,478 206,812 0 0 41,916,401
19 5. GENERAL PLANT
21 390 Structures and Improvements 3,166,031 3,940 0 0 0 3,169,971
22 391 Office Furniture and Equipment 2,923,846 188,063 0 0 0 3,111,909
23 392 Transportation Equipment 2,747,882 141,425 0 0 0 2,889,307
24 393 Stores Equipment 44,265 0 0 0 0 44,265
25 394 Tools, Shop and Garage Equipment 138,635 11,060 0 0 0 149,695
26 395 Laboratory Equipment 50,944 0 0 0 0 50,944
27 396 Power Operated Equipment 44,906 0 0 0 0 44,906
28 397 Communication Equipment 416,812 78,554 0 0 0 495,366
29 398 Miscellaneous Equipment 30,479 0 0 0 0 30,479
31 Total General Plant 9,563,800 423,042 0 0 0 9,986,842
32 Total Electric Plant in Service 49,131,535 2,978,520 206,812 0 0 51,903,243
33 Total Cost of Electric Plant.................... 51,903,243
34 Less Cost of Land, Land Rights, Rights of Way................. 1,586,597
35 Total Cost upon which Depreciation is based ........................ 50,316,646The above figures should show the original cost of the existing property. In case any part of the property is sold or retired, the cost of such property
should be deducted from the cost of the plant. The net cost of the property, less the land value, should be taken as a basis for figuring depreciation.
TOTAL COST OF PLANT (Concluded)

Page 9 Annual Report of the Town of BELMONT Year Ended December 31, 2019
PAGE 9 IS A BLANK PAGE. NEXT PAGE IS 10.
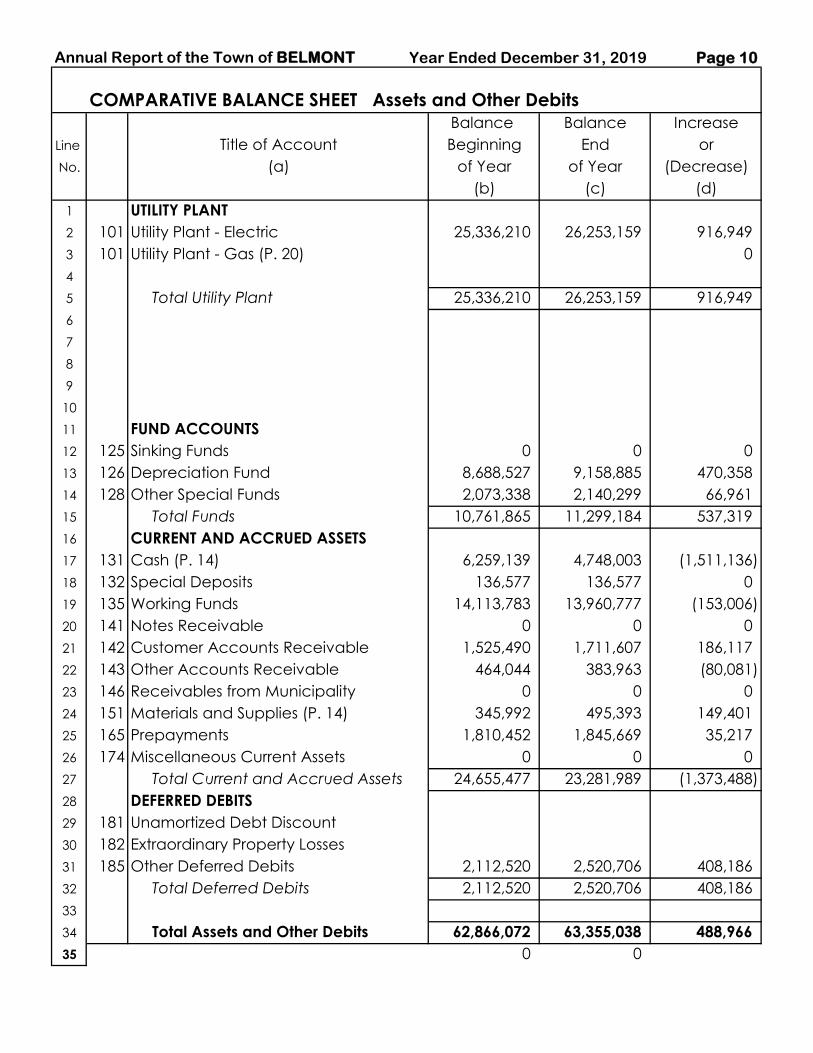
Annual Report of the Town of BELMONT Year Ended December 31, 2019 Page 10
COMPARATIVE BALANCE SHEET Assets and Other Debits
Balance Balance Increase
Line Title of Account Beginning End or
No. (a) of Year of Year (Decrease)
(b) (c) (d)
1 UTILITY PLANT
2 101 Utility Plant - Electric 25,336,210 26,253,159 916,949
3 101 Utility Plant - Gas (P. 20) 0
4
5 Total Utility Plant 25,336,210 26,253,159 916,949
6
7
8
9
10
11 FUND ACCOUNTS
12 125 Sinking Funds 0 0 0
13 126 Depreciation Fund 8,688,527 9,158,885 470,358
14 128 Other Special Funds 2,073,338 2,140,299 66,961
15 Total Funds 10,761,865 11,299,184 537,319
16 CURRENT AND ACCRUED ASSETS
17 131 Cash (P. 14) 6,259,139 4,748,003 (1,511,136)
18 132 Special Deposits 136,577 136,577 0
19 135 Working Funds 14,113,783 13,960,777 (153,006)
20 141 Notes Receivable 0 0 0
21 142 Customer Accounts Receivable 1,525,490 1,711,607 186,117
22 143 Other Accounts Receivable 464,044 383,963 (80,081)
23 146 Receivables from Municipality 0 0 0
24 151 Materials and Supplies (P. 14) 345,992 495,393 149,401
25 165 Prepayments 1,810,452 1,845,669 35,217
26 174 Miscellaneous Current Assets 0 0 0
27 Total Current and Accrued Assets 24,655,477 23,281,989 (1,373,488)
28 DEFERRED DEBITS
29 181 Unamortized Debt Discount
30 182 Extraordinary Property Losses
31 185 Other Deferred Debits 2,112,520 2,520,706 408,186
32 Total Deferred Debits 2,112,520 2,520,706 408,186
33
34 Total Assets and Other Debits 62,866,072 63,355,038 488,966
35 0 0
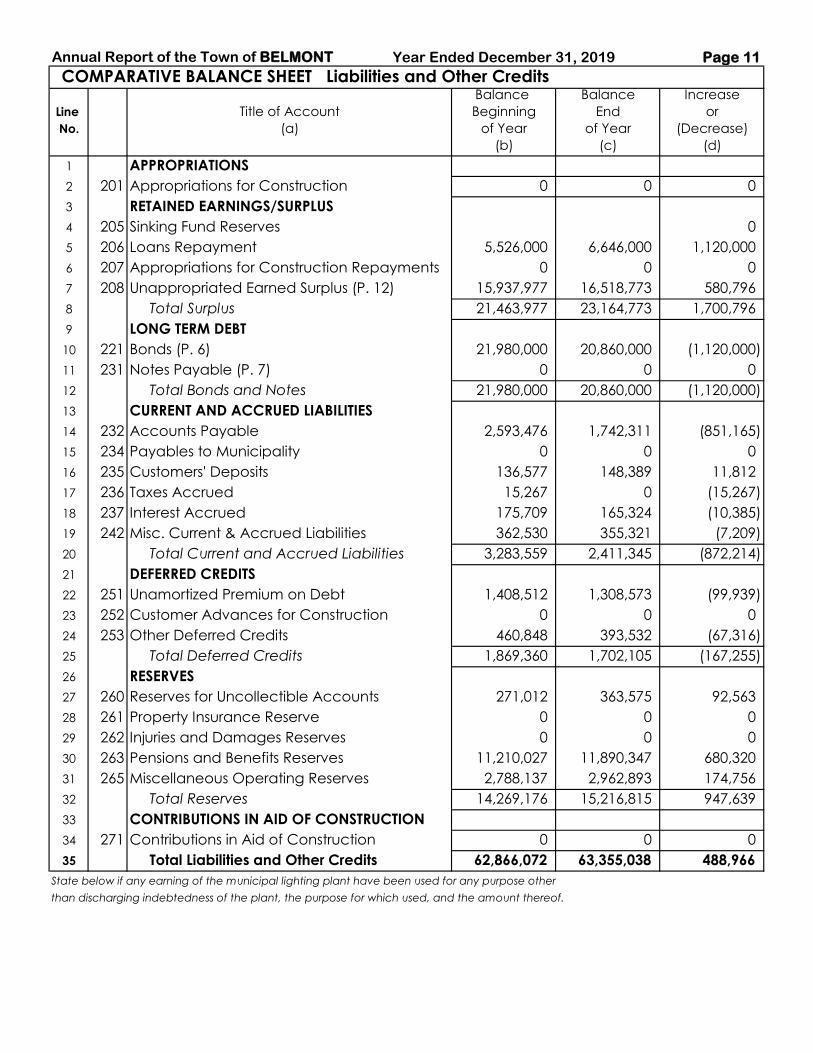
Annual Report of the Town of BELMONT Year Ended December 31, 2019 Page 11
COMPARATIVE BALANCE SHEET Liabilities and Other CreditsBalance Balance Increase
Line Title of Account Beginning End or
No. (a) of Year of Year (Decrease)
(b) (c) (d)
1 APPROPRIATIONS
2 201 Appropriations for Construction 0 0 0
3 RETAINED EARNINGS/SURPLUS
4 205 Sinking Fund Reserves 0
5 206 Loans Repayment 5,526,000 6,646,000 1,120,000
6 207 Appropriations for Construction Repayments 0 0 0
7 208 Unappropriated Earned Surplus (P. 12) 15,937,977 16,518,773 580,796
8 Total Surplus 21,463,977 23,164,773 1,700,796
9 LONG TERM DEBT
10 221 Bonds (P. 6) 21,980,000 20,860,000 (1,120,000)
11 231 Notes Payable (P. 7) 0 0 0
12 Total Bonds and Notes 21,980,000 20,860,000 (1,120,000)
13 CURRENT AND ACCRUED LIABILITIES
14 232 Accounts Payable 2,593,476 1,742,311 (851,165)
15 234 Payables to Municipality 0 0 0
16 235 Customers' Deposits 136,577 148,389 11,812
17 236 Taxes Accrued 15,267 0 (15,267)
18 237 Interest Accrued 175,709 165,324 (10,385)
19 242 Misc. Current & Accrued Liabilities 362,530 355,321 (7,209)
20 Total Current and Accrued Liabilities 3,283,559 2,411,345 (872,214)
21 DEFERRED CREDITS
22 251 Unamortized Premium on Debt 1,408,512 1,308,573 (99,939)
23 252 Customer Advances for Construction 0 0 0
24 253 Other Deferred Credits 460,848 393,532 (67,316)
25 Total Deferred Credits 1,869,360 1,702,105 (167,255)
26 RESERVES
27 260 Reserves for Uncollectible Accounts 271,012 363,575 92,563
28 261 Property Insurance Reserve 0 0 0
29 262 Injuries and Damages Reserves 0 0 0
30 263 Pensions and Benefits Reserves 11,210,027 11,890,347 680,320
31 265 Miscellaneous Operating Reserves 2,788,137 2,962,893 174,756
32 Total Reserves 14,269,176 15,216,815 947,639
33 CONTRIBUTIONS IN AID OF CONSTRUCTION
34 271 Contributions in Aid of Construction 0 0 0
35 Total Liabilities and Other Credits 62,866,072 63,355,038 488,966
State below if any earning of the municipal lighting plant have been used for any purpose other
than discharging indebtedness of the plant, the purpose for which used, and the amount thereof.
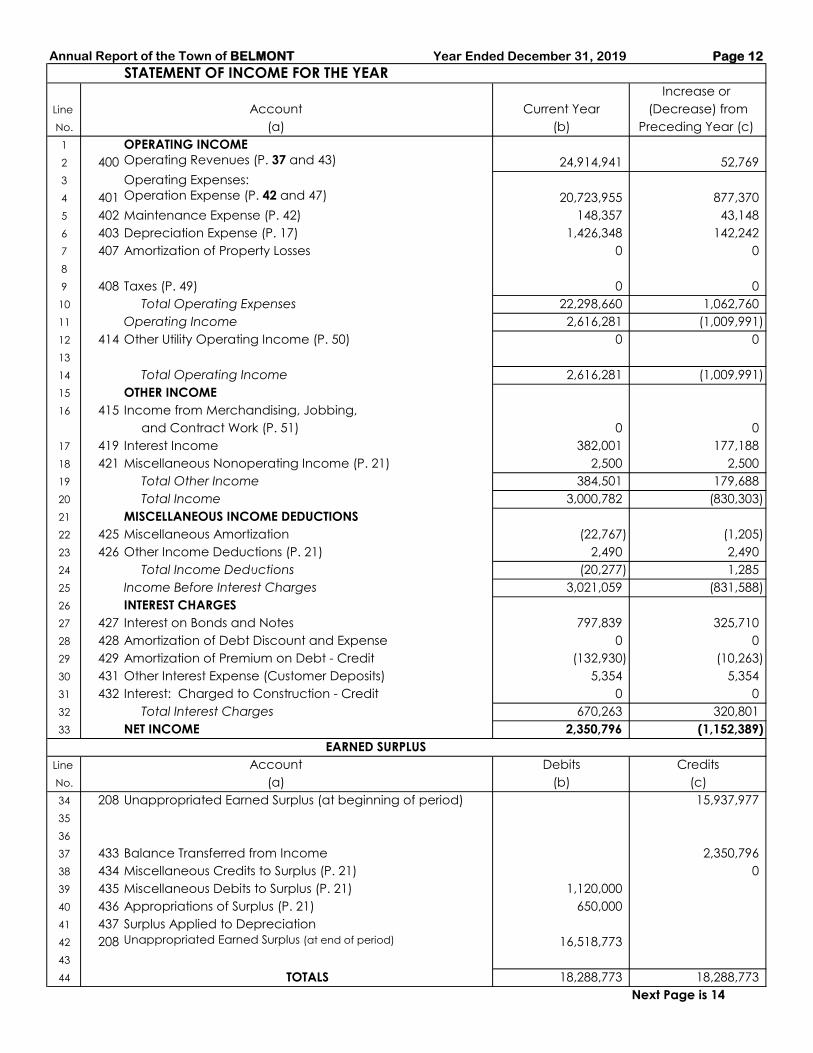
Annual Report of the Town of BELMONT Year Ended December 31, 2019 Page 12
STATEMENT OF INCOME FOR THE YEAR
Increase or
Line Account Current Year (Decrease) from
No. (a) (b) Preceding Year (c)
1 OPERATING INCOME
2 400 Operating Revenues (P. 37 and 43) 24,914,941 52,769
3 Operating Expenses:
4 401 Operation Expense (P. 42 and 47) 20,723,955 877,370
5 402 Maintenance Expense (P. 42) 148,357 43,148
6 403 Depreciation Expense (P. 17) 1,426,348 142,242
7 407 Amortization of Property Losses 0 0
8
9 408 Taxes (P. 49) 0 0
10 Total Operating Expenses 22,298,660 1,062,760
11 Operating Income 2,616,281 (1,009,991)
12 414 Other Utility Operating Income (P. 50) 0 0
13
14 Total Operating Income 2,616,281 (1,009,991)
15 OTHER INCOME
16 415 Income from Merchandising, Jobbing,
and Contract Work (P. 51) 0 0
17 419 Interest Income 382,001 177,188
18 421 Miscellaneous Nonoperating Income (P. 21) 2,500 2,500
19 Total Other Income 384,501 179,688
20 Total Income 3,000,782 (830,303)
21 MISCELLANEOUS INCOME DEDUCTIONS
22 425 Miscellaneous Amortization (22,767) (1,205)
23 426 Other Income Deductions (P. 21) 2,490 2,490
24 Total Income Deductions (20,277) 1,285
25 Income Before Interest Charges 3,021,059 (831,588)
26 INTEREST CHARGES
27 427 Interest on Bonds and Notes 797,839 325,710
28 428 Amortization of Debt Discount and Expense 0 0
29 429 Amortization of Premium on Debt - Credit (132,930) (10,263)
30 431 Other Interest Expense (Customer Deposits) 5,354 5,354
31 432 Interest: Charged to Construction - Credit 0 0
32 Total Interest Charges 670,263 320,801
33 NET INCOME 2,350,796 (1,152,389)
EARNED SURPLUS
Line Account Debits Credits
No. (a) (b) (c)
34 208 Unappropriated Earned Surplus (at beginning of period) 15,937,977
35
36
37 433 Balance Transferred from Income 2,350,796
38 434 Miscellaneous Credits to Surplus (P. 21) 0
39 435 Miscellaneous Debits to Surplus (P. 21) 1,120,000
40 436 Appropriations of Surplus (P. 21) 650,000
41 437 Surplus Applied to Depreciation
42 208 Unappropriated Earned Surplus (at end of period) 16,518,773
43
44 TOTALS 18,288,773 18,288,773
Next Page is 14
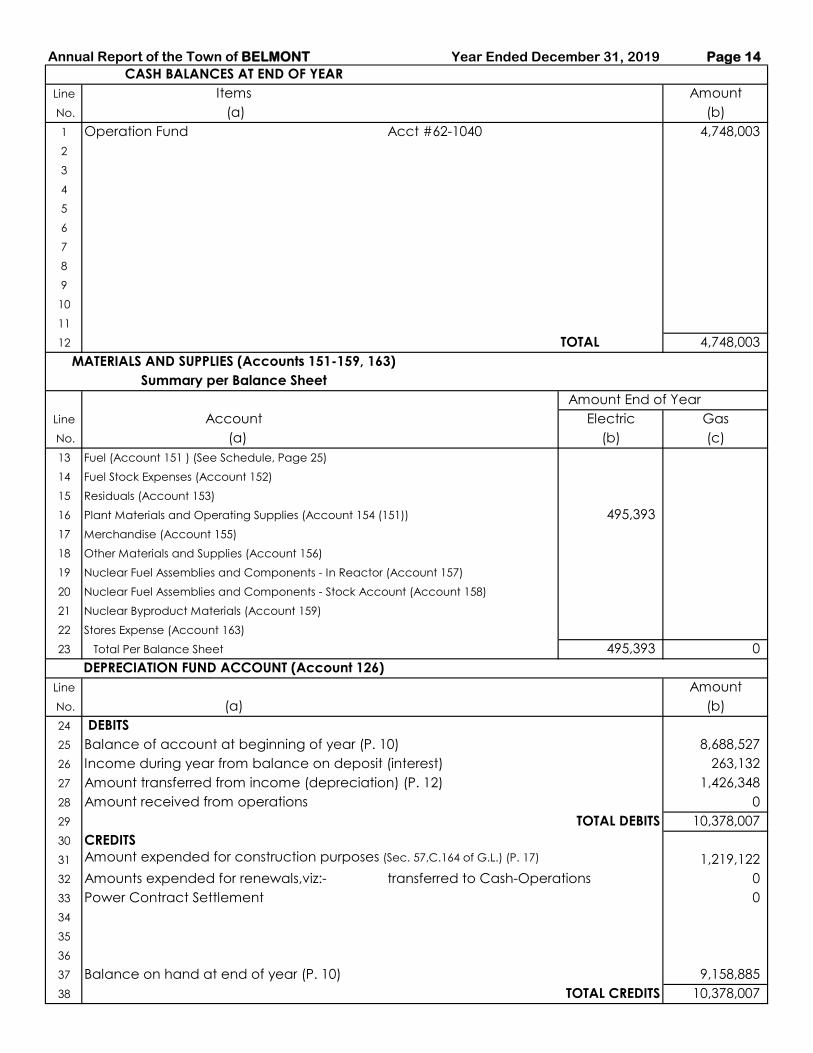
Annual Report of the Town of BELMONT Year Ended December 31, 2019 Page 14
CASH BALANCES AT END OF YEAR
Line Items Amount
No. (a) (b)
1 Operation Fund Acct #62-1040 4,748,003
2
3
4
5
6
7
8
9
10
11
12 TOTAL 4,748,003
MATERIALS AND SUPPLIES (Accounts 151-159, 163)
Summary per Balance Sheet
Amount End of Year
Line Account Electric Gas
No. (a) (b) (c)
13 Fuel (Account 151 ) (See Schedule, Page 25)
14 Fuel Stock Expenses (Account 152)
15 Residuals (Account 153)
16 Plant Materials and Operating Supplies (Account 154 (151)) 495,393
17 Merchandise (Account 155)
18 Other Materials and Supplies (Account 156)
19 Nuclear Fuel Assemblies and Components - In Reactor (Account 157)
20 Nuclear Fuel Assemblies and Components - Stock Account (Account 158)
21 Nuclear Byproduct Materials (Account 159)
22 Stores Expense (Account 163)
23 Total Per Balance Sheet 495,393 0
DEPRECIATION FUND ACCOUNT (Account 126)
Line Amount
No. (a) (b)
24 DEBITS
25 Balance of account at beginning of year (P. 10) 8,688,527
26 Income during year from balance on deposit (interest) 263,132
27 Amount transferred from income (depreciation) (P. 12) 1,426,348
28 Amount received from operations 0
29 TOTAL DEBITS 10,378,007
30 CREDITS
31 Amount expended for construction purposes (Sec. 57,C.164 of G.L.) (P. 17) 1,219,122
32 Amounts expended for renewals,viz:- transferred to Cash-Operations 0
33 Power Contract Settlement 0
34
35
36
37 Balance on hand at end of year (P. 10) 9,158,885
38 TOTAL CREDITS 10,378,007
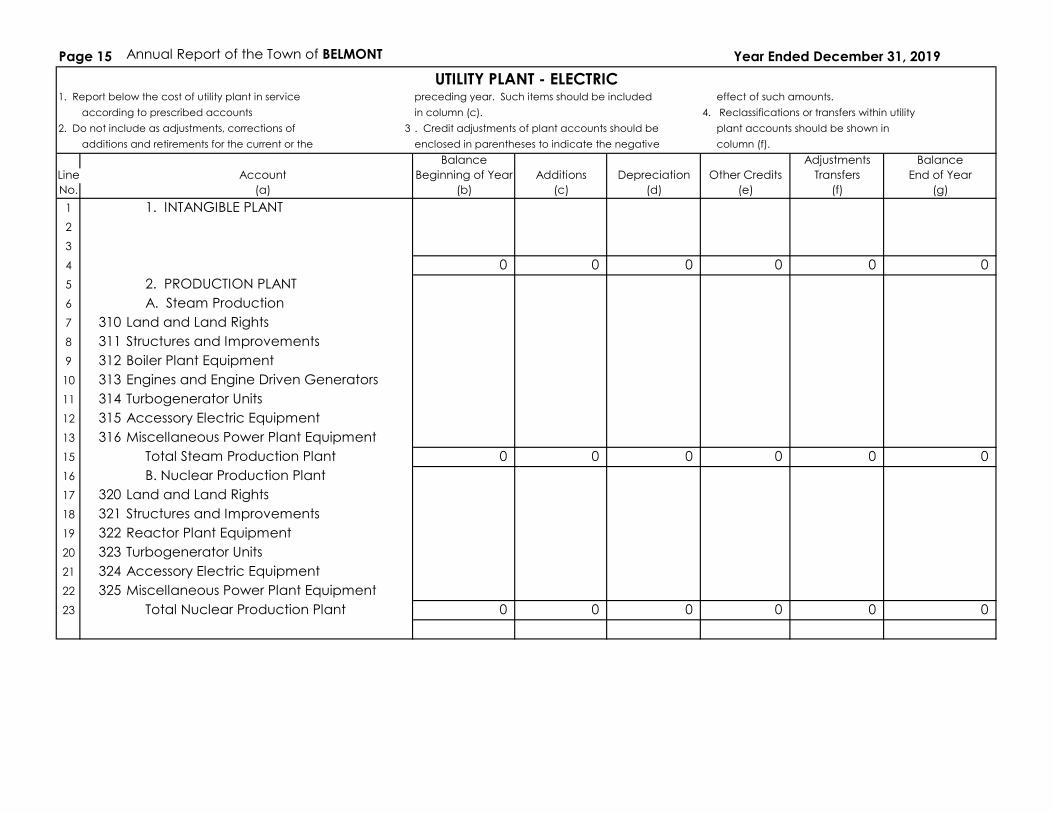
Page 15 Annual Report of the Town of BELMONT Year Ended December 31, 2019
1. Report below the cost of utility plant in service preceding year. Such items should be included effect of such amounts.
according to prescribed accounts in column (c). 4. Reclassifications or transfers within utility
2. Do not include as adjustments, corrections of 3 . Credit adjustments of plant accounts should be plant accounts should be shown in
additions and retirements for the current or the enclosed in parentheses to indicate the negative column (f).
Balance Adjustments Balance
Line Account Beginning of Year Additions Depreciation Other Credits Transfers End of Year
No. (a) (b) (c) (d) (e) (f) (g)
1 1. INTANGIBLE PLANT
2
3
4 0 0 0 0 0 0
5 2. PRODUCTION PLANT
6 A. Steam Production
7 310 Land and Land Rights
8 311 Structures and Improvements
9 312 Boiler Plant Equipment
10 313 Engines and Engine Driven Generators
11 314 Turbogenerator Units
12 315 Accessory Electric Equipment
13 316 Miscellaneous Power Plant Equipment
15 Total Steam Production Plant 0 0 0 0 0 0
16 B. Nuclear Production Plant
17 320 Land and Land Rights
18 321 Structures and Improvements
19 322 Reactor Plant Equipment
20 323 Turbogenerator Units
21 324 Accessory Electric Equipment
22 325 Miscellaneous Power Plant Equipment
23 Total Nuclear Production Plant 0 0 0 0 0 0
UTILITY PLANT - ELECTRIC
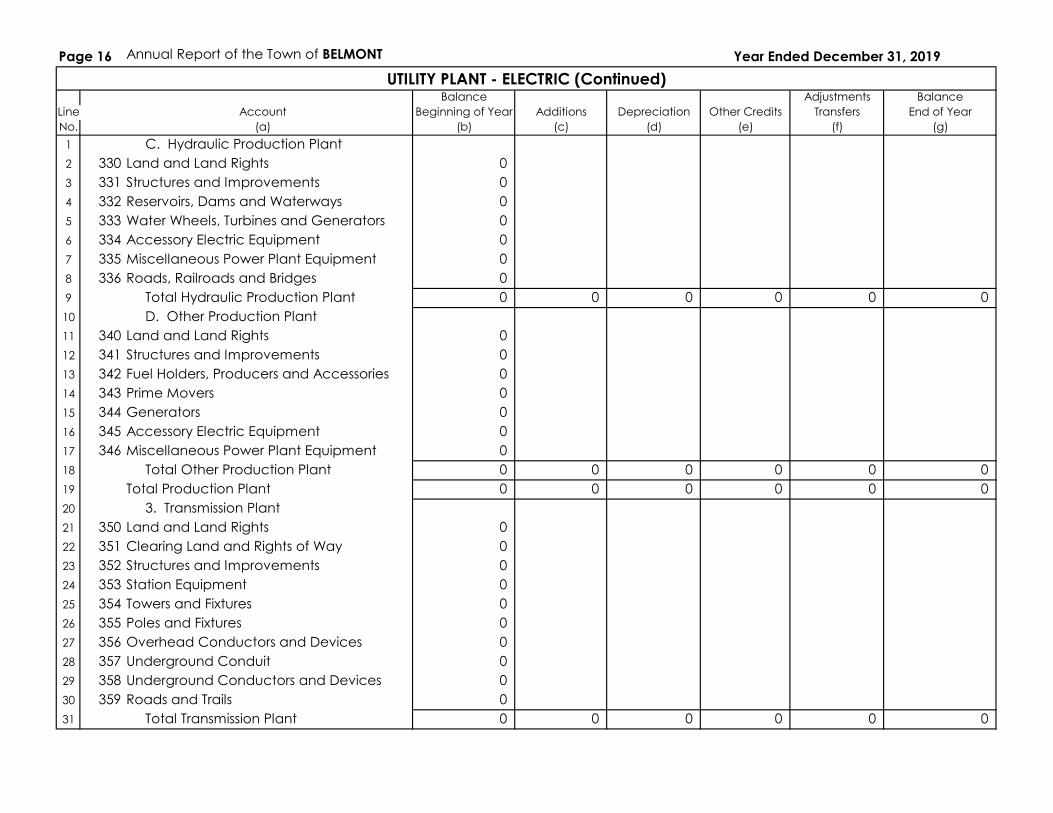
Page 16 Annual Report of the Town of BELMONT Year Ended December 31, 2019
Balance Adjustments Balance
Line Account Beginning of Year Additions Depreciation Other Credits Transfers End of Year
No. (a) (b) (c) (d) (e) (f) (g)
1 C. Hydraulic Production Plant
2 330 Land and Land Rights 0
3 331 Structures and Improvements 0
4 332 Reservoirs, Dams and Waterways 0
5 333 Water Wheels, Turbines and Generators 0
6 334 Accessory Electric Equipment 0
7 335 Miscellaneous Power Plant Equipment 0
8 336 Roads, Railroads and Bridges 0
9 Total Hydraulic Production Plant 0 0 0 0 0 0
10 D. Other Production Plant
11 340 Land and Land Rights 0
12 341 Structures and Improvements 0
13 342 Fuel Holders, Producers and Accessories 0
14 343 Prime Movers 0
15 344 Generators 0
16 345 Accessory Electric Equipment 0
17 346 Miscellaneous Power Plant Equipment 0
18 Total Other Production Plant 0 0 0 0 0 0
19 Total Production Plant 0 0 0 0 0 0
20 3. Transmission Plant
21 350 Land and Land Rights 0
22 351 Clearing Land and Rights of Way 0
23 352 Structures and Improvements 0
24 353 Station Equipment 0
25 354 Towers and Fixtures 0
26 355 Poles and Fixtures 0
27 356 Overhead Conductors and Devices 0
28 357 Underground Conduit 0
29 358 Underground Conductors and Devices 0
30 359 Roads and Trails 0
31 Total Transmission Plant 0 0 0 0 0 0
UTILITY PLANT - ELECTRIC (Continued)
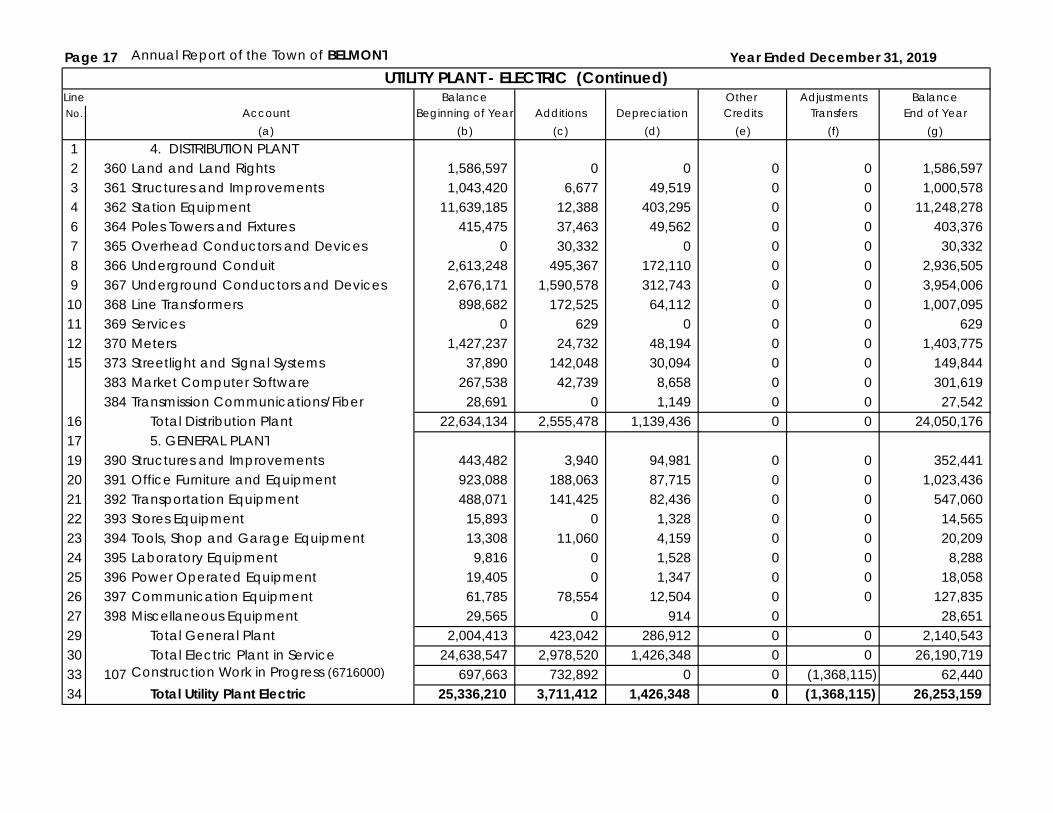
Page 17 Annual Report of the Town of BELMONT Year Ended December 31, 2019
Line Balance Other Adjustments BalanceNo. Account Beginning of Year Additions Depreciation Credits Transfers End of Year
(a) (b) (c) (d) (e) (f) (g)1 4. DISTRIBUTION PLANT2 360 Land and Land Rights 1,586,597 0 0 0 0 1,586,5973 361 Structures and Improvements 1,043,420 6,677 49,519 0 0 1,000,5784 362 Station Equipment 11,639,185 12,388 403,295 0 0 11,248,2786 364 Poles Towers and Fixtures 415,475 37,463 49,562 0 0 403,3767 365 Overhead Conductors and Devices 0 30,332 0 0 0 30,3328 366 Underground Conduit 2,613,248 495,367 172,110 0 0 2,936,5059 367 Underground Conductors and Devices 2,676,171 1,590,578 312,743 0 0 3,954,00610 368 Line Transformers 898,682 172,525 64,112 0 0 1,007,09511 369 Services 0 629 0 0 0 62912 370 Meters 1,427,237 24,732 48,194 0 0 1,403,77515 373 Streetlight and Signal Systems 37,890 142,048 30,094 0 0 149,844
383 Market Computer Software 267,538 42,739 8,658 0 0 301,619384 Transmission Communications/Fiber 28,691 0 1,149 0 0 27,542
16 Total Distribution Plant 22,634,134 2,555,478 1,139,436 0 0 24,050,17617 5. GENERAL PLANT19 390 Structures and Improvements 443,482 3,940 94,981 0 0 352,44120 391 Office Furniture and Equipment 923,088 188,063 87,715 0 0 1,023,43621 392 Transportation Equipment 488,071 141,425 82,436 0 0 547,06022 393 Stores Equipment 15,893 0 1,328 0 0 14,56523 394 Tools, Shop and Garage Equipment 13,308 11,060 4,159 0 0 20,20924 395 Laboratory Equipment 9,816 0 1,528 0 0 8,28825 396 Power Operated Equipment 19,405 0 1,347 0 0 18,05826 397 Communication Equipment 61,785 78,554 12,504 0 0 127,83527 398 Miscellaneous Equipment 29,565 0 914 0 28,65129 Total General Plant 2,004,413 423,042 286,912 0 0 2,140,54330 Total Electric Plant in Service 24,638,547 2,978,520 1,426,348 0 0 26,190,71933 107 Construction Work in Progress (6716000) 697,663 732,892 0 0 (1,368,115) 62,44034 Total Utility Plant Electric 25,336,210 3,711,412 1,426,348 0 (1,368,115) 26,253,159
UTILITY PLANT - ELECTRIC (Continued)
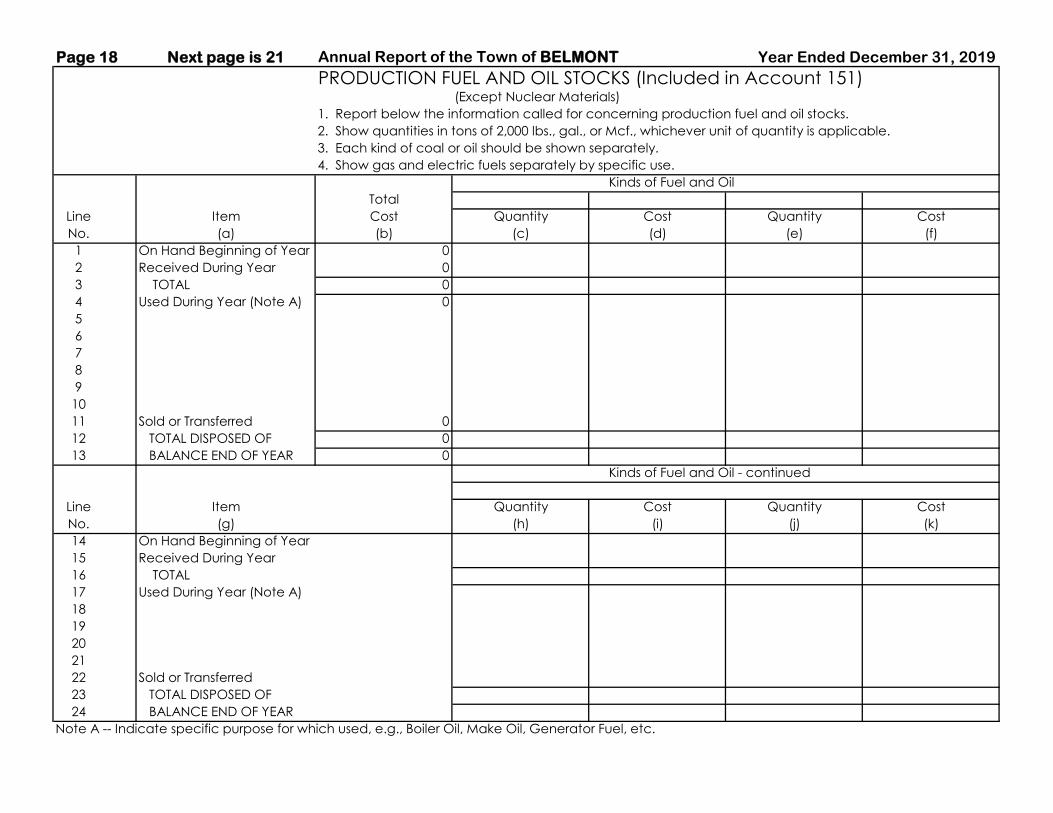
Page 18 Next page is 21 Annual Report of the Town of BELMONT Year Ended December 31, 2019
PRODUCTION FUEL AND OIL STOCKS (Included in Account 151)(Except Nuclear Materials)
1. Report below the information called for concerning production fuel and oil stocks.
2. Show quantities in tons of 2,000 lbs., gal., or Mcf., whichever unit of quantity is applicable.
3. Each kind of coal or oil should be shown separately.
4. Show gas and electric fuels separately by specific use.
Kinds of Fuel and Oil
Total
Line Item Cost Quantity Cost Quantity Cost
No. (a) (b) (c) (d) (e) (f)
1 On Hand Beginning of Year 0
2 Received During Year 0
3 TOTAL 0
4 Used During Year (Note A) 0
5
6
7
8
9
10
11 Sold or Transferred 0
12 TOTAL DISPOSED OF 0
13 BALANCE END OF YEAR 0
Kinds of Fuel and Oil - continued
Line Item Quantity Cost Quantity Cost
No. (g) (h) (i) (j) (k)
14 On Hand Beginning of Year
15 Received During Year
16 TOTAL
17 Used During Year (Note A)
18
19
20
21
22 Sold or Transferred
23 TOTAL DISPOSED OF
24 BALANCE END OF YEAR
Note A -- Indicate specific purpose for which used, e.g., Boiler Oil, Make Oil, Generator Fuel, etc.
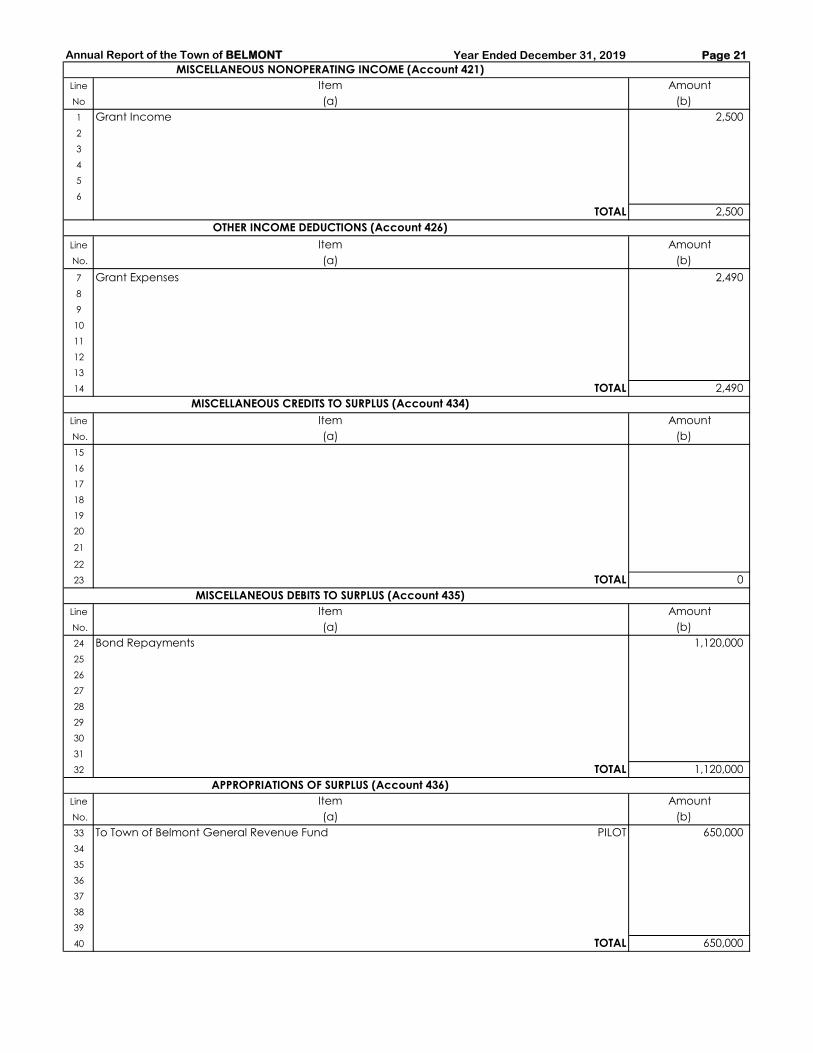
Annual Report of the Town of BELMONT Year Ended December 31, 2019 Page 21
MISCELLANEOUS NONOPERATING INCOME (Account 421)
Line Item Amount
No (a) (b)
1 Grant Income 2,500
2
3
4
5
6
TOTAL 2,500
OTHER INCOME DEDUCTIONS (Account 426)
Line Item Amount
No. (a) (b)
7 Grant Expenses 2,490
8
9
10
11
12
13
14 TOTAL 2,490
MISCELLANEOUS CREDITS TO SURPLUS (Account 434)
Line Item Amount
No. (a) (b)
15
16
17
18
19
20
21
22
23 TOTAL 0
MISCELLANEOUS DEBITS TO SURPLUS (Account 435)
Line Item Amount
No. (a) (b)
24 Bond Repayments 1,120,000
25
26
27
28
29
30
31
32 TOTAL 1,120,000
APPROPRIATIONS OF SURPLUS (Account 436)
Line Item Amount
No. (a) (b)
33 To Town of Belmont General Revenue Fund PILOT 650,000
34
35
36
37
38
39
40 TOTAL 650,000

Annual Report of the Town of BELMONT Year Ended December 31, 2019 Page 22
MUNICIPAL REVENUES (Account 482,444)
(K.W.H. Sold under the provision of Chapter 269, Acts of 1927)
Revenue Avg. Revenue
Line Acct. Gas Schedule Cubic Feet Received Per MCF (cents)
No. No. (a) (b) (c) (0.0000)
(d)
1
2
3
4 TOTALS
Revenue Avg. Revenue
Acct. K.W.H. Received Per KWH (cents)
No. (b) (c) (0.0000)
(d)
5 442-2 Municipal: (Other than Street Lighting)
6 Town B Rate "B" Lighting 1,517,821 308,359 0.2032
7 Town E Rate "E" Lighting 5,372,720 857,172 0.1595
8
9
10
11
12 TOTALS 6,890,541 1,165,531 0.1691
13 444-1 Street Lighting 1,163,315 297,695 0.2559
14
15
16
17
18 TOTALS 1,163,315 297,695 0.2559
19 TOTALS 8,053,856 1,463,226 0.1817
PURCHASED POWER (Account 555.140 and 555.145)
Names of Utilities Cost per KWH
Line from Which Electric Where & at What K.W.H $ Amount (cents)
No. Energy is Purchased Voltage Received (0.0000)
(a) (b) (c) (d) (e)
20
21
22
23
24
25
26
27
29 TOTALS 0 0
SALES FOR RESALE (Account 447)
Names of Utilities Where and Revenue per
Line to Which Electric at What K.W.H Amount KWH (cents)
No. Energy is sold Voltage Delivered (c) (d) (0.0000)
(a) (b) (e)
29
30
31
32
33
34 TOTALS 0 0
Next page is 37
(a)
Electric Schedule (from P. 38)

Page 37 Annual Report of the Town of BELMONT Year Ended December 31, 2019
ELECTRIC OPERATING REVENUES (Account 400)
1. Report below the amount of operating revenue for the meter readings are added for billing purposes, one customer shall 4. Unmetered sales should be included below. The details of such
year for each prescribed account and the amount of increase or be counted for each group of meters so added. The average number sales should be given in a footnote.
decrease over the preceding year. of customers means the average of the 12 figures at the close of each 5. Classification on Commercial and Industrial Sales, Account 442,
2. If increases and decreases are not derived from previously month. If the customer count in the residential service classification Large (or Industrial) may be according to the basis of classification
reported figures, explain any inconsistencies. includes customers counted more than once because of special regularly used by the respondent if such basis of classification is not
3. Number of customers should be reported on the basis of services, such as water heating, etc., indicate in a footnote the number greater than 1000 KW. See Account 442 of the Uniform System
meters, plus number of late rate accounts except where separate of such duplicate customers included in the classification. of Accounts. Explain basis of Classification
Operating Revenues Average Number of
Customers per Month
Increase or Increase or Increase or
Amount for (Decrease) from Amount for (Decrease) from Number for (Decrease) from
Line Account Year Preceding Year Year Preceding Year Year Preceding Year
No. (a) (b) (c) (d) (e) (f) (g)
1 SALES OF ELECTRICITY
2 440 Residential Sales 14,317,587 (125,535) 68,403,334 (2,526,362) 10,800 33
3 442 Commercial and Industrial Sales 0
4 Small Commercial B Sales 8,643,869 46,462 44,919,215 (1,541,233) 824 3
5 Large Commercial C Sales 0 0 0
6 444 Municipal Sales 1,463,226 58,001 8,053,856 (154,043) 48 2
7 445 Other Sales to Public Authorities 0 0 0 0 0
8 446 Sales to Railroads and Railways 0 0 0 0 0
9 448 Interdepartmental Sales 0 0 0 0 0
10 449 Miscellaneous Sales 0 0 0 0 0 0
11 Total Sales to Ultimate Consumers 24,424,682 (21,072) 121,376,405 (4,221,638) 11,672 38
12 447 Sales for Resale 0 0 0 0 0 0
13 Total Sales of Electricity* 24,424,682 (21,072) 121,376,405 (4,221,638) 11,672 38
14 OTHER OPERATING REVENUES
15 450 Forfeited Discounts 0 0
16 451 Miscellaneous Service Revenues 344,620 63,781 * Includes revenues from
17 453 Sales of Water and Water Power 0 0 application of fuel clauses $ 0
18 454 Rent from Electric Property 0 0
19 455 Interdepartmental Rents 0 0
20 456 Other Electric Revenues 145,639 10,060 Total KWH to which applied 121,191,305
21 Total Other Operating Revenues 490,259 73,841
22 Total Electric Operating Revenue 24,914,941 52,769
Kilowatt-hours Sold

Annual Report of the Town of BELMONT Year Ended December 31, 2019 Page 38
Report by account number the K.W.H. sold, the amount derived and the number of customers under each filed schedule
or contract. Municipal sales, contract sales and unbilled sales may be reported separately in total.
Average
Revenue Number of Customers
Line Account Schedule K.W.H. Revenue per KWH (per Bills rendered)
No. No. (a) (b) (c) (cents) Jun 30 Dec 31
(0.0000) (e) (f)
(d)
1 440-1 Rate A Residential 66,219,336 14,034,555 0.2119 10,356 10,386
2 440-15 Residential Low Income 2,183,998 283,032 0.1296 432 425
3 442-1 Rate B Commercial 17,080,387 3,624,794 0.2122 789 793
4 442-3 Rate E Power 25,873,160 4,622,199 0.1786 20 20
5 442-4 Rate F Comm. Heating 1,780,568 336,682 0.1891 12 12
6 442-5 Rate G Area Lighting 185,100 60,194 0.0000 1 1
7 444-1 Municipal B 1,517,821 308,359 0.2032 36 36
8 444-4 Municipal E 5,372,720 857,172 0.1595 11 11
9 444-3 Street Lighting 1,163,315 297,695 0.2559 1 1
Note: Rate G is billed by area light, not by kwh.
TOTAL SALES TO ULTIMATE
CONSUMERS (page 37 Line 11) 121,376,405 24,424,682$ 0.2012$ 11,658 11,685
SALES OF ELECTRICITY TO ULTIMATE CONSUMERS
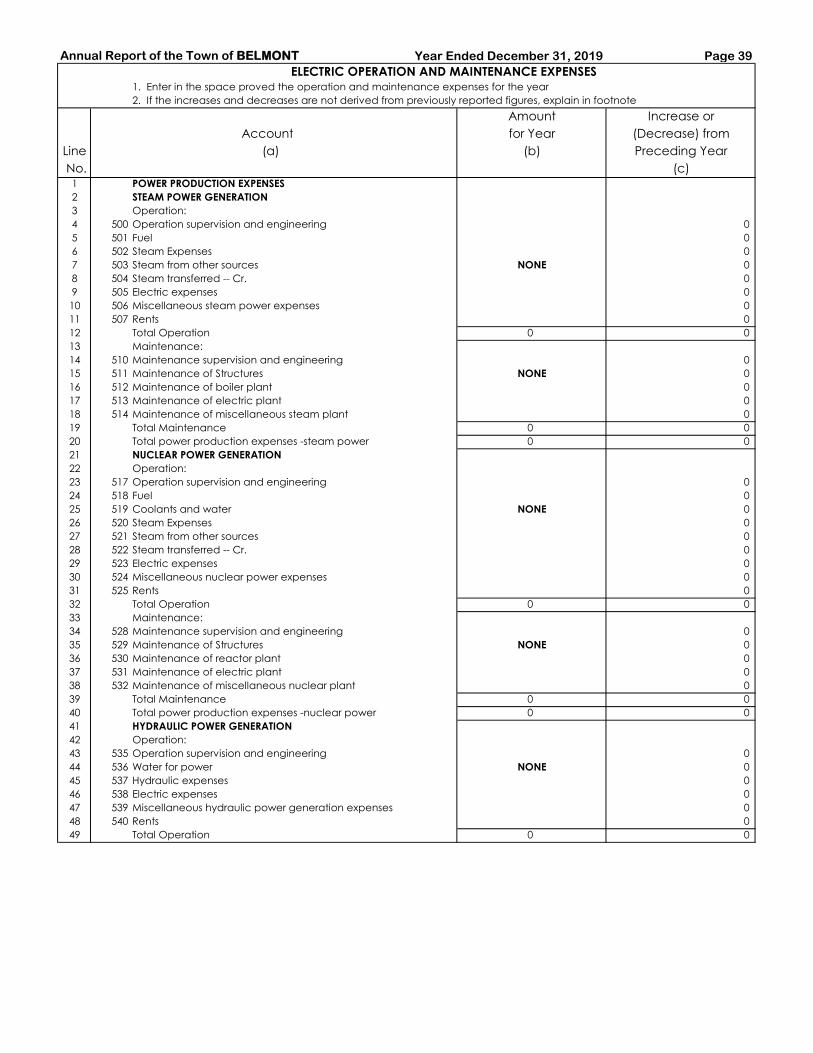
Annual Report of the Town of BELMONT Year Ended December 31, 2019 Page 39
1. Enter in the space proved the operation and maintenance expenses for the year
2. If the increases and decreases are not derived from previously reported figures, explain in footnote
Amount Increase or
Account for Year (Decrease) from
Line (a) (b) Preceding Year
No. (c)1 POWER PRODUCTION EXPENSES
2 STEAM POWER GENERATION
3 Operation:
4 500 Operation supervision and engineering 0
5 501 Fuel 0
6 502 Steam Expenses 0
7 503 Steam from other sources NONE 0
8 504 Steam transferred -- Cr. 0
9 505 Electric expenses 0
10 506 Miscellaneous steam power expenses 0
11 507 Rents 0
12 Total Operation 0 0
13 Maintenance:
14 510 Maintenance supervision and engineering 0
15 511 Maintenance of Structures NONE 0
16 512 Maintenance of boiler plant 0
17 513 Maintenance of electric plant 0
18 514 Maintenance of miscellaneous steam plant 0
19 Total Maintenance 0 0
20 Total power production expenses -steam power 0 0
21 NUCLEAR POWER GENERATION
22 Operation:
23 517 Operation supervision and engineering 0
24 518 Fuel 0
25 519 Coolants and water NONE 0
26 520 Steam Expenses 0
27 521 Steam from other sources 0
28 522 Steam transferred -- Cr. 0
29 523 Electric expenses 0
30 524 Miscellaneous nuclear power expenses 0
31 525 Rents 0
32 Total Operation 0 0
33 Maintenance:
34 528 Maintenance supervision and engineering 0
35 529 Maintenance of Structures NONE 0
36 530 Maintenance of reactor plant 0
37 531 Maintenance of electric plant 0
38 532 Maintenance of miscellaneous nuclear plant 0
39 Total Maintenance 0 0
40 Total power production expenses -nuclear power 0 0
41 HYDRAULIC POWER GENERATION
42 Operation:
43 535 Operation supervision and engineering 0
44 536 Water for power NONE 0
45 537 Hydraulic expenses 0
46 538 Electric expenses 0
47 539 Miscellaneous hydraulic power generation expenses 0
48 540 Rents 0
49 Total Operation 0 0
ELECTRIC OPERATION AND MAINTENANCE EXPENSES
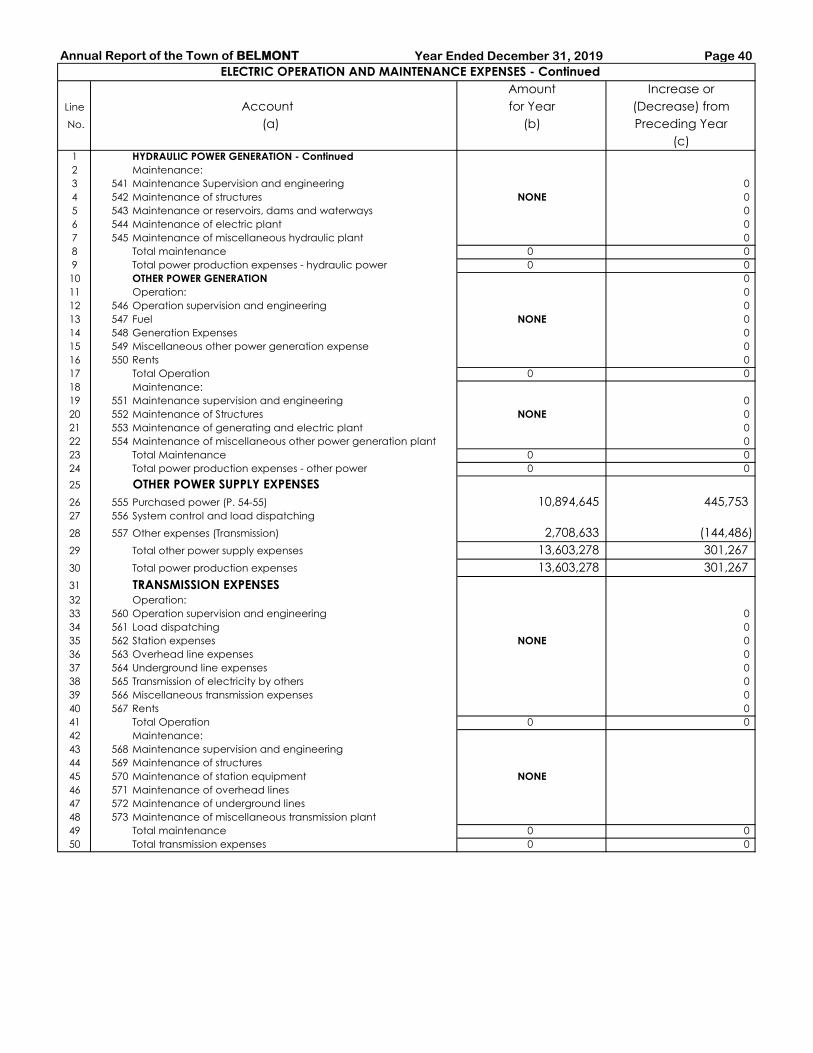
Annual Report of the Town of BELMONT Year Ended December 31, 2019 Page 40
Amount Increase or
Line Account for Year (Decrease) from
No. (a) (b) Preceding Year
(c)1 HYDRAULIC POWER GENERATION - Continued
2 Maintenance:
3 541 Maintenance Supervision and engineering 0
4 542 Maintenance of structures NONE 0
5 543 Maintenance or reservoirs, dams and waterways 0
6 544 Maintenance of electric plant 0
7 545 Maintenance of miscellaneous hydraulic plant 0
8 Total maintenance 0 0
9 Total power production expenses - hydraulic power 0 0
10 OTHER POWER GENERATION 0
11 Operation: 0
12 546 Operation supervision and engineering 0
13 547 Fuel NONE 0
14 548 Generation Expenses 0
15 549 Miscellaneous other power generation expense 0
16 550 Rents 0
17 Total Operation 0 0
18 Maintenance:
19 551 Maintenance supervision and engineering 0
20 552 Maintenance of Structures NONE 0
21 553 Maintenance of generating and electric plant 0
22 554 Maintenance of miscellaneous other power generation plant 0
23 Total Maintenance 0 0
24 Total power production expenses - other power 0 0
25 OTHER POWER SUPPLY EXPENSES
26 555 Purchased power (P. 54-55) 10,894,645 445,75327 556 System control and load dispatching
28 557 Other expenses (Transmission) 2,708,633 (144,486)
29 Total other power supply expenses 13,603,278 301,267
30 Total power production expenses 13,603,278 301,267
31 TRANSMISSION EXPENSES 32 Operation:
33 560 Operation supervision and engineering 0
34 561 Load dispatching 0
35 562 Station expenses NONE 0
36 563 Overhead line expenses 0
37 564 Underground line expenses 0
38 565 Transmission of electricity by others 0
39 566 Miscellaneous transmission expenses 0
40 567 Rents 0
41 Total Operation 0 0
42 Maintenance:
43 568 Maintenance supervision and engineering
44 569 Maintenance of structures
45 570 Maintenance of station equipment NONE
46 571 Maintenance of overhead lines
47 572 Maintenance of underground lines
48 573 Maintenance of miscellaneous transmission plant
49 Total maintenance 0 0
50 Total transmission expenses 0 0
ELECTRIC OPERATION AND MAINTENANCE EXPENSES - Continued
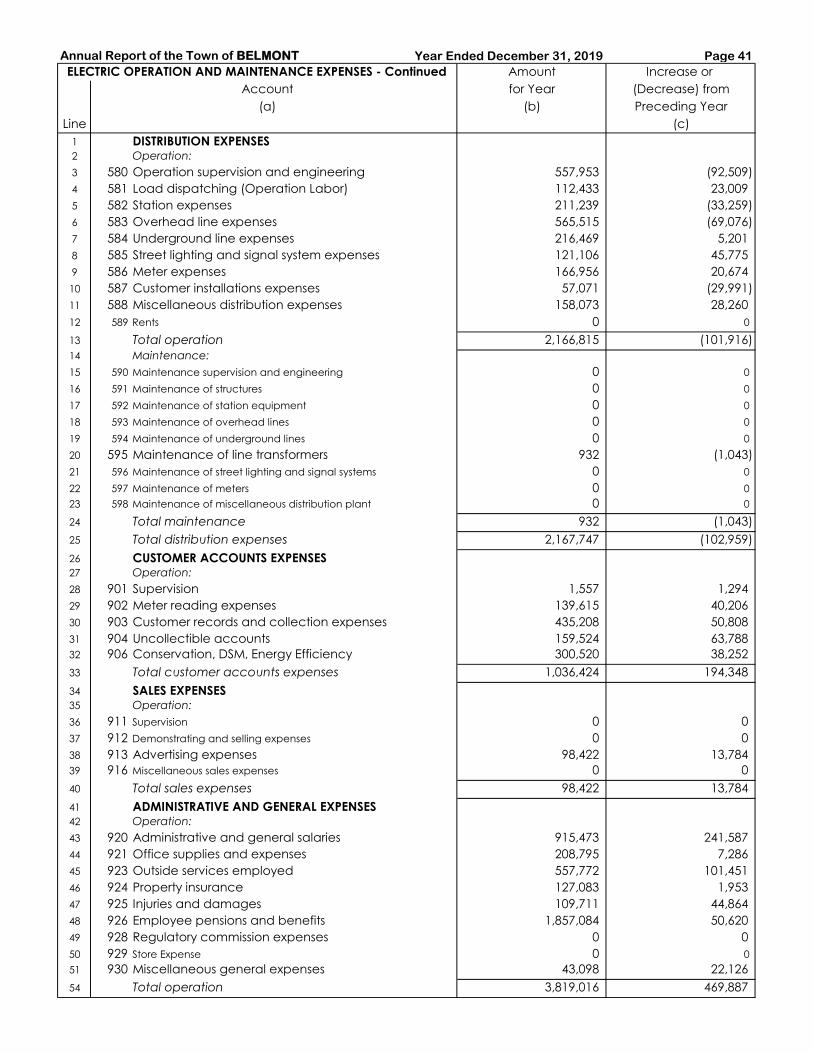
Annual Report of the Town of BELMONT Year Ended December 31, 2019 Page 41
ELECTRIC OPERATION AND MAINTENANCE EXPENSES - Continued Amount Increase or
Account for Year (Decrease) from
(a) (b) Preceding Year
Line (c)
1 DISTRIBUTION EXPENSES 2 Operation:
3 580 Operation supervision and engineering 557,953 (92,509)
4 581 Load dispatching (Operation Labor) 112,433 23,009
5 582 Station expenses 211,239 (33,259)
6 583 Overhead line expenses 565,515 (69,076)
7 584 Underground line expenses 216,469 5,201
8 585 Street lighting and signal system expenses 121,106 45,775
9 586 Meter expenses 166,956 20,674
10 587 Customer installations expenses 57,071 (29,991)
11 588 Miscellaneous distribution expenses 158,073 28,260
12 589 Rents 0 0
13 Total operation 2,166,815 (101,916)
14 Maintenance:
15 590 Maintenance supervision and engineering 0 0
16 591 Maintenance of structures 0 0
17 592 Maintenance of station equipment 0 0
18 593 Maintenance of overhead lines 0 0
19 594 Maintenance of underground lines 0 0
20 595 Maintenance of line transformers 932 (1,043)
21 596 Maintenance of street lighting and signal systems 0 0
22 597 Maintenance of meters 0 0
23 598 Maintenance of miscellaneous distribution plant 0 0
24 Total maintenance 932 (1,043)
25 Total distribution expenses 2,167,747 (102,959)
26 CUSTOMER ACCOUNTS EXPENSES27 Operation:
28 901 Supervision 1,557 1,294
29 902 Meter reading expenses 139,615 40,206
30 903 Customer records and collection expenses 435,208 50,808
31 904 Uncollectible accounts 159,524 63,788
32 906 Conservation, DSM, Energy Efficiency 300,520 38,252
33 Total customer accounts expenses 1,036,424 194,348
34 SALES EXPENSES 35 Operation:
36 911 Supervision 0 0
37 912 Demonstrating and selling expenses 0 0
38 913 Advertising expenses 98,422 13,784
39 916 Miscellaneous sales expenses 0 0
40 Total sales expenses 98,422 13,784
41 ADMINISTRATIVE AND GENERAL EXPENSES42 Operation:
43 920 Administrative and general salaries 915,473 241,587
44 921 Office supplies and expenses 208,795 7,286
45 923 Outside services employed 557,772 101,451
46 924 Property insurance 127,083 1,953
47 925 Injuries and damages 109,711 44,864
48 926 Employee pensions and benefits 1,857,084 50,620
49 928 Regulatory commission expenses 0 0
50 929 Store Expense 0 0
51 930 Miscellaneous general expenses 43,098 22,126
54 Total operation 3,819,016 469,887
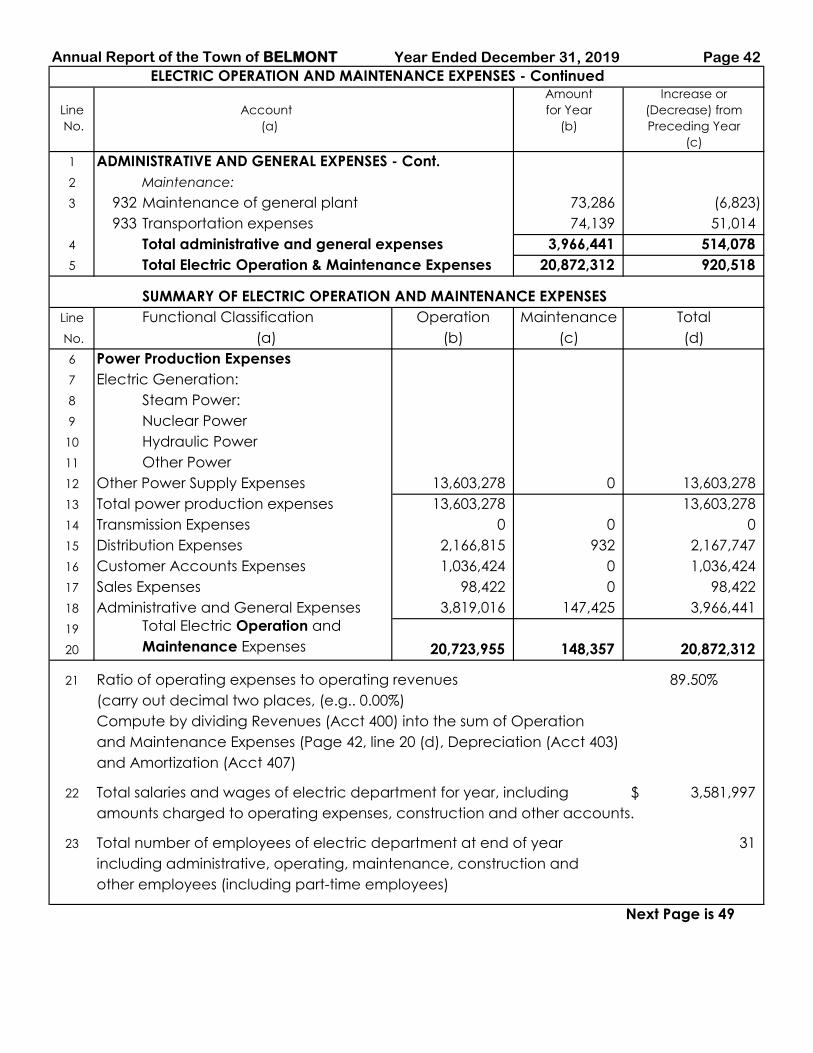
Annual Report of the Town of BELMONT Year Ended December 31, 2019 Page 42
ELECTRIC OPERATION AND MAINTENANCE EXPENSES - ContinuedAmount Increase or
Line Account for Year (Decrease) from
No. (a) (b) Preceding Year
(c)
1 ADMINISTRATIVE AND GENERAL EXPENSES - Cont.
2 Maintenance:
3 932 Maintenance of general plant 73,286 (6,823)
933 Transportation expenses 74,139 51,014
4 Total administrative and general expenses 3,966,441 514,078
5 Total Electric Operation & Maintenance Expenses 20,872,312 920,518
SUMMARY OF ELECTRIC OPERATION AND MAINTENANCE EXPENSES
Line Functional Classification Operation Maintenance Total
No. (a) (b) (c) (d)
6 Power Production Expenses
7 Electric Generation:
8 Steam Power:
9 Nuclear Power
10 Hydraulic Power
11 Other Power
12 Other Power Supply Expenses 13,603,278 0 13,603,278
13 Total power production expenses 13,603,278 13,603,278
14 Transmission Expenses 0 0 0
15 Distribution Expenses 2,166,815 932 2,167,747
16 Customer Accounts Expenses 1,036,424 0 1,036,424
17 Sales Expenses 98,422 0 98,422
18 Administrative and General Expenses 3,819,016 147,425 3,966,441
19 Total Electric Operation and
20 Maintenance Expenses 20,723,955 148,357 20,872,312
21 Ratio of operating expenses to operating revenues 89.50%
(carry out decimal two places, (e.g.. 0.00%)
Compute by dividing Revenues (Acct 400) into the sum of Operation
and Maintenance Expenses (Page 42, line 20 (d), Depreciation (Acct 403)
and Amortization (Acct 407)
22 Total salaries and wages of electric department for year, including 3,581,997$
amounts charged to operating expenses, construction and other accounts.
23 Total number of employees of electric department at end of year 31
including administrative, operating, maintenance, construction and
other employees (including part-time employees)
Next Page is 49
Page 49 Annual Report of the Town of BELMONT Year Ended December 31, 2019
TAXES CHARGED DURING THE YEAR
1. This schedule is intended to give the account distribution of total 3. The aggregate of each kind of tax should be listed under the appropriate 5. For any tax which it was necessary to apportion
taxes charged to operations and other final accounts during the year. heading of "Federal", "State" and "Local" in such manner that the total tax more than one utility department account, state in a
2. Do not include gasoline and other sales taxes which have been for each State and for all subdivisions can be readily ascertained. footnote the basis of apportioning such tax.
charged to accounts to which the material on which the tax was levied 4. The accounts to which the taxes charged were distributed should be 6. Do not include in this schedule entries with respect
which the tax was levied was charged. If the actual or estimated amountsshown in columns (c) to (h). Show both the utility department and number to deferred income taxes, or taxes collected through
of such taxes are known, they should be shown as a footnote and of account charged. For taxes charged to utility plant show the number of payroll deductions or otherwise pending transmittal
designated whether estimated or actual amounts the appropriate balance sheet plant account or subaccount. of such taxes to the taxing authority.
Total Taxes
Charged
Line Kind of Tax During Year Electric Gas
No. (a) (omit cents) Acct 408,409 Acct 408,409
(b) (c) (d) (e) (f) (g) (h) (i)
1
2
3
4 NONE
5
6
7
8
9
10
11
12
13
14
15
16
17
18
19
20 TOTALS
Annual Report of the Town of BELMONT Year Ended December 31, 2019 Page 50OTHER UTILITY OPERATING INCOME (Account 414)
Report below the particulars called for in each column
Amount Gain or
Amount of Amount of of Operating (Loss) from
Line Property Investment Department Expenses Operation
No. (a) (b) (c) (d) (e)
1 0
2
3
4
5
6
7
8
9
10
11
12
13
14
15
16
17
18
19
20
21
22
23
24
25
26
27
28
29
30
31
32
33
34
35
36
37
38
39
40 TOTALS 0 0 0 0
Annual Report of the Town of BELMONT Year Ended December 31, 2019 Page 51
Report by utility departments the revenue, costs, expenses, and net income from merchandising,
jobbing and contract work during the year.
Electric Gas Other Utility
Line Item Department Department Department Total
No. (a) (b) (c) (d) (e)
1 Revenues:
2 Merchandise sales, less discounts, 0
3 allowances and returns 0
4 Contract work 0 0
5 Commissions 0
6 Other (list according to major classes) 0 0
7 Water Heater Rentals NONE
8
9
10 Total Revenues 0 0 0 0
11
12
13 Costs and Expenses:
14 Cost of sales (list according to major
15 classes of cost)
16 Jobbing/Contract Costs 0 0
17 Materials 0
18 Outside Service Labor
19
20
21
22
23
24
25
26 Sales Expenses
27 Customer accounts expenses
28 Administrative and general expenses
29
30
31
32
33
34
35
36
37
38
39
40
41
42
43
44
45 TOTAL COSTS AND EXPENSES 0 0 0 0
46 Net Profit (or loss) 0 0 0 0
INCOME FROM MERCHANDISE, JOBBING, AND CONTRACT WORK (Account 415)
52
Annual Report of the Town of BELMONT Year Ended December 31, 2019
SALES FOR RESALE (Account 447)
1. Report sales during year to other electric utilities and and place an "x" in column (c) if sale involves export
to cities or other public authorities for distribution to across a state line.
ultimate consumers. 3. Report separately firm, dump, and other power sold to
2. Provide subheadings and classify sales as to (1) Associ- the same utility. Describe the nature of any sales
ated Utilities, (2) Nonassociated Utilities, (3) Municipalities, classified as Other Power, column (b).
(4) R.E.A. Cooperatives, and (5) Other Public Authorities. 4. If delivery is made at a substation indicate ownership
For each sale designate statistical classification in column (b), in column (e), thus: respondent owned or leased, RS;
thus: firm power, FP; dump or surplus power, DP; other, G, customer owned or leased, CS.
Export Kw or Kva of Demand
Across Avg mo. Annual
Statistical State Point of Sub Contract Maximum Maximum
Line Sales to MMWEC: Classification Line Delivery Station Demand Demand Demand
No. (a) (b) (c) (d) (e) (f) (g) (h)
1
2
3
4
5
6
7
8
9
10
11
12
13
14
15
16
17
18
19
20
21
22
23
24
37

53
Annual Report of the Town of BELMONT Year Ended December 31, 2019
SALES FOR RESALE (Account 447) - Continued
5. If a fixed number of kilowatts of maximum demand integrated).
is specified in the power contract as a basis of billings to 6. The number of kilowatt-hours sold should be the
the customer this number should be shown in column (f). quantities shown by the bills rendered to the purchasers.
The number of kilowatts of maximum demand to be shown 7. Explain any amount entered in column (n) such as fuel
in column (g) and (h) should be actual based on monthly or other adjustments.
readings and should be furnished whether or not used in the 8. If a contract covers several points of delivery and
determination of demand charges. Show in column (i) type small amounts of electric energy are delivered at
of demand reading (instantaneous, 15, 30, or 60 minutes each point, such sales may be grouped.
Revenue (Omit Cents) Revenue
Type of Voltage per kwh
Demand at Which Kilowatt- Capacity Energy Other (CENTS)
Reading Delivered Hours Charges Charges Charges Total (0.0000) Line
(i) (j) (k) (l) (m) (n) (o) (p) No.
1
2
3
4
5
6
7
8
9
10
11
12
13
14
15
16
17
18
19
20
21
22
23
24
TOTALS: 37
54
Annual Report of the Town of BELMONT
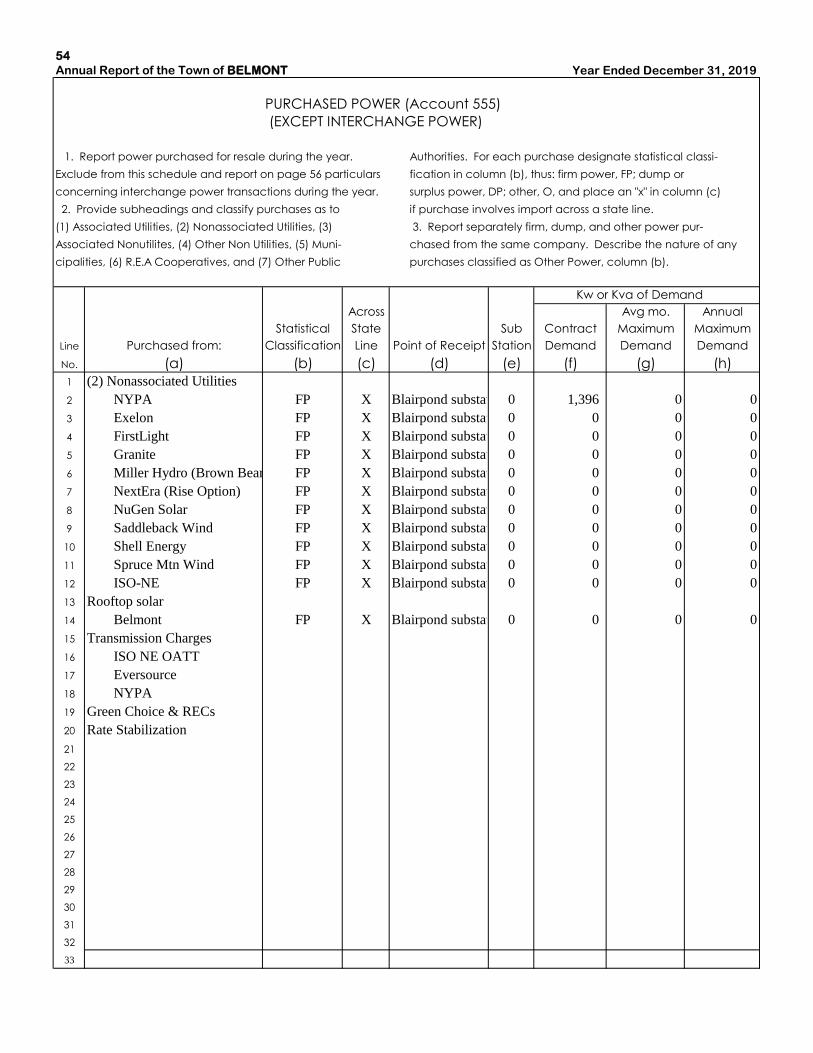
PURCHASED POWER (Account 555)
(EXCEPT INTERCHANGE POWER)
1. Report power purchased for resale during the year. Authorities. For each purchase designate statistical classi-
Exclude from this schedule and report on page 56 particulars fication in column (b), thus: firm power, FP; dump or
concerning interchange power transactions during the year. surplus power, DP; other, O, and place an "x" in column (c)
2. Provide subheadings and classify purchases as to if purchase involves import across a state line.
(1) Associated Utilities, (2) Nonassociated Utilities, (3) 3. Report separately firm, dump, and other power pur-
Associated Nonutilites, (4) Other Non Utilities, (5) Muni- chased from the same company. Describe the nature of any
cipalities, (6) R.E.A Cooperatives, and (7) Other Public purchases classified as Other Power, column (b).
Kw or Kva of Demand
Across Avg mo. Annual
Statistical State Sub Contract Maximum Maximum
Line Purchased from: Classification Line Point of Receipt Station Demand Demand Demand
No. (a) (b) (c) (d) (e) (f) (g) (h)
1 (2) Nonassociated Utilities
2 NYPA FP X Blairpond substation0 1,396 0 0
3 Exelon FP X Blairpond substation0 0 0 0
4 FirstLight FP X Blairpond substation0 0 0 0
5 Granite FP X Blairpond substation0 0 0 0
6 Miller Hydro (Brown Bear) FP X Blairpond substation0 0 0 0
7 NextEra (Rise Option) FP X Blairpond substation0 0 0 0
8 NuGen Solar FP X Blairpond substation0 0 0 0
9 Saddleback Wind FP X Blairpond substation0 0 0 0
10 Shell Energy FP X Blairpond substation0 0 0 0
11 Spruce Mtn Wind FP X Blairpond substation0 0 0 0
12 ISO-NE FP X Blairpond substation0 0 0 0
13 Rooftop solar
14 Belmont FP X Blairpond substation0 0 0 0
15 Transmission Charges
16 ISO NE OATT
17 Eversource
18 NYPA
19 Green Choice & RECs
20 Rate Stabilization
21
22
23
24
25
26
27
28
29
30
31
32
33
Year Ended December 31, 2019
55
Annual Report of the Town of BELMONT
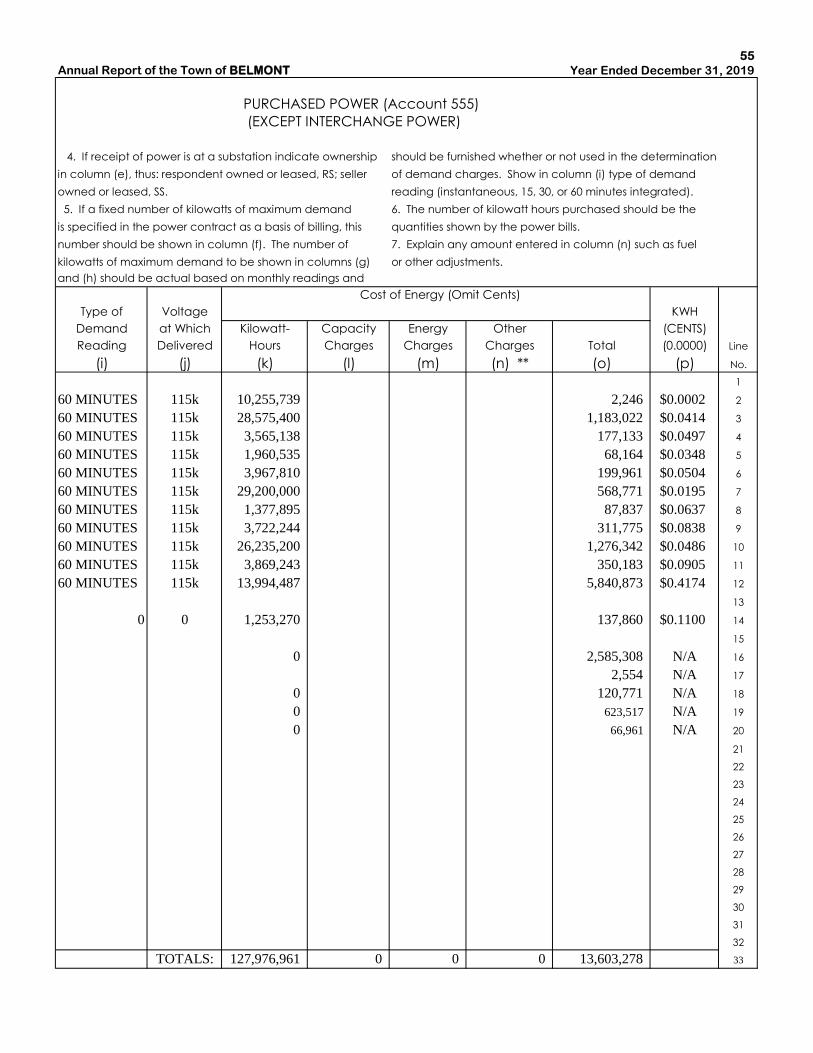
PURCHASED POWER (Account 555)
(EXCEPT INTERCHANGE POWER)
4. If receipt of power is at a substation indicate ownership should be furnished whether or not used in the determination
in column (e), thus: respondent owned or leased, RS; seller of demand charges. Show in column (i) type of demand
owned or leased, SS. reading (instantaneous, 15, 30, or 60 minutes integrated).
5. If a fixed number of kilowatts of maximum demand 6. The number of kilowatt hours purchased should be the
is specified in the power contract as a basis of billing, this quantities shown by the power bills.
number should be shown in column (f). The number of 7. Explain any amount entered in column (n) such as fuel
kilowatts of maximum demand to be shown in columns (g) or other adjustments.
and (h) should be actual based on monthly readings and
Cost of Energy (Omit Cents)
Type of Voltage KWH
Demand at Which Kilowatt- Capacity Energy Other (CENTS)
Reading Delivered Hours Charges Charges Charges Total (0.0000) Line
(i) (j) (k) (l) (m) (n) ** (o) (p) No.
1
60 MINUTES 115k 10,255,739 2,246 $0.0002 2
60 MINUTES 115k 28,575,400 1,183,022 $0.0414 3
60 MINUTES 115k 3,565,138 177,133 $0.0497 4
60 MINUTES 115k 1,960,535 68,164 $0.0348 5
60 MINUTES 115k 3,967,810 199,961 $0.0504 6
60 MINUTES 115k 29,200,000 568,771 $0.0195 7
60 MINUTES 115k 1,377,895 87,837 $0.0637 8
60 MINUTES 115k 3,722,244 311,775 $0.0838 9
60 MINUTES 115k 26,235,200 1,276,342 $0.0486 10
60 MINUTES 115k 3,869,243 350,183 $0.0905 11
60 MINUTES 115k 13,994,487 5,840,873 $0.4174 12
13
0 0 1,253,270 137,860 $0.1100 14
15
0 2,585,308 N/A 16
2,554 N/A 17
0 120,771 N/A 18
0 623,517 N/A 19
0 66,961 N/A 20
21
22
23
24
25
26
27
28
29
30
31
32
TOTALS: 127,976,961 0 0 0 13,603,278 33
Year Ended December 31, 2019
56 Annual Report of the Town of BELMONT Year Ended December 31, 2019
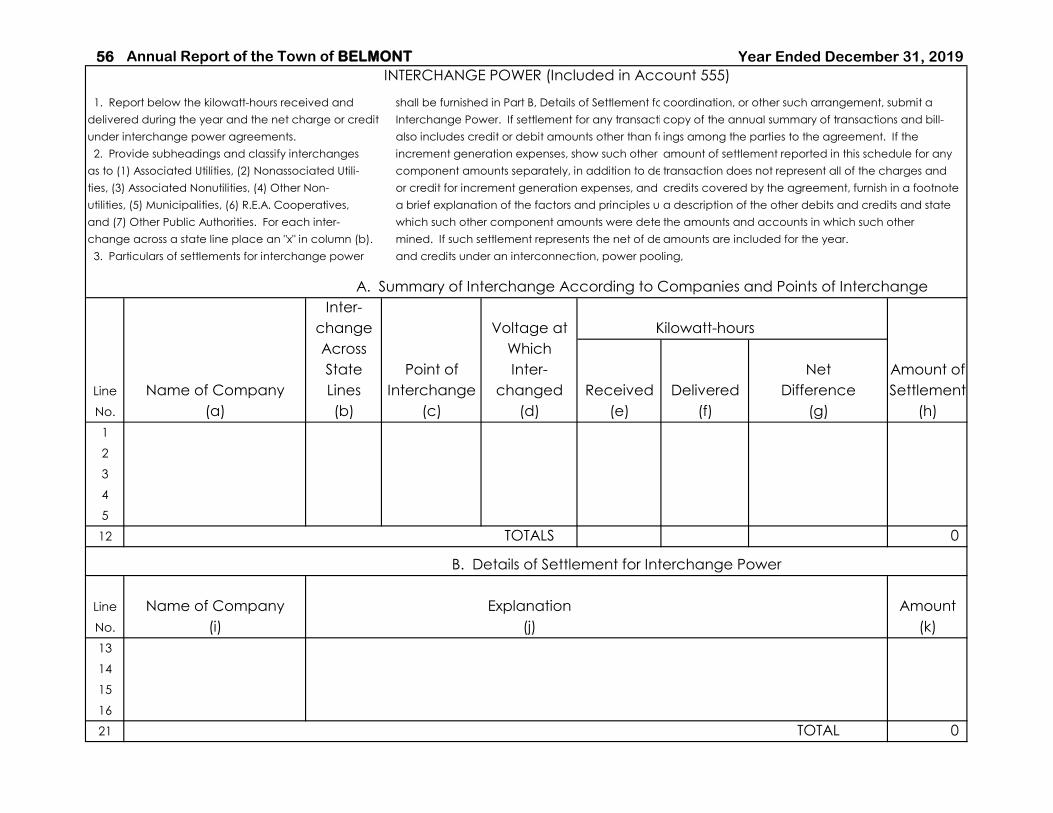
INTERCHANGE POWER (Included in Account 555)
1. Report below the kilowatt-hours received and shall be furnished in Part B, Details of Settlement forcoordination, or other such arrangement, submit a
delivered during the year and the net charge or credit Interchange Power. If settlement for any transactioncopy of the annual summary of transactions and bill-
under interchange power agreements. also includes credit or debit amounts other than forings among the parties to the agreement. If the
2. Provide subheadings and classify interchanges increment generation expenses, show such other amount of settlement reported in this schedule for any
as to (1) Associated Utilities, (2) Nonassociated Utili- component amounts separately, in addition to debittransaction does not represent all of the charges and
ties, (3) Associated Nonutilities, (4) Other Non- or credit for increment generation expenses, and givecredits covered by the agreement, furnish in a footnote
utilities, (5) Municipalities, (6) R.E.A. Cooperatives, a brief explanation of the factors and principles undera description of the other debits and credits and state
and (7) Other Public Authorities. For each inter- which such other component amounts were deter-the amounts and accounts in which such other
change across a state line place an "x" in column (b). mined. If such settlement represents the net of debitsamounts are included for the year.
3. Particulars of settlements for interchange power and credits under an interconnection, power pooling,
A. Summary of Interchange According to Companies and Points of Interchange
Inter-
change Voltage at Kilowatt-hours
Across Which
State Point of Inter- Net Amount of
Line Name of Company Lines Interchange changed Received Delivered Difference Settlement
No. (a) (b) (c) (d) (e) (f) (g) (h)
1
2
3
4
5
12 TOTALS 0
B. Details of Settlement for Interchange Power
Line Name of Company Explanation Amount
No. (i) (j) (k)
13
14
15
16
21 TOTAL 0
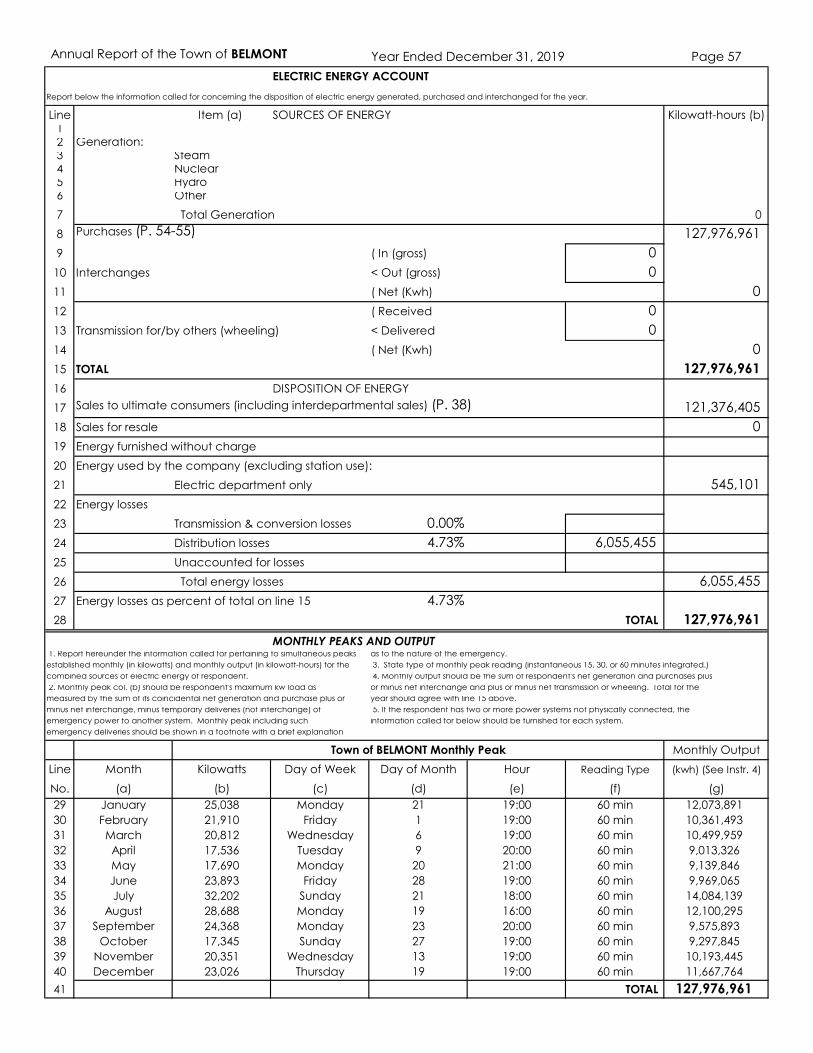
Annual Report of the Town of BELMONT Year Ended December 31, 2019 Page 57
ELECTRIC ENERGY ACCOUNT
Report below the information called for concerning the disposition of electric energy generated, purchased and interchanged for the year.
Line Item (a) SOURCES OF ENERGY Kilowatt-hours (b)12 Generation:3 Steam4 Nuclear5 Hydro6 Other
7 Total Generation 0
8 Purchases (P. 54-55) 127,976,961
9 ( In (gross) 0
10 Interchanges < Out (gross) 0
11 ( Net (Kwh) 0
12 ( Received 0
13 Transmission for/by others (wheeling) < Delivered 0
14 ( Net (Kwh) 0
15 TOTAL 127,976,961
16 DISPOSITION OF ENERGY
17 Sales to ultimate consumers (including interdepartmental sales) (P. 38) 121,376,405
18 Sales for resale 0
19 Energy furnished without charge
20 Energy used by the company (excluding station use):
21 Electric department only 545,101
22 Energy losses
23 Transmission & conversion losses 0.00%
24 Distribution losses 4.73% 6,055,455
25 Unaccounted for losses
26 Total energy losses 6,055,455
27 Energy losses as percent of total on line 15 4.73%
28 TOTAL 127,976,961
MONTHLY PEAKS AND OUTPUT 1. Report hereunder the information called for pertaining to simultaneous peaks as to the nature of the emergency.
established monthly (in kilowatts) and monthly output (in kilowatt-hours) for the 3. State type of monthly peak reading (instantaneous 15, 30, or 60 minutes integrated.)
combined sources of electric energy of respondent. 4. Monthly output should be the sum of respondent's net generation and purchases plus
2. Monthly peak col. (b) should be respondent's maximum kw load as or minus net interchange and plus or minus net transmission or wheeling. Total for the
measured by the sum of its coincidental net generation and purchase plus or year should agree with line 15 above.
minus net interchange, minus temporary deliveries (not interchange) of 5. If the respondent has two or more power systems not physically connected, the
emergency power to another system. Monthly peak including such information called for below should be furnished for each system.
emergency deliveries should be shown in a footnote with a brief explanation
Monthly Output
Line Month Kilowatts Day of Week Day of Month Hour Reading Type (kwh) (See Instr. 4)
No. (a) (b) (c) (d) (e) (f) (g)
29 January 25,038 Monday 21 19:00 60 min 12,073,891
30 February 21,910 Friday 1 19:00 60 min 10,361,493
31 March 20,812 Wednesday 6 19:00 60 min 10,499,959
32 April 17,536 Tuesday 9 20:00 60 min 9,013,326
33 May 17,690 Monday 20 21:00 60 min 9,139,846
34 June 23,893 Friday 28 19:00 60 min 9,969,065
35 July 32,202 Sunday 21 18:00 60 min 14,084,139
36 August 28,688 Monday 19 16:00 60 min 12,100,295
37 September 24,368 Monday 23 20:00 60 min 9,575,893
38 October 17,345 Sunday 27 19:00 60 min 9,297,845
39 November 20,351 Wednesday 13 19:00 60 min 10,193,445
40 December 23,026 Thursday 19 19:00 60 min 11,667,764
41 TOTAL 127,976,961
Town of BELMONT Monthly Peak
Annual Report of the Town of BELMONT Year Ended December 31, 2019
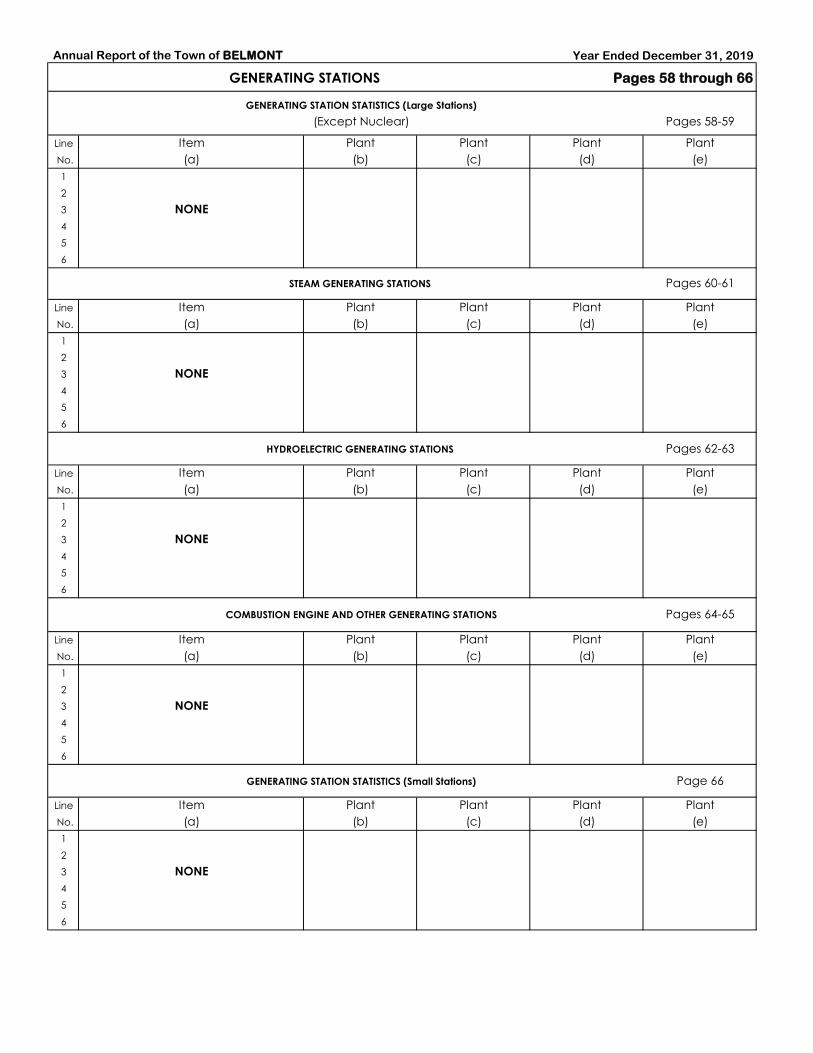
GENERATING STATIONS Pages 58 through 66
GENERATING STATION STATISTICS (Large Stations)
(Except Nuclear) Pages 58-59
Line Item Plant Plant Plant Plant
No. (a) (b) (c) (d) (e)
1
2
3 NONE
4
5
6
STEAM GENERATING STATIONS Pages 60-61
Line Item Plant Plant Plant Plant
No. (a) (b) (c) (d) (e)
1
2
3 NONE
4
5
6
HYDROELECTRIC GENERATING STATIONS Pages 62-63
Line Item Plant Plant Plant Plant
No. (a) (b) (c) (d) (e)
1
2
3 NONE
4
5
6
COMBUSTION ENGINE AND OTHER GENERATING STATIONS Pages 64-65
Line Item Plant Plant Plant Plant
No. (a) (b) (c) (d) (e)
1
2
3 NONE
4
5
6
GENERATING STATION STATISTICS (Small Stations) Page 66
Line Item Plant Plant Plant Plant
No. (a) (b) (c) (d) (e)
1
2
3 NONE
4
5
6
Annual Report of the Town of BELMONT Year Ended December 31, 2019 Page 67
TRANSMISSION LINE STATISTICS
Report information concerning transmission line as indicated below.
Type of Length (Pole Miles) Number Size of
Designation Operating Supportive On Structures of On Structures of of Conductors
Line From To Voltage Structure Line Designated Another Line Circuits and Material
No. (a) (b) (c) (d) (e) (f) (g) (h)
1
2
3
4
5
6
7
8
9
10
TOTALS 0 0* where other than 60 cycle, 3 phase, so indicate.
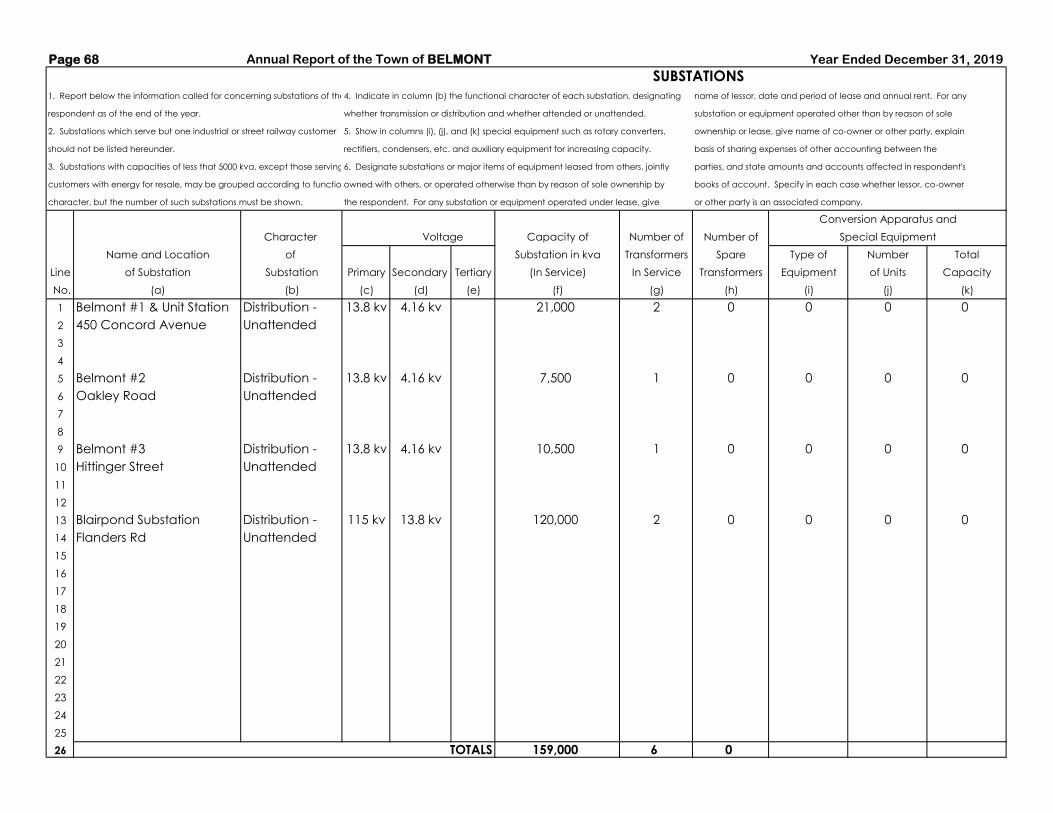
Page 68 Annual Report of the Town of BELMONT Year Ended December 31, 2019
SUBSTATIONS
1. Report below the information called for concerning substations of the 4. Indicate in column (b) the functional character of each substation, designating name of lessor, date and period of lease and annual rent. For any
respondent as of the end of the year. whether transmission or distribution and whether attended or unattended. substation or equipment operated other than by reason of sole
2. Substations which serve but one industrial or street railway customer 5. Show in columns (i), (j), and (k) special equipment such as rotary converters, ownership or lease, give name of co-owner or other party, explain
should not be listed hereunder. rectifiers, condensers, etc. and auxiliary equipment for increasing capacity. basis of sharing expenses of other accounting between the
3. Substations with capacities of less that 5000 kva, except those serving6. Designate substations or major items of equipment leased from others, jointly parties, and state amounts and accounts affected in respondent's
customers with energy for resale, may be grouped according to functionalowned with others, or operated otherwise than by reason of sole ownership by books of account. Specify in each case whether lessor, co-owner
character, but the number of such substations must be shown. the respondent. For any substation or equipment operated under lease, give or other party is an associated company.
Conversion Apparatus and
Character Voltage Capacity of Number of Number of Special Equipment
Name and Location of Substation in kva Transformers Spare Type of Number Total
Line of Substation Substation Primary Secondary Tertiary (In Service) In Service Transformers Equipment of Units Capacity
No. (a) (b) (c) (d) (e) (f) (g) (h) (i) (j) (k)
1 Belmont #1 & Unit Station Distribution - 13.8 kv 4.16 kv 21,000 2 0 0 0 0
2 450 Concord Avenue Unattended
3
4
5 Belmont #2 Distribution - 13.8 kv 4.16 kv 7,500 1 0 0 0 0
6 Oakley Road Unattended
7
8
9 Belmont #3 Distribution - 13.8 kv 4.16 kv 10,500 1 0 0 0 0
10 Hittinger Street Unattended
11
12
13 Blairpond Substation Distribution - 115 kv 13.8 kv 120,000 2 0 0 0 0
14 Flanders Rd Unattended
15
16
17
18
19
20
21
22
23
24
25
26 TOTALS 159,000 6 0

Annual Report of the Town of BELMONT Year Ended December 31, 2019 Pages 69
OVERHEAD DISTRIBUTION LINES OPERATED
Line Length (Pole Miles)
No. Wood Poles Steel Towers Total
1 Miles -- Beginning of Year 73.34 73.34
2 Added During Year 0.00 0.00
3 Retired During Year 0.00 0.00
4 Miles -- End of Year 73.34 0.00 73.34
5 *
6
7
8 Distribution System Characteristics - AC or DC, Phase, cycles and operating voltages for Light and Power
9
10 A/C 60 cycles
11 1 phase 3 wire 120/240 volts
12 3 phase 4 wire 120/208 volts
13 3 phase 4 wire 277/480 volts
14 3 phase 3 wire 240/480 volts
15
ELECTRIC DISTRIBUTION SERVICES, METERS AND LINE TRANSFORMERS
Line Transformers
Electric Number of Total
Line Item Services Watt-hour Number Capacity
No. Meters (kva)
16 Number at beginning of year: 0 12,215 1,582 72,109.5
17 Additions during year
18 Purchased 0 405 20 1,238.0
19 Installed 0 0 0 0.0
20 Associated with utility plant acquired
21 Total Additions 0 405 20 1,238.0
22 Reductions during year:
23 Retirements 0 120 7 263.0
24 Associated with utility plant sold
25 Total Reductions 0 120 7 263.0
26 Number at end of year 0 12,500 1,595 73,084.5
27 In stock 815 1,595 73,084.5
28 Locked meters on customers' premises
29 Inactive transformers on system
30 In customers' use (pg. 38 last line ) 11,685 0 0.0
31 In company's use
32 Number at end of year 12,500 1,595 73,084.5
*
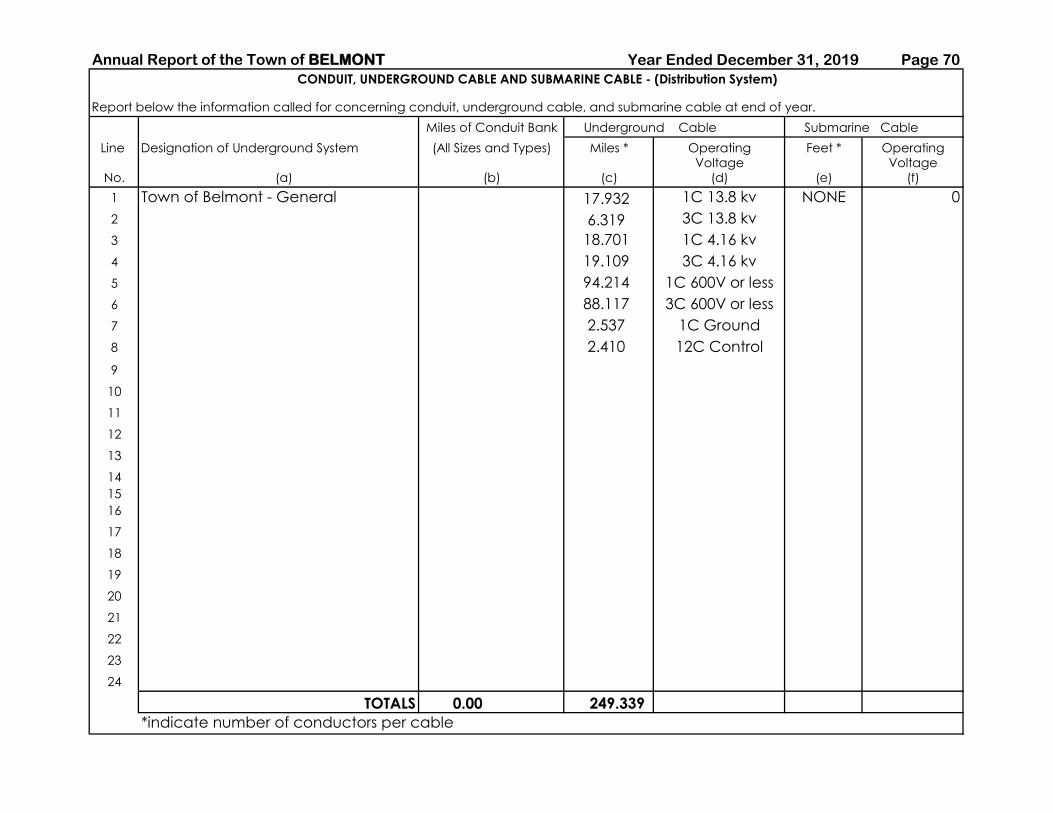
Annual Report of the Town of BELMONT Year Ended December 31, 2019 Page 70
CONDUIT, UNDERGROUND CABLE AND SUBMARINE CABLE - (Distribution System)
Report below the information called for concerning conduit, underground cable, and submarine cable at end of year.
Underground Cable Submarine Cable
Line Designation of Underground System Miles * Operating Feet * OperatingVoltage Voltage
No. (a) (c) (d) (e) (f)
1 Town of Belmont - General 17.932 1C 13.8 kv NONE 0
2 6.319 3C 13.8 kv
3 18.701 1C 4.16 kv
4 19.109 3C 4.16 kv
5 94.214 1C 600V or less
6 88.117 3C 600V or less
7 2.537 1C Ground
8 2.410 12C Control
9
10
11
12
13
14
15
16
17
18
19
20
21
22
23
24
TOTALS 0.00 249.339
*indicate number of conductors per cable
Miles of Conduit Bank
(All Sizes and Types)
(b)

Annual Report of the Town of BELMONT Year Ended December 31, 2019 Page 71
Type
Incandescent Mercury Vapor LED Sodium
Line City or Town Total Municipal Other Municipal Other Municipal Other Municipal Other
No. (a) (b) (c) (d) (e) (f) (g) (h) (i) (j)
1 Belmont 2,375 0 0 0 0 0 0 233 2,142 0
2 3
4
5
6
7
8
9
10
11
12
13
14
15
16
17
18
19
20
21
22
23
24
25
26
27
28
29
30
31
32
33
34
35
36
37
38
39
40
41
42
43
44
45
46
47
48 TOTALS 2,375 0 0 0 0 0 0 233 2,142 0Next Page is 79
STREET LAMPS CONNECTED TO SYSTEM
Florescent & Quartz

Annual Report of the Town of BELMONT Year Ended December 31, 2019 Page 79RATE SCHEDULE INFORMATION
1. Attach copies of all Filed Rates for General Consumers
2. Show below the changes in rate schedules during year and the estimated increase
or decrease in annual revenues predicted on the previous year's operations.
Estimated
Effective M.D.P.U. Rate Effect on
Date Number Schedule Annual Revenues
Increases Decreases
See New Rate Schedules Attached

Annual Report of the Town of BELMONT Year Ended December 31, 2019 Page 81
THIS RETURN IS SIGNED UNDER THE PENALTIES OF PERJURY
....................... ......................................... ............. ......................................................
Christopher Roy
|
|
....................... ......................................... ............. ...................................................... |
Roy Epstein Chair | The Selectmen
| are also the
| Members
....................... ......................................... ............. ...................................................... | of the
Adam Dash | Municipal
| Light Board.
|
....................... ......................................... ............. ...................................................... >
Tom Caputo |
SIGNATURES OF ABOVE PARTIES AFFIXED OUTSIDE THE COMMONWEALTH OF
MASSACHUSETTS MUST BE PROPERLY SWORN TO
....................... ......................................... SS ...................................................... ...................... 20 ........................
Then personally appeared ...................................................... ...................... ........... ........................
...................................................... ...................... ........... ........................
...................................................... ...................... ........... ........................
...................................................... ...................... ........... ........................
And severally made oath to the truth of the foregoing statement by them
subscribed according to their best knowledge and belief.
Notary Public or
......................................... ............. ...................................................... Justice of the Peace
Manager of Electric Light
Page
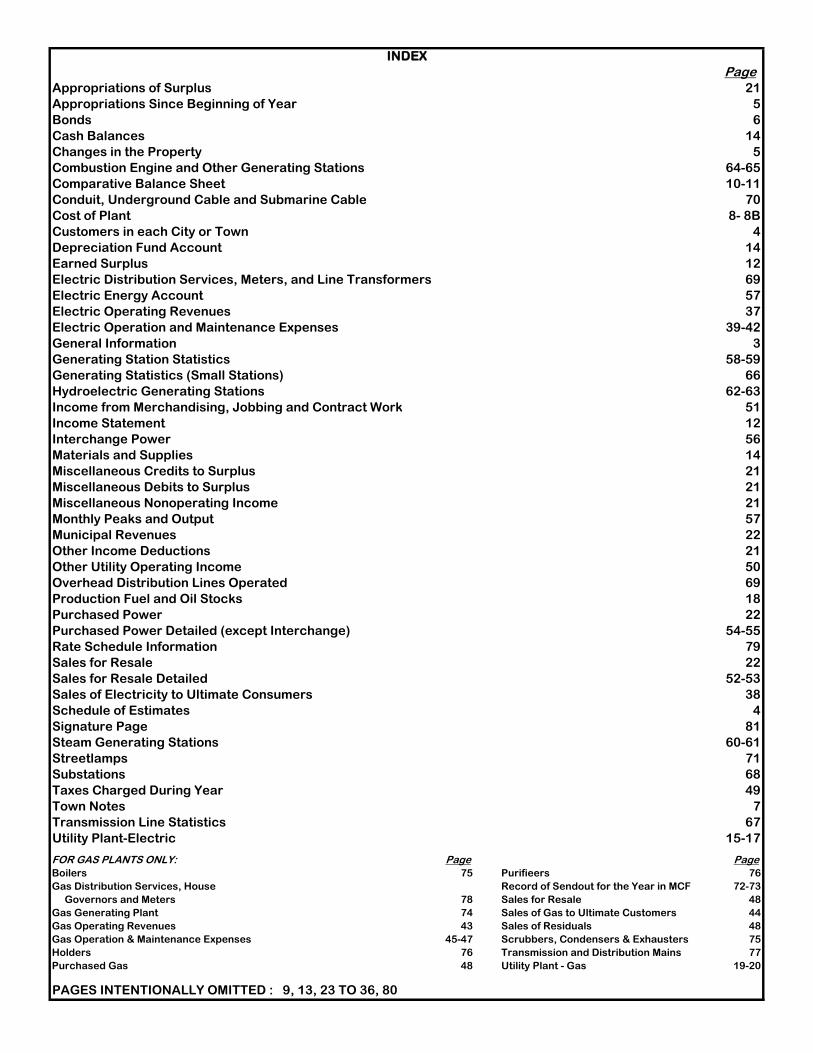
Appropriations of Surplus 21
Appropriations Since Beginning of Year 5
Bonds 6
Cash Balances 14
Changes in the Property 5
Combustion Engine and Other Generating Stations 64-65
Comparative Balance Sheet 10-11
Conduit, Underground Cable and Submarine Cable 70
Cost of Plant 8- 8B
Customers in each City or Town 4
Depreciation Fund Account 14
Earned Surplus 12
Electric Distribution Services, Meters, and Line Transformers 69
Electric Energy Account 57
Electric Operating Revenues 37
Electric Operation and Maintenance Expenses 39-42
General Information 3
Generating Station Statistics 58-59
Generating Statistics (Small Stations) 66
Hydroelectric Generating Stations 62-63
Income from Merchandising, Jobbing and Contract Work 51
Income Statement 12
Interchange Power 56
Materials and Supplies 14
Miscellaneous Credits to Surplus 21
Miscellaneous Debits to Surplus 21
Miscellaneous Nonoperating Income 21
Monthly Peaks and Output 57
Municipal Revenues 22
Other Income Deductions 21
Other Utility Operating Income 50
Overhead Distribution Lines Operated 69
Production Fuel and Oil Stocks 18
Purchased Power 22
Purchased Power Detailed (except Interchange) 54-55
Rate Schedule Information 79
Sales for Resale 22
Sales for Resale Detailed 52-53
Sales of Electricity to Ultimate Consumers 38
Schedule of Estimates 4
Signature Page 81
Steam Generating Stations 60-61
Streetlamps 71
Substations 68
Taxes Charged During Year 49
Town Notes 7
Transmission Line Statistics 67
Utility Plant-Electric 15-17
FOR GAS PLANTS ONLY: Page Page
Boilers 75 Purifieers 76
Gas Distribution Services, House Record of Sendout for the Year in MCF 72-73
Governors and Meters 78 Sales for Resale 48
Gas Generating Plant 74 Sales of Gas to Ultimate Customers 44
Gas Operating Revenues 43 Sales of Residuals 48
Gas Operation & Maintenance Expenses 45-47 Scrubbers, Condensers & Exhausters 75
Holders 76 Transmission and Distribution Mains 77
Purchased Gas 48 Utility Plant - Gas 19-20
PAGES INTENTIONALLY OMITTED : 9, 13, 23 TO 36, 80
INDEX
Effective December 1, 2019
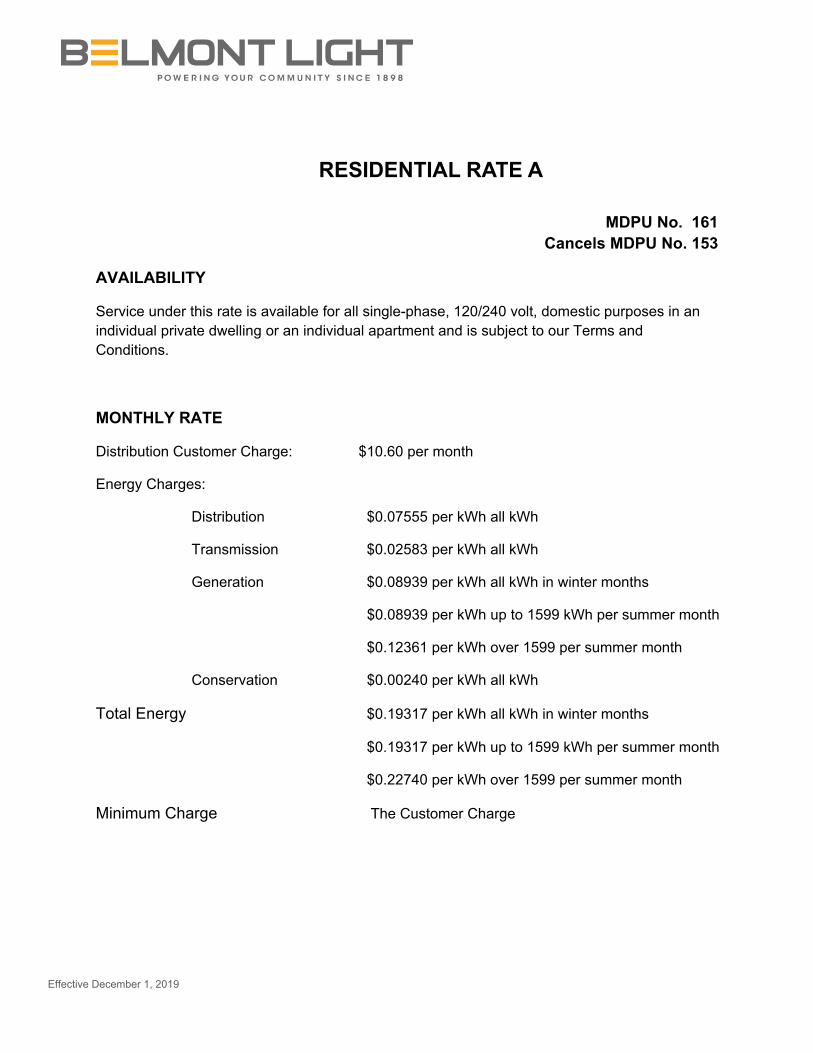
RESIDENTIAL RATE A
MDPU No. 161 Cancels MDPU No. 153
AVAILABILITY
Service under this rate is available for all single-phase, 120/240 volt, domestic purposes in an individual private dwelling or an individual apartment and is subject to our Terms and Conditions.
MONTHLY RATE
Distribution Customer Charge: $10.60 per month
Energy Charges:
Distribution $0.07555 per kWh all kWh
Transmission $0.02583 per kWh all kWh
Generation $0.08939 per kWh all kWh in winter months
$0.08939 per kWh up to 1599 kWh per summer month
$0.12361 per kWh over 1599 per summer month
Conservation $0.00240 per kWh all kWh
Total Energy $0.19317 per kWh all kWh in winter months
$0.19317 per kWh up to 1599 kWh per summer month
$0.22740 per kWh over 1599 per summer month
Minimum Charge The Customer Charge

Effective December 1, 2019
SEASONAL DEFINITION
Winter rates apply to all bills rendered from October 1 through May 31; summer rates apply to all bills rendered from June 1 through September 30.
POWER COST ADJUSTMENTS
In addition to the Monthly Rate above, bills will be adjusted by a charge or credit applied to all kilowatt-hours billed in each month as provided in the Department’s Power Cost Adjustment Clause and is incorporated by reference as a part of this rate schedule.
NYPA POWER COST ADJUSTMENT
Residential customers will receive a credit applied to the first 500 kilowatt-hours billed in each month as provided in the Department’s NYPA Power Cost Adjustment Clause and is incorporated by reference as a part of this rate schedule.
BILLING
When the billing period is for more than one month, the Customer Charge will be multiplied by the number of months.
Any bill for which valid payment has not been received within 45 days from the date rendered shall be considered past due and bear interest on any unpaid balance, including any outstanding interest charges, at a rate of 1½% per month from the date that the bill was considered past due.
TERMS AND CONDITIONS
Until service is terminated on seventy-two hours written notice.
The Department’s "Terms and Conditions", where not inconsistent with any specific provisions hereof, are a part of this rate.
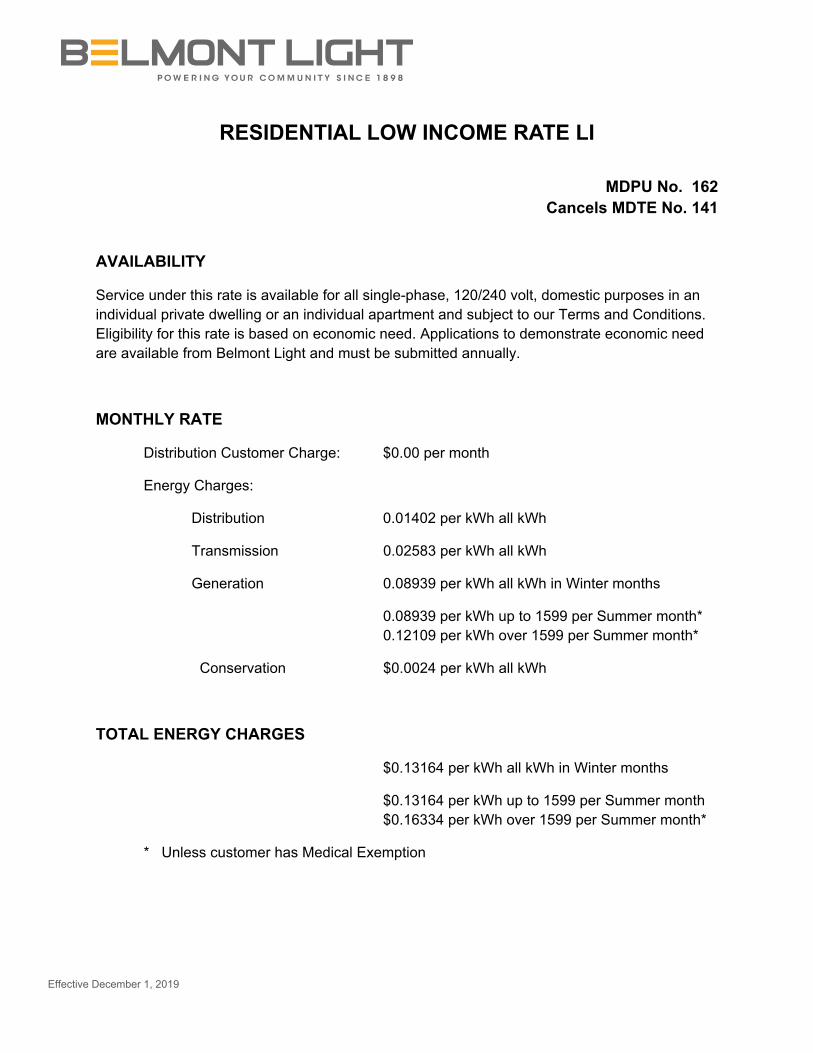
Effective December 1, 2019
RESIDENTIAL LOW INCOME RATE LI
MDPU No. 162 Cancels MDTE No. 141
AVAILABILITY
Service under this rate is available for all single-phase, 120/240 volt, domestic purposes in an individual private dwelling or an individual apartment and subject to our Terms and Conditions. Eligibility for this rate is based on economic need. Applications to demonstrate economic need are available from Belmont Light and must be submitted annually.
MONTHLY RATE
Distribution Customer Charge: $0.00 per month
Energy Charges:
Distribution 0.01402 per kWh all kWh
Transmission 0.02583 per kWh all kWh
Generation 0.08939 per kWh all kWh in Winter months
0.08939 per kWh up to 1599 per Summer month* 0.12109 per kWh over 1599 per Summer month*
Conservation $0.0024 per kWh all kWh
TOTAL ENERGY CHARGES
$0.13164 per kWh all kWh in Winter months
$0.13164 per kWh up to 1599 per Summer month $0.16334 per kWh over 1599 per Summer month*
* Unless customer has Medical Exemption

Effective December 1, 2019
MEDICAL EXEMPTION
If customer demonstrates medical need for usage greater than 1599 kWhs per month, 2nd block generation charge shall not apply, and all usage shall be charge at the generation rate for less than 1600 per month.
SEASONAL DEFINITION
Winter rates apply to all bills rendered from October 1 through May 31; summer rates apply to all bills rendered from June 1 through September 30.
POWER COST ADJUSTMENTS
In addition to the Monthly Rate above, bills will be adjusted by a charge or credit applied to all kilowatt-hours billed in each month as provided in the Department’s Power Cost Adjustment Clause and is incorporated by reference as a part of this rate schedule.
NYPA POWER COST ADJUSTMENT
Residential customers will receive a credit applied to the first 500 kilowatt-hours billed in each month as provided in the Department’s NYPA Power Cost Adjustment Clause and is incorporated by reference as a part of this rate schedule.
BILLING
Any bill for which valid payment has not been received within 45 days from the date rendered shall be considered past due and bear interest on any unpaid balance, including any outstanding interest charges, at a rate of 1½% per month from the date that the bill was considered past due.
TERMS AND CONDITIONS
Until terminated on seventy-two hours written notice.
The Department’s "Terms and Conditions", where not inconsistent with any specific provisions hereof, are a part of this rate.

Effective December 1, 2019
COMMERCIAL RATE B MDPU No. 163
Cancels MDPU No. 154
AVAILABILITY
Service under this rate is available for commercial purposes including stores, banks, offices, churches, schools, halls, and similar places that are used for purposes other than as private residences. Customers with a monthly peak demand within the last 12 months of more than 30 KWs shall be billed on a demand rate. Demand meters will be installed (where they do not currently exist) on customers whose highest monthly measured energy is 10,000 kWhs or greater.
MONTHLY RATE
Distribution Customer Charge: $15.90 per month
And:
For Customers without Demand Meters Energy Charges:
Distribution $0.09408 per kWh
Transmission 0.02323 per kWh
Generation 0.08862 per kWh
Conservation 0.00240 per kWh
TOTAL ENERGY CHARGES $0.20833 per kWh
For Customers with Demand Meters
Energy Charges:
Distribution $0.05745 per kWh
Transmission 0.02236 per kWh
Generation 0.06306 per kWh
Conservation 0.00240 per kWh
TOTAL ENERGY CHARGES $0.14527 per kWh

Effective December 1, 2019
Demand Charges:
Distribution $6.18 per KW
Generation Winter 6.36 per KW
Generation Summer 14.50 per KW
TOTAL DEMAND CHARGES
Winter $12.54 per KW
Summer 20.68 per KW
Minimum Charge: The Customer Charge
DEMAND
The demand for each month under ordinary load conditions shall be the number of kilowatts equal to the greatest 15 minute peak occurring during such month.
SEASONAL DEFINITION
Winter rates apply to all bills rendered from October 1 through May 31; summer rates apply to all bills rendered from June 1 through September 30.
POWER COST ADJUSTMENTS
In addition to the Monthly Rate above, bills will be adjusted by a charge or credit applied to all kilowatt-hours billed in each month as provided in the Department’s Power Cost Adjustment Clause and is incorporated by reference as a part of this rate schedule.
PRIMARY SERVICE ADJUSTMENT
If, at locations where primary distribution voltage is available, the customer desires to furnish, install and maintain transformers and protective devices, a 2.5% discount will be allowed. All metering will be on the primary side of the transformers.
Effective December 1, 2019
BILLING
When the billing period is for more than one month, the Customer Charge will be multiplied by the number of months.
Any bill for which valid payment has not been received within 45 days from the date rendered shall be considered past due and bear interest on any unpaid balance, including any outstanding interest charges, as a rate of 1½% per month from the date that the bill was considered past due.
TERMS AND CONDITIONS
Until service is terminated on seventy-two hours written notice.
The Department’s "Terms and Conditions", where not inconsistent with any specific provisions hereof, are a part of this rate.
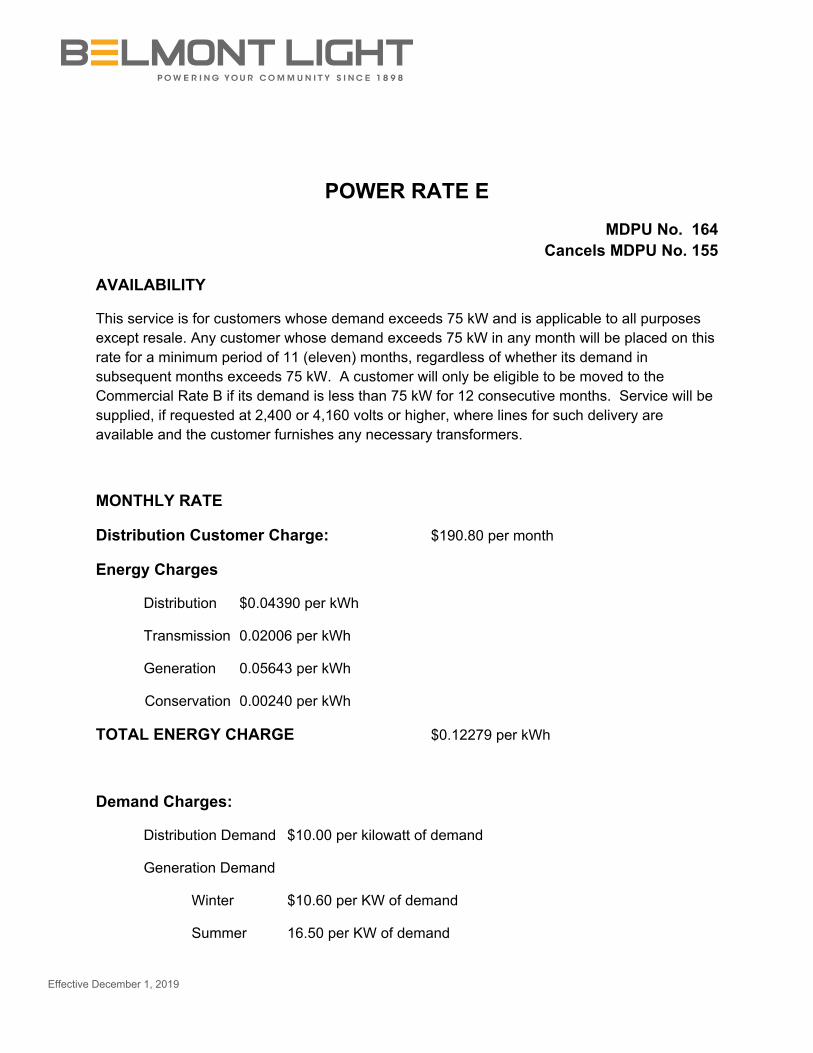
Effective December 1, 2019
POWER RATE E
MDPU No. 164 Cancels MDPU No. 155
AVAILABILITY
This service is for customers whose demand exceeds 75 kW and is applicable to all purposes except resale. Any customer whose demand exceeds 75 kW in any month will be placed on this rate for a minimum period of 11 (eleven) months, regardless of whether its demand in subsequent months exceeds 75 kW. A customer will only be eligible to be moved to the Commercial Rate B if its demand is less than 75 kW for 12 consecutive months. Service will be supplied, if requested at 2,400 or 4,160 volts or higher, where lines for such delivery are available and the customer furnishes any necessary transformers.
MONTHLY RATE
Distribution Customer Charge: $190.80 per month
Energy Charges
Distribution $0.04390 per kWh
Transmission 0.02006 per kWh
Generation 0.05643 per kWh
Conservation 0.00240 per kWh
TOTAL ENERGY CHARGE $0.12279 per kWh
Demand Charges:
Distribution Demand $10.00 per kilowatt of demand
Generation Demand
Winter $10.60 per KW of demand
Summer 16.50 per KW of demand
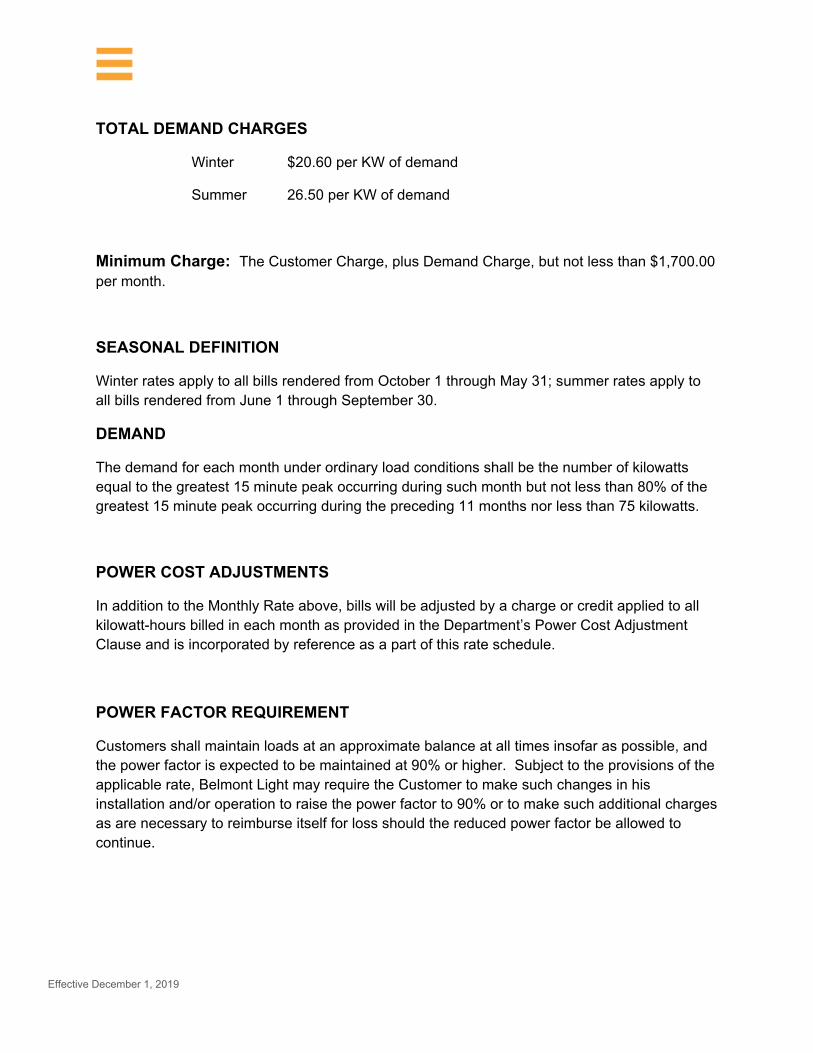
Effective December 1, 2019
TOTAL DEMAND CHARGES
Winter $20.60 per KW of demand
Summer 26.50 per KW of demand
Minimum Charge: The Customer Charge, plus Demand Charge, but not less than $1,700.00 per month.
SEASONAL DEFINITION
Winter rates apply to all bills rendered from October 1 through May 31; summer rates apply to all bills rendered from June 1 through September 30.
DEMAND
The demand for each month under ordinary load conditions shall be the number of kilowatts equal to the greatest 15 minute peak occurring during such month but not less than 80% of the greatest 15 minute peak occurring during the preceding 11 months nor less than 75 kilowatts.
POWER COST ADJUSTMENTS
In addition to the Monthly Rate above, bills will be adjusted by a charge or credit applied to all kilowatt-hours billed in each month as provided in the Department’s Power Cost Adjustment Clause and is incorporated by reference as a part of this rate schedule.
POWER FACTOR REQUIREMENT
Customers shall maintain loads at an approximate balance at all times insofar as possible, and the power factor is expected to be maintained at 90% or higher. Subject to the provisions of the applicable rate, Belmont Light may require the Customer to make such changes in his installation and/or operation to raise the power factor to 90% or to make such additional charges as are necessary to reimburse itself for loss should the reduced power factor be allowed to continue.

Effective December 1, 2019
DISCOUNTS
If the Department, at its option, meters the electricity furnished at 2,300 volts or higher, a discount of 2½% will be allowed from the amount determined under the preceding provisions. In addition, if the customer receives service at high-tension voltage so that the Department is not required to furnish any transformers, there will be credited an amount of $0.31 for each kilowatt of billing demand.
BILLING
Any bill for which valid payment has not been received within 45 days from the date rendered shall be considered past due and bear interest on any unpaid balance, including any outstanding interest charges, as a rate of 1½% per month from the date that the bill was considered past due.
TERMS AND CONDITIONS
Until service is terminated on seventy-two hours written notice.
The Department’s "Terms and Conditions", where not inconsistent with any specific provisions hereof, are a part of this rate.

Effective December 1, 2019
COMMERCIAL HEATING RATE F
MDPU No. 165 Cancels MDPU No. 156
AVAILABILITY
This service is for commercial or industrial customers where permanently installed and Belmont Municipal Light Department approved electric space heating is used exclusively for comfort heating and is metered separately. Air conditioning and non-process water heating may also be included, if electricity is used exclusively for these purposes. All other electrical energy shall be metered separately under the appropriate rate. This rate is not available for resale.
MONTHLY RATE
Distribution Customer Charge: $42.40 per month
Energy Charges
Distribution $0.05221 per kWh
Transmission 0.02236 per kWh
Generation 0.05702 per kWh
Conservation 0.00240 per kWh
TOTAL ENERGY CHARGE $0.13399 per kWh
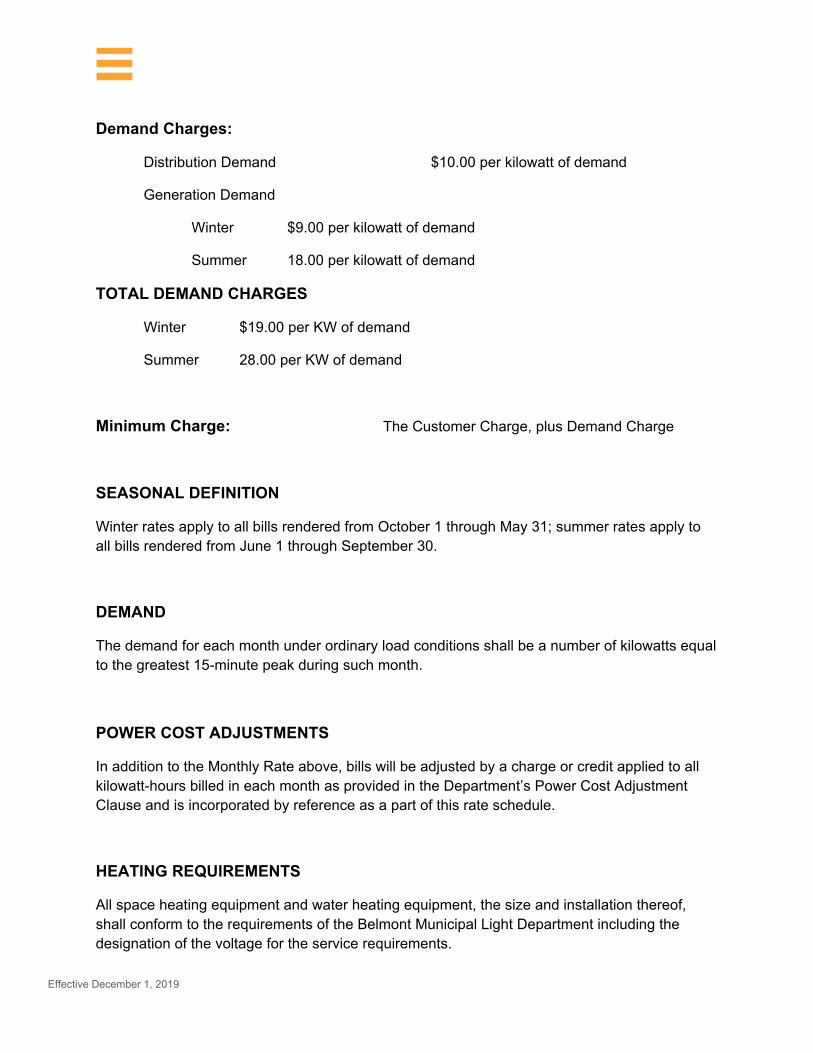
Effective December 1, 2019
Demand Charges:
Distribution Demand $10.00 per kilowatt of demand
Generation Demand
Winter $9.00 per kilowatt of demand
Summer 18.00 per kilowatt of demand
TOTAL DEMAND CHARGES
Winter $19.00 per KW of demand
Summer 28.00 per KW of demand
Minimum Charge: The Customer Charge, plus Demand Charge
SEASONAL DEFINITION
Winter rates apply to all bills rendered from October 1 through May 31; summer rates apply to all bills rendered from June 1 through September 30.
DEMAND
The demand for each month under ordinary load conditions shall be a number of kilowatts equal to the greatest 15-minute peak during such month.
POWER COST ADJUSTMENTS
In addition to the Monthly Rate above, bills will be adjusted by a charge or credit applied to all kilowatt-hours billed in each month as provided in the Department’s Power Cost Adjustment Clause and is incorporated by reference as a part of this rate schedule.
HEATING REQUIREMENTS
All space heating equipment and water heating equipment, the size and installation thereof, shall conform to the requirements of the Belmont Municipal Light Department including the designation of the voltage for the service requirements.

Effective December 1, 2019
BILLING
Any bill for which valid payment has not been received within 45 days from the date rendered shall be considered past due and bear interest on any unpaid balance, including any outstanding interest charges, as a rate of 1½% per month from the date that the bill was considered past due.
TERMS AND CONDITIONS
Until service is terminated on seventy-two hours written notice.
The Department’s "Terms and Conditions", where not inconsistent with any specific provisions hereof, are a part of this rate.
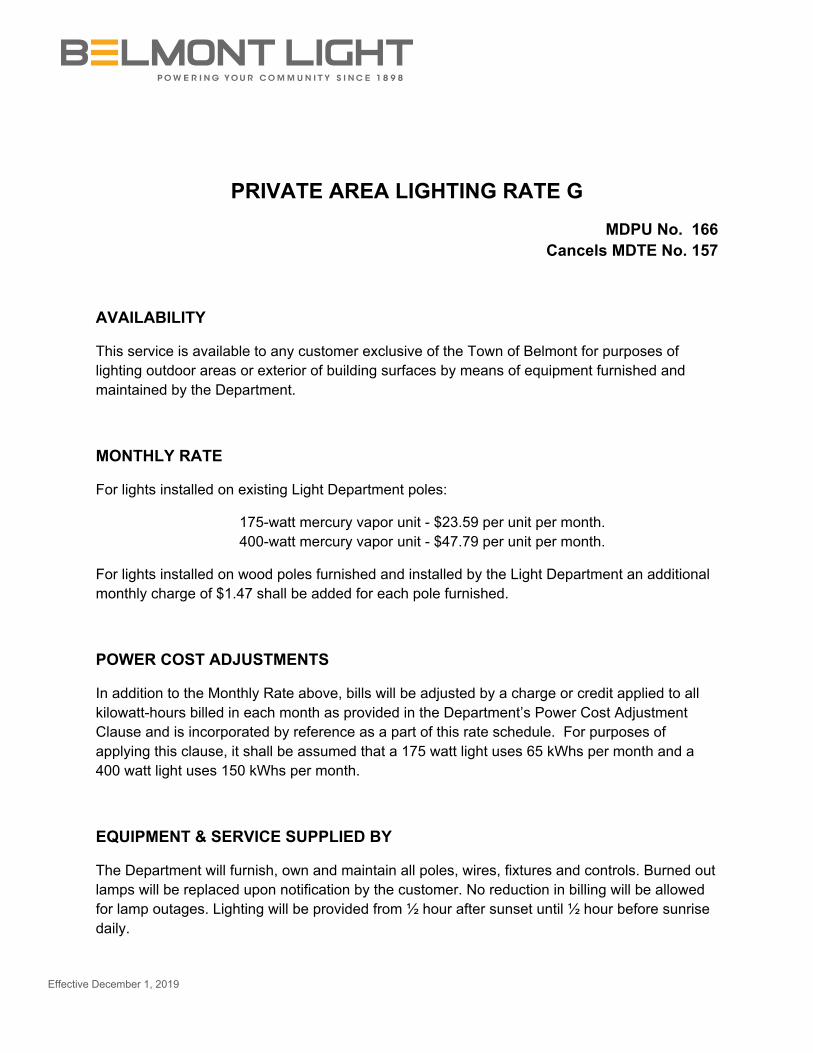
Effective December 1, 2019
PRIVATE AREA LIGHTING RATE G
MDPU No. 166 Cancels MDTE No. 157
AVAILABILITY
This service is available to any customer exclusive of the Town of Belmont for purposes of lighting outdoor areas or exterior of building surfaces by means of equipment furnished and maintained by the Department.
MONTHLY RATE
For lights installed on existing Light Department poles:
175-watt mercury vapor unit - $23.59 per unit per month. 400-watt mercury vapor unit - $47.79 per unit per month.
For lights installed on wood poles furnished and installed by the Light Department an additional monthly charge of $1.47 shall be added for each pole furnished.
POWER COST ADJUSTMENTS
In addition to the Monthly Rate above, bills will be adjusted by a charge or credit applied to all kilowatt-hours billed in each month as provided in the Department’s Power Cost Adjustment Clause and is incorporated by reference as a part of this rate schedule. For purposes of applying this clause, it shall be assumed that a 175 watt light uses 65 kWhs per month and a 400 watt light uses 150 kWhs per month.
EQUIPMENT & SERVICE SUPPLIED BY
The Department will furnish, own and maintain all poles, wires, fixtures and controls. Burned out lamps will be replaced upon notification by the customer. No reduction in billing will be allowed for lamp outages. Lighting will be provided from ½ hour after sunset until ½ hour before sunrise daily.

Effective December 1, 2019
BILLING
Monthly – All rates net.
TERMS AND CONDITIONS
The above rates do not include underground supply, metal poles, and guy with anchor or manual control switches. These items, if required, are to be paid for by the customer. The Department’s "Terms and Conditions", where not inconsistent with any specific provisions hereof, are a part of this rate.
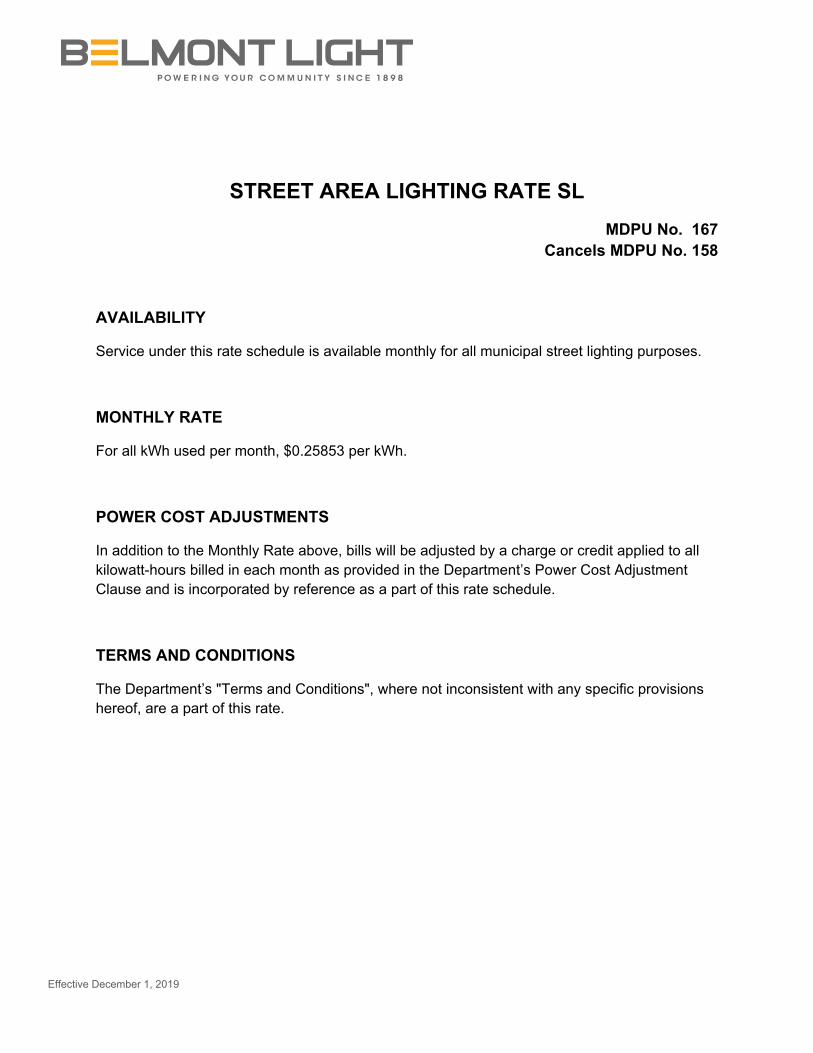
Effective December 1, 2019
STREET AREA LIGHTING RATE SL
MDPU No. 167 Cancels MDPU No. 158
AVAILABILITY
Service under this rate schedule is available monthly for all municipal street lighting purposes.
MONTHLY RATE
For all kWh used per month, $0.25853 per kWh.
POWER COST ADJUSTMENTS
In addition to the Monthly Rate above, bills will be adjusted by a charge or credit applied to all kilowatt-hours billed in each month as provided in the Department’s Power Cost Adjustment Clause and is incorporated by reference as a part of this rate schedule.
TERMS AND CONDITIONS
The Department’s "Terms and Conditions", where not inconsistent with any specific provisions hereof, are a part of this rate.
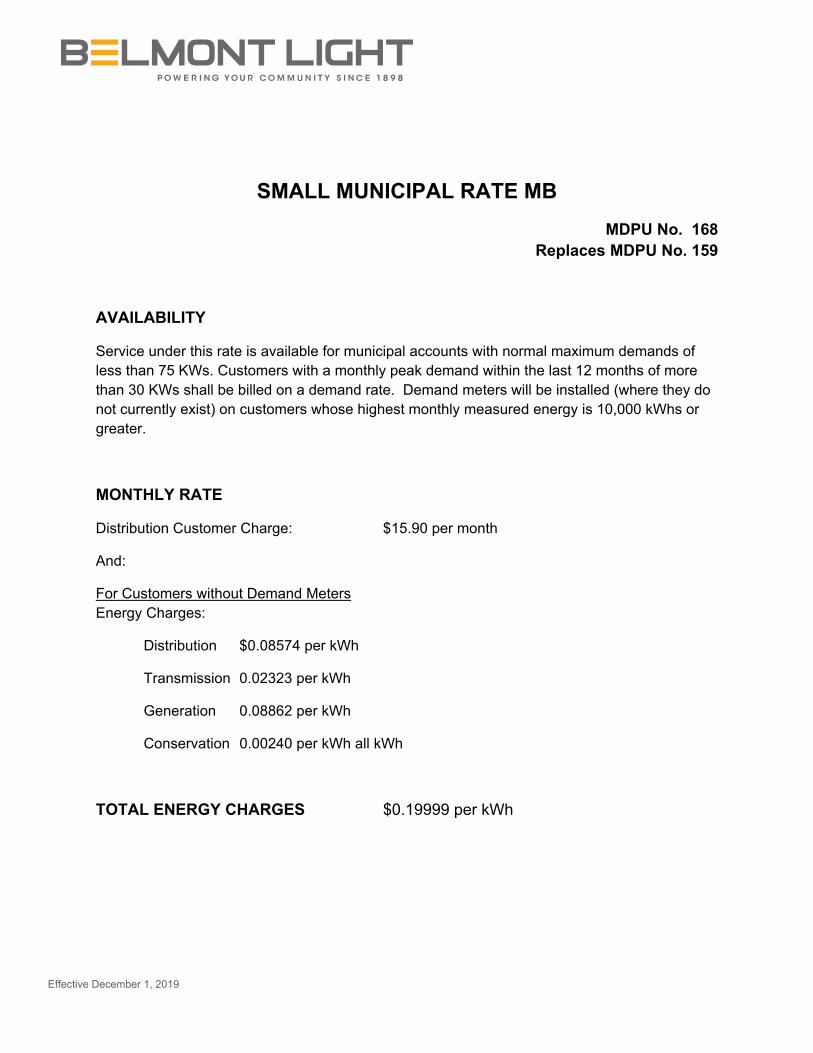
Effective December 1, 2019
SMALL MUNICIPAL RATE MB
MDPU No. 168 Replaces MDPU No. 159
AVAILABILITY
Service under this rate is available for municipal accounts with normal maximum demands of less than 75 KWs. Customers with a monthly peak demand within the last 12 months of more than 30 KWs shall be billed on a demand rate. Demand meters will be installed (where they do not currently exist) on customers whose highest monthly measured energy is 10,000 kWhs or greater.
MONTHLY RATE
Distribution Customer Charge: $15.90 per month
And:
For Customers without Demand Meters Energy Charges:
Distribution $0.08574 per kWh
Transmission 0.02323 per kWh
Generation 0.08862 per kWh
Conservation 0.00240 per kWh all kWh
TOTAL ENERGY CHARGES $0.19999 per kWh

Effective December 1, 2019
For Customers with Demand Meters
Energy Charges:
Distribution $0.05083 per kWh
Transmission 0.02236 per kWh
Generation 0.06306 per kWh
Conservation 0.00240 per kWh all kWh
TOTAL ENERGY CHARGES $0.13865 per kWh
Demand Charges:
Distribution $6.50 per KW
Generation Winter 6.36 per KW
Generation Summer 14.50 per KW
TOTAL DEMAND CHARGES
Winter $12.86 per KW
Summer 21.00 per KW
Minimum Charge: The Customer Charge
DEMAND
The demand for each month under ordinary load conditions shall be the number of kilowatts equal to the greatest 15 minute peak occurring during such month.
SEASONAL DEFINITION
Winter rates apply to all bills rendered from October 1 through May 31; summer rates apply to all bills rendered from June 1 through September 30.
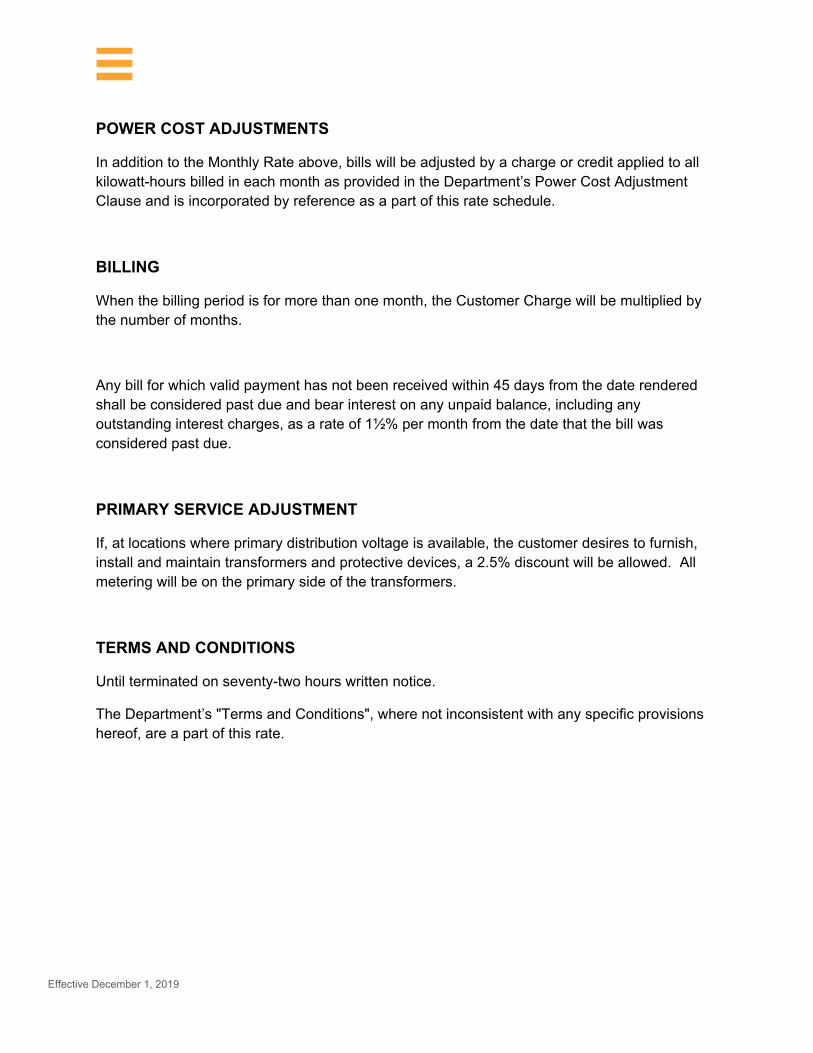
Effective December 1, 2019
POWER COST ADJUSTMENTS
In addition to the Monthly Rate above, bills will be adjusted by a charge or credit applied to all kilowatt-hours billed in each month as provided in the Department’s Power Cost Adjustment Clause and is incorporated by reference as a part of this rate schedule.
BILLING
When the billing period is for more than one month, the Customer Charge will be multiplied by the number of months.
Any bill for which valid payment has not been received within 45 days from the date rendered shall be considered past due and bear interest on any unpaid balance, including any outstanding interest charges, as a rate of 1½% per month from the date that the bill was considered past due.
PRIMARY SERVICE ADJUSTMENT
If, at locations where primary distribution voltage is available, the customer desires to furnish, install and maintain transformers and protective devices, a 2.5% discount will be allowed. All metering will be on the primary side of the transformers.
TERMS AND CONDITIONS
Until terminated on seventy-two hours written notice.
The Department’s "Terms and Conditions", where not inconsistent with any specific provisions hereof, are a part of this rate.
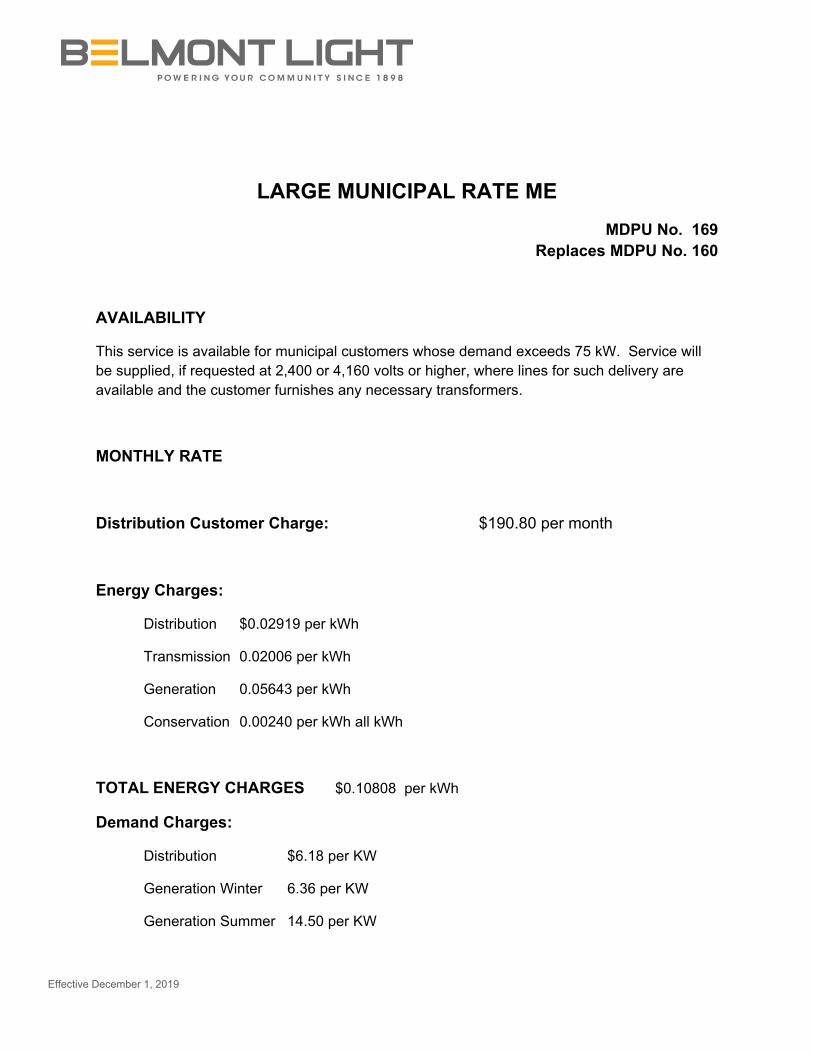
Effective December 1, 2019
LARGE MUNICIPAL RATE ME
MDPU No. 169 Replaces MDPU No. 160
AVAILABILITY
This service is available for municipal customers whose demand exceeds 75 kW. Service will be supplied, if requested at 2,400 or 4,160 volts or higher, where lines for such delivery are available and the customer furnishes any necessary transformers.
MONTHLY RATE
Distribution Customer Charge: $190.80 per month
Energy Charges:
Distribution $0.02919 per kWh
Transmission 0.02006 per kWh
Generation 0.05643 per kWh
Conservation 0.00240 per kWh all kWh
TOTAL ENERGY CHARGES $0.10808 per kWh
Demand Charges:
Distribution $6.18 per KW
Generation Winter 6.36 per KW
Generation Summer 14.50 per KW

Effective December 1, 2019
TOTAL DEMAND CHARGES
Winter $12.54 per KW
Summer 20.68 per KW
DEMAND
The demand for each month under ordinary load conditions shall be the number of kilowatts equal to the greatest 15 minute peak occurring during such month.
SEASONAL DEFINITION
Winter rates apply to all bills rendered from October 1 through May 31; summer rates apply to all bills rendered from June 1 through September 30.
POWER COST ADJUSTMENTS
In addition to the Monthly Rate above, bills will be adjusted by a charge or credit applied to all kilowatt-hours billed in each month as provided in the Department’s Power Cost Adjustment Clause and is incorporated by reference as a part of this rate schedule.
BILLING
Any bill for which valid payment has not been received within 45 days from the date rendered shall be considered past due and bear interest on any unpaid balance, including any outstanding interest charges, as a rate of 1½% per month from the date that the bill was considered past due.
DISCOUNTS
If the Department, at its option, meters the electricity furnished at 2,300 volts or higher, a discount of 2½% will be allowed from the amount determined under the preceding provisions. In addition, if the customer receives service at high-tension voltage so that the Department is not required to furnish any transformers, there will be credited an amount of $0.31 for each kilowatt of billing demand.
TERMS AND CONDITIONS
The Department’s “Terms and Conditions”, where not inconsistent with any specific provisions hereof, are part of this rate.

Effective December 1, 2019
POWER COST ADJUSTMENT CLAUSE
MDPU No. 170 Replaces MDTE No. 149
The Power Cost Adjustment calculated pursuant to this rate schedule is applicable to all energy delivered by Belmont Light. The prices for the above energy assume a base cost for power supply of $0.1144 per kWh. Revenue adjustments are made through the PCA factor to reflect the difference between the actual cost of power supply and the base cost. The PCA factor is applied as required, in order to equate actual power supply costs with revenues collected through the base rate while maintaining a reserve balance to cover short term power supply cost fluctuations.
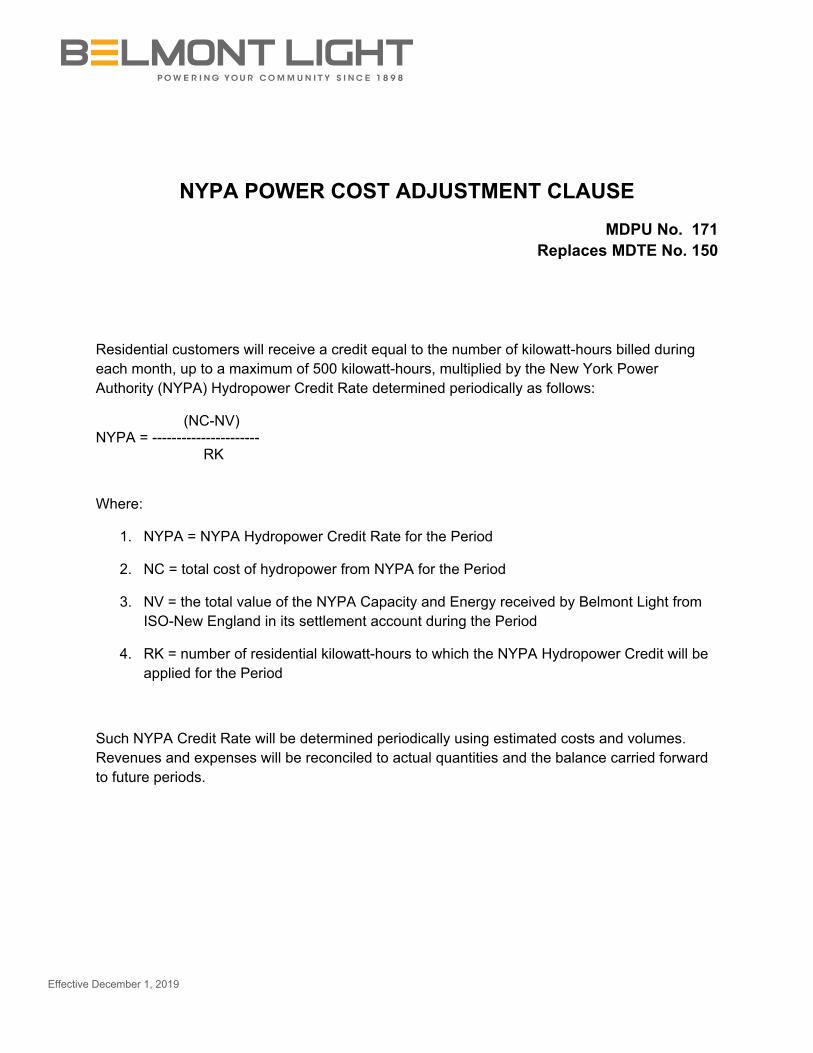
Effective December 1, 2019
NYPA POWER COST ADJUSTMENT CLAUSE
MDPU No. 171 Replaces MDTE No. 150
Residential customers will receive a credit equal to the number of kilowatt-hours billed during each month, up to a maximum of 500 kilowatt-hours, multiplied by the New York Power Authority (NYPA) Hydropower Credit Rate determined periodically as follows:
(NC-NV) NYPA = ---------------------- RK
Where:
1. NYPA = NYPA Hydropower Credit Rate for the Period
2. NC = total cost of hydropower from NYPA for the Period
3. NV = the total value of the NYPA Capacity and Energy received by Belmont Light from ISO-New England in its settlement account during the Period
4. RK = number of residential kilowatt-hours to which the NYPA Hydropower Credit will be applied for the Period
Such NYPA Credit Rate will be determined periodically using estimated costs and volumes. Revenues and expenses will be reconciled to actual quantities and the balance carried forward to future periods.