town of penetanguishene · town of penetanguishene philip h. jones pollution control plant 24 main...
TRANSCRIPT

TOWN OF PENETANGUISHENE
Philip H. Jones Pollution Control Plant
24 Main St.
Certificate # 1303-8H6G8B
ANNUAL REPORT
Wastewater Treatment Division
2013
To:
The Regional Director, South Western Region
Ministry of Environment
TOWN OF PENETANGUISHENE WASTEWATER DIVISION OFFICE (705) 549-8784
REPORTED BY MARK CHARLEBOIS, CHIEF OPERATOR

Executive Summary
The Philip H. Jones pollution control plant (Main W.P.C.P.) performed very well
for 2013 as all annual effluent concentrations and loadings were well within
compliance limits.
Main STP Flow average daily flows increased 8.3% in 2013 and operated at 73 %
of plant rated flows. Combined STP flow averages (Main and Fox) increased
8.4% overall over last year.
There was one small raw bypass (3m3) in August due to heavy rainfall and
reported to SAC (Spills Action Center).
All monthly e-coli C of A objectives/geometric means were met in exception to
(January, February and March) which we believe was partially due to the discovery
of submerged un-sealed manhole covers that connect to the chlorine contact
detention tank, in relation to the construction project which has since be corrected.
The biosolids program ran smoothly with good reserve quantities of land
application sites/NASM plans to be utilized next spreading season.
Main Stp upgrades/expansion are still underway, the project began in late summer
2011 and was expected to reach completion in Aug 2013. There have been a few
delays with the project to date and completion dates are under review at this time.
Did you know since the last plant upgrade of 1993, plant performance
improvements over the past 19 yrs have been significant!!
Total recorded bypass hours in 1985 reported 1,869 hours as compared to only
1.25 hours for 2013.
Main Stp Phosphorus loadings to the bay in 1979 totalled 1,500 kg (3,307 lbs)
whereas in 2013, loadings were a mere 65 kg (143lbs), a 96 % decrease!! MOE
limits are 250 kg/yr since 1994.
i

Table of Contents Page
Executive Summary i
Table of Contents ii
Background iii, iv
Interpretation of monitoring data and analytical results 1-3
Calibration and maintenance of monitoring equipment 4
Maintenance 4
Biosolids storage lagoon 5
Biosolids disposal (sludge to land) 6
Operational problems 6
Evaluation/modifications for plant performance improvements 6
Staffing and Training 7
-Appendices-
-A- Weekly C of A testing
-A-A R1/R2 MOEE annual summary
-A-AA E-coli Geomeans summary
-B- In house tests
-C- Flow meter calibration report
-D- Sludge haulage report
-E- Sludge haulage trends, 5 yr
-F- Metals data, biosolids
-G- Lagoon biosolids data
-H- Scada Report, Annual STP profile
-I- Bypass report
-J- Flows-5 yr averages
-K- Main STP 5 yr flow comparisons
-L- Staffing and Training summary
-M- Fig 2’s field summaries
ii

BACKGROUND
Why build a sewage plant in Penetanguishene?
During the 1950’s, the local secondary school was closed and students were
bussed to the Midland high school. As the Midland school reached capacity in the
1960’s coupled with a high drop-out rate because of the inconvenience of the
bussing situation, council recognized there was a need for a new high school in
Town.
Also, during the 1960’s, there were proposals for the current Town industrial
park at Centennial Drive and two major subdivisions as well.
Prior to 1966, there was no wastewater treatment process in Penetanguishene as
raw sewage discharged directly into the Bay.
In the early 1960, the Ontario Water Resources Commission (now MOEE),
froze all development in Town until a wastewater treatment plant was built to
address the above concerns.
The Town hired former consultant, Dr. Phil Jones to design a wastewater
treatment plant and the class two, contact stabilization/extended aeration module
was originally installed in 1966, with a capacity of 1,500 m3/d.
Chlorine gas was used to disinfect the final effluent prior to discharge into
Penetanguishene Bay (Georgian Bay).
The plant doubled in size to two identical modules in 1974 as populations
increased. Aluminium sulphate (alum) was introduced in order to prevent further
phosphorus discharges into the Bay.
In 1986, a third module was installed but at the current Fox stp location to handle
the Town’s north end flows. Even a four-inch force main pipe was installed at
Main stp to push extraneous bad weather flows to fox stp as required to alleviate
pressure on the Main plant.
Back in the mid 1980’s, Severn Sound was deemed one of 17 ‘Areas of
iii

Concern’, by the Great Lakes Quality Board’. In 1987, Remedial Action Plans
(RAP) was put in place to address Severn Sound water quality concerns.
Although there were several contributing factors relating to degradation of the
water quality in the Sound, it soon became necessary to review historical
performance of all Severn Sound STP’s, which was undertaken by XCG
consultants in 1991. Their report estimated that Total phosphorus loadings to
Severn Sound were more than double the RAP objectives. The XCG report made
recommendations to make improvements/upgrades to the area facilities.
To curb further degradation and eurtrophication threats to Severn Sound, eight area
wastewater treatment plants were reviewed and optimized to lower phosphorus and
solids discharges to the Sound. Both of the Town’s sewage plant compliance
limits were lowered to achieve ultra low-level Total Phosphorus discharges of 0.15
mg/l during the last plant upgrades of 1993/94.
In 1993, Main STP was upgraded and expanded, a new class three modified
conventional facility was put into place. The old contact stabilization modules
were gutted and turned into digestion tanks. Capacity increased from 3,000 m3/d
to 4,545 m3/day. There was also some new technologies (various instrumentation
and scada systems) that replaced older out-dated equipment at Main STP as well.
A third-stage (tertiary) of treatment was also introduced, being the first plant in
Severn Sound to receive a tertiary stage of treatment.
Since the last 1993 expansion, effluent quality has remained excellent and has
played a major role in reductions of phosphorus, solids and BOD loadings to
Penetang Bay. Severn Sound’s designation as a ‘hot-spot/Area of Concern’ was
delisted in 2003!
iv

__________________________________________________________
INTERPRETATION OF MONITORING DATA/ANALYTICAL RESULTS-
MAIN STP
Average annual flow: 3,332 m3/d (73.3% of plant capacity)
Actual peak effluent flow rate average: 5,614 m3/d
Actual peak effluent flow rate, max: 20,994 m3/d (June)
Plant average rated flows: 4,545 m3/d
Main stp max. peak hr. rated flow rate: 13,635 m3/d
Actual highest day’s effluent flow: 8,311 m3/d (March)
Total flow treated (Main stp): 1,216,265 m3
Total flow both Main & Fox: 1,494,093 m3
Raw reported bypasses: one event (august 02, 2013)
Main stp treated 81.4 % of Town total flows, whereas Fox treated only 18.6 % of
the overall Town flows.
The Town’s population was about 9,500 people.
Main stp services residential and all industrial and commercial flows, in exception
to super jail flows that are treated at Fox stp. Mental Health Center (MHC) flows
are treated at their own on-site plant. (See scada report Appendix-H-)
Main STP flows increased 8.3% over 2012 as well as combined STP flows (Main
and Fox) increased 8.4% overall. See 5 yr flow trends and charts Appendix –K-.
-1-

All required influent, final effluent and biosolids samples were submitted to
Caduceon labs in Ottawa (MOEE approved lab) as per C of A. Approximately
2,600 influent and effluent samples were conducted in-house as well as roughly
5,200 mixed liquor tests for both plants.
There was one small primary bypass event reported for 2013 (August) due to
heavy rainfall.
ECOLI:
All monthly and annual MOEE objectives limits of 200 organsims/100 ml sample
were met in exception to the first 3 months of the year. Chlorine chamber
manholes were covered with screening cloth (with plant expansion) that was
discovered to be letting in mud and debris to help prevent chamber contamination
of sediments and corrected by the plant upgrades general contractor.
Note: please see detailed “Lab Data Annual Weekly C of A Testing–Appendix-A-
Total Phosphorus:
Annual average concentration: 0.06 mg/l
RAP objective concentration: 0.10 mg/l
Total loading to Penetang Bay: 66 kg
RAP loading objective: 166 kg
MOEE compliance loading limit: 250 kg/yr
MOEE compliance concentration limit: (0.15 mg/l annual average)
(0.20 mg/l monthly average)
All concentration objectives were met every month; All monthly and annual
average RAP objectives and annual compliance loadings were met.
-2-

TOTAL SUSPENDED SOLIDS:
Annual average concentration: 4.25 mg/l
RAP objective: 5 mg/l
Total loading to Bay: 5,225 kg
RAP objective loading: 23 kg/d (8,395 kg/yr)
MOEE compliance loading limit: 68 kg/d (24,820 kg/yr)
MOEE compliance concentration limit: 15 mg/l
RAP concentration objectives were met every month but May. The plant was well
below annual loading compliance limits.
BOD (biological oxygen demand):
Annual average concentration: 4.0 mg/l
RAP objective: 5 mg/l
Total loading to Bay: 4,764 kg
RAP objective loading: 23 kg/d (8,395 kg/yr)
MOEE compliance limit: 68 kg/d (24,820 kg/yr)
RAP concentration objectives were met every month but August. Annual loading
objectives and compliance limits were met; plant discharged less than a quarter of
compliance limits.
-3-

____________ ________________________________
CALIBRATION AND MAINTENANCE ON MONITORING EQUIPMENT
Calibration of the final effluent flow meter (milltronics OMC3) was verified within
C of A compliance limits. (See Appendix –C- ‘Calibration Reports’).
The confined space gas detection meter was calibrated twice this year as well as
regular monthly bump-testing of the gas detector.
Weekly testing and calibration was performed on the alarmed Total Chlorine
analyser using an in-house DR2000. The Annual average cl2 residual was 0.54
mg/l. (as per Appendix –H- ‘Annual Scada Report’)
Primary bypass alarms were tested monthly using a target under the milltronics
sensor to simulate false wet well levels which record on scada. In conjunction with
this test we also test the proximity switch located in the bypass manhole to confirm
proper activation of the bypass swing gate monthly as well. Both alarms need to
activate before actual bypassing occurs and records on scada.
_____________________________________________________________
MAINTENANCE:
Annual service was performed to the diesel generator set by a certified diesel
mechanic, PowerStation generator service. We also performed the regular
monthly testing on the generator as well, approximately 1 hour/month under load.
Diesel fuel tanks are typically maintained at near-full capacity as per contingency
plans.
An eccentric valve was replaced in the RAS chamber.
Regular maintenance was performed on existing equipment in conjunction with
our electronic m-boss preventative maintenance program schedules.
-4-

___________________________________________________________
BIOSOLIDS STORAGE LAGOON:
Lagoon capacity is about 6,800 m3. Digester total solids averaged about 2.3 %
total solids. Lagoon sampling/testing and mixing as well as haulage and land
application is currently handled by a subcontractor, Region of Huronia
Environmental Services, at their site in Lowell (lagoon rental cell #8).
_____________________________________________________________
BIOSOLIDS DISPOSAL (SLUDGE TO LAND APPLICATION):
Volume hauled (from Main STP) 6,238.40m3
Volume hauled (from Fox STP) 2,382.80 m3
Volume hauled to lagoon (from Main) 4,695.60 m3
Volume hauled from lagoon 7,622 m3
Volume land applied 9,668.8 m3
We currently practice sludge to land techniques using a high-speed aerway
application system and high flotation equipment to minimize soil compaction.
Over the past few years, our sludge hauler (Region of Huronia Environmental) has
implemented the use of a bladder and drag-hose system with a portable collapsible
bladder that acts as temporary field storage unit. The liquid is pumped through a
drag line that is towed by a high flotation tractor that minimizes soil compaction.
This system has been well received by our farming clients. The hauler conducts
field soil sampling and arranges for soil testing and regular lagoon sampling and
testing.
At year end we had six organic soil conditioning site C of A’s and eight NASM
plans.
C of A’s: NASM’s:
1) S2533-157 4) S2531-85 1) 20678 4) 21391 7) 1539
2) S2528-228 5) S2531-132 2) 20781 5) 20710 8) 20409
3) S2533-154 6) S2533-88 3) 20281 6) 20100
-5-
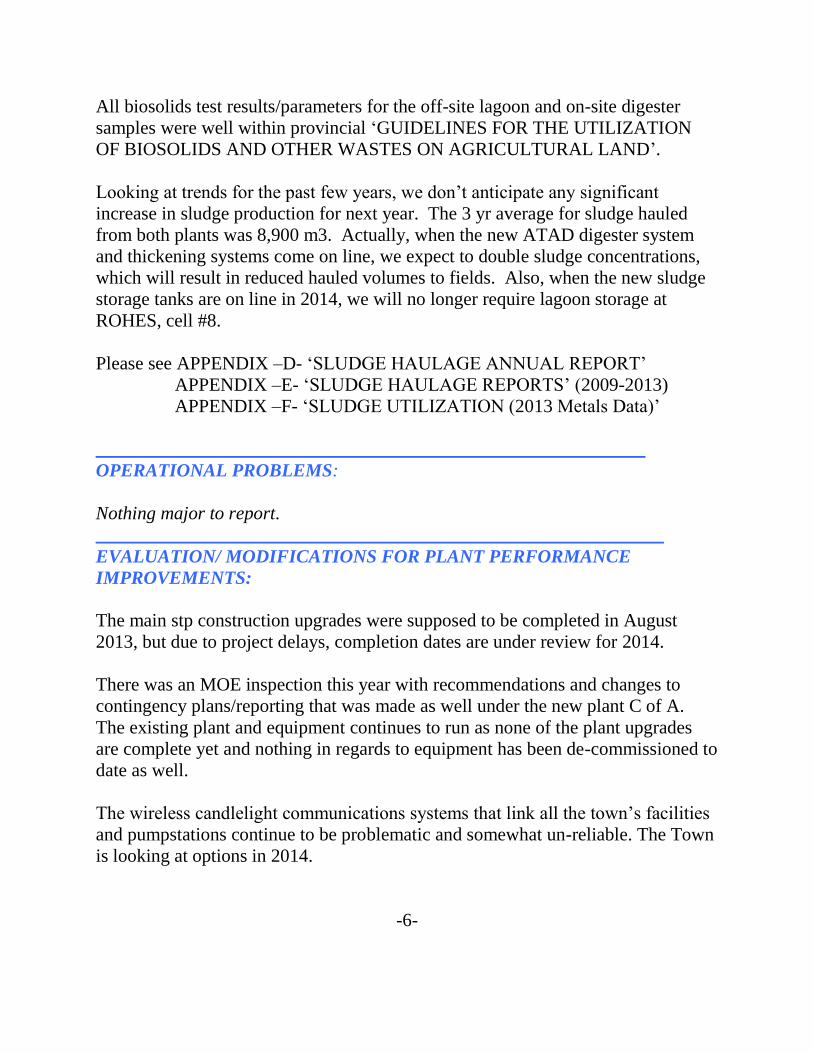
All biosolids test results/parameters for the off-site lagoon and on-site digester
samples were well within provincial ‘GUIDELINES FOR THE UTILIZATION
OF BIOSOLIDS AND OTHER WASTES ON AGRICULTURAL LAND’.
Looking at trends for the past few years, we don’t anticipate any significant
increase in sludge production for next year. The 3 yr average for sludge hauled
from both plants was 8,900 m3. Actually, when the new ATAD digester system
and thickening systems come on line, we expect to double sludge concentrations,
which will result in reduced hauled volumes to fields. Also, when the new sludge
storage tanks are on line in 2014, we will no longer require lagoon storage at
ROHES, cell #8.
Please see APPENDIX –D- ‘SLUDGE HAULAGE ANNUAL REPORT’
APPENDIX –E- ‘SLUDGE HAULAGE REPORTS’ (2009-2013)
APPENDIX –F- ‘SLUDGE UTILIZATION (2013 Metals Data)’
___________________________________________________________
OPERATIONAL PROBLEMS:
Nothing major to report.
_____________________________________________________________
EVALUATION/ MODIFICATIONS FOR PLANT PERFORMANCE
IMPROVEMENTS:
The main stp construction upgrades were supposed to be completed in August
2013, but due to project delays, completion dates are under review for 2014.
There was an MOE inspection this year with recommendations and changes to
contingency plans/reporting that was made as well under the new plant C of A.
The existing plant and equipment continues to run as none of the plant upgrades
are complete yet and nothing in regards to equipment has been de-commissioned to
date as well.
The wireless candlelight communications systems that link all the town’s facilities
and pumpstations continue to be problematic and somewhat un-reliable. The Town
is looking at options in 2014.
-6-

_____________________________________________________________
STAFFING AND TRAINING:
Three full-time class three WWT staff operated both wastewater treatment plants
including Mark Charlebois (ORO/Chief Operator) on a rotational basis, Town of
Penetanguishene. Rotational Duties include operations, maintenance and in-
house lab work.
In Mark’s absence, both Henry Lacroix and Scott Hook accept ORO
responsibilities as per the STP contingency plans.
All full-time staff received the mandatory 40 hrs of related training as per
Appendix –L- Staffing and Training Summary.
-7-

Appendix A
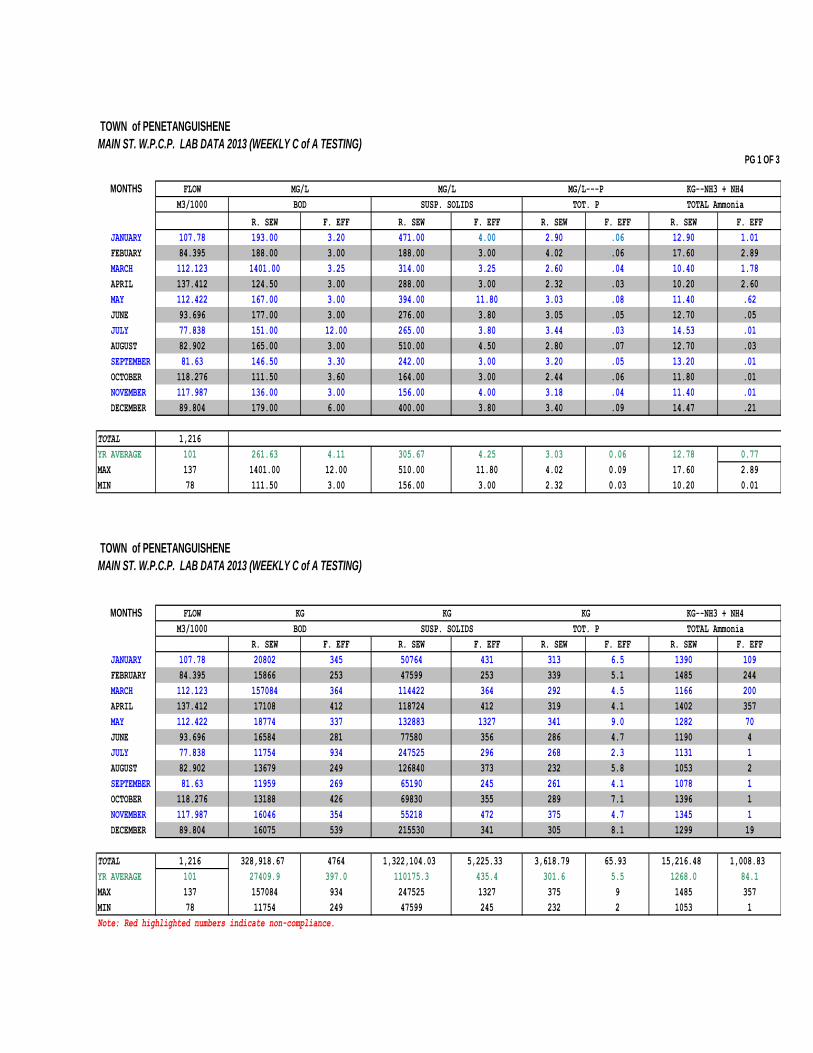
TOWN of PENETANGUISHENE
MAIN ST. W.P.C.P. LAB DATA 2013 (WEEKLY C of A TESTING)PG 1 OF 3
MONTHS FLOW MG/L MG/L MG/L---P KG--NH3 + NH4
M3/1000 BOD SUSP. SOLIDS TOT. P TOTAL Ammonia
R. SEW F. EFF R. SEW F. EFF R. SEW F. EFF R. SEW F. EFF
JANUARY 107.78 193.00 3.20 471.00 4.00 2.90 .06 12.90 1.01
FEBUARY 84.395 188.00 3.00 188.00 3.00 4.02 .06 17.60 2.89
MARCH 112.123 1401.00 3.25 314.00 3.25 2.60 .04 10.40 1.78
APRIL 137.412 124.50 3.00 288.00 3.00 2.32 .03 10.20 2.60
MAY 112.422 167.00 3.00 394.00 11.80 3.03 .08 11.40 .62
JUNE 93.696 177.00 3.00 276.00 3.80 3.05 .05 12.70 .05
JULY 77.838 151.00 12.00 265.00 3.80 3.44 .03 14.53 .01
AUGUST 82.902 165.00 3.00 510.00 4.50 2.80 .07 12.70 .03
SEPTEMBER 81.63 146.50 3.30 242.00 3.00 3.20 .05 13.20 .01
OCTOBER 118.276 111.50 3.60 164.00 3.00 2.44 .06 11.80 .01
NOVEMBER 117.987 136.00 3.00 156.00 4.00 3.18 .04 11.40 .01
DECEMBER 89.804 179.00 6.00 400.00 3.80 3.40 .09 14.47 .21
TOTAL 1,216
YR AVERAGE 101 261.63 4.11 305.67 4.25 3.03 0.06 12.78 0.77
MAX 137 1401.00 12.00 510.00 11.80 4.02 0.09 17.60 2.89
MIN 78 111.50 3.00 156.00 3.00 2.32 0.03 10.20 0.01
TOWN of PENETANGUISHENE
MAIN ST. W.P.C.P. LAB DATA 2013 (WEEKLY C of A TESTING)
MONTHS FLOW KG KG KG KG--NH3 + NH4
M3/1000 BOD SUSP. SOLIDS TOT. P TOTAL Ammonia
R. SEW F. EFF R. SEW F. EFF R. SEW F. EFF R. SEW F. EFF
JANUARY 107.78 20802 345 50764 431 313 6.5 1390 109
FEBRUARY 84.395 15866 253 47599 253 339 5.1 1485 244
MARCH 112.123 157084 364 114422 364 292 4.5 1166 200
APRIL 137.412 17108 412 118724 412 319 4.1 1402 357
MAY 112.422 18774 337 132883 1327 341 9.0 1282 70
JUNE 93.696 16584 281 77580 356 286 4.7 1190 4
JULY 77.838 11754 934 247525 296 268 2.3 1131 1
AUGUST 82.902 13679 249 126840 373 232 5.8 1053 2
SEPTEMBER 81.63 11959 269 65190 245 261 4.1 1078 1
OCTOBER 118.276 13188 426 69830 355 289 7.1 1396 1
NOVEMBER 117.987 16046 354 55218 472 375 4.7 1345 1
DECEMBER 89.804 16075 539 215530 341 305 8.1 1299 19
TOTAL 1,216 328,918.67 4764 1,322,104.03 5,225.33 3,618.79 65.93 15,216.48 1,008.83
YR AVERAGE 101 27409.9 397.0 110175.3 435.4 301.6 5.5 1268.0 84.1
MAX 137 157084 934 247525 1327 375 9 1485 357
MIN 78 11754 249 47599 245 232 2 1053 1
Note: Red highlighted numbers indicate non-compliance.

TOWN of PENETANGUISHENE
MAIN ST. W.P.C.P. LAB DATA 2013 (WEEKLY C of A TESTING)
PG. 2 OF 3
MONTHS FLOW MG/L MG/L MG/L MG/L
M3/1000 TKN SOL. PHOS CONDUCTIVITY ALKALINITY
R. SEW F. EFF R. SEW F. EFF R. SEW F. EFF R. SEW F. EFF
JANUARY 107.78 23.50 1.88 .24 .00 1161.00 1056.00 278.00 132.00
FEBUARY 84.395 29.90 4.31 .70 .03 1205.00 1270.00 303.00 199.00
MARCH 112.123 18.70 2.62 .14 .01 1120.00 1053.00 276.00 187.00
APRIL 137.412 16.90 3.80 .04 .01 1017.00 973.00 252.00 177.00
MAY 112.422 22.90 1.84 .10 .02 988.00 969.00 255.00 168.00
JUNE 93.696 25.00 1.02 .38 .01 1075.00 1010.00 203.00 163.00
JULY 77.838 23.93 .76 .19 .01 1072.00 978.00 280.70 133.00
AUGUST 82.902 22.80 .80 .43 .02 1015.00 973.00 247.00 127.50
SEPTEMBER 81.63 24.50 .76 .43 .01 1105.00 1040.00 267.50 140.00
OCTOBER 118.276 18.80 .40 .01 912.00 820.00 267.00 163.00
NOVEMBER 117.987 976.50 173.50
DECEMBER 89.804 .01 1040.00 138.00
TOTAL 1,216.27
YR AVERAGE 101.355 22.69 1.98 0.31 0.01 1067.00 1013.21 262.92 158.42
MAX 137.412 29.90 4.31 0.70 0.03 912.00 1270.00 303.00 199.00
MIN 77.838 16.90 0.76 0.04 0.00 912.00 820.00 203.00 127.50
TOWN of PENETANGUISHENE
MAIN ST. W.P.C.P. LAB DATA 2013 (WEEKLY C of A TESTING)
MONTHS FLOW KG KG KG KG--N
M3/1000 TKN SOL. PHOS CONDUCTIVITY ALKALINITY
R. SEW F. EFF R. SEW F. EFF R. SEW F. EFF R. SEW F. EFF
JANUARY 107.78 2533 203 26 0 125133 113815.7 29963 14227
FEBRUARY 84.395 2523 364 59 3 101696 107181.7 25572 16795
MARCH 112.123 2097 294 16 1 125578 118065.5 30946 20967
APRIL 137.412 2322 522 5 1 139748 133701.9 34628 24322
MAY 112.422 2574 207 11 2 111073 108936.9 28668 18887
JUNE 93.696 2342 96 36 1 100723 94633.0 19020 15272
JULY 77.838 1863 59 15 1 83442 76125.6 21849 10352
AUGUST 82.902 1890 66 36 1 84146 80663.6 20477 10570
SEPTEMBER 81.63 2000 62 35 1 90201 84895.2 21836 11428
OCTOBER 118.276 2224 0 47 1 107868 96986.3 31580 19279
NOVEMBER 117.987 0 0 0 0 0 115214.3 0 20471
DECEMBER 89.804 0 0 0 1 0 93396.2 0 12393
TOTAL 1,216 22,368.42 1,872.24 286 13 1,069,607.18 1,223,615.80 264,537.83 194,963.18
YR AVERAGE 101 1864.0 156.0 23.8 1.1 89133.9 101968.0 22044.8 16246.9
MAX 137 2574 522 59 3 139748 133702 34628 24322
MIN 78 0 0 0 0 0 76126 0 10352
Note: Red highlighted numbers indicate non-compliance.

TOWN of PENETANGUISHENE
MAIN ST. W.P.C.P. LAB DATA 2013 (WEEKLY C of A TESTING) PG3 OF 3
MONTHS FLOW MG/L MG/L MG/L
M3/1000 CHLORIDES NO3 NO2
R. SEW F. EFF R. SEW F. EFF R. SEW F. EFF R. SEW F. EFF
JANUARY 107.78 141.50 153.70 .74 12.10 .70 .27 7.94 7.83
FEBUARY 84.395 188.00 219.00 1.10 11.20 .65 .50 8.03 8.00
MARCH 112.123 173.00 163.00 1.20 9.15 .30 .30 8.02 7.95
APRIL 137.412 143.00 142.00 1.10 7.15 .55 .30 7.98 8.10
MAY 112.422 130.00 132.00 .30 11.10 .10 1.00 6.93 7.91
JUNE 93.696 131.00 127.00 .15 13.40 .10 .20 7.70 7.90
JULY 77.838 143.30 133.00 .33 15.20 .33 .10 7.84 8.08
AUGUST 82.902 111.00 123.00 .15 18.60 .65 .10 7.60 7.96
SEPTEMBER 81.63 130.50 128.00 .10 15.00 .10 .10 7.69 7.87
OCTOBER 118.276 116.00 163.00 .35 10.75 .50 .10 7.80 7.96
NOVEMBER 117.987 130.00 7.67 7.85
DECEMBER 89.804 156.00 7.70 7.85
TOTAL 1,216
YR AVERAGE 101 140.73 147.48 0.55 12.37 0.40 0.30 7.74 7.9
MAX 137 188.00 219.00 1.20 18.60 0.70 1.00 8.03 8.1
MIN 78 111.00 123.00 0.10 7.15 0.10 0.10 6.93 7.8
TOWN of PENETANGUISHENE
MAIN ST. W.P.C.P. LAB DATA 2013 (WEEKLY C of A TESTING)
MONTHS FLOW KG KG KG
M3/1000 CHLORIDES NO3 NO2
R. SEW F. EFF R. SEW F. EFF R. SEW F. EFF R. SEW F. EFF
JANUARY 107.78 15251 16566 80 1304 75 29.1
FEBRUARY 84.395 15866 18483 93 945 55 42.2
MARCH 112.123 19397 18276 135 1026 34 33.6
APRIL 137.412 19650 19513 151 982 76 41.2
MAY 112.422 14615 14840 34 1248 11 112.4
JUNE 93.696 12274 11899 14 1256 9 18.7
JULY 77.838 11154 10352 26 1183 26 7.8
AUGUST 82.902 9202 10197 12 1542 54 8.3
SEPTEMBER 81.63 10653 10449 8 1224 8 8.2
OCTOBER 118.276 13720 19279 41 1271 59 11.8
NOVEMBER 117.987 0 15338 0 0 0 .0
DECEMBER 89.804 0 14009 0 0 0 .0
TOTAL 1,216 141,782.40 179,200.70 594 11,982.23 407 313
YR AVERAGE 101 11815.2 14933.4 49.5 998.5 33.9 26.1
MAX 137 19650 19513 151 1542 76 112
MIN 78 0 10197 0 0 0 0
Note: Red highlighted numbers indicate non-compliance.
pH

Appendix A-A

Ministry of
the
Environment Annual Report of Municipal Utility Monitoring Program
Mechanical Plants R1
Municipality: Town of Penetanguishene Operating Authority: Town of Penetanguishene
Project Name: W.P.C.P Address: 10 Robert St. West
Address: 24 Main St.
File No. Works Number Data Month Period Year Discharge Type Update Code
46 120000541 Annual 2013 31 2 R 1 2 3 11 16 19 20 21 22 80
CP FLOWS PARAMETER CODE Dec. Monthly Results
01 Total Flow (10 3m3) 50010 3 1216.265
12 13 Avg. Day Flow (10 3m3/d) 50015 3 3.332
Max. Day Flow (10 3m3/d) 50020 3 8.311
30 34 35 38 46
26 BYPASS No. of Occurences
12 13 Plant BypassVol. (10 3m3) 50026 3 0.003 01
Duration (hrs) 80563 1 0.250
Sec. Bypass Vol. (10 3m3) 50040 3 0.000 00
Duration (hrs) 80565 1 0.000 48 51
30 34 35 38 46
03 RAW SEWAGE Monthly Average Results No. of Samples
12 13 BOD (mg/L) 00011 0 160 26
SS (mg/L) 00006 0 306 28
TKN (mg/L) 00020 2 22.69 22
Total P. (mg/L) 00033 1 3.0 27
30 34 35 38 46 48 51
04 FINAL EFFLUENT
12 13 BOD (mg/L) 00001 1 4.1 52
SS (mg/L) 00006 1 4.5 52
AMMONIA (mg/L) 00019 2 0.77 26
TKN (mg/L) 00020 2 1.98 18
Total P. (mg/L) 00033 2 0.06 5230 34 35 38 46 48 51
07 DISINFECTION
12 13 Chlorine Used (kg as Cl2) 50100 total= 1 22.5
Chlorine Dosage (mg/L as Cl2) 80410 Average= 1 2.0
Chlorine Resid. (mg/L as Cl2) 80420 Average= 1 3.1 36530 34 35 38 46 48 51
Operator's Comments: Return completed form to:
Municipal & Private Abatement
54 Cedar Pointe Drive
Unit 1203
Barrie, ON
L4N 5R7

Ministry of
the
Environment Annual Report of Municipal Utility Monitoring Program
Mechanical PlantsR2
Town of Penetanguishene Operating Authority: Town of Penetanguishene
W.P.C.P Address: 10 Robert St. West
24 Main St.
Works Number Data Month Period Year Discharge TypeUpdate Code
120000541 Annual 2013 31 2 R3 11 16 19 20 21 22 80
ADDITIONAL DATA
RAW SEWAGE Dec Monthly Ave. Results No. of Samples
pH (mg/L) 2 24
Ammonia N (mg/L) 2 24
Reactive Phos (mg/L) 2 22
Conductivity (mg/L) 2 22
Alkalinity (mg/L) 2 22
Chloride (mg/L) 2 22
N03 (mg/L) 2 22
N02 (mg/L) 2 22
30 34 35 38 46 48 51
FINAL EFFLUENT Dec No. of Samples
pH (mg/L) 2 25
Reactive Phos (mg/L) 2 21
Conductivity (mg/L) 2 24
Alkalinity (mg/L) 2 23
Chloride (mg/L) 2 24
NO3 (mg/L) 2 22
NO2 (mg/L) 2 22
E-coli /100 ml 2 5230 34 35 38 46 48 51
Operator's Comments: Contact Person's Phone number Return completed form to:
Municipal & Private Abatement
54 Cedar Pointe Drive
Unit 1203
Barrie, ON
L4N 5R7
Parameter Code
7.37
14.66
0.21
923.14
293.04
124.04
0.19
0.20
Parameter Code Monthly Ave. Results
9.06
0.01
953.42
168.46
123.77
73.43
12.90
0.28

Appendix A-AA


Appendix B

IN HOUSE TESTING--2013
PENETANG MAIN STP
INFLUENT PREFILTER
MONTH Sol P # TESTS Tot P # TESTS Ph # TESTS Sol P # TESTS Tot P # TESTS Ph # TESTS Tss # TESTS
(mg/l) (mg/l) (mg/l) (mg/l) (mg/l) (mg/l)
JAN 0.45 3 2.73 3 8.3 3 0.04 3 0.22 3 7.64 3 20.2 3
FEB 0.92 2 4.55 2 8.65 2 0.02 4 0.09 2 7.85 19 6.25 4
MAR 0.2 2 4.05 2 8.41 2 0.02 1 0.24 1 7.66 1 15 1
APR 0.2 2 2.15 2 8.38 2 0.04 3 0.26 3 7.59 3 22.2 3
MAY 0.75 2 2.33 2 8.11 2 0.03 4 0.32 1 7.64 1 13.8 1
JUN 0.65 2 2.98 2 7.91 2 0.05 3 0.17 3 7.5 3 11.1 3
JULY 0.4 3 2.75 3 8.1 3 0.02 1 0.21 1 7.5 1 8.6 1
AUG 0.82 2 2.65 2 7.75 2 0.05 1 0.99 1 7.56 1 22.5 1
SEP 1.21 2 3.04 2 7.92 2 0.05 1 0.31 2 7.23 2 9.9 2
OCT 0.76 2 2.28 2 7.8 2 0.02 2 23.5 2 7.48 2 15.6 2
NOV 0.56 1 3.1 2 7.76 2 0.02 1 0.32 2 7.57 2 15.5 2
DEC 1.39 3 4.2 3 7.86 3 0.03 1 0.9 1 7.48 1 23.8 1
AVER. 0.69 2.17 3.07 2.25 8.08 2.25 0.03 2.08 2.29 1.83 7.56 3.25 15.37 2.00 subtotal
total 26 27 27 25 22 39 24 190
MONTH cl2 res # TESTS Tss # TESTS Sol P # TESTS Tot P # TESTS Temp # TESTS Ph # TESTS NH3 + NH4 # TESTS
(mg/l) (mg/l) (mg/l) (mg/l) C (mg/l)
JAN 0.64 4 4.9 5 0.03 5 0.1 23 11 17 7.79 23 2.88 5
FEB 0.61 5 6.25 4 0.02 4 0.09 19 10.5 15 7.85 19 7.2 4
MAR 0.66 4 2.45 4 0.02 4 0.07 19 7.53 11 7.81 18 6.88 3
APR 0.67 5 1.8 3 0.02 5 0.07 22 11.1 13 7.82 21 7.46 5
MAY 0.31 14 7.5 4 0.03 4 0.08 21 14.8 14 7.79 21 1.52 4
JUN 0.41 7 4 4 0.04 4 0.07 19 18.1 14 7.82 19 0.44 3
JULY 0.42 5 2.4 5 0.02 5 0.07 23 20.9 12 7.81 23 0.62 4
AUG 0.54 5 3.6 5 0.02 5 0.08 21 20.7 14 7.75 21 0.48 3
SEP 0.41 2 2.5 4 0.03 4 0.07 21 19.7 14 7.74 21 0.27 3
OCT 0.52 4 3.6 5 0.02 5 0.07 22 17.8 16 7.7 22 0.5 4
NOV 0.35 22 2.9 4 0.01 4 0.05 19 14.1 13 7.71 19 0.3 3
DEC 0.48 31 2.6 5 0.03 5 0.09 18 11.8 12 7.6 18 1.68 4
AVER. 0.50 3.71 0.02 0.08 14.84 7.77 2.52 subtotal
total 108 52 54 247 165 245 45 916
SECONDARY BIOSOLIDS
MONTH Tss % # TESTS
(mg/l)
JAN
FEB 2.8 1
MAR 2.7 1
APR
MAY
JUN
JULY
AUG
SEP
OCT 2.2 1
NOV Total in-house tests 1109
DEC (excluding mixed liquor)
AVER. 2.57 1.00
total 3
FINAL EFFLUENT

Appendix C


Appendix D

FROM PLANTS
COMBINED
MONTHLY
TOTALS
OUT OF
LAGOON
MONTHLY
TOTALS
MONTHLY
TOTALS
COMBINED
MONTHLY
TOTALS
Hauled to
fields
Hauled to
fields
Monthly totals
from plants to
Total field spread
from lagoon and
plants
MAIN FOX (to lagoon) (MAIN) (FOX) from MAIN from FOX fields
336.00 168.00 504.00 0.00 336.00 168.00 504.00 0.00 0.00 0.00 0.00
588.00 294.00 882.00 0.00 588.00 294.00 882.00 0.00 0.00 0.00 0.00
571.20 162.40 733.60 0.00 571.20 162.40 733.60 0.00 0.00 0.00 0.00
882.00 252.00 1134.00 0.00 882.00 252.00 1134.00 0.00 0.00 0.00 0.00
462.00 252.00 714.00 0.00 462.00 252.00 714.00 0.00 0.00 0.00 0.00
246.40 126.00 372.40 0.00 246.40 126.00 372.40 0.00 0.00 0.00 0.00
0.00 1106.40 714.00 210.00 924.00 714.00 210.00 924.00 2030.40
126.00 126.00 5283.60 0.00 126.00 126.00 0.00 0.00 0.00 5283.60
0.00 1232.00 828.80 294.00 1122.80 828.80 294.00 1122.80 2354.80
0.00 0.00 0.00 0.00 0.00 0.00 0.00 0.00 0.00
756.00 210.00 966.00 0.00 756.00 210.00 966.00 0.00 0.00 0.00 0.00
854.00 288.40 1142.40 0.00 854.00 288.40 1142.40 0.00 0.00 0.00 0.00
4695.60 1878.80 6574.40 7622 6238.40 2382.80 8621.20 1542.80 504.00 2046.80 9668.80
TO LAGOON
FIELD SPREADLAGOON

Appendix E


Appendix F

SEWAGE SLUDGE UTILIZATION DATA -- 2013WASTEWATER TREATMENT PLANT- MAIN ST. - PENETANGUISHENE
Note: Sludge type: Liquid Sludge biosolids
A,M,U,- denotes sludge : Acceptable , Marginal , Unacceptable All data expressed in mg/l
Lab: Caduceon lab
MONTH MDL JAN. FEB MAR APR MAY JUNE JUNE JULY AUG SEP Oct DEC
DAY 8 17 23 27 28 11 6 5 23 ACTUAL MAX. MAX. PERMISS. SLUDGE
LAB. AVERAGE ACCEPTABLE CONC. METAL CONC. SUITABILITY
PARAMETER mg/L mg/L mg/L mg/L mg/L mg/L mg/L mg/L mg/L mg/L mg/L mg/L mg/L mg/kg mg/kg of solids
Arsenic (AS) 0.005 0.1 0.1 0.100 0.1 0.1 0.05 0.1 0.1 0.10 0.09 4 170 A
Cadmium (Cd) 0.03 0.03 0.03 0.030 0.06 0.07 0.03 0.03 0.03 0.03 0.04 2 34 A
Cobalt (Co) 0.03 0.04 0.03 0.030 0.06 0.07 0.03 0.03 0.03 0.03 0.04 2 340 A
Chromium (Cr) 0.01 0.58 0.56 0.700 0.73 0.78 0.41 0.48 0.69 0.77 0.63 28 2800 A
Copper (Cu) 0.01 5.36 4.6 5.47 5.75 5.88 3.24 4.26 6.1 7.25 5.32 231 1700 A
Mercury (Hg) 0.002 0.01 0.008 0.005 0.012 0.01 0.006 0.006 0.013 0.013 0.01 0 11 A
Molybdenum(Mo) 0.05 0.09 0.07 0.07 0.06 0.07 0.06 0.06 0.07 0.08 0.07 3 94 A
Nickel (Ni) 0.05 0.43 0.47 0.55 0.51 0.53 0.28 0.34 0.47 0.39 0.44 19 420 A
Lead (Pb) 0.1 0.30 0.20 0.30 0.50 0.4 0.2 0.2 0.3 0.4 0.31 14 1100 A
Selenium (Se) 0.005 0.1 0.1 0.10 0.100 0.1 0.1 0.1 0.1 0.1 0.10 4 34 A
Zinc (Zn) 0.03 7.59 6.47 8.38 7.66 7.94 4.71 5.98 8.69 8.82 7.36 320 4200 A
Tot.Ammonia 0.01 17.6 6.77 1.79 0.0 5.96 0.25 0.29 3.24 3.67 4.40
TKN 0.05 973 911 823.00 608.00 742 479 594 797 1010 770.78
NH4-N + NO3-N 0.05 52.80 124.77 126.79 93.6 82.76 154.25 238.29 230.24 206.67 145.57
NO3 0.1 35.2 118 125.00 93.6 76.8 154 238 227 203 141.18
NO2 0.01 0.7 1.1 0.40 1.9 3 0.9 0.3 0.2 0.1 0.96
Phosphate 0.01 0.12 0.16 0.37 0.0 0.07 0.3 0.76 0.3 1.18 0.36
Tot.Phosphorus (P) 0.01 524 462 582.00 597 693 349 531 707 753 577.56
Volatile Solids 1 14800 11900 13400 12500 12000 7150 11200 13100 14500 12283
Ecoli 1 270000 43000 120000 10000 10000 40000 19000 30000 110000 72444
Total Solids 10 25900 21900 26200 26000 25200 13800 21500 24800 21700 23000 Permissible Appl. Rate in m3/Ha - 348
Aluminum (Al) 0.05
Antimony (Sb) 0.005
Barium 0.005
Beryllium (Be) 0.01
Bismuth (Bi) 0.1
Mangenese (Mn) 0.005
Strontium (Sr) 0.005
Thallium (Tl) 0.0003
Uranium (U) 0.0003
Vanadium (V) 0.03
Iron (Fe) 0.03
Additional tests for SSEA
NOTE: ACTUAL MAX. ACCEPTABLE CONCEN. = avg. metal conc. x 1000000 / avg. solids conc.
PERMISSIBLE APPL. RATE = 8 X 1000000 / avg. solids conc.

Appendix G


Appendix H


Appendix I


Appendix J

Stp Flows--5 year average daily flows, m3
2009 Main 2010 Main 2011 Main 2012 Main Main
Main Fox Total Peak q Main Fox Total Peak q Main Fox Total Peak q Main Fox Total Peak q Main Fox Total Peak q
Jan 3197 762 3959 7308 3097 628 3725 8708 3523 688 4211 14568 3395 735 4130 8446 3477 857 4334 14567
Feb 3930 816 4746 15781 2902 628 3530 6685 3236 667 3903 8440 3135 720 3855 10238 3014 772 3786 7537
Mar 4487 872 5359 12610 3739 728 4467 6994 4587 823 5410 14699 3848 773 4621 15624 3617 786 4403 11424
Apr 4656 948 5604 13039 3098 676 3774 9724 4327 829 5156 15995 2869 687 3556 6949 4580 897 5477 14826
May 3782 819 4601 13186 2952 663 3615 13499 3680 756 4436 14639 2745 673 3418 10583 3627 790 4417 15469
June 3304 732 4036 15061 3734 761 4495 18024 3007 682 3689 20994 2817 698 3515 13056 3123 761 3884 10896
July 3009 684 3693 15273 3024 703 3727 16985 2641 636 3277 15071 2347 641 2988 12721 2511 679 3190 20994
Aug 2839 649 3488 15880 2746 673 3419 15423 2929 654 3583 14862 2673 718 3391 15806 2624 667 3291 20994
Sept 2835 607 3442 15143 3351 694 4045 16332 2807 626 3433 13008 2882 703 3585 15464 2721 640 3361 9815
Oct 3509 658 4167 18138 3174 677 3851 18115 3522 713 4235 13872 3391 750 4141 20994 3815 774 4589 14144
Nov 3332 629 3961 7866 3336 681 4017 7383 3166 687 3853 18113 3185 767 3952 20988 3933 793 4726 14191
Dec 3286 649 3935 8080 3383 700 4083 17538 3681 768 4449 9203 3277 774 4051 11447 2897 721 3618 9749
Min 2835 607 3442 7308 2746 628 3419 6685 2641 626 3903 8440 2347 641 3556 6949 2511 640 3786 7537
Max 4656 948 5604 18138 3739 761 4495 18115 4587 829 5410 20994 3848 774 4621 20994 4580 897 5477 20994
Annual Average 3514 735 4249 13114 3211 684 3896 12951 3426 711 4136 14455 3047 720 3767 13526 3328 761 4090 13717
% plant capacity: 77.3 49.0 70.3 70.7 45.6 64.4 75.4 47.4 68.4 67 48 62 73 51 68
3 yr averages m3 % capacity Design capacity, m3/d
Main S.T.P. 3267 71.9
Fox S.T.P. 731 48.7
Combined 3998 66.1
2013
1500
6045
4545

Appendix K

0
500
1000
1500
2000
2500
3000
3500
4000
4500
5000
Flo
w,m
3
Month
Main Stp5-year Average daily flows, m3
2009
2010
2011
2012
2013
0
1000
2000
3000
4000
5000
6000
Flow
,m3
Month
Stp's Combined5-year Average daily flows, m3
2009
2010
2011
2012
2013

Appendix L

STP Staff -Training Summary 2013
Mark Charlebois, Chief Operator, Class III WWT, licence # 7289
TRAINING DATE
HRS
WEAO annual conference Toronto April 22-24 16
Wellness day, Town of P-tang Nov 23 7
Sustainable productivity Nov 29 0.75
Safety meeting Mar 26 1.5
Safety meeting Sept 05 1.0
Safety meeting Oct 09 1.0
Contruction project meetings Jan-Dec 23.0
TOTAL
.............................................................................................................50.25 hours
Henry Lacroix, Class III, WWT Licence # 172
Gorman Rupp pump training March 27 7
Compressed Air course powerstream Oct 26 10
Wellness day, town Nov 21 7
Fall arrest protection, midland Nov 22 1.5
Hypochlorination , envirocourses Nov 26-28 21.0
Safety meeting, Town Sept 05, march 26 2.5
Construction site safety meetings Aug 14,sept12,oct 20
3.0
Total----------------------------------------------------------------------------------------------------- 52
hours
Scott Hook, Class III, WWT Licence # 6240
Gorman Rupp pump training March 27 7
Compressed Air course powerstream Oct 26 10
Wellness day, town Nov 21 7
Fall arrest protection, midland Nov 22 1.5
Hypochlorination , envirocourses Nov 26-28 21.0
Safety meeting, Town Sept 05, march 26 2.5
Construction site safety meetings Aug 14,sept12,oct 20 3.0
Burnside septage receiving and treatment June 01 2.0
Advanced treatment-solids disposal Feb 07 1.0
Spectrophotometer dr2500 review lab procedures 0ct 11 1.0
Total----------------------------------------------------------------------------- ------------------- 56 hours