town of stratford, connecticut...comprehensive annual financial report of the town of stratford,...
TRANSCRIPT

TOWN OF STRATFORD, CONNECTICUT
Comprehensive Annual Financial Report
Fiscal Year Ended June 30, 2017


Comprehensive Annual Financial Report
of the
Town of Stratford, Connecticut
Fiscal Year Ended June 30, 2017
Finance Department Jay Wahlberg Finance Director


Contents
Introductory Section - Unaudited
List of Principal Town Officials i
Organizational Chart ii
GFOA Certificate of Achievement for Excellence in Financial Reporting iii
Letter of Transmittal v-ix
Financial Section
Independent Auditor’s Report 1-2
Management’s Discussion and Analysis, Unaudited 3-10
Basic Financial Statements
Exhibit
Government-Wide Financial Statements:
I. Statement of net position (deficits) 11
II. Statement of activities 12
Fund Financial Statements:
Governmental Funds:
III. Balance sheet – governmental funds 13
IV. Reconciliation of the balance sheet – governmental funds to the statement of net position 14
V. Statement of revenues, expenditures and changes in fund balances – governmental funds 15
VI. Reconciliation of the statement of revenues, expenditures and changes in fund balances of the governmental funds to the statement of activities 16
Proprietary Funds:
VII. Statement of net position (deficit) – proprietary funds 17
VIII. Statement of revenues, expenses and changes in fund net position (deficit) – proprietary funds 18
IX. Statement of cash flows – proprietary funds 19
Fiduciary funds:
X. Statement of fiduciary net position – fiduciary funds 20
XI. Statement of changes in fiduciary net position – fiduciary funds 21
Notes to financial statements 22-64
Required Supplementary Information
RSI-1 Schedule of revenues and other financing sources – budget and actual - (non-
GAAP budgetary basis) 65-67
RSI-2 Schedule of expenditures and other financing uses – budget and actual – (non-
GAAP budgetary basis) 68-70
RSI-3 Schedules of employer contributions and funding progress – OPEB 71
RSI-4 Schedule of contributions – OPEB plans 72
RSI-5 Schedule of changes in the town’s OPEB liability and related ratios 73
RSI-6 Schedule of investment returns - defined benefit plan 74
RSI-7 Schedule of changes in the town’s net pension liability and related ratios
defined benefit plan 75
RSI-8 Schedule of town contributions – defined benefit plan 76
RSI-9 Schedule of the town’s proportionate share of the net pension liability teachers
retirement system 77
RSI-10 Note to required supplementary information 78

Contents
Combining and Individual Fund Financial Statements and Other Schedules
General Fund:
A-1 Report of tax collector 79
Nonmajor Governmental Funds:
B-1 Combining balance sheet 81-84
B-2 Combining statement of revenues, expenditures and changes in fund
balances (deficits) 85-88
Capital Projects Fund:
C-1 Project combining balance sheet 89
C-2 Project combining statement of revenues, expenditures and changes in fund
balances 90
Enterprise Funds:
D-1 Combining statement of net position 91
D-2 Combining statement of revenues, expenses and changes in fund net
position 92
D-3 Combining statement of cash flows 93
Internal Service Funds:
E-1 Combining statement of net position (deficit) 95
E-2 Combining statement of revenues, expenses and changes in fund net
position (deficit) 96
E-3 Combining statement of cash flows 97
Fiduciary Funds:
F Combining statement of changes in assets and liabilities – agency funds 99
Statistical Section - Unaudited
Table Financial Trends:
1 Net position by component 101
2 Changes in net position 102-105
3 Fund balances, governmental funds 106
4 Changes in fund balances, governmental funds 107
Revenue Capacity:
5 Assessed value and estimated actual value of taxable property 108-109
6 Property tax levies and collections 110
7 Principal property taxpayers 111
Debt Capacity:
8 Ratios of outstanding debt by type 112
9 Direct and overlapping governmental activities debt 113
10 Ratios of general bonded debt outstanding 114
11 Computation of legal debt limitation 115
12 Legal debt margin information 116
Demographic and Economic Statistics:
13 Demographic and economic statistics 117
14 Principal employers 118
Operating Information:
15 Full-time equivalent town government employees by function/program 119
16 Operating indicators by function/program 120
17 Capital asset statistics by function/program 121

Introductory Section


i
TOWN OF STRATFORD, CONNECTICUT
PRINCIPAL TOWN OFFICIALS
John A. Harkins, Mayor
TOWN COUNCIL
Beth Daponte, Council Chair
Scott Farrington-Posner
Wali Kadeem
David L. Harden
Gregory Cann Philip L. Young
Marianne E. Antezzo J. Vincent Chase
Alan Llewelyn Tina M. Manus
BOARD OF EDUCATION
Chair ...................................................................................... James Feehan Vice-Chair .............................................................................. Leonard Petruccelli Secretary ............................................................................... Theresa Sheehy Board Member………………………………………………….… Christian Barnaby Board Member ....................................................................... Maria Buturla Board Member ....................................................................... Susan Lance Board Member ....................................................................... Eric Lazaro Executive Assistant to the Superintendent & Board Secretary Teresa Lycoudes
Dr. Janet M. Robinson, Superintendent of Schools
ADMINISTRATION
Chief Administrative Officer ..................................................... Christopher Tymniak Finance Director ...................................................................... Jay Wahlberg Town Clerk ............................................................................... Susan Pawluk Treasurer ................................................................................. Marie Craig Assessor .................................................................................. Melinda Fonda Tax Collector ............................................................................ Deborah Heim Town Attorney .......................................................................... Christopher Hodgson

ii
Operations Coordinator
RESIDENTS OF STRATFORD
Mayor
Chief Administrative
Officer
Finance Director
Purchasing
Assessor
Tax Collector
Accounting and Treasury
Assistant Finance Director
Director of Economic
Development
Community Development
Planning and Zoning
Building Department
Director of Human Resources
Information Technology
Town ClerkDirector of
Public Works
Recreation
Parks
Highway
WPCA
Fleet Maintenance
Sanitation
Building Maintenance
Engineering
Conservation
Director of Health
Community Services
Senior Services
Health
Administrative Assistant
Chief of Staff
Constituent Service
Coordinator
Executive Assistant to the Mayor
Town Attorney
ParalegalLegal Assistant
Director of Public Safety
Chief of Police
Chief of Fire
Director of EMS
Director of Emergency
Management
Communications/ Dispatch

iii

iv
This page intentionally left blank.

v
December 20, 2017
Honorable John A. Harkins, Mayor Honorable Town Council Members Town of Stratford, Connecticut
Connecticut law requires that all general-purpose local governments publish at the end of each fiscal year a complete set of audited financial statements. This report fulfills that requirement for the fiscal year ended June 30, 2017. Management assumes full responsibility for the completeness and reliability of the information contained in this report, based upon a comprehensive framework of internal controls that it has established for this purpose. The cost of the internal control should never exceed anticipated benefits; therefore, the objective is to provide a reasonable, rather than absolute, assurance that the financial statements are free of any material misstatements. RSM US LLP, Certified Public Accountants, have issued an unmodified (“clean”) opinion on the Town of Stratford, Connecticut’s financial statements for the year ended June 30, 2017. The independent auditors’ report is located at the front of the financial section of this report. Management’s Discussion and Analysis (MD&A) immediately follows the independent auditors’ report and provides a narrative introduction, overview and analysis of the basic financial statements. The MD&A is intended to complement this letter of transmittal and should be read in conjunction with it. Town Profile English settlers founded the Town of Stratford in 1639, making it the eighth town in the State of Connecticut. Located thirteen miles west of New Haven and adjacent to Bridgeport to the west, Milford to the east, Long Island Sound to the south and Shelton to the north, the Town is located 65 miles east of New York City and 50 miles southwest of Hartford, Connecticut. The Town encompasses approximately 18.7 square miles within Fairfield County. The Town is traversed by two major highways, the Merritt Parkway (Route 15) and the Connecticut Turnpike (Interstate 95). Metro-North and Amtrak provide rail service to Boston and New York. Sikorsky Memorial Airport is located within Stratford. It provides various services to both private industry and commuters to New York’s major airports. The Town is a member of the Greater Bridgeport Transit District that operates more than fifty buses on sixteen routes that include the Towns of Stratford, Fairfield, Trumbull and the City of Bridgeport. Stratford is a balanced community of residential, waterfront and rural areas, retail and commercial development and major industrial plants. The large selection of affordable homes is one reason many companies have located here. The Town has more land zoned for industry than any other town in the State of Connecticut, almost all of which is within five minutes of either Interstate 95 or the Merritt Parkway. The Stratford Industrial Park, a 240 acre site, is located one half mile from Interstate 95 and Sikorsky Airport. The Town’s public school system provides a balanced curriculum for 7,045 students. There are several vocational training facilities, colleges and universities in close proximity to Stratford, which offer a variety of educational programs. The public school system consists of three schools for pupils in grades Pre-K through 6, five schools for pupils in grades K through 6, two schools for pupils in grades 7-8 and two schools for pupils in grades 9-12. The schools are governed by a seven-member elected Board of Education. The Town’s location on Long Island Sound provides residents with three public beaches, five marinas, a fishing pier and public launch ramp. In addition, Roosevelt Forest and Boothe Memorial Park are ideal for hiking, picnics and cross-country skiing during winter.

vi
The Town offers a variety of cultural attractions, including the Square One Theater and the Sterling House Community Center which offer low cost, high quality programs. The Town currently operates under and is governed by the laws of the State of Connecticut and its own charter. The Town operated under a Council-Manager form of government from 1921 to 2005. As a result of charter revision, effective December 12, 2005, the Town became a Mayor-Council form of government with the election of Stratford’s first Mayor and ten council members. The Town provides a full range of services including public safety, street maintenance, sanitation, health and human services, public parks and recreation, library, education, culture, public improvement, planning, zoning, sewer and general administrative services. Town Local Economy Stratford is strategically located between New York City and Boston and has excellent transportation access that has attracted and sustained economic development over the years. Stratford is bisected by both Interstate 95 and Metro North rail service lines. The Merritt Parkway and Routes 8 and 25 offer convenient access to the entire Northeast corridor. Stratford has over 17 miles of coastline, 400 acres of forest, beautiful parks and a rich cultural heritage creating a unique quality of life for our multi-generational residents. Stratford's diverse community of over 53,000 residents offers world class employers, a highly skilled workforce, excellent transportation access and affordable living. Economic activity is vibrant in the Town of Stratford, the Town continues to attract owners of all types of businesses (from medical, personal and household services to office, retail, wholesale and dining establishments) that choose the Town of Stratford for it’s diverse zoning, geographic advantages and as an affordable location in Fairfield County. The unemployment rate has dropped from 8.3% in October of 2013 as compared to 5% in October of 2017. On December 4, 2017, Lockheed Martin announced Sikorsky Aircraft workers ratified a new five-year contract covering the Lockheed Martin subsidiary’s main helicopter manufacturing plant in here in Stratford. We continue to work with multiple Federal and State agencies in support of Sikorsky Aircraft, Stratford’s largest employer, updating road infrastructure in preparation for the expected growth of more than 8,000 new workers within the next decade. Stratford will benefit from Lockheed’s agreement to increase its spending of $350,000,000 a year, solely with Connecticut suppliers. We are aggressively looking to market Sikorsky suppliers knowing they have a major positive economic impact for Stratford.
Stratford’s former Army Engine Plant, a 77 acre waterfront property, has received grants of more than $900,000 from the State of CT for “predevelopment planning and environmental compliance analysis” for the Point Stratford Renewal project. The Army Corps, Department of Defense and Connecticut’s Department of Energy & Environmental Protection (DEEP) have a timeline for the remediation of the site and transfer of the property. A Special Tax District has been created as well as a Waterfront Redevelopment District. Stratford’s Transit Oriented District (TOD) has a major development in the heart of downtown, next to the Metro North Railroad. The 3.6 acre former school site received a $1,200,000 grant from the State of Connecticut Department of Economic and Community Development (DECD) for demolition and abatement to be completed in 2018. The new development will include mixed use. Four additional TOD projects include two approved developments, one which is currently underway and two more going before zoning in 2018. These projects will generate major tax revenues. Two Roads Brewing Company is a major destination not only in Stratford but in the State of Connecticut. In 5 years they have grown to over 100 employees. They are currently building a brand new $12,000,000, 25,000 square foot building, doubling their size. The new facility will bring in added jobs. Additionally, on Stratford Avenue where Two Roads is located, the Town has a streetscape project underway, creating a

vii
whole new corridor along the “doorway to Stratford” with improvements not seen since the industrial revolution. The United States Environmental Protection Agency’s comprehensive cleanup plan for Stratford’s Raymark Industries Inc., Superfund Sites is underway with shovels in the ground. The EPA and State of Connecticut have committed to investing $95,000,000 to clean up the community, opening up tax revenue opportunities for the first time in 25 years. A 10.5 acre, Town owned brownfield property was awarded a $2,850,000 grant from Connecticut Department of Economic and Community Development (DECD) to remediate and demolish the site which lies within the TOD. This major site is cleaned up and ready for development. Ryder’s Landing is a major development coming before zoning in 2018 including a hotel/conference center and an open walkway along the Housatonic River. This upcoming project is located next to Lockheed Martin (Sikorsky). Stratford is partnering with CT Department of Transportation to update the state highway along the main corridor including Lockheed Martin and the proposed development. The United Illuminating Sub-Station is set to open in the end of 2018, generating $775,000 in additional tax revenues annually. The aforementioned major developments that have been highlighted in addition to the many businesses that continue to bypass lower Fairfield County and choose Stratford, will positively contribute to our Grand List in coming years. Recent Town Operations The Town, through its elected and administrative officials, continues to take steps to review, redefine and restructure various approaches in policy and management in order to effectively manage critical issues. The following are some of the operational and fiscal control measures implemented in the last several months by the Town. The Town has a Fiscal Year 2017-2018 operating budget that was delayed this year because of the challenges with the State of Connecticut budget issues. During budget meetings, every department head was asked to review each program, analyze expenditures and to justify all budget deviations from the prior year to the Chief Administrative Officer, Mayor, Director of Finance and Human Resources Director. On the revenue side of the budget, the final budget incorporated all the changes on the State Intergovernmental Revenues. Annually the Town prepares a Five Year Capital Improvement & Equipment Program, which is reviewed by the Town Council. The Five Year Capital Improvement and Equipment Program includes various projects and equipment purchases totaling $116,601,250 for the five-year period beginning with Fiscal Year 2018 and ending with Fiscal Year 2022. The Town is currently undertaking a major school improvement project. The school project consists of comprehensive renovations and/or additions at the existing Stratford High School. The project will include complete new or like new construction of building envelope renovation, reconfiguration of existing spaces to maximize efficiency, additional science classrooms, gym facilities, media center, auditorium HVAC, energy efficiency and related site improvements. Renovation to Stratford High School will cost $126,000,000. The town’s portion of the renovation will be $52,600,000 and the remaining costs will be covered by state reimbursements. For more information regarding recent Town operations refer to the Management Discussion & Analysis section within.
viii
Recent Financial Results For the fiscal year ended June 30, 2017, the General Fund ended in a year-end operating surplus of $988,803. The Town’s cost control efforts include the continuance of monitoring all overtime and review of bi-weekly expenses with department heads in order to enhance fiscal operations. Although there are some unknowns heading into Fiscal Year 2017-18, including ongoing union negotiations with Town’s collective bargaining units and worker’s compensation cases; however, the Town will endeavor to control spending, reach its collection goals, and strive to achieve balanced operations and to manage today into tomorrow. For more information regarding recent Town operations refer to the Management Discussion & Analysis section within. Town Organization From 1921 until 2005, the Town of Stratford operated under a Council-Manager form of government. In November 2003, the electors of the Town approved a referendum authorizing a revision to the Charter requiring a change to a Mayor-Council form of government. The new form of government took effect on December 12, 2005 when the Town’s first Mayor was sworn into office. The Mayor is a full time, compensated, elected official with a term of four (4) years. The Mayor is recognized as the head of the Town and appoints all department heads including the Town Attorney, appoints citizens to commissions, prepares the budget, establishes criteria for evaluation of subordinates, and signs or vetoes legislation passed by the Town Council. This power includes the ability to veto a specific line item within proposed operating budgets. The Mayor’s attendance at all Council meetings is required, but the Mayor is not able to vote unless to break a tie vote of the Town Council. A Chief Administrative Officer (the "CAO") is appointed by the Mayor, and assists the Mayor with budget preparation, labor negotiations, and any other areas deemed appropriate by the Mayor. A bipartisan Town Council of ten members, who are elected for two-year terms, performs the legislative function. The Town Council approves the annual budget, supplemental appropriations and bond authorizations. Policies and Practice Debt In Fiscal Year 2017, the Town continued to pay principal and interest payments on its Pension Obligation Bonds directly from the General Fund. On January 4, 2017, the Town issued $25,260,000 of general obligation bonds and $25,000,000 of general obligation bond anticipation notes. The bonds will mature through 2036 and the issue was all new money. The Bond Anticipation Note will redeem in 2018 with the issue designated for the funding of the Stratford High School project. Taxes During the fiscal year ended 2017, the Town collected 97.69% of its current tax levy. Property taxes levied increased by $8,482,510 over the prior year. The current year tax collections totaled $168,761,349 with the arrear taxes and interest collected was $4,575,675.

ix
Acknowledgements I would like to thank RSM US LLP., our independent auditors, for their professional guidance, assistance, and their helpful comments and suggestions. Also, I would like to give special thanks to my staff that put in numerous hours and assistance for the preparation of this report. In closing, without the leadership and support of the Town administration and the assistance of various Town departments, preparation of this report would not have been possible. Respectfully Submitted,
Jay E. Wahlberg
Jay E. Wahlberg, Finance Director

x
This page intentionally left blank.

Financial Section

1
Independent Auditor’s Report To the Members of the Town Council Town of Stratford, Connecticut Report on the Financial Statements We have audited the accompanying financial statements of the governmental activities, the business-type activities, each major fund and the aggregate remaining fund information of the Town of Stratford, Connecticut, as of and for the year ended June 30, 2017, and the related notes to the financial statements, which collectively comprise the Town of Stratford, Connecticut’s basic financial statements as listed in the table of contents. Management’s Responsibility for the Financial Statements Management is responsible for the preparation and fair presentation of these financial statements in accordance with accounting principles generally accepted in the United States of America; this includes the design, implementation and maintenance of internal control relevant to the preparation and fair presentation of financial statements that are free from material misstatement, whether due to fraud or error. Auditors’ Responsibility Our responsibility is to express opinions on these financial statements based on our audit. We conducted our audit in accordance with auditing standards generally accepted in the United States of America and the standards applicable to financial audits contained in Government Auditing Standards, issued by the Comptroller General of the United States. Those standards require that we plan and perform the audit to obtain reasonable assurance about whether the financial statements are free of material misstatement. An audit involves performing procedures to obtain audit evidence about the amounts and disclosures in the financial statements. The procedures selected depend on the auditors’ judgment, including the assessment of the risks of material misstatement of the financial statements, whether due to fraud or error. In making those risk assessments, the auditors consider internal control relevant to the entity’s preparation and fair presentation of the financial statements in order to design audit procedures that are appropriate in the circumstances, but not for the purpose of expressing an opinion on the effectiveness of the entity’s internal control. Accordingly, we express no such opinion. An audit also includes evaluating the appropriateness of accounting policies used and the reasonableness of significant accounting estimates made by management, as well as evaluating the overall presentation of the financial statements. We believe that the audit evidence we have obtained is sufficient and appropriate to provide a basis for our audit opinions. Opinions In our opinion, the financial statements referred to above present fairly, in all material respects, the respective financial position of the governmental activities, the business-type activities, each major fund and the aggregate remaining fund information of the Town of Stratford, Connecticut, as of June 30, 2017 and the respective changes in financial position and, where applicable, cash flows thereof for the year then ended in accordance with accounting principles generally accepted in the United States of America.

2
Other Matters Required Supplementary Information Accounting principles generally accepted in the United States of America require that the management’s discussion and analysis, the budgetary information, the schedules of employer contributions and funding progress- OPEB, and the pension-related schedules as listed in the table of contents, be presented to supplement the basic financial statements. Such information, although not a part of the basic financial statements, is required by the Governmental Accounting Standards Board, who considers it to be an essential part of financial reporting for placing the basic financial statements in an appropriate operational, economic or historical context. We have applied certain limited procedures to the required supplementary information in accordance with auditing standards generally accepted in the United States of America, which consisted of inquiries of management about the methods of preparing the information and comparing the information for consistency with management’s responses to our inquiries, the basic financial statements and other knowledge we obtained during our audit of the basic financial statements. We do not express an opinion or provide any assurance on the information because the limited procedures do not provide us with sufficient evidence to express an opinion or provide any assurance.
Other Information Our audit was conducted for the purpose of forming opinions on the financial statements that collectively comprise the Town of Stratford, Connecticut’s basic financial statements. The introductory section, the combining and individual fund financial statements and other schedules, and statistical section are presented for purposes of additional analysis and are not a required part of the basic financial statements.
The combining and individual fund financial statements and other schedules are the responsibility of management and were derived from and relate directly to the underlying accounting and other records used to prepare the basic financial statements. Such information has been subjected to the auditing procedures applied in the audit of the basic financial statements and certain additional procedures, including comparing and reconciling such information directly to the underlying accounting and other records used to prepare the basic financial statements or to the basic financial statements themselves, and other additional procedures in accordance with auditing standards generally accepted in the United States of America. In our opinion, the combining and individual fund financial statements and other schedules are fairly stated in all material respects in relation to the basic financial statements as a whole.
The introductory and statistical sections have not been subjected to the auditing procedures applied in the audit of the basic financial statements, and, accordingly, we do not express an opinion or provide any assurance on them.
Other Reporting Required by Government Auditing Standards In accordance with Government Auditing Standards, we have also issued our report dated December 20, 2017 on our consideration of the Town of Stratford, Connecticut’s internal control over financial reporting and on our tests of its compliance with certain provisions of laws, regulations, contracts, and grant agreements and other matters. The purpose of that report is soley to describe the scope of our testing of internal control over financial reporting and compliance and the results of that testing, and not to provide an opinion on the effectiveness of the Town of Stratford’s internal control over financial reporting or on compliance. That report is an integral part of an audit performed in accordance with Government Auditing Standards in considering the Town of Stratford, Connecticut’s internal control over financial reporting and compliance.
New Haven, Connecticut December 20, 2017

3
TOWN OF STRATFORD, CONNECTICUT MANAGEMENT’S DISCUSSION AND ANALYSIS
JUNE 30, 2017 This discussion and analysis of the Town of Stratford, Connecticut’s (the Town) financial performance is developed by management to provide an overview of the Town’s financial activities for the fiscal year ended June 30, 2017. Please read this MD&A in conjunction with the transmittal letter and the Town’s financial statements, Exhibits I to XI. Financial Highlights
In the Statement of Net Position, The Town’s net position decreased by $17.5 million, or 9.3%, as a result of this year’s operations. The net position of our business-type activities decreased by $1.3 million, or 6%, and the net position of our governmental activities decreased by $16.2 million, or 7.7%.
During the year, the Town’s governmental activities program expenses are $16.9 million less than the $244.3 million generated in tax and other revenues for governmental programs.
In the Town’s business-type activities, revenues from charges for services are $13.4 million while operating expenses are $14 million primarily due to the Water Treatment plant and Emergency Medical Services.
Total cost of all of the Town’s programs increased by $11.1 million to $275.1 million with no major new programs added this year. These increases consisted of $11.9 million in education, $1.6 million in interest expense, $0.7 million in physical development, and $0.1 million in general government expense offset by a decrease of $1.3 million in human development, $1.7 million in public safety, and $0.3 in business-type expenses.
The General Fund reported a fund balance this year of $9.3 million, which is an increase of $1 million from the prior year.
Revenues in the General Fund totaled $217.4 million while expenditures totaled $216.6 million resulting in a surplus of $0.8 million on a budgetary basis.
Overview of the Financial Statements This annual report consists of a series of financial statements. The statement of net position and the statement of activities (Exhibits I and II, respectively) provide information about the activities of the Town as a whole and present a longer-term view of the Town’s finances. Fund financial statements are presented in Exhibits III to XI. For governmental activities, these statements tell how these services were financed in the short term as well as what remains for future spending. Fund financial statements also report the Town’s operations in more detail than the government-wide statements by providing information about the Town’s most significant funds. The remaining statements provide financial information about activities for which the Town acts solely as a trustee or agent for the benefit of those outside of the government. Government-Wide Financial Statements The analysis of the Town as a whole begins on Exhibits I and II. The statement of net position and the statement of activities report information about the Town as a whole and about its activities for the current period. These statements include all assets and liabilities using the accrual basis of accounting, which is similar to the accounting used by most private-sector companies. All of the current year’s revenues and expenses are taken into account regardless of when cash is received or paid.

4
These two statements report the Town’s net position and changes in them. The Town’s net position, the difference between assets and liabilities, are one way to measure the Town’s financial health, or financial position. Over time, increases or decreases in the Town’s net position are one indicator of whether its financial health is improving or deteriorating. The reader needs to consider other non-financial factors, however, such as changes in the Town’s property tax base and the condition of the Town’s capital assets, to assess the overall health of the Town. In the statement of net position and the statement of activities, we divide the Town into two types of activities:
Governmental Activities - Most of the Town’s basic services are reported here, including education, public safety, highways and streets, sanitation, economic development and recreation. Property taxes, charges for services and state and federal grants finance most of these activities.
Business-Type Activities - The Town charges a fee to customers to help it cover all or most of the cost of certain services it provides. The Town’s Waste Operating Facility, Town golf facilities and EMS Fund are reported here.
Fund Financial Statements
The fund financial statements begin with Exhibit III and provide detailed information about the most significant funds - not the Town as a whole. Some funds are required to be established by Charter. However, the Town Council establishes many other funds to help control and manage financial activities for particular purposes (like the Capital Projects Fund) or to show that it is meeting legal responsibilities for using grants and other money (like grants received for education from the State Department of Education). The Town’s funds are divided into three categories: governmental, proprietary and fiduciary. Governmental funds (Exhibits III to VI): Most of the Town’s basic services are reported in governmental funds, which focus on how money flows into and out of those funds and the balances left at year-end that are available for spending. These funds are reported using an accounting method called modified accrual accounting, which measures cash and all other financial assets that can readily be converted to cash. The governmental fund statements provide a detailed short-term view of the Town’s general government operations and the basic services it provides. Governmental fund information helps you determine whether there are more or fewer financial resources that can be spent in the near future to finance the Town’s programs. The relationship (or differences) between governmental activities (reported in the statement of net position and the statement of activities) and governmental funds is described in a reconciliation at the bottom of the fund financial statements.
Proprietary Funds (Exhibits VII to IX): When the Town charges customers for the services it provides, whether to outside customers or to other units of the Town, these services are generally reported in proprietary funds. Proprietary funds are reported in the same way that all activities are reported in the statement of net position and the statement of activities. In fact, the Town’s enterprise funds (a component of proprietary funds) are the same as the business-type activities reported in the government-wide statements, but provide more detail and additional information, such as cash flows, for proprietary funds.
Fiduciary funds (Exhibits X and XI): The Town is the trustee, or fiduciary, for its employees’ pension plans. It is also responsible for other assets that, because of a trust arrangement, can be used only for the trust beneficiaries. All of the Town’s fiduciary activities are reported in separate statements of fiduciary net position and changes in fiduciary net position. These activities are excluded from the Town’s other financial statements because the Town cannot use these assets to finance its operations. The Town is responsible for ensuring that the assets reported in these funds are used for their intended purposes.

5
Government-Wide Financial Analysis The Town’s combined net position decreased from a year ago from $(188.7) million to $(206.2) million. The analysis below focuses on the net position (Table 1) and changes in net position (Table 2) of the Town’s governmental and business-type activities.
Table 1 SUMMARY STATEMENT OF NET POSITION
(In Thousands)
2017 2016 2017 2016 2017 2016
Current and Other Assets 85,538 $ 49,435 $ 6,572 $ 7,196 $ 92,110 $ 56,631 $
Capital Assets, net of depreciation 190,239 190,894 47,903 51,231 238,142 242,125
Total assets 275,777 240,329 54,475 58,426 330,252 298,755
Deferred pension expense 6,285 19,303 - - 6,285 19,303
Deferred Charge on Refundings 1,984 2,404 - 29 1,984 2,433
Total deferred outflows of
resources 8,269 21,707 - 29 8,269 21,736
Current Liabilities 37,194 11,939 830 1,134 38,023 13,073
Long-Term Liabilities Outstanding 473,128 458,971 33,472 35,856 506,600 494,827
Total liabilities 510,322 470,911 34,301 36,990 544,623 507,901
Deferred pension credit 118 512 - - 118 512
Advance Tax Collections - 781 - - - 781
Total deferred inflows of
resources 118 1,293 - - 118 1,293
Net Position
Net investment in capital assets 85,697 81,259 14,786 15,719 100,483 96,978
Restricted 2,670 2,476 - - 2,670 2,476
Unrestricted (314,761) (293,903) 5,388 5,746 (309,373) (288,157)
Total net position (226,394) $ (210,168) $ 20,174 $ 21,466 $ (206,220) $ (188,702) $
Governmental Activities Business-Type Activities Total
Net position of the Town’s governmental activities decreased by 7.7% to $(226.4) million compared to ($210.2) million the prior year. Unrestricted net position - the part of net position that can be used to finance day-to-day operations without constraints established by debt covenants, enabling legislation or other legal requirements - changed from $(293.9) million at June 30, 2016 to $(314.8) million at the end of this year.
6
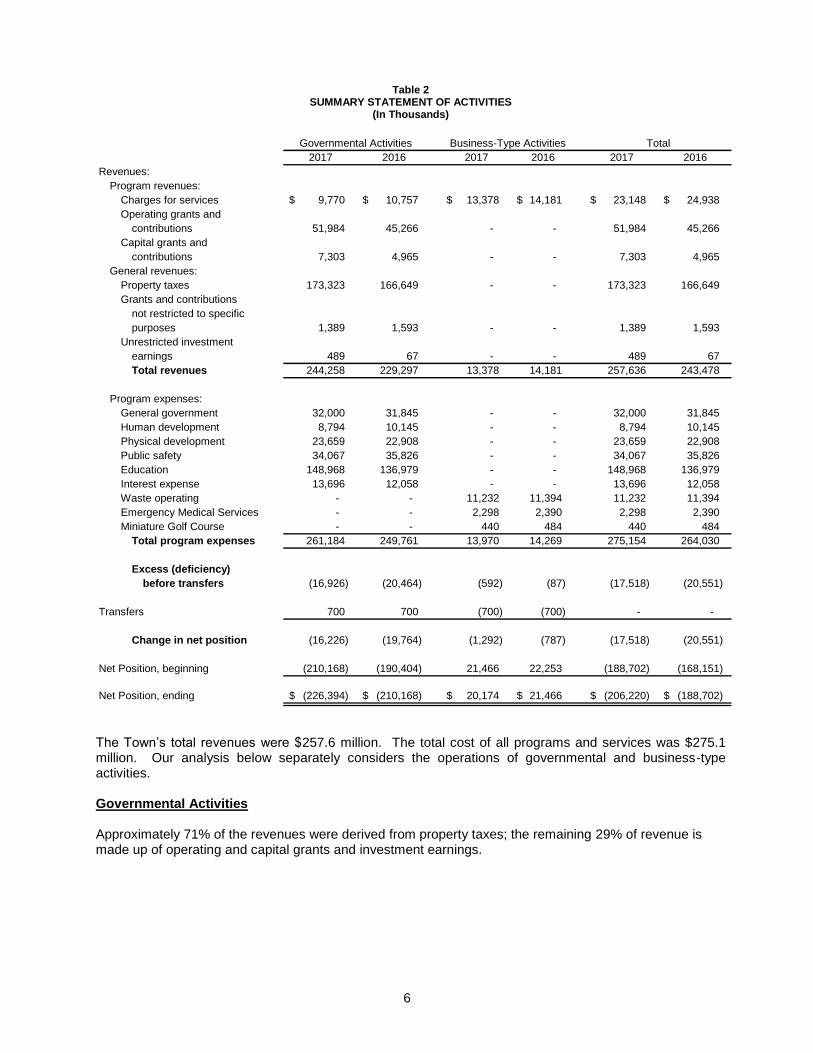
Table 2 SUMMARY STATEMENT OF ACTIVITIES
(In Thousands)
2017 2016 2017 2016 2017 2016
Revenues:
Program revenues:
Charges for services 9,770 $ 10,757 $ 13,378 $ 14,181 $ 23,148 $ 24,938 $
Operating grants and
contributions 51,984 45,266 - - 51,984 45,266
Capital grants and
contributions 7,303 4,965 - - 7,303 4,965
General revenues:
Property taxes 173,323 166,649 - - 173,323 166,649
Grants and contributions
not restricted to specific
purposes 1,389 1,593 - - 1,389 1,593
Unrestricted investment
earnings 489 67 - - 489 67
Total revenues 244,258 229,297 13,378 14,181 257,636 243,478
Program expenses:
General government 32,000 31,845 - - 32,000 31,845
Human development 8,794 10,145 - - 8,794 10,145
Physical development 23,659 22,908 - - 23,659 22,908
Public safety 34,067 35,826 - - 34,067 35,826
Education 148,968 136,979 - - 148,968 136,979
Interest expense 13,696 12,058 - - 13,696 12,058
Waste operating - - 11,232 11,394 11,232 11,394
Emergency Medical Services - - 2,298 2,390 2,298 2,390
Miniature Golf Course - - 440 484 440 484
Total program expenses 261,184 249,761 13,970 14,269 275,154 264,030
Excess (deficiency)
before transfers (16,926) (20,464) (592) (87) (17,518) (20,551)
Transfers 700 700 (700) (700) - -
Change in net position (16,226) (19,764) (1,292) (787) (17,518) (20,551)
Net Position, beginning (210,168) (190,404) 21,466 22,253 (188,702) (168,151)
Net Position, ending (226,394) $ (210,168) $ 20,174 $ 21,466 $ (206,220) $ (188,702) $
Governmental Activities Business-Type Activities Total
The Town’s total revenues were $257.6 million. The total cost of all programs and services was $275.1 million. Our analysis below separately considers the operations of governmental and business-type activities. Governmental Activities Approximately 71% of the revenues were derived from property taxes; the remaining 29% of revenue is made up of operating and capital grants and investment earnings.

7
Major revenue factors include:
Property taxes increased by $6.7 million over the prior year. Current tax collections totaled $168.8 million or 97.7% of the levy. Arrears taxes and interest collected was $4.6 million. Unrestricted investment earnings were $0.4 million more than the prior year.
Operating grants for governmental activities increased by $6.7 million over the prior year. The State of Connecticut Education Cost Sharing grant, Special education, and Municipal revenue sharing totaled $26.8 million of the Operating grants total.
Governmental expenses increased from $249.8 million to $261.1 million with no major new programs added this year. These increases consisted of $11.9 million in education, $1.6 million in interest expense, $0.7 million in physical development, and $0.1 million in general government expense offset by a decrease of $1.3 million in human development, and $1.7 million in public safety. Table 3 presents the cost of each of the Town’s five largest programs - education, public safety, administration, physical development, and human development - as well as each program’s net cost (total cost less revenues generated by the activities). The net cost shows the financial burden that was placed on the Town’s taxpayers by each of these functions.
TABLE 3 GOVERNMENTAL ACTIVITIES
(In Thousands)
2017 2016 2017 2016
General Government 32,000 $ 31,845 $ 29,175 $ 29,578 $
Public Safety 34,067 35,826 32,064 34,803
Physical Development 23,659 22,908 20,628 14,768
Education 148,968 136,979 90,557 93,141
Human Development 8,794 10,145 6,006 4,425
All Others 13,696 12,058 13,696 12,058
Total 261,184 $ 249,761 $ 192,127 $ 188,773 $
Total Cost of Services Net Cost of Services
Business-Type Activities Business-type activities decreased the Town’s net position by $1.3 million. The key factors were increase in operating expenses in Waste Operating fund, Short Beach golf course and Emergency Medical Services.
Town Funds Financial Analysis
Governmental Funds. The focus of the Town’s governmental funds is to provide information on near-term inflows, outflows and balances of spendable resources. Such information is useful in assessing the Town’s financing requirements. In particular, unassigned fund balance may serve as a useful measure of a government’s net resources available for spending at the end of the fiscal year. As of the end of the current fiscal year, the Town’s governmental funds reported combined ending fund balances of $32.6 million, an increase of $15.4 million in comparison with the prior year. This is due to Bond issuance in January 2017 of $25.26 million and premium on bond issuance of $3.3 million. Deficiency of revenues over expenditures is $13.9 million.
The General Fund is the chief operating fund of the Town. At the end of the current fiscal year, the
General Fund total fund balance is $9.3 million. The reason for the $1 million increase in the General Fund
mirrors the general fund activities analysis highlighted in RSI-1 and RSI-2.

8
The fund balance of the Town’s General Fund increased by $1million during the current fiscal year. Key
factors affecting the General Fund are as follows:
Increase in education employee benefits, and debt service principal retirements.
Premium on bond issuance is recognized in the General Fund of $3 million.
The Capital Projects Fund has a fund balance of $18.3 million at the end of the year, an increase of $14.9 million from the prior year. The change is due to issuance of bonds of $25.26 million and major projects in the current year. Major projects are as follows:
The Stratford High School Project of $3.7 million.
Road Resurfacing, sidewalk improvement, street improvement, and bridge improvement of $1.1
million.
Other school Improvements, equipment and technology infrastructure Projects have expenditures of
$3 million.
Capital equipment purchases for public works, police and fire of $1.5 million.
Other non-major governmental funds have a total fund balance of $5 million, a decrease of $0.5 million
from the prior year. Decrease is due to Debt Service Fund transfers out of $0.4 million, miscellaneous
grants decrease by $0.2 million and permanent funds increase by $0.2 due to appreciation in fair market
value of investments.
Proprietary Funds. The Town’s proprietary funds provide the same type of information found in the government-wide financial statements, but in more detail.
Overall enterprise funds net position total $20.2 million at the end of 2017, decreasing by $1.3 million from
the previous year.
Net position of the Waste Operating Fund at the end of the year is $20.8 million, 103% of total net position of the proprietary funds. Other non-major activities have net deficit of $.6 million or -3% of the total net position. Other factors concerning the finances of these funds have already been addressed in the discussion of the Town’s Business-Type Activities. Internal service funds net position total ($6.1) million at the end of 2017, decreasing by $2 million from the previous years. Net position of the Health Benefit Fund and Workers’ compensation as of June 30, 2017 is $1.3 million and ($7.5) million, respectively. Decrease in Health Benefit fund net position is due to decrease in funding from General Fund. Decrease in Workers’ Compensation fund net position is due to increase in risk management claim liability of $1 million.
General Fund Budgetary Highlights
During the year, revenues were over budgetary estimates by $3.5 million and expenditures were over budgetary estimates by $1.3 million. The town had a positive revenue variance that was the result of $.7 million revenues exceeding the budget for tax collections and bond premium of $3 million. Tax collection revenue and bond premium helped minimize the overall number. Expenditures exceeded budget estimates due to increases in Public Safety (Police & Fire), Employee Benefits, and Town Attorney costs.

9
Capital Asset and Debt Administration Capital Assets. The Town’s investment in capital assets (net of accumulated depreciation) for its governmental and business-type activities as of June 30, 2017 amounted to $190.2 million and $47.72 million, respectively. This investment in capital assets included land, buildings and system improvements, machinery and equipment, park facilities, roads, highways and bridges. The total decrease in the Town’s investment in capital assets for the current fiscal year was $4 million.
TABLE 4 CAPITAL ASSETS AT YEAR-END (Net of Depreciation)
(In Thousands)
2017 2016 2017 2016 2017 2016
Land 15,919 $ 15,919 $ -$ -$ 15,919 $ 15,919 $
Land Improvements 10,581 10,579 108 116 10,689 10,695
Buildings and Improvements 102,695 107,232 37,867 41,122 140,562 148,354
Infrastructure 34,017 31,411 7,658 7,679 41,675 39,090
Machinery and Equipment 15,182 17,134 2,099 2,314 17,281 19,448
Construction in Progress 11,846 8,618 170 - 12,016 8,618
Total 190,240 $ 190,893 $ 47,903 $ 51,231 $ 238,143 $ 242,124 $
Governmental Activities Business-Type Activities Total
This year’s major additions included (in millions):
The Stratford High School Project of $3.7 million.
Road Resurfacing, sidewalk improvement, street improvement, and bridge improvement of $1.1 million.
Other school Improvements, equipment and technology infrastructure Projects have expenditures of $3 million.
Capital equipment purchases for public works, police and fire of $1.5 million.
More detailed information about the Town’s capital assets is presented in Note 1 and Note 4 to the financial statements. Long-Term Debt. At June 30, 2017 the Town had $326.4 million in bonds and notes outstanding versus $320.8 million last year, an increase of 1.8% as shown in Table 5.
TABLE 5 OUTSTANDING DEBT, AT YEAR-END
(In Thousands)
2017 2016 2017 2016 2017 2016
General Obligation Bonds 293,473 $ 285,472 $ 1,646 $ 1,810 $ 295,119 $ 287,282 $
Capital Leases 1,831 2,260 197 221 2,027 2,481
Notes Payable - - 31,274 33,510 31,274 33,510
Total 295,303 $ 287,732 $ 33,117 $ 35,541 $ 328,420 $ 323,273 $
Governmental Activities Business-Type Activities Total
The Town issued $25,260,000 of General Obligation Bonds and $25,000,000 of General Obligation Bond Anticipation Notes in January of 2017.

10
The Town maintains an “AA” rating from Standard & Poor’s and an “A1” rating from Moody’s for general obligation debt. The Town provides the rating agencies with ongoing disclosure in the form of independent annual financial reports, adopted budgets, and other materials relating to its management and financial condition, as may be necessary or requested from time to time. State statutes limit the amount of general obligation debt a governmental entity may issue to 7.0 times its total prior years’ tax collections. The current debt limitation for the Town amounts to $1,214 million, significantly more than the Town’s outstanding general obligation debt. More detailed information about the Town’s long-term liabilities is presented in Note 6 to the financial statements. Economic Factors and Next Year’s Budgets and Rates
Inflationary trends in the region are comparable to the national indices.
The Town’s unemployment rate has dropped from 8.3% in October of 2013 as compared to 5% in October 2017.
All of these factors were considered in preparing the Town’s budget for fiscal year 2018. The fiscal year 2018 General Fund budget calls for $217,311,271 in revenues with matching expenditures resulting in an increase of $3,207,960 over fiscal year 2017 or a 1.50% increase. The Grand List only increased by .64% from 2017; thereby, resulting in a mill rate increase of 2.52%. During the current fiscal year, unassigned fund balance in the General Fund increased by $988,803 to $7,983,202. The Town did not utilize general fund balance for the fiscal year 2018 budget. Contacting the Town’s Financial Management This financial report is designed to provide citizens, taxpayers, customers, investors and creditors with a general overview of the Town’s finances and to show the Town’s accountability for the tax and other funding it receives. The report is available on the Town website: www.townofstratford.com. If you have questions about this report or need additional financial information, contact the Assistant Finance Director, Town of Stratford, 2725 Main Street, Stratford, Connecticut 06615.

Basic Financial Statements


11
Town of Stratford, Connecticut Exhibit I
Statement of Net Position (Deficits)
June 30, 2017
Governmental Business-Type
Activities Activities Total
Assets
Cash and cash equivalents 35,116,336 $ 112,077 $ 35,228,413 $
Restricted cash 37,786,942 - 37,786,942
Investments 1,879,181 - 1,879,181
Receivables, net 14,394,807 2,781,679 17,176,486
Internal balances (4,792,367) 4,792,367 -
Inventory 38,942 - 38,942
Advance to other funds 1,114,103 (1,114,103) -
Capital assets:
Assets not being depreciated 27,764,677 170,287 27,934,964
Assets being depreciated, net 162,474,571 47,732,655 210,207,226
Total assets 275,777,192 $ 54,474,962 $ 330,252,154 $
Deferred outflows of resources:
Deferred pension expense 6,285,184 $ -$ 6,285,184 $
Deferred charges on refundings 1,984,056 - 1,984,056
Total defered outflows of resources 8,269,240 $ -$ 8,269,240 $
Liabilities
Accounts and other payables 6,137,152 794,585 6,931,737
Accrued liabilities 5,645,355 - 5,645,355
Bond anticipation notes 25,000,000 - 25,000,000
Unearned revenue 411,261 34,929 446,190
Noncurrent liabilities:
Due within one year 27,859,092 2,667,990 30,527,082
Due in more than one year 445,269,275 30,803,735 476,073,010
Total liabilities 510,322,135 34,301,239 544,623,374
Deferred inflows of resources:
Deferred pension credit 118,264 - 118,264
Total deferred inflows of resources 118,264 - 118,264
Net position (deficit):
Net investment in capital assets 85,697,023 14,785,906 100,482,929
Restricted for
nonexpendable trust 2,669,929 - 2,669,929
Unrestricted (deficit) (314,760,919) 5,387,817 (309,373,102)
Total net position (deficit) (226,393,967) $ 20,173,723 $ (206,220,244) $
See notes to financial statements.

12
Town of Stratford, Connecticut Exhibit II
Statement of Activities
For the Year Ended June 30, 2017
Operating Capital
Charges for Grants and Grants and Governmental Business-type
Expenses Services Contributions Contributions Activities Activities Total
Governmental activities:
General government (32,000,487) $ 2,774,299 $ 51,301 $ -$ (29,174,887) $ -$ (29,174,887) $
Human development (8,794,443) 1,354,402 1,433,668 - (6,006,373) - (6,006,373)
Physical development (23,658,898) 1,376,703 1,653,933 - (20,628,262) - (20,628,262)
Public safety (34,066,511) 2,002,040 - - (32,064,471) - (32,064,471)
Education (148,967,777) 2,262,825 48,845,114 7,302,851 (90,556,987) - (90,556,987)
Debt service (13,696,050) - - - (13,696,050) - (13,696,050)
Total governmental activities (261,184,166) 9,770,269 51,984,016 7,302,851 (192,127,030) - (192,127,030)
Business-type activities:
Waste Operating (11,231,693) 11,125,732 - - - (105,961) (105,961)
Emergency Medical Services (2,298,107) 2,026,664 - - - (271,443) (271,443)
Short Beach Golf Course (440,078) 225,614 - - - (214,464) (214,464)
Total business-type activities (13,969,878) 13,378,010 - - - (591,868) (591,868)
Total (275,154,044) $ 23,148,279 $ 51,984,016 $ 7,302,851 $ (192,127,030) (591,868) (192,718,898)
General revenues
Property taxes 173,322,941 - 173,322,941
Grants and contributions not restricted to
specific programs 1,388,857 - 1,388,857
Unrestricted investment earnings 488,951 - 488,951
Transfers 700,000 (700,000) -
Total general revenues and transfers 175,900,749 (700,000) 175,200,749
Change in net position (deficit) (16,226,281) (1,291,868) (17,518,149)
Net position (deficit) - beginning (210,167,686) 21,465,591 (188,702,095)
Net position (deficit)- ending (226,393,967) $ 20,173,723 $ (206,220,244) $
See notes to financial statements.
Functions/Programs
Program Revenues and Changes in Net Position
Net (Expense) Revenue

13
Town of Stratford, Connecticut Exhibit III
Balance Sheet - Governmental Funds
June 30, 2017
Nonmajor Total
Capital Governmental Governmental
General Projects Funds Funds
Assets
Cash and cash equivalents 33,160,566 $ -$ 1,875,770 $ 35,036,336 $
Restricted cash 37,786,942 - - 37,786,942
Investments - - 1,879,181 1,879,181
Receivables, net (Note 3) 11,765,024 979,598 1,650,185 14,394,807
Inventories and prepaids 6,131 - 32,811 38,942
Advance to other funds 1,114,103 - - 1,114,103
Due from other funds 4,522,013 48,796,909 3,154,929 56,473,851
Total assets 88,354,779 $ 49,776,507 $ 8,592,876 $ 146,724,162 $
Liabilities
Accounts payable 2,229,625 $ 2,850,936 $ 1,051,002 $ 6,131,563 $
Accrued liabilities 830,283 - - 830,283
Bond anticipation notes - 25,000,000 - 25,000,000
Unearned revenues - - 411,261 411,261
Due to other funds 65,173,624 2,657,553 959,583 68,790,760
Total liabilities 68,233,532 30,508,489 2,421,846 101,163,867
Deferred inflows of resources:
Unavailable resources 10,806,823 979,598 1,135,664 12,922,085
Total deferred inflows of resources 10,806,823 979,598 1,135,664 12,922,085
Fund balances:
Nonspendable 1,120,234 - 32,811 1,153,045
Restricted - 18,288,420 4,896,011 23,184,431
Committed - - 1,593,120 1,593,120
Assigned 210,988 - - 210,988
Unassigned (deficit) 7,983,202 - (1,486,576) 6,496,626
Total fund balances 9,314,424 18,288,420 5,035,366 32,638,210
Total liabilities, deferred inflows
of resources and fund balances 88,354,779 $ 49,776,507 $ 8,592,876 $ 146,724,162 $
See notes to financial statements.

14
Town of Stratford, Connecticut Exhibit IV
Reconciliation of the Balance Sheet - Governmental Funds to the Statement of Net Position
June 30, 2017
Amounts reported for governmental activities in the
statement of net position (Exhibit I) are different because of
the following:
Fund balances - total governmental funds (Exhibit III) 32,638,210 $
Capital assets used in governmental activities are not
financial resources and, therefore, are not reported
in the funds:
Governmental capital assets 380,509,389
Less accumulated depreciation (190,270,141)
Net capital assets 190,239,248
Other long-term assets are not available to pay for current-period
expenditures and, therefore, are deferred in the funds:
Property tax receivables greater than 60 days 7,616,181
Interest receivable on property taxes 3,035,000
Assessments receivable 979,598
Housing loans 142,230
Receivable from the State for school construction projects 126,418
Other intergovernmental receivables 1,022,658
Internal Service Funds are used by management to charge
the costs of risk management to individual funds. The
assets and liabilities of the Internal Service Funds are reported
with governmental activities in the statement of net position. (6,130,204)
Net deferred outflows/inflows related to net pension liability 6,166,920
Long-term liabilities, including bonds payable, are not
due and payable in the current periods and, therefore, are
not reported in the funds:
Bonds and notes payable (283,229,912)
Bond premium (10,242,806)
Capital lease (1,830,505)
Interest payable on bonds and notes (4,815,072)
Compensated absences (11,409,773)
Landfill closure (7,800,000)
Net pension liability- defined benefit plan (60,894,906)
OPEB obligation (80,741,308)
Deferred charges on refunding 1,984,056
Claims and judgments (3,250,000)
Net position (deficit) of governmental activities (Exhibit I) (226,393,967) $
See notes to financial statements.

15
Town of Stratford, Connecticut Exhibit V
For the Year Ended June 30, 2017
Nonmajor Total
Capital Governmental Governmental
General Projects Funds Funds
Revenues:
Property taxes and assessments 174,120,628 $ 161,523 $ -$ 174,282,151 $
State and federal governments 49,234,555 3,841,380 8,399,611 61,475,546
Charges for services 3,753,733 - 2,566,433 6,320,166
Licenses and permits 686,613 - 474,527 1,161,140
Investment income 122,817 - 366,134 488,951
Other 1,870,094 - 639,559 2,509,653
Total revenues 229,788,440 4,002,903 12,446,264 246,237,607
Expenditures:
Current:
General government:
Administration 4,978,884 - - 4,978,884
Contingency 2,641,747 - - 2,641,747
Employee benefits 20,423,354 - - 20,423,354
Finance 2,193,685 - - 2,193,685
Human development 5,902,668 - 2,151,866 8,054,534
Physical development 11,251,696 - 1,559,038 12,810,734
Public Safety 25,614,821 - 202,406 25,817,227
Education 125,907,159 - 7,970,610 133,877,769
Debt service:
Principal retirements 14,701,275 - - 14,701,275
Interest and other charges 18,119,575 278,116 - 18,397,691
Capital outlay - 15,662,246 545,960 16,208,206
Total expenditures 231,734,864 15,940,362 12,429,880 260,105,106
Excess (deficiency) of revenues
over expenditures (1,946,424) (11,937,459) 16,384 (13,867,499)
Other financing sources (uses):
Issuance of bonds - 25,260,000 - 25,260,000
Premium on bond issuance 2,963,886 306,569 - 3,270,455
Transfers in 3,293,280 1,240,939 181,000 4,715,219
Transfers out (3,321,939) - (693,280) (4,015,219)
Total other financing sources (uses) 2,935,227 26,807,508 (512,280) 29,230,455
Net change in fund balances 988,803 14,870,049 (495,896) 15,362,956
Fund balances, beginning 8,325,621 3,418,371 5,531,262 17,275,254
Fund balances, ending 9,314,424 $ 18,288,420 $ 5,035,366 $ 32,638,210 $
See notes to financial statements.
Statement of Revenues, Expenditures and Changes in Fund Balances - Governmental Funds

16
Town of Stratford, Connecticut Exhibit VI
Reconciliation of the Statement of Revenues, Expenditures and Changes in Fund Balances of
Governmental Funds to the Statement of Activities
For the fiscal year ended June 30, 2017
Amounts reported for governmental activities in the statement of activities (Exhibit II)
are different because:
Net change in fund balances - total governmental funds (Exhibit V) 15,362,956 $
Governmental funds report capital outlays as expenditures. In the statement of
activities, the cost of those assets is allocated over their estimated useful
lives and reported as depreciation expense:
Loss on disposal (1,114,358)
Capital outlay 11,014,760
Depreciation expense (10,554,919)
In the statement of activities, only the gain on the sale of capital assets is reported.
However, in the governmental funds, the proceeds (loss) from the sale increase
financial resources. Thus the change in net position differs from the change in
fund balance by the cost of the assets sold.
Revenues in the statement of activities that do not provide current financial
resources are not reported as revenues in the funds:
Change in property taxes and interest collected after 60 days (2,314,606)
Change in assessments collected after 60 days 225,081
Change in housing loans collected after 60 days (46,218)
Change in school building grant receipts collected after 60 days (272,475)
Other grants collected after 60 days 428,496
Change in deferred outflows/inflows relating to the net pension liability, not
reported in governmental funds (12,623,896)
The issuance of long-term debt (e.g., bonds, leases) provides current financial
resources to governmental funds, while the repayment of the principal of long-
term debt consumes the current financial resources of governmental funds.
Neither transaction has any effect on net positions. Also, governmental funds
report the effect of premiums, discounts and similar items when debt is
first issued, whereas these amounts are amortized and deferred in the
statement of activities. The details of these differences in the treatment of
long-term debt and related items are as follows:
Proceeds from sale of bonds (25,260,000)
Bond principal payments 20,852,239
Premium from sale of refunding bonds (3,987,446)
Proceeds from capital lease (291,153)
Capital lease payments 720,795
Some expenses reported in the statement of activities do not require the use of
current financial resources and, therefore, are not reported as expenditures
in the governmental funds:
Compensated absences (1,066,264)
Accrued interest (707,686)
Net pension liability 7,438,930
OPEB obligation (12,054,708)
Amortization of deferred amount on refunding (419,517)
Amortization of bond premiums 394,270
Internal service funds are used by management to charge costs to individual
funds. The net revenue of certain activities of internal service funds is
reported with governmental activities. (1,950,562)
Change in net position of governmental activities (Exhibit II) (16,226,281) $
See notes to financial statements.

17
Town of Stratford, Connecticut Exhibit VII
Statement of Net Position (Deficit) - Proprietary Funds
June 30, 2017
Governmental
Activities
Waste Other
Operating Nonmajor Internal Service
Fund Funds Totals Funds
Assets
Current assets:
Cash and cash equivalents -$ 112,077 $ 112,077 $ 80,000 $
Receivables:
Accounts and other - 327,107 327,107 -
Sewer usage receivable 2,454,572 - 2,454,572 -
Due from other funds 5,542,936 - 5,542,936 7,524,542
Total current assets 7,997,508 439,184 8,436,692 7,604,542
Capital assets:
Assets not being depreciated 170,287 - 170,287 -
Capital assets being depreciated, net 45,174,160 2,558,495 47,732,655 -
Total capital assets 45,344,447 2,558,495 47,902,942 -
Total assets 53,341,955 $ 2,997,679 $ 56,339,634 $ 7,604,542 $
Liabilities
Current liabilities:
Accounts payable 645,356 $ 149,229 $ 794,585 $ 5,589 $
Unearned revenue 34,162 767 34,929 -
Due to other funds - 750,569 750,569 -
Risk management claims - - - 737,000
Bonds payable 133,122 - 133,122 -
Serial and notes payable 2,281,101 - 2,281,101 -
Capital lease 3,476 - 3,476 -
Compensated absences 89,740 - 89,740 -
Total current liabilities 3,186,957 900,565 4,087,522 742,589
Noncurrent liabilities:
Advance from other funds - 1,114,103 1,114,103 -
Bonds payable 265,999 1,247,000 1,512,999 -
Serial notes payable 28,992,872 - 28,992,872 -
Capital lease 30,127 163,339 193,466 -
Risk management claims - - - 12,992,157
Compensated absences 21,877 243,072 264,949 -
Total noncurrent liabilities 29,310,875 2,767,514 32,078,389 12,992,157
Total liabilities 32,497,832 3,668,079 36,165,911 13,734,746
Net position (deficit):
Net investment in capital assets 13,637,750 1,148,156 14,785,906 -
Unrestricted (deficit) 7,206,373 (1,818,556) 5,387,817 (6,130,204)
Total net position (deficit) 20,844,123 $ (670,400) $ 20,173,723 $ (6,130,204) $
See notes to financial statements.
Business-Type Activities - Enterprise Funds

18
Town of Stratford, Connecticut Exhibit VIII
Statement of Revenues, Expenses and Changes in Fund Net Position (Deficit) - Proprietary Funds
For the Year Ended June 30, 2017
Governmental
Activities
Waste Other
Operating Nonmajor Internal Service
Fund Funds Totals Funds
Operating revenues:
Charges for services 10,931,653 $ 2,252,278 $ 13,183,931 $ 6,270,613 $
Other 194,079 - 194,079 -
Total operating revenues 11,125,732 2,252,278 13,378,010 6,270,613
Operating expenses:
Claims - - - 8,221,175
Operating and maintenance 6,968,177 2,386,699 9,354,876 -
Depreciation 3,599,460 301,863 3,901,323 -
Total operating expenses 10,567,637 2,688,562 13,256,199 8,221,175
Operating income (loss) 558,095 (436,284) 121,811 (1,950,562)
Nonoperating revenues (expenses):
Interest expense (664,056) (49,623) (713,679) -
Total nonoperating
revenues (expenses) (664,056) (49,623) (713,679) -
Net (loss) income before
transfers (105,961) (485,907) (591,868) (1,950,562)
Transfers out (300,000) (400,000) (700,000) -
Change in net position (deficit) (405,961) (885,907) (1,291,868) (1,950,562)
Net position (deficit), beginning 21,250,084 215,507 21,465,591 (4,179,642)
Net position (deficit), ending 20,844,123 $ (670,400) $ 20,173,723 $ (6,130,204) $
See notes to financial statements.
Business-Type Activities - Enterprise Funds

19
Town of Stratford, Connecticut Exhibit IX
Statement of Cash Flows - Proprietary Funds
For the Year Ended June 30, 2017
Governmental
Activities
Waste Other
Operating Nonmajor Internal Service
Fund Funds Totals Funds
Cash flows from operating activities:
Cash received from customers and users 10,978,189 $ 2,293,254 $ 13,271,443 $ 6,639,114 $
Cash payments to suppliers (5,986,858) (2,154,306) (8,141,164) (7,336,017)
Cash payments to employees (1,260,360) (193,250) (1,453,610) -
Gross receipts (payments) to/from other funds (55,603) (3,712,930) (3,768,533) 696,903
Net cash provided by (used in) operating activities 3,675,368 (3,767,232) (91,864) -
Cash flows from noncapital financing activities:
Transfers (to)/from other funds (300,000) (400,000) (700,000) -
Net cash used in noncapital
financing activities (300,000) (400,000) (700,000) -
Cash flows from capital and related financing activities:
Principal payments on debt (2,266,091) (104,135) (2,370,226) -
Principal payments on capital lease (1,040) (22,904) (23,944) -
Interest paid on debt (664,056) (49,623) (713,679) -
Purchase of capital assets (444,181) (154,819) (599,000) -
Net cash used in capital and
related financing activities (3,375,368) (331,481) (3,706,849) -
Net decrease in cash and
cash equivalents - (4,498,713) (4,498,713) -
Cash and cash equivalents:
Beginning - 4,610,790 4,610,790 80,000
Ending -$ 112,077 $ 112,077 $ 80,000 $
Reconciliation of operating income (loss) to net cash
provided by (used in) operating activities:
Operating income (loss) 558,095 $ (436,284) $ 121,811 $ (1,950,562) $
Adjustments to reconcile operating income (loss) to
net cash provided by (used in) operating activities:
Depreciation 3,599,460 301,863 3,901,323 -
Loss on disposal of capital assets - 25,250 25,250 -
Change in assets and liabilities:(Increase) decrease in accounts receivable and
deferred charges (147,543) 40,889 (106,654) 368,500
(Increase) decrease in due from other funds (55,603) - (55,603) 687,903 Increase (decrease) in accounts payable and
accrued expenses (279,041) 13,893 (265,148) (9,674) Increase (decrease) in risk management claim
liability - - - 903,833
Increase in unearned revenues - 87 87 -
Increase (decrease) in due to other funds - (3,712,930) (3,712,930) -
Net cash provided by (used in) operating activities 3,675,368 $ (3,767,232) $ (91,864) $ -$
Supplemental schedule of noncash financing activities:Amortization of gain on refunded debt -$ 29,425 $ 29,425 $ -$
Amortization of premium on refunded debt -$ 30,560 $ 30,560 $ -$
See notes to financial statements.
Business-Type Activities - Enterprise Funds

20
Town of Stratford, Connecticut Exhibit X
Statement of Fiduciary Net Position - Fiduciary Funds
June 30, 2017
Pension OPEB Agency
Trust Fund Trust Fund Funds
Assets
Cash and cash equivalents 8,452,114 $ 147,792 $ 1,250,566 $
Investments, at fair value:
Mutual funds - open end 76,372,005 4,294,748 -
Collective Trusts 101,648,613 - -
Limited Partnerships 66,529,228 - -
Total investments 244,549,846 4,294,748 -
Total assets 253,001,960 $ 4,442,540 $ 1,250,566 $
Liabilities
Due to students and others -$ -$ 1,250,566 $
Net position:
Restricted for pension benefits 253,001,960 -
Restricted for OPEB benefits - 4,442,540
Total net position 253,001,960 $ 4,442,540 $
See notes to financial statements.

21
Town of Stratford, Connecticut Exhibit XI
Statement of Changes in Fiduciary Net Position - Fiduciary Funds
For the Year Ended June 30, 2017
OPEB
Pension Trust
Trust Fund Fund
Additions:
Contributions:
Plan members 1,447,209 $ -$
Employer 5,385,385 8,496,506
Total contributions 6,832,594 8,496,506
Investment income:
Net appreciation in fair market value of investments 25,862,017 524,111
Interest and dividends 3,848,127 86,934
29,710,144 611,045
Less investment expenses:
Investment fee (710,880) -
Net investment income 28,999,264 611,045
Total additions 35,831,858 9,107,551
Deductions:
Benefits 22,019,024 8,446,506
Administrative Expenses 378,553 2,786
Total deductions 22,397,577 8,449,292
Change in net position 13,434,281 658,259
Net position - restricted for benefits:
Beginning of year 239,567,679 3,784,281
End of year 253,001,960 $ 4,442,540 $
See notes to financial statements.

Town of Stratford, Connecticut Notes to Financial Statements
22
Note 1. Summary of Significant Accounting Policies
The financial statements of the Town of Stratford, Connecticut (the Town) have been prepared in conformity with accounting principles generally accepted in the United States of America (GAAP) as applied to government units. The Governmental Accounting Standards Board (GASB) is the accepted standard setting body for establishing governmental accounting and financial reporting principles. The more significant policies of the Town are described below. Reporting entity: The Town was founded in 1639. The Town covers an area of 18.7 square miles and is located on Long Island Sound, 65 miles east of New York City and 50 miles southwest of Hartford, Connecticut. The Town has operated under a Council/Manager form of government since 1921. Effective December 12, 2005, the Town became a Mayor-Council form of government. The Town provides a full range of services including public safety, roads, sanitation, health, social services, culture and recreation, education, planning, zoning and general administrative services to its residents. The accompanying financial statements conform to accounting principles generally accepted in the United States of America as applicable to governments. Accounting principles generally accepted in the United States of America require that the reporting entity include 1) the primary government, 2) organizations for which the primary government is financially accountable, and 3) other organizations for which the nature and significance of their relationship with the primary government are such that exclusion would cause the reporting entity’s financial statements to be misleading or incomplete. The criteria provided by the Codification, Section 2100, have been considered, and, as a result, there are no agencies or entities that should be but are not included in the financial statements of the Town. The Town adopted the following accounting standards in the current year: GASB Statement No. 74, Financial Reporting for Postemployment Benefit Plans Other Than Pension Plans, addresses reporting by OPEB plans that administer benefits on behalf of governments. Statement 74 addresses the financial reports of defined benefit OPEB plans that are administered through trusts that meet specified criteria. The Statement follows the framework for financial reporting of defined benefit OPEB plans in Statement 45 by requiring a statement of fiduciary net position and a statement of changes in fiduciary net position. The Statement requires more extensive note disclosures and RSI related to the measurement of the OPEB liabilities for which assets have been accumulated, including information about the annual money-weighted rates of return on plan investments. Statement 74 also sets forth note disclosure requirements for defined contribution OPEB plans. The implementation of this statement resulted in additional disclosures (see Note 10). See Note 13 for the impact the adoption of GSAB 75 will have on the OPEB liability in the next fiscal year. GASB Statement No. 77, Tax Abatement Disclosures. This Statement establishes disclosure of information about nature and magnitude of tax abatements to allow users of the financial statements to understand 1) how tax abatements affect a governments future ability to raise resources and meet its financial obligations and 2) the impact those abatements have on a government’s financial condition and economic condition. The implementation of this statement had no impact on the Town’s financial statements.

Town of Stratford, Connecticut Notes to Financial Statements
23
Note 1. Summary of Significant Accounting Policies (Continued)
GASB Statement No. 78, Pensions Provided through Certain Multiple-Employer Defined Benefit Pension Plans. This standard narrows the scope and applicability of GASB Statement No. 68, Accounting and Financial Reporting for Pensions, to exclude pensions provided to employees of state or local governmental employers through a cost-sharing multiple-employer defined benefit pension plan meeting specific criteria and establishes new guidance for these employers, including separate requirements for recognition and measurement of pension expense or expenditures and liabilities, note disclosures and required supplementary information (RSI). The implementation of this statement had no impact on the Town’s financial statements. GASB Statement No. 80, Blending Requirements for Certain Component Units – An Amendment of GASB Statement No.14. The objective of this Statement is to improve financial reporting by clarifying the financial statement presentation requirements for certain component units. This Statement amends the blending requirements established in paragraph 53 of Statement No. 14, The Financial Reporting Entity, as amended. This Statement amends the blending requirements for the financial statement presentation of component units of all state and local governments. The additional criterion requires blending of a component unit incorporated as a not-for-profit corporation in which the primary government is the sole corporate member. The implementation of this statement had no impact on the Town’s financial statements. GASB Statement No. 82, Pension Issues—an amendment of GASB Statements No. 67, No. 68, and No. 73. The requirements of this Statement are effective for reporting periods beginning after June 15, 2016, except for the requirements of paragraph 7 in a circumstance in which an employer’s pension liability is measured as of a date other than the employer’s most recent fiscal year-end. In that circumstance, the requirements of paragraph 7 are effective for that employer in the first reporting period in which the measurement date of the pension liability is on or after June 15, 2017. Government-wide and fund financial statements: The government-wide financial statements (i.e., the statement of net position and the statement of activities) report information on all of the nonfiduciary activities of the Town. For the most part, the effect of interfund activity has been removed from these statements. Governmental activities, which normally are supported by taxes and intergovernmental revenues, are reported separately from business-type activities, which rely to a significant extent on fees and charges for support. The statement of activities demonstrates the degree to which the direct expenses of a given function or segment are offset by program revenues. Direct expenses are those that are clearly identifiable with a specific function or segment. Program revenues include 1) charges to customers or applicants who purchase, use or directly benefit from goods, services or privileges provided by a given function or segment and 2) grants and contributions that are restricted to meeting the operational or capital requirements of a particular function or segment. Taxes and other items not properly included among program revenues are reported instead as general revenues. Separate financial statements are provided for governmental funds, proprietary funds and fiduciary funds, even though the latter are excluded from the government-wide financial statements. Major individual governmental funds and major individual enterprise funds are reported as separate columns in the fund financial statements. Measurement focus, basis of accounting and financial statement presentation: The government-wide financial statements are reported using the economic resources measurement focus and the accrual basis of accounting, as are the proprietary fund and fiduciary fund financial statements. However, agency funds, unlike other fiduciary funds, report only assets and liabilities, do not have a measurement focus and follow the accrual basis of accounting. Revenues are recorded when earned and expenses are recorded when a liability is incurred, regardless of the timing of related cash flows.

Town of Stratford, Connecticut Notes to Financial Statements
24
Note 1. Summary of Significant Accounting Policies (Continued)
Property taxes are recognized as revenues in the year for which they are levied. Grants and similar items are recognized as revenue as soon as all eligibility requirements imposed by the provider have been met. Governmental fund financial statements are reported using the current financial resources measurement focus and the modified accrual basis of accounting. Revenues are recognized as soon as they are both measurable and available. Revenues are considered to be available when they are collectible within the current period or soon enough thereafter to pay liabilities of the current period. For this purpose, the Town considers revenues to be available if they are collected within 60 days of the end of the current fiscal period. Expenditures generally are recorded when a liability is incurred, as under accrual accounting. However, debt service expenditures, expenditures related to compensated absences and claims and judgments, as well as landfill closure and post-closure costs, are recorded only when payment is due. Property taxes when levied for, intergovernmental revenue when eligibility requirements are met, charges for services, licenses and interest associated with the current fiscal period are all considered to be susceptible to accrual and so have been recognized as revenues of the current fiscal period. Only the portion of special assessments receivable due within the current fiscal period is considered to be susceptible to accrual as revenue of the current period. All other revenue items are considered to be measurable only when cash is received. The Town reports the following major governmental funds: The General Fund is the Town’s primary operating fund. It accounts for all financial resources of the general government, except those required to be accounted for in another fund. The Capital Projects Fund accounts for the proceeds of specific general obligation bonds for various projects to further develop the Town. The Town reports the following major proprietary funds: The Waste Operating Fund accounts for the operations at the Stratford Water Pollution Control Authority. Additionally, the Town reports the following fund types: The Internal Service Fund accounts for the Town’s health benefit and workers’ compensation costs. The Pension Trust Funds account for the activities of the Town’s defined benefit and defined contribution pension plans, which accumulate resources for pension benefit payments to qualified employees. The OPEB Trust Fund accounts for the activities of the Stratford non-pension postemployment benefits for certain retirees and their beneficiaries. The Agency Fund is used to account for assets held by the Town in an agent capacity for individuals, private organizations or other governments. These funds are custodial in nature (assets equal liabilities) and do not involve measurement of results of operations. As a general rule, the effect of interfund activity has been eliminated from the government-wide financial statements. Exceptions to this general rule are payments in lieu of taxes and other charges between certain Town functions because the elimination of these charges would distort the direct costs and program revenues reported for the various functions concerned.

Town of Stratford, Connecticut Notes to Financial Statements
25
Note 1. Summary of Significant Accounting Policies (Continued)
Amounts reported as program revenues include 1) charges to customers or applicants for goods, services or privileges provided, 2) operating grants and contributions, and 3) capital grants and contributions, including special assessments. Internally dedicated resources are reported as general revenues rather than as program revenues. Likewise, general revenues include property taxes. Proprietary funds distinguish operating revenues and expenses from nonoperating items. Operating revenues and expenses generally result from providing services and producing and delivering goods in connection with a proprietary fund’s principal ongoing operations. The principal operating revenues of the proprietary funds are charges to customers for sales and services. Operating expenses for the funds include the cost of operations and maintenance, administrative expenses and depreciation on capital assets. All revenues and expenses not meeting this definition are reported as nonoperating revenues and expenses. When both restricted and unrestricted resources are available for use, it is the Town’s policy to use restricted resources first, then unrestricted resources as they are needed. Unrestricted resources are used in the following order: committed, assigned then unassigned. Deposits and investments: The Town’s cash and cash equivalents are considered to be cash on hand, demand deposits and short-term investments with original maturities of three months or less from the date of acquisition. State statutes authorize the Town to invest in obligations of the U.S. Treasury, commercial paper, corporate bonds, repurchase agreements and certain other investments as described in Note 3. Investments for the Town are reported at fair value. Fair value: The Town uses fair value measurements to record fair value adjustments to certain assets and to determine fair value disclosures. Fair value is the price that would be received to sell an asset or paid to transfer a liability in an orderly transaction between market participants at the measurement date. Fair value is best determined based upon quoted market prices. However, in certain instances, there are no quoted market prices for certain assets or liabilities. In cases where quoted market prices are not available, fair values are based on estimates using present value or other valuation techniques. Those techniques are significantly affected by the assumptions used, including the discount rate and estimates of future cash flows. Accordingly, the fair value estimates may not be realized in an immediate settlement of the asset or liability. Fair value measurements focus on exit prices in an orderly transaction (that is, not a forced liquidation or distressed sale) between market participants at the measurement date under current market conditions. If there has been a significant decrease in the volume and level of activity for the asset or liability, a change in valuation technique or the use of multiple valuation techniques may be appropriate. In such instances, determining the price at which willing market participants would transact at the measurement date under current market conditions depends on the facts and circumstances and requires the use of significant judgment. The Town’s fair value measurements are classified into a fair value hierarchy based on the markets in which the assets and liabilities are traded and the reliability of the assumptions used to determine fair value. The three categories within the hierarchy are as follows: Level 1: Quoted prices in active markets for identical assets and liabilities.
Town of Stratford, Connecticut Notes to Financial Statements
26
Note 1. Summary of Significant Accounting Policies (Continued)
Level 2: Inputs other than quoted prices included within Level 1 that are observable for the asset or liability, either directly or indirectly, including quoted prices for similar assets or liabilities in active markets, quoted prices for identical or similar assets or liabilities in markets that are not active, interest rates and yield curves observable at commonly quoted intervals, implied volatilities, credit spreads, and market-corroborated inputs.
Level 3: Unobservable inputs shall be used to measure fair value to the extent that relevant observable
inputs are not available, thereby allowing for situations in which there is little, if any, market activity for the asset or liability at the measurement date. Level 3 assets and liabilities include financial instruments whose value is determined using pricing models, discounted cash flows methodologies, or similar techniques, as well as instruments for which the determination of fair value requires significant management judgement.
Interfunds: Activity between funds that are representative of lending/borrowing arrangements outstanding at the end of the fiscal year are referred to as either “due to/from other funds” (i.e., the current portion of interfund loans) or “advances to/from other funds” (i.e., the noncurrent portion of interfund loans). All other outstanding balances between funds are reported as “due to/from other funds.” Any residual balances outstanding between the governmental activities and business- type activities are reported in the government-wide financial statements as “internal balances.” Advances between funds, as reported in the fund financial statements, are offset by a fund balance nonspendable account in applicable governmental funds to indicate that they are not expendable available financial resources. Property taxes: Property taxes are assessed as of October 1 and are levied for and due on the following July 1. Taxes are due in two installments on July 1 and January 1. Supplemental motor vehicle taxes are due in full January 1. Liens are recorded during the month of April. Inventories and prepaid items: All inventories are valued at cost using the first-in/first-out (FIFO) method. Inventories of governmental funds are recorded as expenditures when consumed rather than when purchased. Certain payments to vendors reflect costs applicable to future accounting periods and are recorded as prepaid items in both government-wide and fund financial statements. The cost of prepaid items is recorded as expenditures when consumed rather than purchased. Capital assets: Capital assets, which include property, plant, equipment and infrastructure assets (e.g., roads, bridges, sidewalks and similar items), are reported in the applicable governmental or business- type activities columns in the government-wide financial statements and proprietary fund financial statements. Capital assets are defined by the government as assets with an initial, individual cost of more than $5,000 and an estimated useful life in excess of one year. Such assets are recorded at historical cost or estimated historical cost if purchased or constructed. Donated capital assets, donated works of art and similar items, and capital assets received in a service concession arrangement are recorded at acquisition value at the date of donation. The costs of normal maintenance and repairs that do not add to the value of the asset or materially extend assets lives are not capitalized.

Town of Stratford, Connecticut Notes to Financial Statements
27
Note 1. Summary of Significant Accounting Policies (Continued)
Major outlays for capital assets and improvements are capitalized as projects are constructed. Interest incurred during the construction phase of capital assets of business-type activities is included as part of the capitalized value of the assets constructed. Property, plant and equipment of the Town is depreciated using the straight-line method over the following estimated useful lives: Assets Years
Buildings 50 Building Improvements 20 Distribution and Collection Systems 50-65 Public Domain Infrastructure 50 System Infrastructure 30 Machinery and Equipment 5-20
Capital asset additions are reported as expenditures and no depreciation expense is reported in the governmental fund financial statements. Deferred outflows/inflows of resources: In addition to assets, the statement of net position will sometimes report a separate section for deferred outflows of resources. This separate financial statement element, deferred outflows of resources, represents a consumption of net position or fund balance that applies to a future period or periods and so will not be recognized as an outflow of resources (expense/expenditure) until then. The Town reports a deferred charge on refunding and deferred outflows related to pension in the government-wide statement of net position. A deferred charge on refunding results from the difference in the carrying value of refunded debt and its reacquisition price. This amount is deferred and amortized over the shorter of the life of the refunded or refunding debt. A deferred outflow of resources related to pension results from differences between expected and actual experience, changes in assumptions or other inputs. These amounts are deferred and included in pension expense in a systematic and rational manner over a period equal to the average of the expected remaining service lives of all employees that are provided with benefits through the pension plan (active employees and inactive employees). In addition to liabilities, the statement of net position will sometimes report a separate section for deferred inflows of resources. This separate financial statement element, deferred inflows of resources, represents an acquisition of net position or fund balance that applies to a future period or periods and so will not be recognized as an inflow of resources (revenue) until that time. The Town reports a deferred inflow of resources related to pensions in the government-wide statement of net position. A deferred inflow of resources related to pension results from differences between expected and actual experience, changes in assumptions or other inputs. These amounts are deferred and included in pension expense in a systematic and rational manner over a period equal to the average of the expected remaining service lives of all employees that are provided with benefits through the pension plan (active employees and inactive employees). Also, for governmental funds, the Town reports unavailable revenue, which arises only under the modified accrual basis of accounting. The governmental funds report unavailable revenues from property taxes, interest on property taxes, and long-term loans. These amounts are deferred and recognized as an inflow of resources (revenue) in the period during which the amounts become available.

Town of Stratford, Connecticut Notes to Financial Statements
28
Note 1. Summary of Significant Accounting Policies (Continued)
Long-term obligations: In the government-wide financial statements, and proprietary fund types in the fund financial statements, long-term debt and other long-term obligations are reported as liabilities in the applicable governmental activities, business-type activities or proprietary fund type statement of net position. Bond premiums and discounts are deferred and amortized over the life of the bonds using the effective interest method. Bonds payable are reported net of any significant applicable bond premium or discount. Issuance costs, whether or not withheld from the actual debt proceeds received, are reported as debt service expenses. In the fund financial statements, governmental fund types recognize bond premiums and discounts, as well as bond issuance costs, during the current period. The face amount of debt issued is reported as other financing sources. Premiums received on debt issuances are reported as other financing sources while discounts on debt issuances are reported as other financing uses. Debt principal payments are reported as debt service expenditures. Compensated absences: Town employees accumulate vacation and sick leave hours for subsequent use or for payment upon termination or retirement. Vacation and sick leave expenses to be paid in future periods are accrued when incurred in the government-wide and proprietary fund financial statements. A liability for these amounts is reported in governmental funds only for amounts expected to be paid with available resources, for example, as a result of employee resignations and retirements. Net pension liability: The net pension liability is measured as the portion of the actuarial present value of projected benefits that is attributed to past periods of employee service (total pension liability), net of the pension plan’s fiduciary net position. The pension plan’s fiduciary net position is determined using the same valuation methods that are used by the pension plan for purposes of preparing its statement of fiduciary net position. The net pension liability is measured as of a date (measurement date) no earlier than the end of the employer’s prior fiscal year, consistently applied from period to period. Pension plans: For purposes of measuring the net liability, deferred outflows of resources and deferred inflows of resources related to pensions, and pension expense, information about the fiduciary net position of the Town’s defined benefit public employees retirement system (PERS) and the additions to/deletions from PERS’ fiduciary net position have been determined on the same basis as they are reported by PERS. For this purpose, benefit payments (including refunds of employee contributions) are recognized when due and payable in accordance with the benefit terms. Investments are reported at fair value. Fund equity: Equity in the government-wide financial statements is defined as “net position” and is classified in the following categories: Net investment in capital assets: This category groups all capital assets, including infrastructure, into one component of net position, net of accumulated depreciation and reduced by the outstanding balances of bonds, mortgages, notes or other borrowings that are attributable to the acquisition, construction or improvement of those assets. Deferred outflows of resources and deferred inflows of resources that are attributable to the acquisition, construction, or improvement of those assets or related debt are included in this component of net position. Restricted: Net position is restricted because restrictions are externally imposed by creditors (such as through debt covenants), grantors, contributors or laws or regulations of other governments or imposed by law through constitutional provisions or enabling legislation. Unrestricted: This component consists of net position that does not meet the definition of “restricted” or “net investment in capital assets.

Town of Stratford, Connecticut Notes to Financial Statements
29
Note 1. Summary of Significant Accounting Policies (Continued)
The equity of the fund financial statements is defined as “fund balance” and is classified in the following categories: Nonspendable fund balance: This represents amounts that cannot be spent due to form (e.g., inventories and prepaid amounts). Restricted fund balance: These amounts are restricted because restrictions are externally imposed by creditors (such as through debt covenants), grantors, contributors or laws or regulations of other governments or imposed by law through constitutional provisions or enabling legislation. Committed fund balance: This represents amounts constrained for a specific purpose by a government using its highest level of decision-making authority (Town of Stratford Town Council). A commitment of fund balance and any subsequent modification or rescission requires a resolution of the Stratford Town Council. Assigned fund balance: For all governmental funds other than the General Fund, this represents any remaining positive amounts not classified as restricted, committed or nonspendable. For the General Fund, includes amounts constrained for the intent to be used for a specific purpose by the Town of Stratford Town Council. Under the Town’s adopted policy, the Town Council has the authority to authorize the Director of Finance to assign amounts for a specific purpose. Unassigned fund balance: This represents fund balance in the General Fund in excess of nonspendable, restricted, committed and assigned fund balance. If another governmental fund has a fund balance deficit, it is reported as a negative amount in unassigned fund balance. Fund balance flow assumptions: Sometimes the government will fund outlays for a particular purpose from both restricted and unrestricted resources (the total of committed, assigned and unassigned fund balance). In order to calculate the amounts to report as restricted, committed, assigned and unassigned fund balance in the governmental fund financial statements, a flow assumption must be made about the order in which the resources are considered to be applied. It is the government’s policy to consider restricted fund balance to have been depleted before using any of the components of unrestricted fund balance. Further, when the components of unrestricted fund balance can be used for the same purpose, committed fund balance is depleted first, followed by assigned fund balance. Unassigned fund balance is applied last.
Note 2. Cash, Cash Equivalents and Investments
The deposit of public funds is controlled by the Connecticut General Statutes (Section 7-402). Deposits may be made in a “qualified public depository” as defined by Statute, or, in amounts not exceeding the Federal Deposit Insurance Corporation insurance limit in an “out of state bank,” as defined by the Statutes, which is not a “qualified public depository.”
The Connecticut General Statutes (Section 7-400) permits municipalities to invest in: 1) obligations of the United States and its agencies, 2) highly rated obligations of any state of the United States or of any political subdivision, authority or agency thereof, and 3) shares or other interests in custodial arrangements or pools maintaining constant net asset values and in highly rated no-load open end money market mutual funds (with constant or fluctuating net asset values) whose portfolios are limited to obligations of the United States and its agencies, and repurchase agreements fully collateralized by such obligations. Other provisions of the Statutes cover specific municipal funds with particular investment authority. The provisions of the Statutes regarding the investment of municipal pension funds do not specify permitted investments. Therefore, investment of such funds is generally controlled by the laws applicable to fiduciaries and the provisions of the applicable plan.

Town of Stratford, Connecticut Notes to Financial Statements
30
Note 2. Cash, Cash Equivalents and Investments (Continued)
The Statutes (Sections 3-24f and 3-27f) also provide for investment in shares of the State Short- Term Investment Fund (STIF) and the State Tax Exempt Proceeds Fund (TEPF). These investment pools are under the control of the State Treasurer, with oversight provided by the Treasurer’s Cash Management Advisory Board, and are regulated under the State Statutes and subject to annual audit by the Auditors of Public Accounts. Investment yields are accounted for on an amortized-cost basis with an investment portfolio that is designed to attain a market- average rate of return throughout budgetary and economic cycles. Investors accrue interest daily based on actual earnings, less expenses and transfers to the designated surplus reserve, and the fair value of the position in the pool is the same as the value of the pool shares. Deposits: Deposit custodial credit risk: Custodial credit risk is the risk that in the event of a bank failure, the Town’s deposits will not be returned. The Town does not have a deposit policy for custodial credit risk. The deposit of public funds is controlled by the Connecticut General Statutes. Deposits may be placed with any qualified public depository that has its main place of business in the State of Connecticut. Connecticut General Statutes require that each depository maintain segregated collateral (not required to be based on a security agreement between the depository and the municipality and, therefore, not perfected in accordance with federal law) in an amount equal to a defined percentage of its public deposits based upon the depository’s risk based capital ratio. Based on the criteria described in GASB Statement No. 40, Deposits and Investment Risk Disclosures, $78,377,279 of the Town’s bank balance of $88,447,943 was exposed to custodial credit risk as follows:
Uninsured and uncollateralized 78,377,279 $
Uninsured and collateral held by the pledging bank's
Trust department, not in the Town's name 8,708,587
Total amount subject to custodial credit risk 87,085,866 $

Town of Stratford, Connecticut Notes to Financial Statements
31
Note 2. Cash, Cash Equivalents and Investments (Continued)
Cash, cash equivalents and investments of the Town consist of the following at June 30, 2017:
Cash and cash equivalents:
Deposits with financial institutions 73,511,370 $
Cash Equivalents 9,354,457
Total cash and cash equivalents 82,865,827
Investments:
Permanent funds:
Common stock 1,347,855
Mutual funds 531,326
Total permanent funds 1,879,181
Pension trust funds:
Mutual funds 76,372,005
Collective Trusts 101,648,613
Limited Partnerships 66,529,228
Total pension investments 244,549,846
Private purpose trust funds:
Mutual funds 4,294,748
Total investments 250,723,775
Total cash, cash equivalents and investments 333,589,602 $
Cash, cash equivalents and investments are classified in the accompanying financial statements as follows:
Statement of net position:
Cash and cash equivalents 73,015,355 $
Investments 1,879,181
74,894,536
Fiduciary funds:
Cash and cash equivalents 9,850,472
Investments 248,844,594
258,695,066
Total cash, cash equivalents and investments 333,589,602 $
Interest rate risk: The Town does not have a formal investment policy that limits investment maturities as a means of managing its exposure to fair value losses arising from increasing interest rates.

Town of Stratford, Connecticut Notes to Financial Statements
32
Note 2. Cash, Cash Equivalents and Investments (Continued)
Information about the exposure of the Town’s debt type investments, majority of which relates to the Town’s Pension and Private Purpose Trust Funds, to this risk using the segmented time distribution model is as follows:
Fair Less Than 1-5 6-10 Over
Type of Investment Value 1 Year Years Years 10 Years
Mutual Funds 49,043,521 $ 74,236 $ 92,740 $ 48,876,545 $ -$
49,043,521 $ 74,236 $ 92,740 $ 48,876,545 $ -$
Investment Maturities (in Years)
Credit risk - investments: As indicated above, State Statutes limit the investment options of cities and towns. The Town has no investment policy that would further limit its investment choices. Concentration of credit risk: The Town’s investment policy does not allow for an investment in any one issuer that is in excess of 5% of the Town’s total investments. Custodial credit risk: Custodial credit risk for an investment is the risk that, in the event of the failure of the counterparty (the institution that pledges collateral or repurchase agreement securities to the Town or that sells investments to or buys them for the Town), the Town will not be able to recover the value of its investments or collateral securities that are in the possession of an outside party. The Town does not have a policy for custodial credit risk. At June 30, 2017, the Town did not have any uninsured and unregistered securities held by the counterparty or by its trust department or agent that were not in the Town’s name. Presented below is the actual credit rating by Standard and Poor’s as required for each debt-type instrument:
Mutual
Average Rating Funds
AAA 141,134 $
AA 80,980,023
Unrated 76,922
81,198,079 $

Town of Stratford, Connecticut Notes to Financial Statements
33
Note 2. Cash, Cash Equivalents and Investments (Continued)
Fair value: The Plan categorizes its fair value measurements within the fair value hierarchy established by generally accepted accounting principles. The Plan has the following recurring fair value measurements as of June 30, 2017:
Quoted Prices
in Active Significant Significant
Markets for Other Other
Identical Observable Observable
Assets Inputs Inputs
June 30, 2017 (Level 1) (Level 2) (Level 3)
Investments by fair value level:
Stocks 1,347,855 $ 1,347,855 $ -$ -$
ADRs/Foreign stocks - - -
Mutual funds 80,968,115 80,968,115 - -
Pooled, Common, and Collective Trusts 101,648,613 101,648,613 - -
Total investments by fair value level 183,964,583 183,964,583 - -
Investments measured at net asset value (NAV)*:
Equity hedge funds 17,808,423
Real estate investment funds 48,950,769
Total investments measured at the NAV 66,759,192
Total investments 250,723,775 $
* In accordance with GASB 72, certain investments that were measured at NAV per share (or its equivalent) have not
been classified in the fair value hierarchy. The fair value amounts presented in these tables are intended to
permit reconciliation of the fair value hierarchy to line items presented in the statements of financial position.
Fair Value Measurements Using
Equity securities (Stocks and Mutual Funds): Equity securities, classified in Level 1 of the fair value hierarchy, are valued using prices quoted in active markets for those securities. Equity securities classified in Level 2 of the fair value hierarchy are valued using a matrix pricing technique. Matrix pricing is used to value securities based on the securities’ relationship to benchmark quoted prices. Pooled, Common, and Collective Trusts: Common Trusts, classified in Level 1 of the fair value hierarchy, are made up exclusively of equities in which prices quoted in active markets are available.
Redemption
Frequency Redemption
Fair Unfunded (If Currently Notice
Value Commitments Eligible) Period
Investments Measured at NAV:
Equity hedge funds 17,808,423 $ -$ Quarterly Various
Real estate investment funds 48,950,769 - Quarterly Various
Total Investments Measured at NAV 66,759,192 $

Town of Stratford, Connecticut Notes to Financial Statements
34
Note 2. Cash, Cash Equivalents and Investments (Continued)
Equity hedge funds: This type includes investments in two hedge funds that invest both long and short, primarily in U.S. common stocks. Management of each hedge fund has the ability to shift investments from value to growth strategies, from small to large capitalization stocks, and from a net long position to a net short position. The fair values of the investments in this type have been determined using the NAV per share of the investments. Excess cash for distributions is determined by Fund Managers, and is distributed as deemed appropriate after budget review. Real estate investment funds: This type includes three real estate funds that invest primarily in U.S. commercial real estate. The fair values of the investments in this type have been determined using the NAV per share (or its equivalent) of the Plan’s ownership interest in partners’ capital. These investments can be redeemed quarterly upon one quarter’s advance notice. Distributions from each fund will be received as the underlying investments of the funds are liquidated.
Note 3. Receivables, Deferred Inflow of Resources and Unearned Revenue
Receivables as of year-end for the Town’s individual major funds and nonmajor and fiduciary funds in the aggregate, including the applicable allowances for uncollectible accounts, are as follows:
Nonmajor Nonmajor
Capital Waste Enterprise Governmental
General Projects Operating Funds Funds Total
Receivables:
Taxes 11,680,097 $ -$ -$ -$ -$ 11,680,097 $
Accounts and other 608,509 - - 496,853 507,386 1,612,748
Special assessments - 979,598 2,454,572 - - 3,434,170
Intergovernmental 126,418 - - - 1,142,799 1,269,217
Gross receivables 12,415,024 979,598 2,454,572 496,853 1,650,185 17,996,232
Less allowance for
uncollectibles 650,000 - - 169,746 - 819,746
Net total receivables 11,765,024 $ 979,598 $ 2,454,572 $ 327,107 $ 1,650,185 $ 17,176,486 $

Town of Stratford, Connecticut Notes to Financial Statements
35
Note 3. Receivables, Deferred Inflow of Resources and Unearned Revenue (Continued)
Governmental funds report deferred inflows of resources from unavailable revenue in connection with receivables for revenues that are not considered to be available to liquidate liabilities of the current period. Governmental funds and governmental activities report unearned revenues in connection with resources that have been received, but not yet earned. At the end of the current fiscal year, the various components of unavailable revenue and unearned revenue reported in the governmental funds and governmental activities were as follows:
Unavailable Unearned
Delinquent property taxes receivable 10,651,181 $ -$
Advance tax collections - -
Special assessments not yet due 979,598 -
School building grants 126,418 -
Housing loans 142,230 -
Grant drawdowns and other revenues received prior
to meeting all eligibility requirements - 411,261
Other 1,022,658 34,929
12,922,085 $ 446,190 $
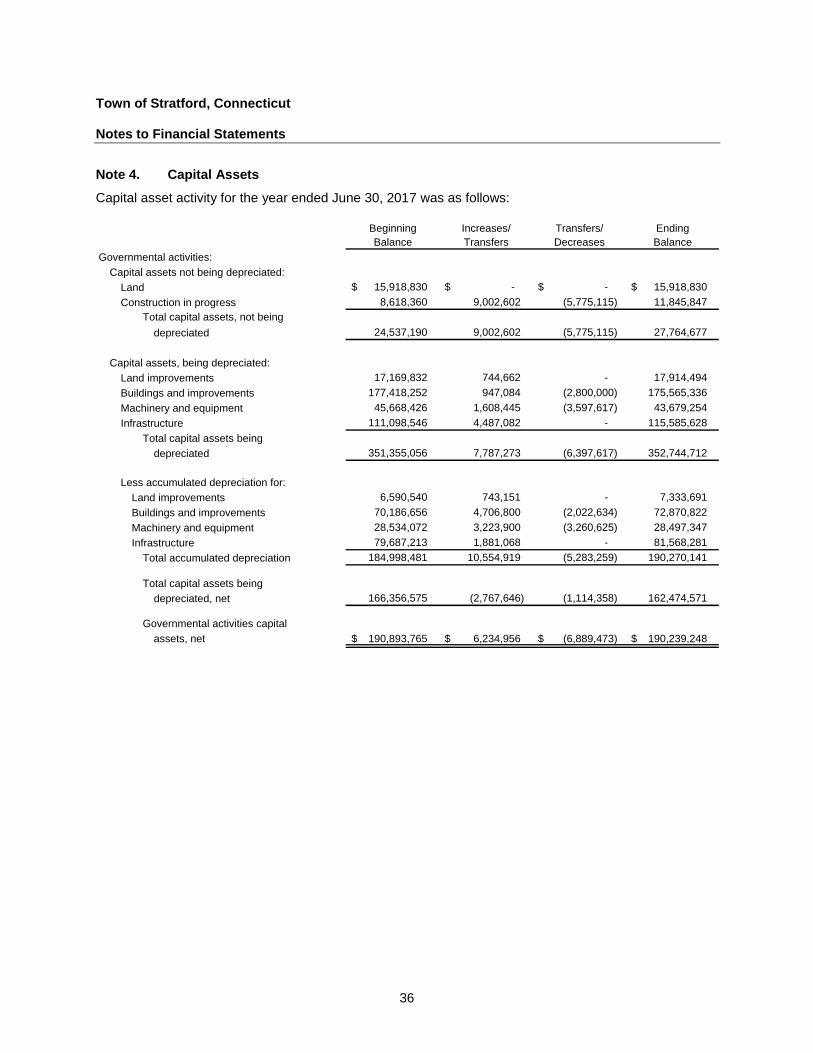
Town of Stratford, Connecticut Notes to Financial Statements
36
Note 4. Capital Assets
Capital asset activity for the year ended June 30, 2017 was as follows:
Beginning Increases/ Transfers/ Ending
Balance Transfers Decreases Balance
Governmental activities:
Capital assets not being depreciated:
Land 15,918,830 $ -$ -$ 15,918,830 $
Construction in progress 8,618,360 9,002,602 (5,775,115) 11,845,847
Total capital assets, not being
depreciated 24,537,190 9,002,602 (5,775,115) 27,764,677
Capital assets, being depreciated:
Land improvements 17,169,832 744,662 - 17,914,494
Buildings and improvements 177,418,252 947,084 (2,800,000) 175,565,336
Machinery and equipment 45,668,426 1,608,445 (3,597,617) 43,679,254
Infrastructure 111,098,546 4,487,082 - 115,585,628
Total capital assets being
depreciated 351,355,056 7,787,273 (6,397,617) 352,744,712
Less accumulated depreciation for:
Land improvements 6,590,540 743,151 - 7,333,691
Buildings and improvements 70,186,656 4,706,800 (2,022,634) 72,870,822
Machinery and equipment 28,534,072 3,223,900 (3,260,625) 28,497,347
Infrastructure 79,687,213 1,881,068 - 81,568,281
Total accumulated depreciation 184,998,481 10,554,919 (5,283,259) 190,270,141
Total capital assets being
depreciated, net 166,356,575 (2,767,646) (1,114,358) 162,474,571
Governmental activities capital
assets, net 190,893,765 $ 6,234,956 $ (6,889,473) $ 190,239,248 $
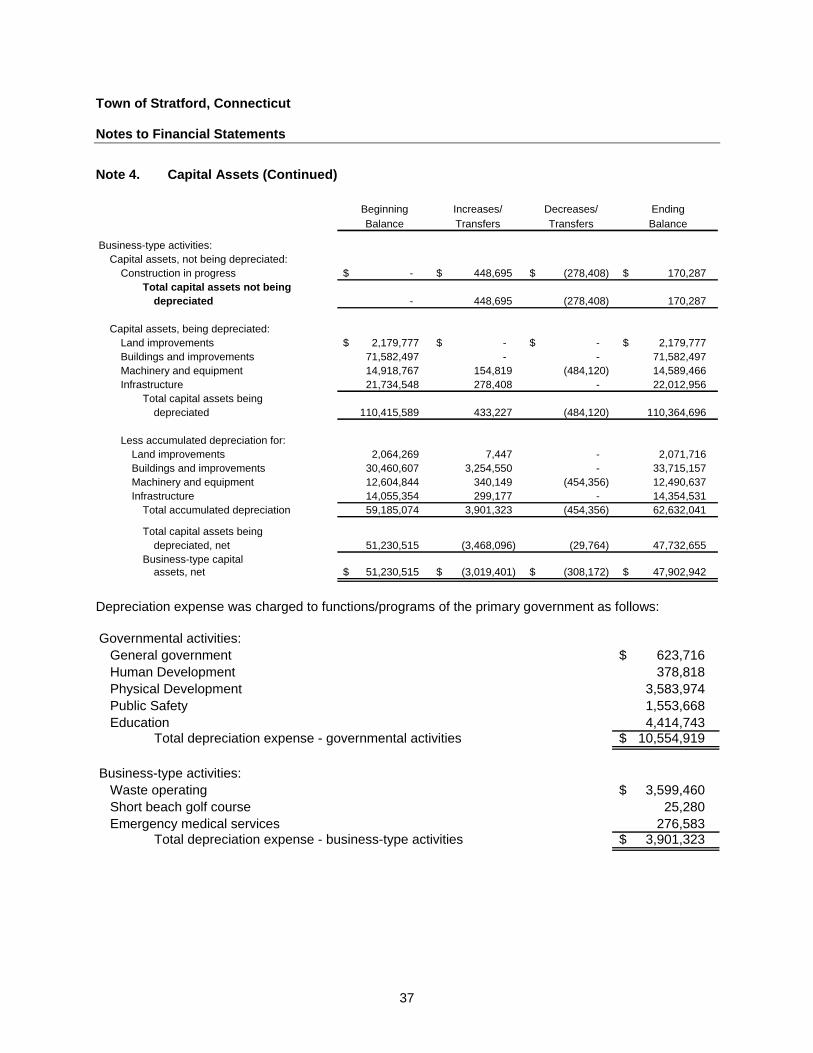
Town of Stratford, Connecticut Notes to Financial Statements
37
Note 4. Capital Assets (Continued)
Beginning Increases/ Decreases/ Ending
Balance Transfers Transfers Balance
Business-type activities:
Capital assets, not being depreciated:
Construction in progress -$ 448,695 $ (278,408) $ 170,287 $
Total capital assets not being
depreciated - 448,695 (278,408) 170,287
Capital assets, being depreciated:
Land improvements 2,179,777 $ -$ -$ 2,179,777 $
Buildings and improvements 71,582,497 - - 71,582,497
Machinery and equipment 14,918,767 154,819 (484,120) 14,589,466
Infrastructure 21,734,548 278,408 - 22,012,956
Total capital assets being
depreciated 110,415,589 433,227 (484,120) 110,364,696
Less accumulated depreciation for:
Land improvements 2,064,269 7,447 - 2,071,716
Buildings and improvements 30,460,607 3,254,550 - 33,715,157
Machinery and equipment 12,604,844 340,149 (454,356) 12,490,637
Infrastructure 14,055,354 299,177 - 14,354,531
Total accumulated depreciation 59,185,074 3,901,323 (454,356) 62,632,041
Total capital assets being
depreciated, net 51,230,515 (3,468,096) (29,764) 47,732,655
Business-type capital
assets, net 51,230,515 $ (3,019,401) $ (308,172) $ 47,902,942 $
Depreciation expense was charged to functions/programs of the primary government as follows:
Governmental activities:
General government 623,716 $
Human Development 378,818
Physical Development 3,583,974
Public Safety 1,553,668
Education 4,414,743
Total depreciation expense - governmental activities 10,554,919 $
Business-type activities:
Waste operating 3,599,460 $
Short beach golf course 25,280
Emergency medical services 276,583
Total depreciation expense - business-type activities 3,901,323 $

Town of Stratford, Connecticut Notes to Financial Statements
38
Note 5. Interfund Receivables, Payables and Transfers
As of June 30, 2017, interfund receivables and payables that resulted from various interfund transactions were as follows:
Due From Due to
Other Funds Other Funds
General Fund 4,522,013 $ 65,173,624 $
Nonmajor Governmental Funds:
Community Development - 8,377
Shellfish and Oysters 114,454 -
Railroad Property 783,673 -
Miscellaneous Grants - 951,206
Recreation 100,365 -
Department of Children and Family Services 80,745 -
Counseling Center 55,983 -
Harbor Management 192,701 -
Recycling 13,117 -
Gas Pipeline 156,100 -
Town Aid Road 337,025 -
Senior Citizens 56,745 -
Redevelopment Agency 418,074 -
Sewer Maintenance 35,576 -
Reserve Fund 367,091 -
Debt Service Fund 443,280 -
Capital Projects Funds 48,796,909 2,657,553
Enterprise Funds:
Waste Operating 5,542,936 -
Emergency Medical Services - 750,569
Internal Service Fund 7,524,542 -
69,541,329 $ 69,541,329 $
All cash is recorded in the General Fund. As a result, the balances above occur due to the use of pooled cash.
Advance to Advance from
Other Funds Other Funds
General Fund 1,114,103 $ -$
Short Beach Golf Course Fund - 1,114,103
1,114,103 $ 1,114,103 $

Town of Stratford, Connecticut Notes to Financial Statements
39
Note 5. Interfund Receivables, Payables and Transfers (Continued)
The advances amongst the funds relate to expenditures incurred due to the damage from Storm Sandy. The Short Beach Golf Course plans to repay funds with future revenues. None of the balance is scheduled to be collected in the subsequent year. Interfund transfers:
Capital Nonmajor
General Projects Governmental Total
Transfers Out
General Fund 1,900,000 $ 1,240,939 $ 181,000 $ 3,321,939 $
Waste Operating Fund 300,000 - - 300,000
Nonmajor Enterprise Funds 400,000 - - 400,000
Nonmajor Governmental Funds 693,280 - - 693,280
3,293,280 $ 1,240,939 $ 181,000 $ 4,715,219 $
Transfers In
All transfers are for regularly recurring operational transfers. These transfers represent revenue sources from the general fund and enterprise funds for capital improvement program, and transfer of unrestricted revenue from enterprise funds and railroad to the General Fund to finance various programs in accordance with budget authorizations.

Town of Stratford, Connecticut Notes to Financial Statements
40
Note 6. Long-Term Liabilities
Changes in long-term liabilities: Long-term liability activity for the year ended June 30, 2017 was as follows: For the governmental activities, claims and judgments, compensated absences, landfill closure and post closure costs, risk management, net pension liability and OPEB obligations are generally liquidated by the General Fund.
Adjustment
Beginning Effective Ending Due Within
Balance Additions Rate Method Reductions Balance One Year
Governmental Activities:
Bonds payable:
General obligation bonds
and notes 278,822,151$ 25,260,000$ -$ 20,852,239$ 283,229,912$ 21,627,239$
Premium on general
obligation bonds 6,649,630 2,989,662 997,784 394,270 10,242,806 -
Capital leases 2,260,147 291,153 - 720,795 1,830,505 672,793
Claims and judgments 3,250,000 - - - 3,250,000 -
Compensated absences 10,343,509 6,854,017 - 5,787,753 11,409,773 5,559,060
Landfill monitoring closure
and post closure costs 7,800,000 - - - 7,800,000 -
Net pension liability- PERS 68,333,836 - 7,438,930 60,894,906 -
OPEB liability 68,686,600 20,551,214 - 8,496,506 80,741,308 -
Risk management 12,825,324 8,239,850 - 7,336,017 13,729,157 -
Governmental activities
long-term liabilities 458,971,197$ 64,185,896$ 997,784$ 51,026,510$ 473,128,367$ 27,859,092$
Business-Type Activities:
General obligation bonds
payable 1,779,243$ -$ -$ 133,122$ 1,646,121$ 133,122$
Premium on general
obligation bonds 30,560 - - 30,560 - -
Notes payable 33,509,942 - - 2,235,969 31,273,973 2,281,101
Capital leases 220,885 30,143 - 54,086 196,942 51,011
Compensated absences 315,643 241,802 - 202,756 354,689 202,756
Business-type activities
long-term liabilities 35,856,273$ 271,945$ -$ 2,656,493$ 33,471,725$ 2,667,990$

Town of Stratford, Connecticut Notes to Financial Statements
41
Note 6. Long-Term Liabilities (Continued)
As of June 30, 2017, the outstanding general obligation bonded indebtedness of the Town recorded in the governmental activities was as follows:
School bonds with interest rates ranging from 2.0% to 5.125% and varying
expiration dates ranging from July 2024 to December 2033 $ 46,511,055
General obligation pension bonds with interest rates ranging from
.5% to 5.037% and varying expiration dates from June 2018 to August 2038 150,990,000
General obligation bonds with interest rates ranging from 2.0% - 5.125%
and expiration dates from July 2024 to December 2033 82,197,759
Energy bonds with interest rates of 3.24% and expiring on June 30, 2030 3,531,098
Total $ 283,229,912
The annual debt service requirements of the Town’s bonded indebtedness recorded in governmental activities described above are as follows:
Principal Interest Total
Fiscal year ending June 30:
2018 21,627,239 $ 12,575,829 $ 34,203,068 $
2019 19,125,238 11,322,789 30,448,027
2020 18,528,238 10,680,202 29,208,440
2021 17,886,238 10,054,226 27,940,464
2022 17,583,238 9,391,425 26,974,663
2023-2027 73,505,190 36,762,211 110,267,401
2028-2032 56,459,531 22,557,377 79,016,908
2033-2037 45,555,000 9,608,731 55,163,731
2038-2040 12,960,000 775,800 13,735,800
283,229,912 $ 123,728,590 $ 406,958,502 $
The State of Connecticut reimburses the Town for eligible principal and interest costs of the portion of the capital improvement bond issues used for school construction. The amount of such reimbursement for the year ended June 30, 2017 was approximately $287,000. Additional payments for bond principal aggregating approximately $465,000 are expected to be received through the bonds’ maturity dates. In-substance defeasance- prior years: In prior years, the City has defeased various bond issues by creating separate irrevocable trust funds. New debt has been issued and the proceeds have been used to purchase U.S. government securities that were placed in the trust funds. The investments and fixed earnings from the investments are sufficient to fully service the defeased debt until the debt is called or matures. For financial reporting purposes, the debt has been considered defeased and therefore removed as a liability from the City’s government-wide financial statements. The balance in escrow at June 30, 2017 was $1,400,862 which includes proceeds from the October 2013 refunding. The balance of the defeased bonds was approximately $1,375,000 at June 30, 2017. As a result, the refunded bonds are considered defeased and the liability has been removed from the basic financial statements.

Town of Stratford, Connecticut Notes to Financial Statements
42
Note 6. Long-Term Liabilities (Continued)
Bond anticipation notes: The Town uses bond anticipation notes during the construction period of various public improvements prior to the issuance of the bonds at completion of the project. On January 4, 2017, the Town Issued $25,000,000 in bond anticipation notes for various public improvements and school projects and equipment. The notes will mature on January 3, 2018. Compensated absences: Included in long-term liabilities is the estimated obligation for employee compensated absences that has not become due, aggregating $11,764,462 as of June 30, 2017. The liability for compensated absences will be funded from the General Fund and the Enterprise Funds. Unsettled contract reserve: Included in long-term liabilities is the estimated obligation for retro-pay on union contracts in negotiation as of June 30, 2017. Bond authorizations: Bonds authorized but unissued at June 30, 2017 are as follows:
General purpose 1,527,724 $
Schools 103,613,792
Sewers 1,327,141
Business-type activities obligations: At June 30, 2017, long-term debt in the Enterprise Funds consists of the following:
Energy bonds with interest rate of 3.24% and expiring on June 30, 2030 $ 399,121
Emergency Management Facility bonds with interest rates ranging from
2.0% to 5.125% and varying expiration dates ranging from
August 2022 to December 2027 1,247,000
Clean Water Fund notes, due in varying installments, plus interest at 2%,
through 2030 31,273,973
$ 32,920,094
The annual debt service requirements of the business-type activities are as follows:
Principal Interest TotalFiscal year ending June 30:
2018 2,414,223 $ 665,773 $ 3,079,996 $
2019 2,502,265 613,584 3,115,849
2020 2,551,237 559,366 3,110,603
2021 2,591,157 504,530 3,095,687
2022 2,658,044 448,557 3,106,601
2023-2027 13,783,582 1,372,499 15,156,081
2028-2032 6,419,586 159,776 6,579,362
32,920,094 $ 4,324,085 $ 37,244,179 $

Town of Stratford, Connecticut Notes to Financial Statements
43
Note 6. Long-Term Liabilities (Continued)
Debt limitation: The Town’s indebtedness does not exceed the legal debt limitations as required by the Connecticut General Statutes as reflected in the following schedule (in thousands):
Debt Net
Category Limit Indebtedness Balance
General purpose 390,211 $ 84,972 $ 305,239 $
Schools 780,422 106,006 674,416
Sewers 650,352 33,000 617,352
Urban renewal 563,638 - 563,638
Pension deficit 520,281 150,990 369,291
The total overall statutory debt limit for the Town does not exceed the legal debt limitation that is equal to seven times annual receipts from taxation ($1,213,990,085).
Capital leases: Governmental activities: The Town has entered into multi-year capital leases for the purchase of various capital items including energy efficiency improvements. During 2017 the town made principal payments of $720,795. The following is a summary of capital lease commitments as of June 30, 2017.
Amount
Year ending June 30:
2018 685,508 $
2019 626,637
2020 211,076
2021 169,533
2022 171,246
Total minimum lease payments 1,864,000
Less amount representing interest (33,495)
Present value of minimum lease payments 1,830,505 $
The assets acquired through capital leases are as follows:
Year ending June 30: Amount
Asset class:
Building and improvements 1,333,978 $
Machinery and equipment 3,251,811
Less accumulated depreciation (2,097,291)
Net book value 2,488,498 $
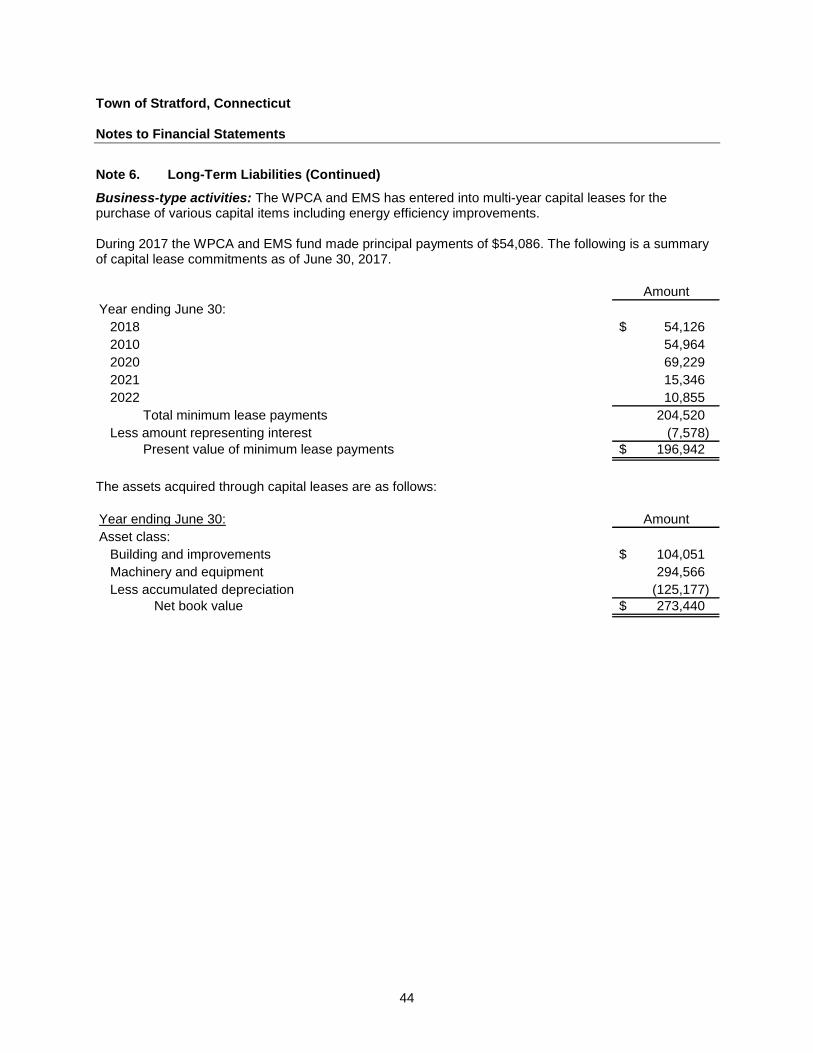
Town of Stratford, Connecticut Notes to Financial Statements
44
Note 6. Long-Term Liabilities (Continued)
Business-type activities: The WPCA and EMS has entered into multi-year capital leases for the purchase of various capital items including energy efficiency improvements. During 2017 the WPCA and EMS fund made principal payments of $54,086. The following is a summary of capital lease commitments as of June 30, 2017.
Amount
Year ending June 30:
2018 54,126 $
2010 54,964
2020 69,229
2021 15,346
2022 10,855
Total minimum lease payments 204,520
Less amount representing interest (7,578)
Present value of minimum lease payments 196,942 $
The assets acquired through capital leases are as follows:
Year ending June 30: Amount
Asset class:
Building and improvements 104,051 $
Machinery and equipment 294,566
Less accumulated depreciation (125,177)
Net book value 273,440 $

Town of Stratford, Connecticut Notes to Financial Statements
45
Note 7. Fund Balances
The components of fund balance for the governmental funds at June 30, 2017 are as follows:
Nonmajor
General Capital Governmental
Fund Projects Funds Total
Fund balances:
Nonspendable:
Inventory -$ -$ 32,811 $ 32,811 $
Prepaids 6,131 - - 6,131
Advances to other funds 1,114,103 - - 1,114,103
Restricted for:
Grants - - 337,025 337,025
Physical development - - 2,330,279 2,330,279
Education - - 604,015 604,015
Human development - - 69,340 69,340
Capital projects - 18,288,420 - 18,288,420
Committed to:
Education - - 144,860 144,860
Human development - - 1,362,161 1,362,161
Physical development - - 811,270 811,270
Public safety - - 386,901 386,901
Debt Service - - 443,280 443,280
Assigned to:
Education encumbrances 210,988 - - 210,988
Unassigned 7,983,202 - (1,486,576) 6,496,626
Total fund balances 9,314,424 $ 18,288,420 $ 5,035,366 $ 32,638,210 $
Significant encumbrances at June 30, 2017 are contained in the above table in both the assigned and committed categories Deficit fund equity:
The Town has the following fund deficits at June 30, 2017:
School Lunch Program* (354,736) $
Community Development* (97,077)
Short Beach Golf Course* (1,039,730)
Miscellaneous Grants* (1,001,952)
Internal Service** (6,130,204)
* Deficit will be eliminated through future charges for services.
** Deficit will be eliminated through future appropriations.

Town of Stratford, Connecticut Notes to Financial Statements
46
Note 8. Risk Management
The Town is exposed to various risks of loss related to torts; theft or damage to, and destruction of assets; errors and omissions for public officials and law enforcement; injuries to employees; and natural disasters. The Town purchases commercial property, boiler and machinery insurance for losses in excess of $50,000 to the Town's real estate, third party liability insurance up to $10,000,000 for claims above a $1,000,000 self-insured retention. The Town is self-insured for its medical, dental, workers’ compensation and heart and hypertension. The Town has opted to manage certain of its risks internally and has set aside assets for claim settlement in its Internal Service Fund. The Internal Service Fund services employee health and workers’ compensation claims for risk of loss. Under the program, the Town is obligated for claim payments. The Town has purchased a stop loss policy for individual claims exceeding $500,000 for hospital and major medical. All departments of the Town participate in the program and make payments to the Internal Service Fund based on estimates of the amount needed to provide for normal occurrence of claims. Claims and expenses and liabilities are reported when it is probable that a liability has been incurred at the date of the financial statements and the amount of that loss can be reasonably estimated. Liabilities calculated by actuarial valuations include amounts for claims that have been incurred but not reported. Because actual claims liabilities depend on such complex factors as inflation, changes in legal doctrines, and damage awards, the process used in computing claims liability does not necessarily result in an exact amount. The Town is self-insured for workers’ compensation and heart and hypertension benefits. The Town recognizes a liability for workers’ compensation claims payable, additional estimated losses on claims, and for claims incurred but not reported based on actuarial analysis of claim history and for other self-insured claims that are probable of loss based on a case-by-case review. Changes in the liabilities for self-insured risks are as follows:
Current
Claims Year Claims Claims
Fiscal Payable, and Changes Payment of Payable,
Year July 1 in Estimates Claims June 30
2016 10,891,000 $ 9,643,867 $ 7,709,543 $ 12,825,324 $
2017 12,825,324 8,239,850 7,336,017 13,729,157

Town of Stratford, Connecticut Notes to Financial Statements
47
Note 9. Commitments and Contingencies
Lawsuits: There are several personal injury, negligence and personnel related lawsuits pending against the Town. The outcome and eventual liability of the Town, if any, in these cases is not known at this time. Based upon consultation with legal counsel, the Town’s management estimates that potential claims against the Town not covered by insurance resulting from such litigation would not materially affect the financial position of the Town. The Town has recorded in the government-wide financial statements $3,250,000 to cover claims not covered by insurance. At this time, the Town has determined that none of the claims outstanding are due within the next 12 months. Municipal solid waste service agreement: The Town has entered into a Greater Bridgeport Regional Solid Waste Interlocal Agreement (Interlocal Agreement) which creates the Greater Bridgeport Regional Solid Waste Committee (Operating Committee) as a public body comprised of various southwest Connecticut municipalities for the purpose of, and with the authority to, contract with a solid waste facility for the disposal of municipal solid waste. Wheelabrator agreed to contract terms of $61.22 per ton up to 175,000 aggregate annual tonnage for a term of up to 20 years with a $1.00 per ton decrease for each new 25,000 tons the Operating Committee attracts and an annual Consumer Price Index escalator at 75% of the change, subject to an executable contract and Wheelabrator Board approvals.
Note 10. Other Post-Employment Benefits
Post-employment benefits: Plan description and membership: The Town, in accordance with various collective bargaining agreements, provides retiree medical benefits for the lifetime of the retired member and covered dependents. The single-employer plan covers Town, Board of Education, Police and Fire employees as further defined in collective bargaining agreements and other written materials. Eligibility and premium sharing information is detailed in the various collective bargaining agreements. The Town does not issue separate standalone financial statements for the plan. At July 1, 2016, plan membership consisted of the following:
Active members 981
Retired members 861
Beneficiaries 69
Spouses of retired members 229
Total participants 2,140
Funding policy: The Town has established an OPEB Trust Fund and makes contributions to the fund from various other fund types. This trust fund was opened for the purpose of segregating balances for post-employment benefits. The contribution requirements of plan members and the Town are negotiated with the various unions representing the employees. Retired plan members and beneficiaries currently receiving benefits are required to contribute specified amounts monthly towards the cost of health insurance premiums as follows: Town Hall: Generally, retirees and their dependents are covered after 23 years of continuous service by the retiree and, if hired after July 1, 1977, age 50, or 5 years of service and age 55.

Town of Stratford, Connecticut Notes to Financial Statements
48
Note 10. Other Post-Employment Benefits (Continued)
Medical benefits: Retire prior to July 1, 1986 - Town pays 100% of the cost for the retiree and 50% of the cost for the dependents. Retire after July 1, 1986 and prior to signing of 1987-1990 collective bargaining agreement - Town pays 75% of the cost for the retiree and 50% of the cost for the dependents. Retire after signing of 1987-1990 collective bargaining agreement - Town pays 100% of the cost for the retiree and 50% of the cost for the dependents. Life insurance: Retire before September 1, 1999 - $5,000 until age 65. Retire after September 1, 1999 - $25,000 until age 70, $5,000 thereafter. Police: Generally, retirees and their dependents are covered after 25 years of service. Medical benefits: Town pays 100% of the cost for the retiree and 50% of the cost for the dependents. Life insurance: $5,000 until age 65. Firefighters: Generally, retirees and their dependents are covered after 25 years of service. Medical benefits:
Retire prior to July 1, 1987 - Benevolent Society pays 100% of the cost for the retiree and 50% of the cost for the dependents. Retire after July 1, 1987 and prior to July 1, 1989 - Town pays 50% of the cost for the retiree and 50% of the cost for the dependents. Retire on or after July 1, 1989 - Town pays 100% of the cost for the retiree and 50% of the cost for the dependents. Public Works: Generally, retirees and their dependents are covered after 23 years of continuous service by retiree and, if hired after July 1, 1985, age 50, or 5 years of service and age 55. Medical benefits: Retire prior to July 1, 1985 - Town pays 50% of the cost for the retiree and 50% of the cost for the dependents. Retire after July 1, 1985 and prior to July 1, 1986 - Town pays 100% of the cost for the retiree and 50% of the cost for the dependents. Retire after July 1, 1986 and prior to July 1, 1987 - Town pays 75% of the cost for the retiree and 50% of the cost for the dependents. Retire on or after July 1, 1987 - Town pays 100% of the cost for the retiree and 50% of the cost for the dependents.

Town of Stratford, Connecticut Notes to Financial Statements
49
Note 10. Other Post-Employment Benefits (Continued)
Life insurance: $5,000 until age 65. Supervisors: Generally, retirees and their dependents are covered after 23 years of continuous service by retiree and, if hired after April 1, 1985, age 50, or 5 years of service and age 55. Medical benefits: Retire prior to July 2, 1985 - Town pays 50% of the cost for the retiree and 50% of the cost for the dependents. Retire after July 2, 1985 and prior to March 31, 1986 - Town pays 100% of the cost for the retiree and 50% of the cost for the dependents. Retire after April 1, 1986 and prior to September 4, 1987 - Town pays 75% of the cost for the retiree and 50% of the cost for the dependents. Retire on or after September 4, 1987 - Town pays 100% of the cost for the retiree and 50% of the cost for the dependents. Life insurance: Retire after August 2, 1985, $5,000 until age 65. BOE custodians: Generally, retirees and their dependents are covered after 23 years of continuous service by retiree and, if hired after April 1, 1985, age 50, or 5 years of service and age 55. Medical and dental benefits: Board pays 100% of the cost for the retiree and 50% of the cost for the dependents. Life insurance: $15,000.
BOE nurses: Generally, retirees and their dependents are covered after 23 years of continuous service by retiree and, if hired after July 1, 1977, age 50, or 5 years of service and age 55. Medical and dental benefits: Board pays 50% of the cost for the retiree only. BOE administrators: Generally, an administrator retiring under the Connecticut State Teachers Retirement System shall be eligible to receive health benefits for self and spouse. Normal retirement for administrators is the earliest of age 60 with 20 years of service, or completion of 35 years of service regardless of age. Early retirement is the earliest of age 60 with 10 years of service, any age with 25 years of service, or age 55 with 20 years of service. Medical and dental benefits: Board pays 50% of the cost for the retiree only. BOE paraprofessional/cafeteria workers: Generally, retirees and their dependents are covered after 23 years of continuous service by retiree and, if hired after April 1, 1985, age 50, or 5 years of service and age 55.

Town of Stratford, Connecticut Notes to Financial Statements
50
Note 10. Other Post-Employment Benefits (Continued)
Medical and dental benefits: Board pays 100% of the cost for the retiree and 50% of the cost for the dependents. Life insurance: $7,000. BOE secretaries: Generally, retirees and their dependents are covered after 23 years of continuous service by retiree and, if hired after April 1, 1985, age 50, or 5 years of service and age 55. Medical and dental benefits:
Board pays 100% of the cost for the retiree and 50% of the cost for the dependents. Life insurance: $15,000. BOE teachers: Generally, a teacher retiring under the Connecticut State Teachers Retirement System shall be eligible to receive benefits for self and spouse at the earliest age of 60 with 20 years of service, or completion of 35 years of service regardless of age. Early retirement is the earliest of age 60 with 10 years of service, any age with 25 years of service, or age 55 with 20 years of service. Medical and dental benefits: Board pays 50% of the cost for the retirees only. Description of actuarial assumptions and methods: The following is a summary of certain significant actuarial assumptions and other plan information:
Actuarial valuation date July 1, 2016
Actuarial cost method Entry Age normal
Amortization method Level percent
Remaining amortization period 21 years-decreasing
Actuarial assumptions:
Investment rate of return 4.00%
Medical Inflation Rate over 62 years 5.20-4.60%
Dental Inflation Rate 2.50%
Amortization Growth Rate 4.00%

Town of Stratford, Connecticut Notes to Financial Statements
51
Note 10. Other Post-Employment Benefits (Continued)
Annual OPEB cost and net OPEB obligations: The Town of Stratford’s annual other post-employment benefit (OPEB) cost is calculated based on the annual required contribution (ARC), an amount actuarially determined in accordance with the parameters of GASB Statement No. 45. The ARC represents a level of funding that, if paid on an ongoing basis, is projected to cover normal cost each year and amortize any unfunded actuarial liabilities (or funding excess) over a period not to exceed 30 years. The following table shows the components of the Town’s annual OPEB cost for the year, the amount actually contributed to the plan, and changes in the Town’s net OPEB obligation (asset):
OPEB Plan
Annual required contribution (ARC) 21,050,753 $
Interest on OPEB obligation 2,747,464
Adjustment to annual required contribution (3,247,003)
Annual OPEB cost 20,551,214
Contributions made 8,496,506
Increase in net OPEB obligation 12,054,708
Net OPEB obligation, beginning of year 68,686,600
Net OPEB obligation, end of year 80,741,308 $
The Town’s annual OPEB cost, the percentage of annual OPEB cost contributed to the plan, and the net OPEB obligation for the fiscal year ended June 30, 2017 is presented below. OPEB Plan
Annual Percentage Net OPEB
Fiscal OPEB Cost Actual of AOC Obligation
Year Ended (AOC) Contribution Contributed (Asset)
6/30/2015 20,333,100 $ 7,635,300 $ 37.6% 57,425,700 $
6/30/2016 19,400,100 8,139,200 42.0% 68,686,600
6/30/2017 20,551,214 8,496,506 41.3% 80,741,308
Actuarial valuations of an ongoing plan involve estimates of the value of reported amounts and assumptions about the probability of occurrence of events far into the future. Examples include assumptions about the future employment, mortality and the healthcare cost trend. Amounts determined regarding the funded status of the plan and the annual required contributions of the employer are subject to continual revision as accrual results are compared with past expectations and new estimates are made about the future. The following schedule of funding progress presents multi-year trend information about whether the actuarial value of plan assets is increasing or decreasing over time relative to the actuarial accrued liabilities for benefits.

Town of Stratford, Connecticut Notes to Financial Statements
52
Note 10. Other Post-Employment Benefits (Continued)
Schedule of Funding Progress:
UAAL as a
Actuarial Actuarial Funded Percentage of
Actuarial Value of Accrued (Unfunded) Funded Covered Covered
Valuation Assets Liability (AAL) AAL (UAAL) Ratio Payroll Payroll
Date (a) (b) (b-a) (a/b) (c) ((b-a)/c)
Town
7/1/2016 2,333,000 $ 137,276,000 $ 134,943,000 $ 1.7% 26,499,000 $ 509.2%
Board of Education
7/1/2016 1,451,000 $ 113,381,000 $ 111,930,000 $ 1.3% 46,083,000 $ 242.9%
Historical Trend Information – The schedules of funding progress, presented as required supplementary information (RSI) following the notes to the financial statements, present multi-year trend information about whether the actuarial values of plan assets are increasing or decreasing over time relative to AALs for benefits. Projections for benefits for financial reporting purposes are based on the substantive plan (the plan as understood by the employer and plan members) and include the types of benefits provided at the time of each valuation and the historical pattern of sharing benefit cost between the employer and plan members to that point. The actuarial methods and assumptions used include techniques that are designed to reduce the effects of short-term volatility in actuarial accrued liabilities and the actuarial value of assets, consistent with the long-term perspective of the calculations. GASB 74 Disclosures: Investments: Investment policy: The OPEB plan’s policy in regard to the allocation of invested assets is established and may be amended by the Board. Plan assets are managed on a total return basis with a long-term objective of achieving and maintaining a fully funded status for the benefits provided through the OPEB plan. Rate of return: For the year ended June 30, 2017, the annual money-weighted rate of return on OPEB plan investments, net of OPEB plan investment expense, was as follows. The money-weighted rate of return expresses investment performance, net of investment expense, adjusted for the changing amounts actually invested.
OPEB Plan
Rate of return 15.98%

Town of Stratford, Connecticut Notes to Financial Statements
53
Note 10. Other Post-Employment Benefits (Continued)
Net OPEB liability of the Town: During the year the Town adopted GASB Statement No. 74. This Statement requires the net OPEB liability to be measured at the total OPEB liability, less the amount of the OPEB plan’s fiduciary net position. The components of the net OPEB liability of the Town at June 30, 2017 were as follows:
Net OPEB Liability
as of June 30, 2017 OPEB Plan
Total OPEB liability 280,385,144$
Plan fiduciary net position 4,442,541
Net OPEB liability 275,942,603
Plan fiduciary net position as a
percentage of total OPEB
liability 1.58%
The Town’s net OPEB liability will be required to be recorded on the government-wide financial statement of net position at June 30, 2018.
Assumed rate of return: The long-term expected rate of return on OPEB plan investments was determined by adding expected inflation to expected long-term real returns and reflecting expected volatility and correlation. Best estimates of the real rates of returns for each major asset class are included in the OPEB plan’s target asset allocation. Best estimates of arithmetic real rates of return for each major asset class included in the OPEB plan’s target asset allocation as of July 1, 2016, and the final vestment return assumption, are summarized in the following table:
Long-Term Long-Term
Expected Expected
Real Rate Geometric Real
Asset Class Target Allocation of Return Rate of Return
US Core Fixed Income 30.00% 2.66% 2.52%
US Large Caps 20.00% 4.86% 3.61%
US MidCap Growth 10.00% 6.32% 3.96%
US MidCap Value 10.00% 5.07% 3.57%
Non-US Equity 10.00% 6.34% 4.59%
Private Real Estate Property 15.00% 3.85% 3.13%
Timber 5.00% 4.06% 3.23%
100.00% 4.27%
Assumed Inflation- Mean 2.50% 2.50%
Assumed Inflation- Standard Deviation 2.00% 2.00%
Portfolio Real Mean Return 4.32% 3.87%
Portfolio Nominal Mean Return 6.84% 6.46%
Portfolio Standard Deviation 9.12%
Long-Term Inflation Expectation 4.00%

Town of Stratford, Connecticut Notes to Financial Statements
54
Note 10. Other Post-Employment Benefits (Continued)
Discount rate: The discount rate used to measure the total OPEB liability was 6.125%. The projection of cash flows used to determine the discount rate assumed that plan member contributions will be made at the current contribution rate and that Town contributions will be made at rates equal to the difference between actuarially determined contribution rates and the member rate. Also, based on the net position of the plans and contribution policies, it was assumed the plan’s projected fiduciary net position would be sufficient to cover projected benefit payments and administrative expenses indefinitely. Therefore, the long-term expected rates of return on OPEB plan investments was applied to all periods of projected benefit payments to determine the total OPEB liability. Sensitivity of the net OPEB liability to changes in the healthcare cost trend rates: The following presents the net OPEB liability of the Town, as well as what the Town’s net OPEB liability would be if it were calculated using healthcare cost trend rates that are 1 percentage point lower or 1 percentage point higher than the current healthcare cost trend rates:
Healthcare Cost
1.0% Decrease Trend Rates 1.0% Increase
(4.2% decreasing (5.2% decreasing (6.2% increasing
Net OPEB Liability to 3.6%) to 4.6%) to 5.6%)
Net OPEB liability as of June 30, 2017 230,236,727$ 275,942,603$ 335,379,258$
Sensitivity of estimates used in calculating the net OPEB liability: The following presents the net OPEB liability of the City, calculated using the discount rate of 6.125%, as well as what the City’s net OPEB liability would be if it were calculated using a discount rate that is 1% lower or 1% higher than the rate utilized.
Current
1% Decrease Discount Rate 1% Increase
Net OPEB Liability 2.58% 3.58% 4.58%
OPEB Plan 327,242,523$ 275,942,603$ 235,612,311$
Note 11. Landfill Closure and Post-Closure Monitoring
State and federal laws and regulations require that the Town place a final cover on its closed landfill and perform certain maintenance and monitoring functions at the landfill site for 30 years after closure. The estimated total current cost of the landfill closure and post-closure care, aggregating approximately $7.8 million, is based on the amount estimated to be paid for all equipment, facilities and services required to close, monitor and maintain the landfills as of June 30, 2017. However, the actual cost of closure and post-closure care may be higher due to inflation, changes in technology or changes in landfill laws and regulations. Costs will be funded through the issuance of general obligation bonds and state and federal grants. The Town is currently in discussions with the Department of Environmental Protection to develop and implement a superfund site plan, which needs to occur prior to the capping process. Therefore, there is no current portion of the liability reflected in the financial statements. Once an agreement is established the current portion will be reported.

Town of Stratford, Connecticut Notes to Financial Statements
55
Note 12. Employee Retirement Systems and Pension Plans
Employee defined benefit pension plan: Plan description: The Town is the administrator of a single-employer defined benefit public employee retirement system (PERS) established and administered by the Town to provide pension benefits for its employees. The PERS is considered to be a part of the Town’s financial reporting entity and is included in the Town’s financial reports as the Defined Benefit Pension Trust Fund. Stand-alone plan reports are not available. As of July 1, 2016, the date of the most recent actuarial valuation, membership consisted of the following:
Retirees and beneficiaries:
Currently receiving benefits 653
Vested, benefits deferred 14
Current employees:
Active 222
Suspended 22
911
The Town covers all full-time salaried Town employees, noncertified employees of the Board of Education and all full-time uniformed and investigative employees classified as Police Officers and Firefighters. The Town provides all retirement, death and disability benefits through a single employer, contributory, defined benefit plan. Under the plan, all employees are eligible to join after their probationary period. Summary of significant accounting policies and plan asset matters: Basis of Accounting: Plan financial statements are prepared using the accrual basis of accounting. Employee contributions are recognized in the period in which the contributions are due. Employer contributions to the plan are recognized when due and the Town has made a formal commitment to provide the contributions. Benefits and refunds are recognized when due and payable in accordance with the terms of the plan. Administrative costs are funded with investment earnings of the plan. Method used to value investments: Investments are reported at fair value. Investment income is recognized when earned and gains and losses on sales or exchanges of investments are recognized on the transaction date. Unrealized gains and losses due to appreciation and depreciation of Plan assets are also recognized at fiscal year-end. Funding policy: The PERS is a contributory defined benefit plan. Participants in the State Teachers’ Retirement System and officials elected by popular vote are excluded. Employees hired after age 45 are also excluded, but included in a separate defined contribution plan. Also, police and firefighters are included in a separate defined contribution annuity plan as well as the defined benefit plan. Under the Town’s defined benefit plan, all employees hired and working 20 hours or more per week are eligible. Employees are 100% vested after 10 years of service. The retirement benefit is calculated at 2.4% of average compensation during the 24 months immediately prior to retirement multiplied by up to 25 years of service. The calculation for service over 25 years varies by union contract. Employees are required to contribute 8% of their salaries to the defined benefit plan except for Police hired after October 17, 1996 who contribute 7%. If an employee leaves covered employment or dies before 10 years of service, accumulated employee contributions and related investment earnings are refunded. The Town is required to contribute the remaining amounts necessary to finance the coverage for its employees. Benefits and contributions are established by the Town and may be amended only by the Town Council and Union negotiations.

Town of Stratford, Connecticut Notes to Financial Statements
56
Note 12. Employee Retirement Systems and Pension Plan (Continued)
Net pension liability: The Town’s net pension liability was measured as of June 30, 2017, and the total pension liability used to calculate the net pension liability was determined by an actuarial valuation as of July 1, 2016. Investments: Investment policy: The Plan’s policy in regards to the allocation of invested assets is established and may be amended by the Pension Board. Plan assets are managed on a total return basis with a long-term objective of achieving and maintaining a fully funded status for the benefits provided through the pension plan. The following was the adopted allocation policy as of June 30, 2017. The long-term expected rate of return on pension plan investments was determined using a building-block method in which best-estimate ranges of expected future real rates of return (expected returns, net of pension plan investment expense and inflation) are developed for each major asset class. These ranges are combined to produce the long-term expected rate of return by weighting the expected future real rates of return by the target asset allocation percentage and by adding expected inflation. The target allocation and best estimates of arithmetic real rates of return for each major asset class are summarized in the following table:
Long-Term Long-Term
Expected Expected
Arithmetic Geometric
Target Real Rate Real Rate
Asset Class Index Allocation* of Return of Return
Core Fixed Income Barclays Aggregate 30.00% 2.66% 2.52%
US Large Caps S&P 500 20.00% 4.86% 3.61%
US MidCap Growth Russell Mid Cap Growth 10.00% 6.32% 3.96%
US MidCap Value Russell Mid Cap Value 10.00% 5.07% 3.57%
Non-US Equity MSCH ACWI xUS NR 10.00% 6.34% 4.59%
Real Estate (Property) NCREIF Property 15.00% 3.85% 3.13%
Timber NCREIF Timber 5.00% 4.06% 3.23%
Assumed Inflation - Mean 2.50% 2.50%
Assumed Inflation - Standard Deviation 2.00% 2.00%
Portfolio Real Mean Return 4.32% 3.87%
Portfolio Nominal Mean Return 6.84% 6.46%
Portfolio Standard Deviation 9.12%
Long-term expected rate of return 6.75% Rate of return: For the year ended June 30, 2017, the annual money-weighted rate of return on pension plan investments, net of pension plan investment expense, was 12.38 percent. The money-weighted rate of return expresses investment performance, net of investment expense, adjusted for the changing amounts actually invested.

Town of Stratford, Connecticut Notes to Financial Statements
57
Note 12. Employee Retirement Systems and Pension Plan (Continued)
Net pension liability of the Town: The components of the net pension liability of the Town at June 30, 2017 were as follows:
Total Pension Plan Fiduciary Net Pension
Liability Net Position Liability
Change in the Net Pension Liability (a) (b) (a) - (b)
Balances at 6/30/16 307,931,115 $ 239,597,279 $ 68,333,836 $
Changes for the year:
Service cost 3,168,833 - 3,168,833
Interest 20,268,238 - 20,268,238
Effect of plan changes - - -
Effect of economic/demographic gains
or losses 4,547,704 - 4,547,704
Contributions - employer - 5,385,385 (5,385,385)
Contributions - Member - 1,447,209 (1,447,209)
Net Investment Income - 28,886,764 (28,886,764)
Benefit payments, including refunds of
employee contributions (22,019,024) (22,019,024) -
Administrative expense - (295,653) 295,653
Net changes 5,965,751 13,404,681 (7,438,930)
Balances at 6/30/17 313,896,866 $ 253,001,960 $ 60,894,906 $
Increase (Decrease)
Actuarial assumptions: The total pension liability was determined by an actuarial valuation as of July 1, 2016, calculated based on the discount rate and actuarial assumptions below, and then was projected forward to the measurement date June 30, 2017. There have been no significant changes between the valuation date and the fiscal year-end. Discount rate:
Discount rate 6.75%
Long-term expected rate of return, net of investment expense and including inflation 6.75%
Municipal bond rate N/A

Town of Stratford, Connecticut Notes to Financial Statements
58
Note 12. Employee Retirement Systems and Pension Plans (Continued)
Other key actuarial assumptions: The Plan has not had a formal actuarial experience study performed.
Discount rate: The discount rate used to measure the total pension liability was 6.75%. The projection of cash flows used to determine the discount rate assumed that contributions from plan members will be made at the current contribution rate and that contributions from the Town will be made at contractually required rates, actuarially determined. Based on those assumptions, the pension plan’s fiduciary net position was projected to be available to make all projected future benefit payments of current plan members. Therefore, the long-term expected rate of return on pension plan investments was applied to all periods of projected benefit payments to determine the total pension liability. Sensitivity analysis: The following table presents the net pension liability of the Town, calculated using the discount rate of 6.75%, as well as what the Town’s net pension liability would be if it were calculated using a discount rate that is 1 percentage point lower (5.75%) or 1 percentage point higher (7.75%) than the current rate.
1% Current 1%
Decrease Discount Rate Increase
5.75 6.75 7.75
Total pension liability 347,979,274 $ 313,896,866 $ 285,056,827 $
Fiduciary net pension 253,001,960 253,001,960 253,001,960
Net pension liability 94,977,314 $ 60,894,906 $ 32,054,867 $
For the year ended June 30, 2017, the Town of Stratford recognized pension expense of $10,570,351. As of June 30, 2017, the deferred inflows and outflows of resources are as follows:
Deferred Inflows Deferred Outflows
of Resources of Resources Net
Differences between expected and
actual experience (118,264) $ 3,263,030 $ 3,144,766 $
Net difference between projected and
actual earnings - 3,022,154 3,022,154
(118,264) $ 6,285,184 $ 6,166,920 $
Valuation date July 1, 2016
Measurement date June 30, 2017
Inflation 2.250%
Salary increases including inflation 4.0%
Mortality RP-2000 Combined Healthy Mortality with generational
projection per Scale AA
Actuarial cost method Entry Age Normal
Asset valuation method 5 years, non-asymptotic recognition method

Town of Stratford, Connecticut Notes to Financial Statements
59
Note 12. Employee Retirement Systems and Pension Plans (Continued)
Amounts reported in deferred outflows of resources and deferred inflow s of resources related to pensions will be recognized in pension expense as follows:
Year ended June 30:
2018 4,209,715 $
2019 3,663,638
2020 941,134
2021 (2,647,567)
2022 -
Thereafter -
6,166,920 $
Connecticut State Teachers’ Retirement System: Description of system: All certified personnel within the Town’s school system participate in a retirement system administered by the Connecticut State Teachers’ Retirement Board. This Connecticut State Teachers’ Retirement System (the System) is a cost sharing multiple employer defined benefit pension system with a special funding situation. The System is considered a part of the State of Connecticut financial reporting entity and is included in the State’s financial reports as a pension trust fund. Those reports may be obtained at www.ct.gov. The System is administered under the provisions of Chapter 167a of the Connecticut General Statutes (CGS). Participation in the System is restricted to certified staff employed in the public schools of Connecticut and members of the professional staff of the State Department of Education or the board of Governors of Higher Education and their constituent units. Participation in the System is mandatory for certified personnel of local boards of education who are employed for an average of at least one-half of a school day. Members of the professional staff of the State Department of Education or the Board of Governors of Higher Education and their constituent units may elect to participate in this system, the State Employees’ Retirement System, or the Alternate Retirement System (TIAA-CREF). Summary of significant accounting policies: For purposes of measuring the liability, deferred outflows of resources and deferred inflows of resources, and expense associated with the State’s requirement to contribute to the System, information about System’s fiduciary net position and additions to/deductions from the System’s fiduciary net position have been determined on the same basis as they are reported by the System. For this purpose, benefit payments (including refunds of contributions) are recognized when due and payable in accordance with the benefit terms. Investments are reported at fair value. The Town has recorded, in the General Fund, intergovernmental revenue and education expenditures in the amount of $19,530,741 as payments made by the State of Connecticut on-behalf of the Town. The Town does not have any liability for teacher pensions. Benefits provided: The benefits provided to participants by the System are as follows: Normal benefit: A member at age 60 with 20 years of Credited Service in Connecticut, or 35 years of Credited Service including at least 25 years of service in Connecticut is eligible for vested benefits of 2% of average annual salary times years of credited service (maximum benefit is 75% of average annual salary.)

Town of Stratford, Connecticut Notes to Financial Statements
60
Note 12. Employee Retirement Systems and Pension Plans (Continued)
Prorated benefit: A member who completes 10 years of Connecticut public school service is eligible for a vested benefit commencing at age 60. The benefit is 2% less 0.1% for each year less than 20 years of average annual salary times years of credited service.
Minimum benefit: Effective January 1, 1999, Public Act 98-251 provides a minimum monthly retirement benefit of $1,200 to teachers who retire under the Normal benefit provisions and who have completed at least 25 years of full time Connecticut service at retirement. Contribution requirements: The pension contributions made by the State to the System are determined on an actuarial reserve basis as described in CGS Sections 10-1831 and 10-183z. Actuarial assumptions: The actuarial assumptions used in the June 30, 2016 valuation were based on the results of an actuarial experience study for the period July 1, 2010 - June 30, 2015. The total pension liability was determined by an actuarial valuation as of June 30, 2016, using the following key actuarial assumptions: Inflation 2.75 Percent Salary increases, including inflation 3.25-6.50 Percent Long-term investment rate of return, net of pension investment expense, including inflation 8.00 Percent Economic assumptions: 1. Reduce the inflation assumption from 3.00% to 2.75%. 2. Reduce the real rate of return assumption from 5.50% to 5.25% which, when combined with the
inflation assumption change results in a decrease in the investment rate of return assumption from 8.50% to 8.00%.
3. Reduce the annual rate of wage increase assumption from 0.75% to 0.50%. 4. Slightly modify the merit portion of the salary scale. 5. Reduce the payroll growth assumption from 3.75% to 3.25%. Demographic assumptions: 6. Update mortality tables to projected versions of the RPH-2014 mortality tables. 7. Increase normal retirement rates for females at most ages and proratable retirement rates for males
at most ages. Decrease early retirement rates for both males and females. 8. Increase rates of withdrawal. 9. Decrease rates of disability for males. Mortality rates were based on the RP-2014 White Collar Table with employee and annuitant rates blended from ages 50 to 80, projected to the year 2020 using the BB improvement scale, and further adjusted to grade in increased rates (5% for females and 8% for males) over the age 80 for the period after service retirement and for dependent beneficiaries as well as active members. The RPH-2014 Disability table projected to 2017 with scale BB is used for the period after disability retirement dependent beneficiaries.

Town of Stratford, Connecticut Notes to Financial Statements
61
Note 12. Employee Retirement Systems and Pension Plans (Continued)
The long-term expected rate of return on pension investments was determined using a log-normal distribution analysis in which best-estimate ranges of expected future real rates of return (expected returns, net of pension investment expense and inflation) are developed for each major asset class. These ranges are combined to produce the long-term expected rate of return by weighting the expected future real rates of return by the target asset allocation percentage and by adding expected inflation. The target asset allocation and best estimates of arithmetic real rates of return for each major asset class are summarized in the following table:
Long-Term
Expected Rate
Asset Class Target Allocation of Return
Large Cap U.S. Equities 21% 5.8%
Developed Non-U.S. 18% 6.6%
Emerging Markets (non-U.S.) 9% 8.3%
Core Fixed Income 7% 1.3%
Inflation Linked Bond Fund 3% 1.0%
Emerging Market Bond 5% 3.7%
High Yield Bonds 5% 3.9%
Real Estate 7% 5.1%
Private Equity 11% 7.6%
Alternative Investments 8% 4.1%
Cash 6% 0.4%
100%
Discount rate: The discount rate used to measure the total pension liability was 8.00 percent. The projection of cash flows used to determine the discount rate assumed that member contributions will be made at the current contribution rate and that State contributions will be made at the actuarially determined rates in future years. Based on those assumptions, the pension’s fiduciary net position was projected to be available to make all projected future benefit payments of current members. Therefore, the long-term expected rate of return on pension investments was applied to all periods of projected benefit payments to determine the total pension liability. Sensitivity of the proportionate share of the net pension liability to changes in the discount rate: The following presents the State’s proportionate share of the net pension liability associated with the Town, calculated using the discount rate of 8.00 percent, as well as what the net pension liability would be if it were calculated using a discount rate that is 1-percentage-point lower (7.00 percent) or 1-percentage-point higher (9.00 percent) than the current rate.
1% Current 1%
Decrease Discount Rate Increase
7.00% 8.00% 9.00%
Net pension liability 220,949,858 $ 179,093,051 $ 143,709,068 $

Town of Stratford, Connecticut Notes to Financial Statements
62
Note 12. Employee Retirement Systems and Pension Plans (Continued)
Pension liabilities, pension expense, and deferred inflows/outflows of resources: The State makes all contributions to the System on behalf of employees of the participating districts. Therefore, participating employers are considered to be in a special funding situation as defined by Governmental Accounting Standards Board No. 68 and the State is treated as a non-employer contributing entity in the System. Since the districts do not contribute directly to the System, there is no net pension liability or deferred inflows or outflows to report in the financial statements of the Town. The portion of the net pension liability that was associated with the Town was $179,093,051and 100% of the collective net pension liability is allocated to the State. June 30, 2016 is the actuarial valuation date upon which the total pension liability is based. There were no changes in assumptions or benefits that affected the measurement of the total pension liability since the prior measurement date. The Town recognized the total pension expense associated with the Town as well as revenue in an amount equal to the non-employer contributing entities’ total proportionate share of the collective pension expense associated with the Town. For the fiscal year ended June 30, 2017, the Town recognized $19,530,741 as the amount expended by the State on behalf of the Town to meet the State’s funding requirements. Defined contribution pension plan: The Town administers a defined contribution pension plan that was opened to new members and contributions beginning in 1999. In a defined contribution plan, benefits depend solely on the amounts contributed to the plan plus investment earnings. Employees are vested after five years of service with the Town and contribute between 6-8% annually, depending on the union. Plan investments are reported at fair value. The Town has no fiduciary responsibility over the assets of the Plan and therefore not included in the Town’s financial statements. Benefits and contributions are established by the Town and may be amended by the Town Council and union negotiations. The Town’s contribution for the fiscal years ended June 30, 2017 and 2016, were $1,395,408 and $1,184,955, respectively.
Note 13. Governmental Accounting Standards Board (GASB) Statements
The Governmental Accounting Standards Board (GASB) has issued several pronouncements that have effective dates that may impact future financial presentations. Management has not currently determined what, if any, impact implementation of the following statements may have on the financial statements, except for GASB 75, which will most likely have a material impact, the estimated increase in liabilities is approximately $187 million:
GASB Statement No. 75, Accounting and Financial Reporting for Postemployment Benefits Other Than Pensions, addresses reporting by governments that provide OPEB to their employees and for governments that finance OPEB for employees of other governments. Statement 75 requires governments to report a liability on the face of the financial statements for the OPEB that they provide. Statement 75 carries forward from Statement 45 the option to use a specified alternative measurement method in place of an actuarial valuation for purposes of determining the total OPEB liability for benefits provided through OPEB plans in which there are fewer than 100 plan members (active and inactive). This option was retained in order to reduce costs for smaller governments. The provisions of this Statement are effective for fiscal years beginning after June 15, 2017.

Town of Stratford, Connecticut Notes to Financial Statements
63
Note 13. Governmental Accounting Standards Board (GASB) Statements (Continued)
GASB Statement No. 81, Irrevocable Split-Interest Agreements. This Statement requires that a government that receives resources pursuant to an irrevocable split-interest agreement recognize assets, liabilities, and deferred inflows of resources at the inception of the agreement. Furthermore, this Statement requires that a government recognize assets representing its beneficial interests in irrevocable split-interest agreements that are administered by a third party, if the government controls the present service capacity of the beneficial interests. This Statement requires that a government recognize revenue when the resources become applicable to the reporting period. The requirements of this Statement are effective for financial statements for periods beginning after December 15, 2016, and should be applied retroactively.
GASB Statement No. 83, Certain Asset Retirement Obligations. This Statement addresses accounting and financial reporting for certain asset retirement obligations (AROs). An ARO is a legally enforceable liability associated with the retirement of a tangible capital asset. .A government that has legal obligations to perform future asset retirement activities related to its tangible capital assets should recognize a liability based on the guidance in this Statement. The requirements of this Statement are effective for reporting periods beginning after June 15, 2018. Earlier application is encouraged.
GASB Statement No. 84, Fiduciary Activities. The objective of this Statement is to improve guidance regarding the identification of fiduciary activities for accounting and financial reporting purposes and how those activities should be reported. This Statement establishes criteria for identifying fiduciary activities of all state and local governments. The focus of the criteria generally is on (1) whether a government is controlling the assets of the fiduciary activity and (2) the beneficiaries with whom a fiduciary relationship exists. Separate criteria are included to identify fiduciary component units and postemployment benefit arrangements that are fiduciary activities. The requirements of this Statement are effective for reporting periods beginning after December 15, 2018. Earlier application is encouraged.
GASB Statement No. 85, Omnibus 2017. The objective of this Statement is to address practice issues that have been identified during implementation and application of certain GASB Statements. This Statement addresses a variety of topics including issues related to blending component units, goodwill, fair value measurement and application, and postemployment benefits (pensions and other postemployment benefits). The requirements of this Statement are effective for reporting periods beginning after June 15, 2017. Earlier application is encouraged.
GASB Statement No. 86, Certain Debt Extinguishment Issues. The primary objective of this Statement is to improve consistency in accounting and financial reporting for in-substance defeasance of debt by providing guidance for transactions in which cash and other monetary assets acquired with only existing resources—resources other than the proceeds of refunding debt—are placed in an irrevocable trust for the sole purpose of extinguishing debt. This Statement also improves accounting and financial reporting for prepaid insurance on debt that is extinguished and notes to financial statements for debt that is defeased in substance. The requirements of this Statement are effective for reporting periods beginning after June 15, 2017. Earlier application is encouraged.

Town of Stratford, Connecticut Notes to Financial Statements
64
Note 13. Governmental Accounting Standards Board (GASB) Statements (Continued)
GASB Statement No. 87, Leases. The objective of this Statement is to better meet the information needs of financial statement users by improving accounting and financial reporting for leases by governments. This Statement increases the usefulness of governments’ financial statements by requiring recognition of certain lease assets and liabilities for leases that previously were classified as operating leases and recognized as inflows of resources or outflows of resources based on the payment provisions of the contract. It establishes a single model for lease accounting based on the foundational principle that leases are financings of the right to use an underlying asset. Under this Statement, a lessee is required to recognize a lease liability and an intangible right-to-use lease asset, and a lessor is required to recognize a lease receivable and a deferred inflow of resources, thereby enhancing the relevance and consistency of information about governments’ leasing activities. The requirements of this Statement are effective for reporting periods beginning after December 15, 2019. Earlier application is encouraged.

Required Supplementary Information - unaudited


65
Town of Stratford, Connecticut RSI-1
Required Supplementary Information - unaudited
Schedule of Revenues and Other Financing Sources - Budget and Actual -
(Non-GAAP Budgetary Basis)
For the Year Ended June 30, 2017
Actual
Budgetary Variance With
Original Final Basis Final Budget
Property taxes:
Current levy 169,380,005$ 169,380,005$ 169,528,481$ 148,476$
Arrears 3,410,000 3,410,000 3,916,331 506,331
Interest and lien fees 611,500 611,500 675,815 64,315
Motor Vehicle Personal Property Grant 1,130,316 1,130,316 1,130,316 -
Total property taxes 174,531,821 174,531,821 175,250,943 719,122
Intergovernmental revenues:
State:
Airplane Registration Fee 50,000 50,000 65,060 15,060
Civil Preparedness 19,200 19,200 51,301 32,101
Elderly Freeze Tax Relief 6,000 6,000 2,834 (3,166)
In Lieu of State Property 122,286 122,286 122,285 (1)
Mashantucket Indian Grant 160,760 160,760 160,760 -
Municipal Revenue Sharing 2,907,689 2,907,689 3,507,689 600,000
Municipal Sales Tax Grant 1,627,064 1,627,064 - (1,627,064)
Payment in lieu of taxes 226,500 226,500 186,043 (40,457)
ST Telecom Pers Property 125,000 125,000 145,630 20,630
State Circuit Breaker 560,000 560,000 498,592 (61,408)
State Disability Exemption 9,900 9,900 8,298 (1,602)
State Education Cost Sharing 21,711,782 21,711,782 21,277,643 (434,139)
State Health CGS 10-217A 83,530 83,530 60,204 (23,326)
State In-School Security Grant - - 23,180 23,180
State NonPublic Transportation 91,607 91,607 - (91,607)
State Public Transportation 252,949 252,949 - (252,949)
State School Bond Interest 35,137 35,137 14,390 (20,747)
State School Bond Principal 258,085 258,085 258,085 -
State Special Education Grant 1,984,982 1,984,982 1,984,982 -
Veterans Added Relief 153,000 153,000 138,947 (14,053)
Total state 30,385,471 30,385,471 28,505,923 (1,879,548)
Total intergovernmental revenues 30,385,471 30,385,471 28,505,923 (1,879,548)
Departmental revenues:
Town Clerk 812,200 812,200 1,042,903 230,703
Planning and Zoning 97,500 112,500 179,472 66,972
Health Department 105,950 105,950 161,441 55,491
Education 143,310 143,310 109,810 (33,500)
Public Works 571,200 571,200 476,521 (94,679)
Finance 300,000 300,000 201,771 (98,229)
Recreation 59,000 59,000 66,212 7,212
Sanitation 320,000 320,000 381,754 61,754
Inland Wetlands 16,000 16,000 30,849 14,849
Police 100,900 100,900 174,198 73,298
Baldwin Center 9,000 9,000 6,977 (2,023)
Police Special Duty 90,000 90,000 90,490 490
Police Investigation - - 24,926 24,926
Police Patrol - - 24,594 24,594
Police Special Duty - - 1,162,397 1,162,397
Public Works Outside - - 2,342 2,342
Town Attorney - - 116,242 116,242
Total departmental revenues 2,625,060 2,640,060 4,252,899 1,612,839
(Continued)
Budgeted Amounts

66
Town of Stratford, Connecticut RSI-1
Required Supplementary Information - unaudited
Schedule of Revenues and Other Financing Sources - Budget and Actual -
(Non-GAAP Budgetary Basis) (Continued)
For the Year Ended June 30, 2017
Actual
Budgetary Variance With
Original Final Basis Final Budget
Licenses and permits:
Building permits 700,000 $ 700,000 $ 583,222 $ (116,778) $
Boothe Memorial Park income 36,000 36,000 38,365 2,365
Building education training fee 1,400 1,400 13,502 12,102
Public Works licenses 1,300 1,300 15,920 14,620
Street and sewer permits 20,000 20,000 20,375 375
Beach stickers/concessions 125,000 125,000 87,264 (37,736)
Total licenses and permits 883,700 883,700 758,648 (125,052)
Investment income 84,000 84,000 122,817 38,817
Other:
Gain on Sale (land) 500,000 500,000 - (500,000)
Custodial Revenue 157,000 157,000 169,484 12,484
Beach House Rental - - 12,500 12,500
Fire & Liability Reimbursement 398,290 398,290 271,391 (126,899)
Fire Admin Misc Revenue 35,000 35,000 46,353 11,353
Health Reimbursements 8,450 8,450 7,130 (1,320)
Medical Examination Reimburse 16,000 16,000 26,055 10,055
Medicare Reimbursement 125,000 125,000 - (125,000)
Misc Rental Baldwin 3,000 3,000 2,159 (841)
Misc Rental Cell Tower 115,000 115,000 153,829 38,829
Misc Rental Land use rent 50,000 50,000 50,000 -
Misc Revenue 216,663 216,663 399,233 182,570
Other - Boothe Estate 67,000 67,000 66,439 (561)
Other - Insurance Recovery 50,000 50,000 23,451 (26,549)
Other - Workers Comp Recovery 50,000 50,000 54,790 4,790
Land use rent 600,000 600,000 600,000 -
Social Security Reimbursement 225,000 225,000 172,654 (52,346)
Workers Comp Claim Reimburse 224,515 224,515 224,515 -
Total other 2,840,918 2,840,918 2,279,983 (560,935)
Total revenues 211,350,970 211,365,970 211,171,213 (194,757)
(Continued)
Budgeted Amounts

67
Town of Stratford, Connecticut RSI-1
Required Supplementary Information - unaudited
Schedule of Revenues and Other Financing Sources - Budget and Actual -
(Non-GAAP Budgetary Basis) (Continued)
For the Year Ended June 30, 2017
Actual
Budgetary Variance With
Original Final Basis Final Budget
Other financing sources:
Bond Premium - - 2,963,886 2,963,886
Transfers in 3,993,280 $ 3,993,280 $ 3,293,280 $ 700,000 $
Total other financing sources 3,993,280 3,993,280 6,257,166 3,663,886
Total 215,344,250 $ 215,359,250 $ 217,428,379 3,469,129 $
Budgetary revenues are different than GAAP
revenues because:
State of Connecticut on-behalf contributions
to the Connecticut State Teachers'
Retirement System for Town teachers
are not budgeted. 19,530,741
Public safety overtime reimbursements (881)
Public works reimbursements (448,981)
Dog Fund revenue not budgeted in the
General Fund. 32,254
Insurance and Worker's Compensation Reimbursements (495,906)
Total revenues and other financing
sources as reported on the statement of
revenues, expenditures and changes in
fund balances - governmental funds -
Exhibit IV 236,045,606 $
See note to required supplementary information.
Budgeted Amounts

68
Town of Stratford, Connecticut RSI-2
Required Supplementary Information - unaudited
Schedule of Expenditures and Other Financing Uses - Budget and Actual -
(Non-GAAP Budgetary Basis)
For the Year Ended June 30, 2017
Actual
Budgetary Variance With
Original Final Basis Final Budget
Administration:
Council Clerk 142,804 $ 142,804 $ 103,042 $ 39,762 $
Office of the Mayor 280,106 280,106 289,245 (9,139)
Human Resources 677,640 677,640 677,909 (269)
Town Attorney 1,164,936 1,164,936 2,007,006 (842,070)
Chief Administrative Officer 191,440 191,440 206,351 (14,911)
Department of Planning 270,438 285,438 310,090 (24,652)
Registrar of Voters 287,022 287,022 283,334 3,688
Town Clerk 358,686 358,686 325,474 33,212
Town Buildings 673,100 585,100 584,493 607
Agencies 227,320 227,320 221,655 5,665
Information Technology 520,423 520,423 488,939 31,484
Total Administration 4,793,915 4,720,915 5,497,538 (776,623)
Debt/Overhead
Contingency 3,598,336 3,598,336 2,851,912 746,424
Debt Interest 4,230,347 4,230,347 4,230,347 -
Debt Principal 6,748,643 6,748,643 6,748,643 -
Employee Benefits 30,484,453 30,484,453 30,969,114 (484,661)
Total Debt/Overhead 45,061,779 45,061,779 44,800,016 261,763
Finance
Administration 170,151 170,151 178,383 (8,232)
Accounting 528,375 528,375 498,601 29,774
Purchasing 163,624 163,624 159,747 3,877
Tax Assessor 470,291 470,291 449,595 20,696
Tax Collector 479,260 479,260 418,420 60,840
Total Finance 1,811,701 1,811,701 1,704,746 106,955
Human Development
Community Services 273,317 273,317 273,435 (118)
Economic Community Development 248,090 248,090 239,431 8,659
Health Department 603,565 603,565 658,526 (54,961)
Recreation Department 709,892 709,892 716,490 (6,598)
Senior Services 551,699 586,699 550,678 36,021
Sterling House 161,483 161,483 161,483 -
Stratford Library Association 3,044,040 3,044,040 3,026,688 17,352
Visiting Nurses Association 500 53,500 53,500 -
Short Beach 189,716 189,716 214,651 (24,935)
Total Human Development 5,782,302 $ 5,870,302 $ 5,894,882 (24,580) $
(Continued)
Budgeted Amounts

69
Town of Stratford, Connecticut RSI-2
Required Supplementary Information - unaudited
Schedule of Expenditures and Other Financing Uses - Budget and Actual -
(Non-GAAP Budgetary Basis) (Continued)
For the Year Ended June 30, 2017
Actual
Budgetary Variance With
Original Final Basis Final Budget
Physical development:
Public works:
Administration 466,917 $ 466,917 $ 468,932 $ (2,015) $
Building inspection 244,468 244,468 260,509 (16,041)
Building maintenance 1,695,542 1,695,542 1,678,036 17,506
Engineering 349,366 349,366 346,219 3,147
Parks 2,184,902 2,184,902 2,152,017 32,885
Highways 2,460,111 2,460,111 2,280,843 179,268
Town garage 673,800 673,800 635,469 38,331
Sanitation/refuse 4,131,827 4,131,827 3,888,778 243,049
Total 12,206,933 12,206,933 11,710,803 496,130
Public Safety
Fire Department:
Communication Center 1,103,599 1,103,599 1,044,999 58,600
Fire Administration 471,278 471,278 500,313 (29,035)
Fire Prevention 393,393 393,393 343,470 49,923
Fire Surpression 11,513,796 11,513,796 11,757,666 (243,870)
Police Department:
Administration 933,884 933,884 943,381 (9,497)
Investigation 1,820,425 1,820,425 2,086,556 (266,131)
Patrol 6,195,868 6,195,868 7,351,929 (1,156,061)
Traffic 585,169 585,169 579,132 6,037
Professional standards 613,001 613,001 633,734 (20,733)
Police Records 400,266 400,266 335,503 64,763
Total Public Safety 24,030,679 24,030,679 25,576,683 (1,546,004)
Board Of Education 106,795,002 106,795,002 106,575,340 219,662
(Continued)
Budgeted Amounts

70
Town of Stratford, Connecticut RSI-2
Required Supplementary Information - unaudited
Schedule of Expenditures and Other Financing Uses - Budget and Actual -
(Non-GAAP Budgetary Basis) (Continued)
For the Year Ended June 30, 2017
Actual
Budgetary Variance With
Original Final Basis Final Budget
Other financing uses:
Transfers out 14,861,939 $ 14,861,939 $ 14,861,939 $ -$
Total 215,344,250 $ 215,359,250 $ 216,621,947 (1,262,697) $
Budgetary expenditures are different than GAAP expenditures because:
State of Connecticut on-behalf payments to the Connecticut State Teachers'
Retirement System for Town teachers are not budgeted. 19,530,741
Encumbrances for purchases and commitments ordered but not received are
reported in the year the order is placed for budgetary purposes, but in the year 8,798
received for financial reporting purposes. (198,922)
The Town does not budget for capital leases issuances in the general fund.
These amounts are recorded as revenue and expenditures for GAAP
financial statement purposes.
Public safety overtime reimbursements (881)
Public works reimbursements (448,981)
Dog Fund expenditures not budgeted in the general fund. 40,007
Bond Premium Principal Retirement
Insurance and Worker's Compensation reimbursements (495,906)
Total expenditures and other financing uses as reported on the statement of
revenues, expenditures and changes in fund balances - governmental
funds - Exhibit IV 235,056,803 $
See notes to required supplementary information.
Budgeted Amounts

71
Town of Stratford, Connecticut RSI-3
Required Supplementary Information - unaudited
Schedules of Employer Contributions and Funding Progress - OPEB
June 30, 2017
Fiscal Annual
Year Ended Required Percentage
June 30, Contribution Contributed
2010 14,021,800 $ 73.500%
2011 14,921,000 72.2%
2012 10,901,300 104.5%
2013 11,643,400 102.0%
2014 13,330,000 87.4%
2015 20,482,200 71.1%
2016 19,699,700 79.2%
2017 21,050,753 0.0%
Schedule of Employer Contributions - OPEB
Actuarial Actuarial Funded AAL (UAAL)
Actuarial Value of Accrued (Unfunded) Funded Covered as a Percentage
Valuation Assets Liability (AAL) AAL (UAAL) Ratio Payroll of Covered Payroll
Date (A) (B) (B-A) (A/B) (C) (D)
Town - OPEB
7/1/2008 -$ 58,760,000 $ 58,760,000 $ 0.00% N/A N/A
7/1/2010 630,000 67,290,000 66,660,000 0.94% N/A N/A
7/1/2012 862,158 56,342,736 55,480,578 1.53% N/A N/A
7/1/2014 2,054,000 138,009,000 135,955,000 1.49% 26,923,000 $ 505.0%
7/1/2016 2,333,000 137,276,000 134,943,000 1.70% 26,499,000 509.2%
Board of Education - OPEB
7/1/2008 -$ 63,155,000 $ 63,155,000 $ 0.00% N/A N/A
7/1/2010 287,000 44,046,000 43,759,000 0.65% N/A N/A
7/1/2012 1,209,429 98,329,902 97,120,473 1.23% N/A N/A
7/1/2014 1,338,000 101,818,000 100,480,000 1.31% 49,062,000 $ 204.8%
7/1/2016 1,451,000 113,381,000 111,930,000 1.28% 46,083,000 242.9%
Schedule of Funding Progress - OPEB

72
Town of Stratford, Connecticut RSI-4
Required Supplementary Information - unaudited
Schedule of Contributions - OPEB Plan
Last 10 Fiscal Years
2017 2016 2015 2014 2013 2012 2011 2010 2009 2008
Actuarially determined contribution 21,050,753 $ 19,699,700 $ 20,482,200 $ 13,330,000 $ 11,643,400 $ 10,901,300 $ 14,651,000 $ 14,021,800 $ 10,247,500 $ 8,783,000 $
Contributions in relation to the actuarially
determined contribution 8,496,506 8,139,200 7,635,300 3,076,900 7,012,000 6,518,400 5,339,800 5,132,500 4,758,000 4,654,800
Contribution deficiency (excess) 12,554,247 $ 11,560,500 $ 12,846,900 $ 10,253,100 $ 4,631,400 $ 4,382,900 $ 9,311,200 $ 8,889,300 $ 5,489,500 $ 4,128,200 $
Covered-employee payroll 71,200,894 $ 75,985,000 $ 75,985,000 $ N/A N/A N/A N/A N/A N/A N/A
Contributions as a percentage of
covered-employee payroll 17.63% 15.21% 16.91% N/A N/A N/A N/A N/A N/A N/A
Schedule of Contributions - OPEB Plan

73
Town of Stratford, Connecticut RSI-5
Required Supplementary Information - unaudited
Schedule of Changes in the Town's OPEB Liability and Related Ratios (in 000's)
Last Four Fiscal Years*
OPEB Plan
Changes in Net OPEB Liability 2017
Total pension liability:
Service cost 10,903 $
Interest 8,890
Differences between expected and actual
experience -
Changes in assumptions (36,171)
Benefit payments, including refunds of member
contributions (8,447)
Net change in total OPEB liability (24,825)
Total pension liability, beginning 305,210
Total OPEB liability, ending (a) 280,385
Fiduciary net position:
Employer contributions 8,497
Member contributions -
Investment (loss) income net of investment
expenses 611
Benefit payments, including refunds of member
contributions (8,447)
Administrative expenses (3)
Other -
Net change in plan fiduciary
net position 658
Fiduciary net position, beginning 3,784
Fiduciary net position, ending (b) 4,442
Net OPEB liability, ending = (a) - (b) 275,943 $
Fiduciary net position as a % of total OPEB liability 1.58%
Covered payroll 71,201 $
Net OPEB liability as a % of covered payroll 387.55%
*Note: This schedule is intended to show ten years of information. Additional information will be added as it
becomes available.
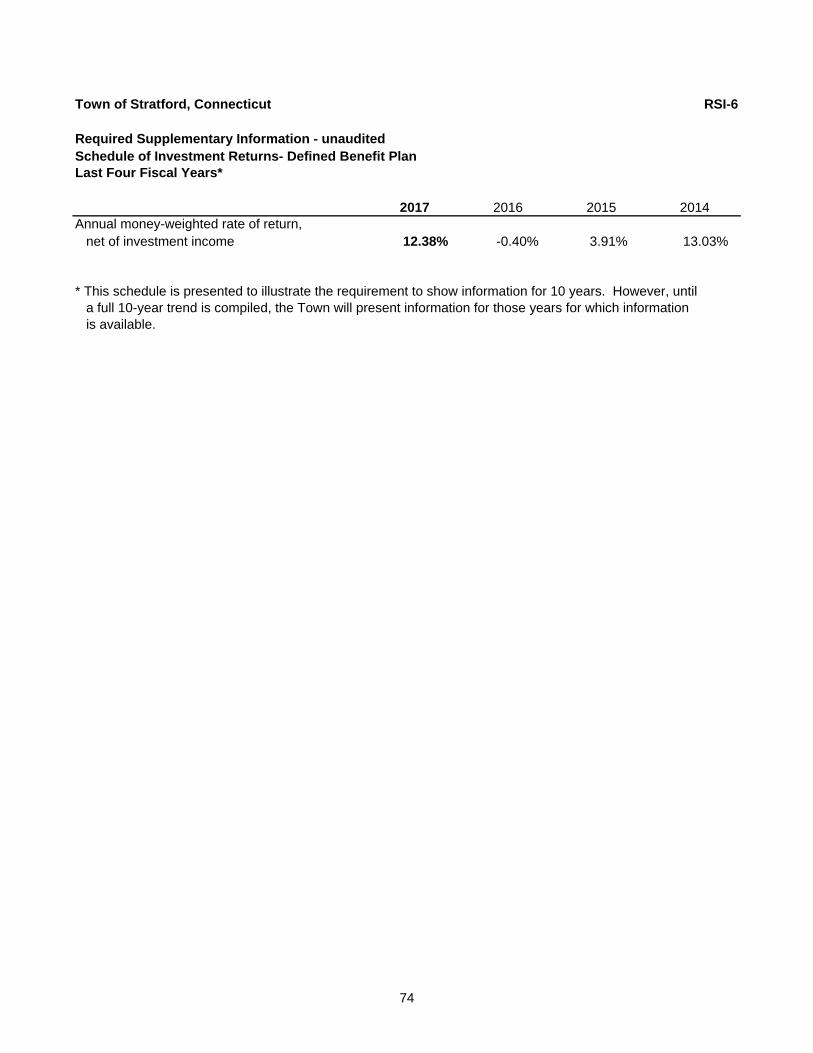
74
Town of Stratford, Connecticut RSI-6
Required Supplementary Information - unaudited
Schedule of Investment Returns- Defined Benefit Plan
Last Four Fiscal Years*
2017 2016 2015 2014
Annual money-weighted rate of return,
net of investment income 12.38% -0.40% 3.91% 13.03%
* This schedule is presented to illustrate the requirement to show information for 10 years. However, until
a full 10-year trend is compiled, the Town will present information for those years for which information
is available.

75
Town of Stratford, Connecticut RSI-7
Required Supplementary Information - unaudited
Schedule of Changes in the Town's Net Pension Liability and Related Ratios
Defined Benefit Plan (000s)
Last Four Fiscal Years*
2017 2016 2015 2014
Changes in net pension liability
Total pension liability:
Service cost 3,169 $ 3,338 $ 3,386 $ 3,739 $
Interest on total pension liability 20,268 20,162 19,991 19,881
Effect of economic changes/demographic
gains or (losses) 4,548 1,019 (1,301) (462)
Benefit payments (22,019) (21,504) (20,807) (20,286)
Net change in total pension liability 5,966 3,015 1,269 2,872
Total pension liability, beginning 307,932 304,917 303,648 300,776
Total pension liability ending (a) 313,898 307,932 304,917 303,648
Fiduciary net position:
Employer contributions 5,385 5,393 5,221 162,209
Member contributions 1,447 1,661 1,578 1,683
Investment income net of investment expenses 28,887 (1,004) 9,917 26,333
Benefit payments (22,019) (21,504) (20,807) (20,286)
Administrative expenses (296) (264) (399) (239)
Net change in plan fiduciary net position 13,404 (15,718) (4,490) 169,700
Fiduciary net position, beginning 239,597 255,315 259,805 90,105
Fiduciary net position, ending (b) 253,001 239,597 255,315 259,805
Net pension liability, ending = (a) - (b) 60,897 $ 68,335 $ 49,602 $ 43,843 $
Fiduciary net position as a % of total pension liability 80.60% 77.81% 83.73% 85.56%
Covered payroll 19,912 $ 20,317 $ 22,237 $ 22,771 $
Net pension liability as a % of covered payroll 305.83% 336.34% 223.06% 192.54%
* This schedule is presented to illustrate the requirement to show information for 10 years. However, until a
full 10-year trend is compiled, the Town will present information for those years for which information is
available.

76
Town of Stratford, Connecticut RSI-8
Required Supplementary Information - unaudited
Schedule of Town Contributions Defined Benefit Plan
Last 10 Fiscal Years
2017 2016 2015 2014 2013 2012 2011 2010 2009 2008
Actuarially determined contribution 5,470,701 $ 5,212,079 $ 5,185,559 $ 12,720,477 $ 10,264,676 $ 8,521,128 $ 8,526,398 $ 7,233,412 $ 5,622,712 $ 5,646,579 $
Contributions in relation to the
actuarially determined
contribution 5,385,385 5,393,200 5,220,969 162,209,000 9,778,500 8,493,774 8,526,398 7,233,452 5,240,187 5,669,932
Contribution deficiency
(excess) 85,316 $ (181,121) $ (35,410) $ (149,488,523) $ 486,176 $ 27,354 $ -$ (40) $ 382,525 $ (23,353) $
Covered employee payroll 19,912,480 $ 20,317,247 $ 22,237,216 $ 22,770,569 $ 23,551,913 $ 23,991,550 $ 24,238,011 $ 24,002,108 $ 24,494,790 $ 24,881,992 $
Contributions as a percentage of
covered employee payroll 27.05% 26.54% 23.48% 712.36% 41.52% 35.40% 35.18% 30.14% 21.39% 22.79%
Notes to schedule: The following is a summary of certain significant actuarial assumptions and other plan information:
Actuarial Cost Method Entry Age Normal
Amortization Method Level Percent of Payroll, Closed
Remaining Amortization Period 20 years
Asset Valuation Method 5 Year Smoothed Market Value
Investment Rate of Return 6.75% per annum
Retirement:
Police 25 years of continuous service
Fire 25 years of continuous service
Board of Education and Supervisors 23 years of continuous services and, if hired after 4/1/85, age 50, or 5 years of service and age 55.
Para-Professionals 23 years of continuous services and, if hired after 4/1/85, age 50, or 5 years of service and age 55.
Public Works 23 years of continuous service and, if hired after 7/1/85, age 50, or 5 years of service and age 55.
Town Hall and Nurses 23 years of continuous service and, if hired after 7/1/77, age 50, or 5 years of service and age 55.

77
Town of Stratford, Connecticut RSI-9
Required Supplementary Information - unaudited
Schedule of the Town's Proportionate Share of the Net Pension Liability - Teachers Retirement System
Last Three Fiscal Years*
Measurement period, 2017 2016 2015
Town's proportion of the net pension liability 0.00% 0.00% 0.00%
Town's proportionate share of the net pension liability -$ -$ -$
State's proportionate share of the net pension liability
associated with the Town 179,093,051 138,076,507 127,624,060 $
Town's covered-employee payroll 51,862,000 49,711,000 47,921,000 $
State's proportionate share of the net pension liability
as a percentage of its covered-employee payroll 0.00% 0.00% 0.00%
Plan fiduciary net position as a percentage of the total
pension liability 52.26% 59.50% 61.51%
* This schedule is presented to illustrate the requirement to show information for 10 years. However, until
a full 10-year trend is compiled, the Town will present information for those years for which information
is available.
Notes to Schedule
Changes in benefit terms None
Changes of assumptions During 2011, rates of withdrawal, retirement and assumed rates of salary increases were adjusted to reflect actual and anticipated experience. These assumptions were recommended as part of the Experience Study for the System for the five-year period ended June 30, 2010.
Actuarial cost method Entry age normal
Amortization method Level percent of salary, closed
Remaining amortization period 22.4 years
Asset valuation method 4-year smoothed market
Town of Stratford, Connecticut RSI-10 Required Supplementary Information – unaudited Note to Required Supplementary Information
78
Note 1. Budgetary Information
General fund: The Town’s general budget policies are as follows: Not later than March 12, the Mayor prepares and submits to the Town Council an annual budget for the next fiscal year based on detailed estimated revenues and expenditures for the Town. The Town’s charter requires the Town Council to hold public hearings prior to the adoption of the final budget, at which time taxpayers’ comments are obtained. Prior to May 13, the Town Council adopts the budget and sets the tax rate for the fiscal year through the passage of ordinances. All interdepartmental appropriations and budget transfers must be approved by the Town Council. The Mayor approves all intradepartmental transfers. Formal budgetary integration is employed as a management control device during the year for the General Fund. The legal level of control (the level at which expenditures may not legally exceed appropriations) is at the department level. Budgeted amounts reported are as originally adopted, or as amended by the Town Council during the course of the year. No supplemental appropriations were approved for year ended June 30, 2017. Expenditures which exceed appropriations: The legal level of control at which expenditures may not legally exceed appropriations is at the department level. During the year ending June 30, 2017, the administration, human development and public safety departments exceeded appropriations in the amount of $776,623, $24,580, and $1,546,005, respectively, which constitutes a violation of statutory provisions.

Combining and Individual Fund Financial Statements and Other Schedules


General Fund

General Fund The General Fund is used to account for resources traditionally associated with government that are not required legally or by sound financial management to be accounted for in another fund.

79
Town of Stratford, Connecticut EXHIBIT A-1
Report of Tax Collector
General Fund
For the Year Ended June 30, 2017
Uncollected Adjusted Uncollected Grand Taxes Current Lawful Transfers to Taxes Total Taxes
List Year July 1, 2016 Levy Corrections Suspense Collectible Taxes Paid Interest Lien Other Collected June 30, 2017
2015 -$ 173,608,966 $ (836,178) $ (17,345) $ 172,755,443 $ 168,761,349 $ 533,975 $ 1,872 $ 4,017 $ 169,301,213 $ 3,994,094 $ 2014 4,029,648 - (303,639) (21,903) 3,704,106 1,691,803 395,823 5,495 26,489 2,119,610 2,012,303 2013 1,961,238 - 59,273 (34,751) 1,985,760 775,464 297,921 2,620 29,608 1,105,613 1,210,296
2012 1,095,990 - 195,064 (655,057) 635,997 310,543 161,303 1,260 14,282 487,388 325,454 2011 298,826 - 238,450 (123,062) 414,214 153,705 113,107 672 111 267,595 260,509 2010 266,911 - 101,798 (116,600) 252,109 66,708 53,242 216 82 120,248 185,401 2009 159,206 - 109,412 (115,553) 153,065 4,696 5,233 48 52 10,029 148,369 2008 66,379 - 107,488 (76,774) 97,093 948 583 24 70 1,625 96,145 2007 17,873 - 134,138 (76,663) 75,348 - - - 17 17 75,348 2006 68,672 - 112,126 (119,091) 61,707 - - - 36 36 61,707 2005 8,572 - 143,897 (103,029) 49,440 1 - - 31 32 49,439 2004 20,595 - 116,190 (97,131) 39,654 - - - 41 41 39,654 2003 28,423 - 127,673 (109,525) 46,571 - - - 9 9 46,571 2002 4,359 - 150,961 (104,795) 50,525 1 - - 4 5 50,524 2001 113,113 - 95,332 (116,274) 92,171 2,889 7,347 24 161 10,421 89,282 2000 286,170 - - (286,170) - 101 282 - 17 400 (101)
8,425,975 $ 173,608,966 $ 551,985 $ (2,173,723) $ 180,413,203 $ 171,768,208 $ 1,568,816 $ 12,231 $ 75,027 $ 173,424,282 $ 8,644,995 $

80
This page intentionally left blank.

Nonmajor Governmental Funds

Nonmajor Governmental Funds
Special Revenue Funds
Special Revenue Funds are used to account for specific revenues that are legally restricted to expenditures for particular purposes.
Fund Funding Source Function
School Lunch Program Sale of food and grants School lunch program
Community Development Federal grant – DHUD and program income
Community development programs
Education Federal and State Programs
State and Federal grant Education programs
Shellfish and Oysters Grants and local contributions Activities of Shellfish Commission
Counseling Center Grants and program fees Youth and family counseling
Continuing Education State and Federal grants Continuing education
Redevelopment Agency Grants and local contributions Stratford Redevelopment Agency
Railroad Property Collection of fees Railroad station parking
Miscellaneous Grants Federal and state grants Health and social services program
Department of Children and Family Services
Grants and local contributions Department of Children and Families
Recreation Program fees Recreation programs
Town Aid Road State grants Improvements of local roads
Senior Citizens Grants and program fees Baldwin Senior Citizen Center
Police Special Services Grants and local contributions State Drug Enforcement Grant
Harbor Management Collection of fees Harbor management program
Recycling Collection of fees Recycling program
Gas Pipeline Donation from Duke Energy Various projects
Sewer Maintenance Collection of fees Miscellaneous maintenance of sewer functions
Reserve Donations Miscellaneous reserve funds
Debt Service Fund The Debt Service Fund is used to service principal and interest payments on Pension obligation bonds.
Permanent Funds Permanent Funds are used to report resources that are legally restricted to the extent that only earnings, not principal, may be used for purposes that support the reporting government’s programs.
Fund Funding Source Function
Stratford High School Donations Student activities
Bunnell High School Donations Student activities
Stephen Boothe Donations Boothe Memorial Park
David Boothe Donations Boothe Memorial Park

81
Town of Stratford, Connecticut EXHIBIT B-1
Combining Balance Sheet
Nonmajor Governmental Funds
June 30, 2017
Education
School Federal Shellfish
Lunch Community and State and Counseling Continuing Redevelopment
Program Development Programs Oysters Center Education Agency
Assets
Cash and cash equivalents 19,690 $ -$ 396,753 $ -$ -$ 281,678 $ -$
Accounts receivable 329,194 142,230 20,137 - - 15,825 -
Intergovernmental - - - - - - -
Due from other funds - - - 114,454 55,983 - 418,074
Inventory 32,811 - - - - - -
Total assets 381,695 $ 142,230 $ 416,890 $ 114,454 $ 55,983 $ 297,503 $ 418,074 $
Liabilities, Deferred Inflows of
Sources and Fund Balances
(Deficits)
Liabilities:
Accounts payable 736,431 $ 88,700 $ -$ -$ 692 $ 33,138 $ -$
Unearned Revenue - - 251,893 - - - -
Due to other funds - 8,377 - - - - -
Total liabilities 736,431 97,077 251,893 - 692 33,138 -
Deferred inflows of resources:
Unavailable resources - 142,230 20,137 - - - -
Fund balances (deficits):
Nonspendable 32,811 - - - - - -
Restricted - - 144,860 114,454 - 264,365
Committed - - - - 55,291 - 418,074
Unassigned (387,547) (97,077) - - - - -
Total fund balances
(deficits) (354,736) (97,077) 144,860 114,454 55,291 264,365 418,074
Total liabilities, deferred
inflows of resources and
fund balances (deficits) 381,695 $ 142,230 $ 416,890 $ 114,454 $ 55,983 $ 297,503 $ 418,074 $
Special Revenue
(Continued)

82
Town of Stratford, Connecticut EXHIBIT B-1
Combining Balance Sheet (Continued)
Nonmajor Governmental Funds
June 30, 2017
Department
of Children Town
Railroad Miscellaneous and Family Aid Senior
Property Grants Services Recreation Road Citizens
Assets
Cash and cash equivalents -$ -$ -$ -$ -$ -$
Accounts receivable - - - - - -
Intergovernmental - 1,142,799 - - - -
Due from other funds 783,673 - 80,745 100,365 337,025 56,745
Inventory - - - - - -
Total assets 783,673 $ 1,142,799 $ 80,745 $ 100,365 $ 337,025 $ 56,745 $
Liabilities, Deferred Inflows of
Sources and Fund Balances
(Deficits)
Liabilities:
Accounts payable 10,246 $ 74,293 $ 11,405 $ 42,240 $ -$ 4,266 $
Unearned Revenue - 145,955 - - - -
Due to other funds - 951,206 - - - -
Total liabilities 10,246 1,171,454 11,405 42,240 - 4,266
Deferred inflows of resources:
Unavailable resources - 973,297 - - - -
Fund balances (deficits):
Nonspendable - - - - - -
Restricted 773,427 - 69,340 58,125 337,025 -
Committed - - - - - 52,479
Unassigned - (1,001,952) - - - -
Total fund balances
(deficits) 773,427 (1,001,952) 69,340 58,125 337,025 52,479
Total liabilities, deferred
inflows of resources and
fund balances (deficits) 783,673 $ 1,142,799 $ 80,745 $ 100,365 $ 337,025 $ 56,745 $
Special Revenue
(Continued)

83
Town of Stratford, Connecticut EXHIBIT B-1
Combining Balance Sheet (Continued)
Nonmajor Governmental Funds
June 30, 2017
Police
Special Harbor Gas Sewer
Services Management Recycling Pipeline Maintenance Reserve Totals
Assets
Cash and cash equivalents 386,901 $ -$ -$ -$ -$ -$ 1,085,022 $
Accounts receivable - - - - - - 507,386
Intergovernmental - - - - - - 1,142,799
Due from other funds - 192,701 13,117 156,100 35,576 367,091 2,711,649
Inventory - - - - - - 32,811
Total assets 386,901 $ 192,701 $ 13,117 $ 156,100 $ 35,576 $ 367,091 $ 5,479,667 $
Liabilities, Deferred Inflows of
Sources and Fund Balances
(Deficits)
Liabilities:
Accounts payable -$ 4,299 $ -$ -$ -$ 45,292 $ 1,051,002 $
Unearned Revenue - - - - - 13,413 411,261
Due to other funds - - - - - - 959,583
Total liabilities - 4,299 - - - 58,705 2,421,846
Deferred inflows of resources:
Unavailable resources - - - - - - 1,135,664
Fund balances (deficits):
Nonspendable - - - - - - 32,811
Restricted - - - 156,100 - 308,386 2,226,082
Committed 386,901 188,402 13,117 - 35,576 - 1,149,840
Unassigned - - - - - - (1,486,576)
Total fund balances
(deficits) 386,901 188,402 13,117 156,100 35,576 308,386 1,922,157
Total liabilities, deferred
inflows of resources and
fund balances (deficits) 386,901 $ 192,701 $ 13,117 $ 156,100 $ 35,576 $ 367,091 $ 5,479,667 $
Special Revenue Funds
(Continued)

84
Town of Stratford, Connecticut EXHIBIT B-1
Combining Balance Sheet (Continued)
Nonmajor Governmental Funds
June 30, 2017
Debt Service
Total
Stratford Nonmajor
High Bunnell Stephen David Debt Service Governmental
School High School Boothe Boothe Total Fund Funds
Assets
Cash and cash equivalents 11,940 $ 26,348 $ 227,795 $ 524,665 $ 790,748 $ -$ 1,875,770 $
Investments 212,708 88,654 503,290 1,074,529 1,879,181 - 1,879,181
Accounts receivable - - - - - - 507,386
Intergovernmental - - - - - - 1,142,799
Due from other funds - - - - - 443,280 3,154,929
Inventory - - - - - - 32,811
Total assets 224,648 $ 115,002 $ 731,085 $ 1,599,194 $ 2,669,929 $ 443,280 $ 8,592,876 $
Liabilities, Deferred Inflows of
Sources and Fund Balances
(Deficits)
Liabilities:
Accounts payable -$ -$ -$ -$ -$ -$ 1,051,002 $
Unearned Revenue - - - - - - 411,261
Due to other funds - - - - - - 959,583
Total liabilities - - - - - - 2,421,846
Deferred inflows of resources:
Unavailable resources - - - - - - 1,135,664
Fund balances (deficits):
Nonspendable - - - - - - 32,811
Restricted 224,648 115,002 731,085 1,599,194 2,669,929 - 4,896,011
Committed - - - - - 443,280 1,593,120
Unassigned - - - - - - (1,486,576)
Total fund balances
(deficits) 224,648 115,002 731,085 1,599,194 2,669,929 443,280 5,035,366
Total liabilities, deferred
inflows of resources and
fund balances (deficits) 224,648 $ 115,002 $ 731,085 $ 1,599,194 $ 2,669,929 $ 443,280 $ 8,592,876 $
Permanent Funds

85
Town of Stratford, Connecticut EXHIBIT B-2
Combining Statement of Revenues, Expenditures and Changes in Fund Balances (Deficits)
Nonmajor Governmental Funds
For the Year Ended June 30, 2017
Education
School Federal Shellfish
Lunch Community and State and Counseling Continuing Redevelopment
Program Development Programs Oysters Center Education Agency
Revenues:
Intergovernmental 1,875,655 $ 803,281 $ 3,436,355 $ -$ -$ -$ -$
Departmental revenue 1,640,192 - - 24,343 7,142 401,725 -
Licenses and permits - - - - - - -
Investment income - - - - - - -
Other - 1,085 288,062 - 53,332 - -
Total revenue 3,515,847 804,366 3,724,417 24,343 60,474 401,725 -
Expenditures:
Current:
Education 3,454,987 - 3,765,411 - - 481,103 -
Human development - - - - 56,620 - -
Physical development - 850,086 - - - - -
Public safety - - - - - - -
Capital outlay - - - - - - -
Total expenditures 3,454,987 850,086 3,765,411 - 56,620 481,103 -
Excess (deficiency) of
revenues over
expenditures 60,860 (45,720) (40,994) 24,343 3,854 (79,378) -
Other financing sources (uses):
Transfers in - - - - - - -
Transfers out - - - - - - -
Total other financing
sources (uses) - - - - - - -
Net change in fund balances (deficits) 60,860 (45,720) (40,994) 24,343 3,854 (79,378) -
Fund balances (deficits), beginning of year (415,596) (51,357) 185,854 90,111 51,437 343,743 418,074
Fund balances (deficits), end of year (354,736) $ (97,077) $ 144,860 $ 114,454 $ 55,291 $ 264,365 $ 418,074 $
Special Revenue
(Continued)

86
Town of Stratford, Connecticut EXHIBIT B-2
Combining Statement of Revenues, Expenditures and Changes in Fund Balances (Deficits) (Continued)
Nonmajor Governmental Funds
For the Year Ended June 30, 2017
Department
of Children Town
Railroad Miscellaneous and Family Aid Senior
Property Grants Services Recreation Road Citizens
Revenues:
Intergovernmental -$ 1,433,668 $ 212,356 $ -$ 602,309 $ -$
Departmental revenue - - - 277,861 - 69,956
Licenses and permits 474,527 - - - - -
Investment income - - - - - -
Other - - - - - -
Total revenue 474,527 1,433,668 212,356 277,861 602,309 69,956
Expenditures:
Current:
Education - - - - - -
Human development 266,410 1,668,861 - - - 63,395
Physical development - - 377,010 279,565 - -
Public safety - - - - - -
Capital outlay - - - - 545,960 -
Total expenditures 266,410 1,668,861 377,010 279,565 545,960 63,395
Excess (deficiency) of
revenues over
expenditures 208,117 (235,193) (164,654) (1,704) 56,349 6,561
Other financing sources (uses):
Transfers in - - 181,000 - - -
Transfers out (250,000) - - - - -
Total other financing
sources (uses) (250,000) - 181,000 - - -
Net change in fund balances (deficits) (41,883) (235,193) 16,346 (1,704) 56,349 6,561
Fund balances (deficits), beginning of year 815,310 (766,759) 52,994 59,829 280,676 45,918
Fund balances (deficits), end of year 773,427 $ (1,001,952) $ 69,340 $ 58,125 $ 337,025 $ 52,479 $
Special Revenue
(Continued)

87
Town of Stratford, Connecticut EXHIBIT B-2
Combining Statement of Revenues, Expenditures and Changes in Fund Balances (Deficits) (Continued)
Nonmajor Governmental Funds
For the Year Ended June 30, 2017
Police
Special Harbor Gas Sewer
Services Management Recycling Pipeline Maintenance Reserve Totals
Revenues:
Intergovernmental -$ 35,987 $ -$ -$ -$ -$ 8,399,611 $
Departmental revenue - 43,642 - - - 101,572 2,566,433
Licenses and permits - - - - - - 474,527
Investment income 899 - - - - - 899
Other 175,437 - - - 24,047 - 541,963
Total revenue 176,336 79,629 - - 24,047 101,572 11,983,433
Expenditures:
Current:
Education - - - - - - 7,701,501
Human development - - - - - 96,580 2,151,866
Physical development - 52,377 - - - - 1,559,038
Public safety 202,406 - - - - - 202,406
Capital outlay - - - - - - 545,960
Total expenditures 202,406 52,377 - - - 96,580 12,160,771
Excess (deficiency) of
revenues over
expenditures (26,070) 27,252 - - 24,047 4,992 (177,338)
Other financing sources (uses):
Transfers in - - - - - - 181,000
Transfers out - - - - - - (250,000)
Total other financing
sources (uses) - - - - - - (69,000)
Net change in fund balances (deficits) (26,070) 27,252 - - 24,047 4,992 (246,338)
Fund balances (deficits), beginning of year 412,971 161,150 13,117 156,100 11,529 303,394 2,168,495
Fund balances (deficits), end of year 386,901 $ 188,402 $ 13,117 $ 156,100 $ 35,576 $ 308,386 $ 1,922,157 $
Special Revenue Funds
(Continued)

88
Town of Stratford, Connecticut EXHIBIT B-2
Combining Statement of Revenues, Expenditures and Changes in Fund Balances (Deficits) (Continued)
Nonmajor Governmental Funds
For the Year Ended June 30, 2017
Debt Service
Total
Stratford Nonmajor
High Bunnell Stephen David Debt Service Governmental
School High School Boothe Boothe Total Fund Funds
Revenues:
Intergovernmental -$ -$ -$ -$ -$ -$ 8,399,611 $
Departmental revenue - - - - - - 2,566,433
Licenses and permits - - - - - - 474,527
Investment income 96,742 8,675 79,202 180,616 365,235 - 366,134
Other - 97,596 - - 97,596 - 639,559
Total revenue 96,742 106,271 79,202 180,616 462,831 - 12,446,264
Expenditures:
Current:
Education 94,439 91,490 24,312 58,868 269,109 - 7,970,610
Human development - - - - - - 2,151,866
Physical development - - - - - - 1,559,038
Public safety - - - - - - 202,406
Capital outlay - - - - - - 545,960
Total expenditures 94,439 91,490 24,312 58,868 269,109 - 12,429,880
Excess (deficiency) of
revenues over
expenditures 2,303 14,781 54,890 121,748 193,722 - 16,384
Other financing sources (uses):
Transfers in - - - - - - 181,000
Transfers out - - - - - (443,280) (693,280)
Total other financing
sources (uses) - - - - - (443,280) (512,280)
Net change in fund balances (deficits) 2,303 14,781 54,890 121,748 193,722 (443,280) (495,896)
Fund balances (deficits), beginning of year 222,345 100,221 676,195 1,477,446 2,476,207 886,560 5,531,262
Fund balances (deficits), end of year 224,648 $ 115,002 $ 731,085 $ 1,599,194 $ 2,669,929 $ 443,280 $ 5,035,366 $
Permanent Funds

Capital Projects Fund
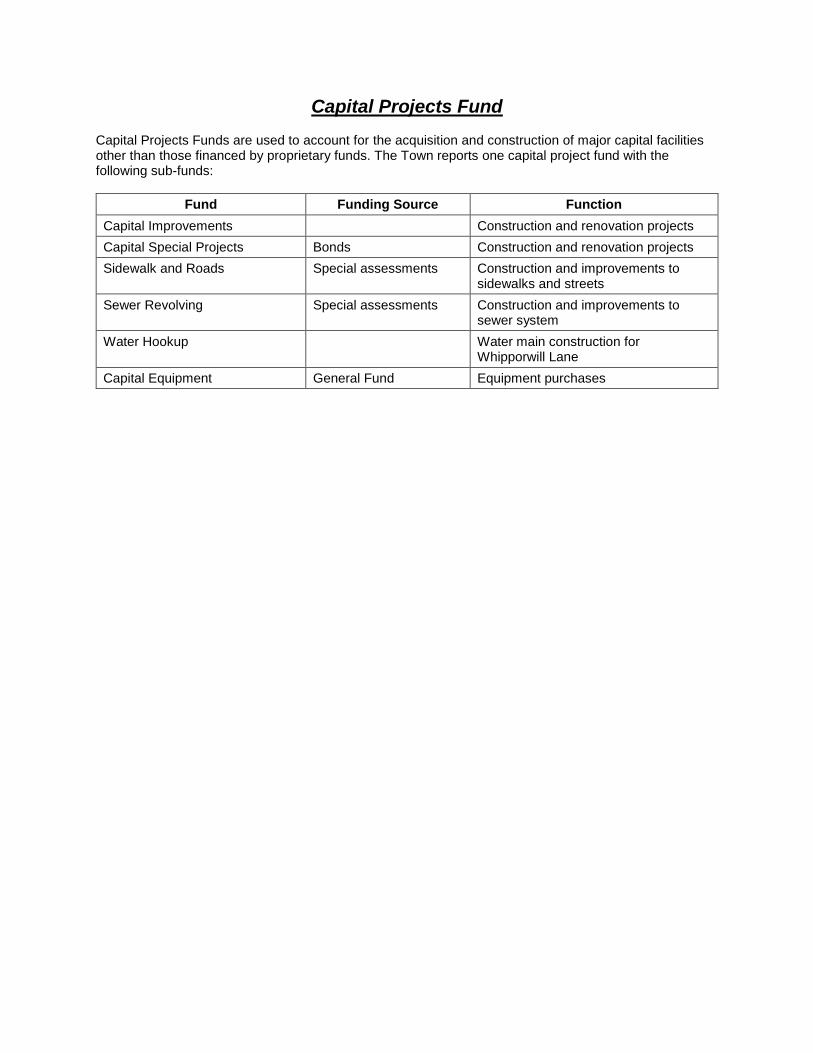
Capital Projects Fund Capital Projects Funds are used to account for the acquisition and construction of major capital facilities other than those financed by proprietary funds. The Town reports one capital project fund with the following sub-funds:
Fund Funding Source Function
Capital Improvements Construction and renovation projects
Capital Special Projects Bonds Construction and renovation projects
Sidewalk and Roads Special assessments Construction and improvements to sidewalks and streets
Sewer Revolving Special assessments Construction and improvements to sewer system
Water Hookup Water main construction for Whipporwill Lane
Capital Equipment General Fund Equipment purchases

89
Town of Stratford, Connecticut EXHIBIT C-1
Project Combining Balance Sheet
Capital Projects Fund
June 30, 2017
Capital
Capital Special Sidewalk Sewer Water Capital
Improvements Projects and Roads Revolving Hookup Equipment Totals
Assets
Cash and Cash Equivalents -$ -$ -$ -$ -$ -$ -$
Special assessments receivable - - 1,542 969,295 8,761 - 979,598
Due from other funds 34,970,679 12,605,621 - 1,220,609 - - 48,796,909
Total assets 34,970,679 $ 12,605,621 $ 1,542 $ 2,189,904 $ 8,761 $ -$ 49,776,507 $
Liabilities and Fund Balances
Liabilities:
Accounts payable -$ 2,799,249 $ -$ -$ -$ 51,687 $ 2,850,936 $
Bond anticipation notes - 25,000,000 - - - - 25,000,000
Due to other funds - - 16,416 - 107,376 2,533,761 2,657,553
Total liabilities - 27,799,249 16,416 - 107,376 2,585,448 30,508,489
Deferred inflows of resources:
Unavailable resources - - 1,542 969,295 8,761 - 979,598
Fund balances:
Restricted 34,970,679 (15,193,628) (16,416) 1,220,609 (107,376) (2,585,448) 18,288,420
Total liabilities and
fund balances 34,970,679 $ 12,605,621 $ 1,542 $ 2,189,904 $ 8,761 $ -$ 49,776,507 $

90
Town of Stratford, Connecticut EXHIBIT C-2
Project Combining Statement of Revenues, Expenditures and Changes in Fund Balances
Capital Projects Fund
For the Year Ended June 30, 2017
Capital
Capital Special Sidewalk Sewer Water Capital
Improvements Projects and Roads Revolving Hookup Equipment Totals
Revenues:
Property taxes and assessments -$ -$ 1,995 $ 157,681 $ 1,847 $ -$ 161,523 $
Intergovernmental - 3,841,380 - - - - 3,841,380
Total revenues - 3,841,380 1,995 157,681 1,847 - 4,002,903
Expenditures:
Debt Service 278,116 - - - - - 278,116
Capital outlay - 13,436,355 - - - 2,225,891 15,662,246
Total expenditures 278,116 13,436,355 - - - 2,225,891 15,940,362
Excess (deficiency)
of revenues over
expenditures (278,116) (9,594,975) 1,995 157,681 1,847 (2,225,891) (11,937,459)
Other financing sources:
Bond proceeds - 22,656,172 - - - 2,603,828 25,260,000
Bond premium 306,569 - - - - - 306,569
Operating transfers in - 1,040,939 - - - 200,000 1,240,939
Total other financing
sources (uses) 306,569 23,697,111 - - - 2,803,828 26,807,508
Net change in fund
balances (deficits) 28,453 14,102,136 1,995 157,681 1,847 577,937 14,870,049
Fund balances (deficits), beginning of year 34,942,226 (29,295,764) (18,411) 1,062,928 (109,223) (3,163,385) 3,418,371
Fund balances (deficits), end of year 34,970,679 $ (15,193,628) $ (16,416) $ 1,220,609 $ (107,376) $ (2,585,448) $ 18,288,420 $

Enterprise Funds

Enterprise Funds Enterprise funds are used to account for ongoing organizations and activities that are similar to those found in the private sector. Short Beach Golf Course is used to account for the operations of the Town’s public golf course. Emergency Medical Services is used to account for the operations of ambulance services.

91
Town of Stratford, Connecticut EXHIBIT D-1
Combining Statement of Net Position
Non-Major Enterprise Funds
June 30, 2017
Short Emergency
Beach Medical
Golf Course Services Total
Assets
Current assets:
Cash and cash equivalents -$ 112,077 $ 112,077 $
Receivables:
Accounts and other - 327,107 327,107
Total current assets - 439,184 439,184
Capital assets:
Assets being depreciated, net 176,719 2,381,776 2,558,495
Total capital assets 176,719 2,381,776 2,558,495
Total assets 176,719 $ 2,820,960 $ 2,997,679 $
Liabilities
Current liabilities:
Accounts payable 17,518 $ 131,711 $ 149,229 $
Unearned revenue 767 - 767
Due to other funds - 750,569 750,569
Total current liabilities 18,285 882,280 900,565
Noncurrent liabilities:
Advance from other funds 1,114,103 - 1,114,103
Bonds payable - 1,247,000 1,247,000
Capital lease 31,677 131,662 163,339
Compensated absences 52,384 190,688 243,072
Total noncurrent liabilities 1,198,164 1,569,350 2,767,514
Total liabilities 1,216,449 2,451,630 3,668,079
Net position:
Net Investment in capital assets 145,042 1,003,114 1,148,156
Unrestricted (1,184,772) (633,784) (1,818,556)
Total net position (1,039,730) $ 369,330 $ (670,400) $

92
Town of Stratford, Connecticut EXHIBIT D-2
Combining Statement of Revenues, Expenses and Changes in Fund Net Position
Non-major Enterprise Funds
For the Year Ended June 30, 2017
Short Emergency
Beach Medical
Golf Course Services Total
Operating revenues:
Charges for services 225,614 $ 2,026,664 $ 2,252,278 $
Total operating revenues 225,614 2,026,664 2,252,278
Operating expenses:
Operating and maintenance 414,798 1,971,901 2,386,699
Depreciation 25,280 276,583 301,863
Total operating expenses 440,078 2,248,484 2,688,562
Operating loss (214,464) (221,820) (436,284)
Nonoperating revenues (expenses):
Interest expense - (49,623) (49,623)
Total nonoperating revenues
(expenses) - (49,623) (49,623)
Net loss before transfers (214,464) (271,443) (485,907)
Transfers out - (400,000) (400,000)
Net transfers - (400,000) (400,000)
Change in net position (deficit) (214,464) (671,443) (885,907)
Fund net position (deficit), beginning (825,266) 1,040,773 215,507
Fund net position (deficit), ending (1,039,730) $ 369,330 $ (670,400) $

93
Town of Stratford, Connecticut EXHIBIT D-3
Combining Statement of Cash Flows
Non-Major Enterprise Funds
For the Year Ended June 30, 2017
Short Emergency
Beach Medical
Golf Course Services Total
Cash flows from operating activities:
Cash received from customers and users 225,701 $ 2,067,553 $ 2,293,254 $
Cash payments to suppliers (224,258) (1,930,048) (2,154,306)
Cash payments to employees (193,250) - (193,250)
Payments for interfund services used 197,644 (3,910,574) (3,712,930)
Net cash provided by (used in) operating activities 5,837 (3,773,069) (3,767,232)
Cash flows from noncapital financing activities:
Advance from other funds - - -
Transfers to/from other funds - (400,000) (400,000)
Net cash used in noncapital financing activities - (400,000) (400,000)
Cash flows from capital and related financing activities:
Proceeds from bonds - - -
Principal refunded - - -
Principal payments on debt - (104,135) (104,135)
Principal payments on capital lease (5,837) (17,067) (22,904)
Interest paid on debt - (49,623) (49,623)
Disposal of capital assets - - -
Purchase of capital assets - (154,819) (154,819)
Net cash used in capital and related
financing activities (5,837) (325,644) (331,481)
Cash flows from investing activities:
Interest revenues - - -
Net cash provided by investing activities - - -
Net decrease in cash and cash equivalents - (4,498,713) (4,498,713)
Cash and cash equivalents, beginning - 4,610,790 4,610,790
Cash and cash equivalents, ending -$ 112,077 $ 112,077 $
Reconciliation of operating loss to net cash
provided by operating activities:
Operating income (loss) (214,464) $ (221,820) $ (436,284) $
Adjustments to reconcile operating loss to
net cash provided by (used in) operating activities:
Depreciation 25,280 276,583 301,863
Loss (gains) on disposal of fixed assets - 25,250 25,250
Changes in assets and liabilities:
(Increase) decrease in accounts receivable
and deferred charges - 40,889 40,889
(Increase) decrease in due from other funds - - -
Increase (decrease) in accounts payable and
accrued expenses (2,710) 16,603 13,893
Increase in unearned revenues 87 - 87
Increase (decrease) in due to other funds 197,644 (3,910,574) (3,712,930)
Net cash provided by (used in) operating activities 5,837 $ (3,773,069) $ (3,767,232) $
Supplemental schedule of noncash financing activities:
Amortization of gain on refunded debt -$ 29,425 $ 29,425 $
Amortization of premium on refunded debt -$ 30,560 $ 30,560 $

94
This page intentionally left blank.

Internal Service Funds

Internal Service Funds Internal Service Funds are used to account for the financing of goods or services provided by one department or agency to other departments or agencies of the government and to other governmental units, on a cost-reimbursement basis. Health Benefit and Workers’ Compensation Fund – to provide reserves necessary to support an insurance program for health benefits and workers’ compensation claims.

95
Town of Stratford, Connecticut EXHIBIT E-1
Combining Statement of Net Position (Deficit)
Internal Service Funds
June 30, 2017
Health Workers'
Benefit Compensation Total
Assets
Cash and cash equivalents -$ 80,000 $ 80,000 $
Due from other funds 2,057,679 5,466,863 7,524,542
Total assets 2,057,679 $ 5,546,863 $ 7,604,542 $
Liabilities and Net Position (Deficit)
Current liabilities:
Accounts payable -$ 5,589 $ 5,589 $
Risk management claims 737,000 - 737,000
Total liabilities 737,000 5,589 742,589
Noncurrent liabilities:
Risk management claims - 12,992,157 12,992,157
Net position:
Unrestricted (deficit) 1,320,679 (7,450,883) (6,130,204)
Total net position (deficit) 1,320,679 $ (7,450,883) $ (6,130,204) $

96
Town of Stratford, Connecticut EXHIBIT E-2
Combining Statement of Revenues, Expenses and Changes in Fund Net Position (Deficit)
Internal Service Funds
For the Year Ended June 30, 2017
Health Workers'
Benefit Compensation Total
Operating revenues:
Charges for services 3,635,132 $ 2,635,481 $ 6,270,613 $
Operating expenses:
Operating and maintenance 4,326,732 3,894,443 8,221,175
Operating loss (691,600) (1,258,962) (1,950,562)
Change in net position (deficit) (691,600) (1,258,962) (1,950,562)
Fund net position (deficit), beginning 2,012,279 (6,191,921) (4,179,642)
Fund net position (deficit), ending 1,320,679 $ (7,450,883) $ (6,130,204) $

97
Town of Stratford, Connecticut EXHIBIT E-3
Combining Statement of Cash Flows
Internal Service Funds
For the Year Ended June 30, 2017
Health Workers'
Benefit Compensation Total
Cash flows from operating activities:
Cash received from customers and users 4,003,632 $ 2,635,482 $ 6,639,114 $
Cash payments to suppliers (4,328,438) (3,007,579) (7,336,017)
Payments for interfund services used 324,806 372,097 696,903
Net cash used in operating activities - - -
Net increase in cash and cash equivalents - - -
Cash and cash equivalents, beginning - 80,000 80,000
Cash and cash equivalents, ending -$ 80,000 $ 80,000 $
Reconciliation of operating loss to net cash
used in operating activities:
Operating loss (691,600) $ (1,258,962) $ (1,950,562) $
Adjustments to reconcile operating loss to
net cash used in operating activities:
Changes in assets and liabilities:
Decrease (increase) in due from other funds 315,806 372,097 687,903
Decrease (increase) in receivables 368,500 - 368,500
Increase (decrease) in accounts payable (1,706) (7,968) (9,674)
Increase (decrease) in due to other funds - - -
Increase (decrease) in risk management claim liability 9,000 894,833 903,833
Net cash used in operating activities -$ -$ -$

98
This page intentionally left blank.

Fiduciary Funds

Fiduciary Funds
Agency Funds Student Activity Fund – established to account for various student activities. Senior Taxpayer Escrow – established to account for senior citizen tax payments. Planning & Zoning Performance Bonds – established to account for planning & zoning performance bonds. Inland/Wetland Performance Bonds – established to account for inland/wetland performance bonds. Teacher’s Retiree Fund – established to offset medical expenses of the Stratford Board of Education’s retiree population

99
Town of Stratford, Connecticut EXHIBIT F
Combining Statement of Changes in Assets and LiabilitiesAgency FundsFor the Year Ended June 30, 2017
Balance BalanceJuly 1, 2016 Additions Deletions June 30, 2017
Student Activity FundAssets
Cash and cash equivalents 342,276 $ 1,122,061 $ 1,093,279 $ 371,058 $
LiabilitiesDue to student groups 342,276 $ 1,122,061 $ 1,093,279 $ 371,058 $
Senior Taxpayer EscrowAssets
Cash and cash equivalents 20,528 $ 44,749 $ 43,250 $ 22,027 $
LiabilitiesPayable to others 20,528 $ 44,749 $ 43,250 $ 22,027 $
Planning & Zoning Performance BondsAssets
Cash and cash equivalents 393,518 $ 695 $ 4,000 $ 390,213 $
LiabilitiesPayable to others 393,518 $ 695 $ 4,000 $ 390,213 $
Inland/Wetland Performance BondsAssets
Cash and cash equivalents 203,803 $ 27,262 $ -$ 231,065 $
LiabilitiesPayable to others 203,803 $ 27,262 $ -$ 231,065 $
Teacher's Retiree FundAssets
Cash and cash equivalents 218,537 $ 1,732,565 $ 1,714,899 $ 236,203 $
LiabilitiesPayable to others 218,537 $ 1,732,565 $ 1,714,899 $ 236,203 $
Total Agency FundsAssets
Cash and cash equivalents 1,178,662 $ 2,927,332 $ 2,855,428 $ 1,250,566 $
LiabilitiesDue to student groups 342,276 $ 1,122,061 $ 1,093,279 $ 371,058 $ Payable to others 836,386 1,805,271 1,762,149 879,508
1,178,662 $ 2,927,332 $ 2,855,428 $ 1,250,566 $

100
This page intentionally left blank.

Statistical Section

Statistical Section Information The objectives of statistical section information are to provide financial statement users with additional historical perspective, context and detail to assist in using the information in the financial statements, notes to financial statements and required supplementary information to understand and assess economic condition.
Statistical section information is presented in the following categories:
Financial trends information is intended to assist users in understanding and assessing how
financial position has changed over time.
Revenue capacity information is intended to assist users in understanding and assessing the factors affecting the ability to generate own-source revenues (property taxes, charges for services, etc.).
Debt capacity information is intended to assist users in understanding and assessing debt burden and the ability to issue additional debt.
Demographic and economic information is intended 1) to assist users in understanding the socioeconomic environment and 2) to provide information that facilitates comparisons of financial statement information over time and among governments.
Operating information is intended to provide contextual information about operations and resources to assist readers in using financial statement information to understand and assess economic condition.
The accompanying tables are presented in the above order. Refer to the Table of Contents for applicable page number locations.
Sources: Unless otherwise noted, the information in the tables is derived from the comprehensive annual financial reports for the relevant year.

101
Town of Stratford, Connecticut TABLE 1
Net Position By Component
Last Ten Fiscal Years
(accrual basis of accounting)
(Unaudited)
2017 2016 2015 2014 2013 2012 2011 2010 2009 2008
Governmental activities:
Net investment in capital assets 85,697 $ 81,259 $ 78,329 $ 82,429 $ 58,172 $ 57,747 $ 49,667 $ 46,587 $ 45,101 $ 51,011 $
Restricted 2,670 2,476 2,709 2,793 2,527 2,407 2,543 2,279 2,187 2,611
Unrestricted (314,761) (293,903) (271,442) (69,279) (37,138) (47,371) (46,500) (36,777) (20,284) (35,633)
Total governmental activities
net position (deficit) (226,394) $ (210,168) $ (190,404) $ 15,943 $ 23,561 $ 12,783 $ 5,710 $ 12,089 $ 27,004 $ 17,989 $
Business-type activities:
Net investment in capital assets 14,787 $ 15,720 $ 14,577 $ 18,134 $ 19,149 $ 19,806 $ 20,691 $ 21,674 $ 26,998 $ 29,187 $
Unrestricted 5,388 5,746 7,676 6,094 6,710 6,615 8,475 12,145 9,200 6,419
Total business-type activities
net position 20,175 $ 21,466 $ 22,253 $ 24,228 $ 25,859 $ 26,421 $ 29,166 $ 33,819 $ 36,198 $ 35,606 $
Total primary government:
Net investment in capital assets 100,484 $ 96,979 $ 92,906 $ 100,563 $ 77,321 $ 77,553 $ 70,358 $ 68,261 $ 72,099 $ 80,198 $
Restricted 2,670 2,476 2,709 2,793 2,527 2,407 2,543 2,279 2,187 2,611
Unrestricted (309,373) (288,156) (263,765) (63,185) (30,428) (40,756) (38,025) (24,632) (11,084) (29,214)
Total net position (deficit) (206,219) $ (188,701) $ (168,150) $ 40,171 $ 49,420 $ 39,204 $ 34,876 $ 45,908 $ 63,202 $ 53,595 $
Fiscal Year ($ in 000's)

102
Town of Stratford, Connecticut
Changes In Net Position
Last Ten Fiscal Years
(In Thousands)
(Unaudited)
2017 2016 2015 2014 2013
Expenses:
Governmental activities:
General government (32,000) $ (31,845) $ (33,728) $ (30,840) $ (38,354) $
Human development (8,794) (10,145) (8,277) (8,518) (8,852)
Physical development (23,659) (22,908) (20,537) (15,320) (18,900)
Public safety (34,067) (35,826) (28,289) (35,654) (24,111)
Education (148,968) (136,979) (129,334) (127,895) (115,002)
Debt service (13,696) (12,058) (12,530) (9,636) (4,548)
Total governmental
activities expenses (261,184) (249,761) (232,695) (227,863) (209,767)
Business-type activities:
Waste operating (11,232) (11,394) (11,768) (10,560) (10,106)
Other (2,738) (2,874) (2,451) (2,324) (2,225)
Total business-type
activities expenses (13,970) (14,269) (14,219) (12,884) (12,331)
Total primary
government expenses (275,154) (264,030) (246,914) (240,747) (222,098)
Program revenues:
Governmental activities:
Charges for services:
General Government 2,774 2,267 2,264 2,238 1,997
Human development 1,354 3,440 3,709 3,907 3,811
Physical development 1,377 2,052 1,940 1,810 749
Public safety 2,002 1,023 1,468 1,412 1,512
Education 2,263 1,975 1,932 2,668 2,232
Operating grants and contributions: 51,984 45,266 43,875 42,140 41,710
Capital grants and contributions: 7,303 4,965 12,886 4,813 3,206
Total governmental
activities program revenue 69,057 60,988 68,074 58,988 55,217
Business-type activities:
Charges for services: 13,378 14,181 12,944 11,932 11,998
Capital grants and contributions - - - - 348
Total business-type activities
program revenues 13,378 14,181 12,944 11,932 12,346
Total primary government
program revenues 82,435 75,169 81,018 70,920 67,563
Fiscal Year

103
2017 2016 2015 2014 2013
Net (Expense) Revenue
Governmental activities (192,127) $ (188,773) $ (164,621) $ (168,875) $ (154,550) $
Business-type activities (592) (87) (1,275) (951) 15
Total primary government
net expense (192,719) (188,860) (165,896) (169,826) (154,535)
General Revenues and Other
Changes in Net Position
Governmental activities:
Property taxes 173,323 166,649 163,847 158,477 156,673
Grants and contributions not
restricted to specific programs 1,389 1,593 1,550 1,750 6,152
Unrestricted investment earnings 489 67 159 349 209
Miscellaneous - - - - 1,695
Transfers 700 700 700 681 600
Total governmental activities 175,901 169,009 166,256 161,257 165,329
Business-type activities:
Property transfer - - - - -
Unrestricted investment earnings - - - - 23
Grants and contributions not
restricted - - - - -
Transfers (700) (700) (700) (681) (600)
Total business-type activities (700) (700) (700) (681) (577)
Total primary government 175,201 168,309 165,556 160,576 164,752
Changes in Net Position
Governmental activities (16,226) (19,764) 1,634 (7,618) 10,779
Business-type activities (1,292) (787) (1,975) (1,632) (562)
Total primary government (17,518) $ (20,551) $ (341) $ (9,250) $ 10,217 $
Fiscal Year
(Continued)

104
Town of Stratford, Connecticut
Changes In Net Position (Continued)
Last Ten Fiscal Years
(In Thousands)
(Unaudited)
2012 2011 2010 2009 2008
Expenses
Governmental activities:
General government (38,445) $ (38,499) $ (35,722) $ (27,808) $ (32,424) $
Human development (9,029) (8,033) (7,227) (7,347) (6,426)
Physical development (15,466) (15,099) (15,466) (16,734) (15,742)
Public safety (23,712) (29,459) (23,314) (23,053) (22,943)
Education (114,759) (115,686) (113,161) (111,307) (123,854)
Debt service (3,484) (6,033) (7,470) (7,242) (7,588)
Total governmental
activities expenses (204,895) (212,809) (202,360) (193,491) (208,977)
Business-type activities:
Waste operating (9,654) (11,685) (9,864) (8,490) (5,624)
Other (1,745) (1,739) (1,559) (1,590) (1,449)
Total business-type
activities expenses (11,399) (13,424) (11,423) (10,080) (7,073)
Total primary
government expenses (216,294) (226,233) (213,783) (203,571) (216,050)
Program Revenues
Governmental activities:
Charges for services:
General Government 2,201 1,652 1,239 1,010 1,646
Human development 3,844 4,132 4,087 2,783 4,376
Physical development 619 876 936 1,148 448
Public safety 1,462 1,422 1,262 1,117 2,072
Education 2,294 2,135 2,251 1,929 2,208
Operating grants and contributions: 43,581 40,374 38,694 39,737 61,968
Capital grants and contributions: - 146 226 100 109
Total governmental
activities program revenue 54,001 50,737 48,695 47,824 72,827
Business-type activities:
Charges for services: 9,215 8,890 8,277 8,268 8,182
Capital grants and contributions 13 518 1,285 2,741 7,031
Total business-type activities
program revenues 9,228 9,408 9,562 11,009 15,213
Total primary government
program revenues 63,229 60,145 58,257 58,833 88,040
Fiscal Year
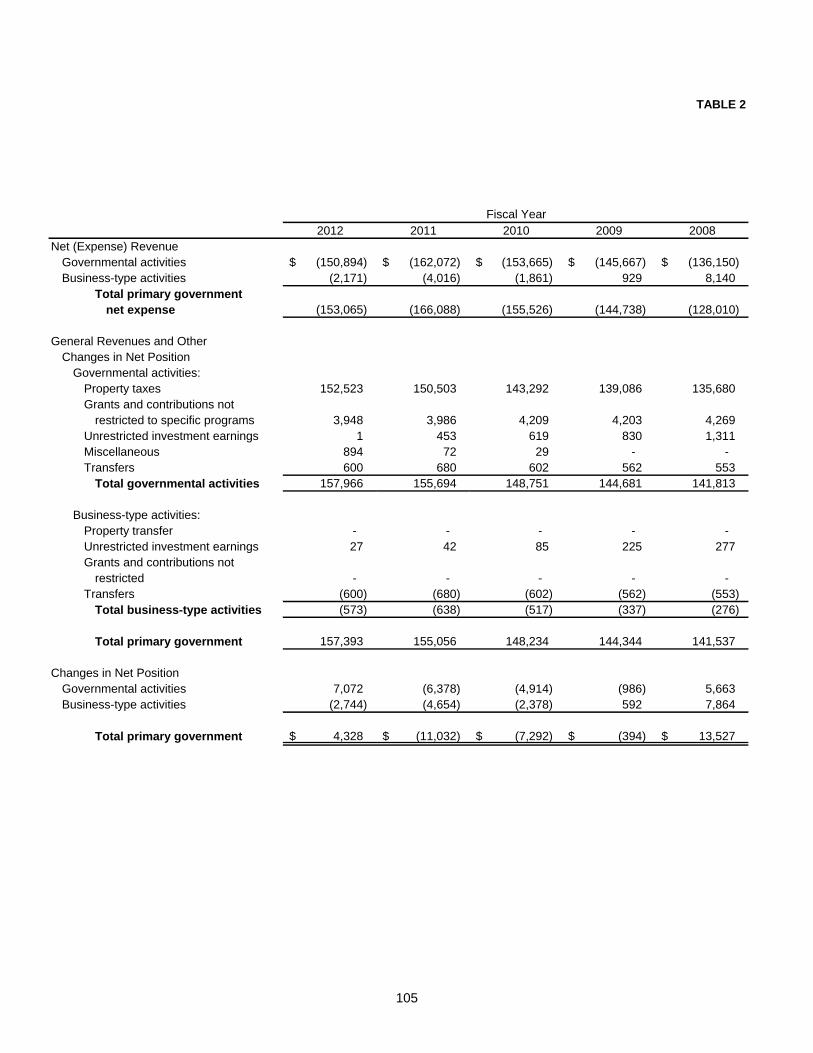
105
TABLE 2
2012 2011 2010 2009 2008
Net (Expense) Revenue
Governmental activities (150,894) $ (162,072) $ (153,665) $ (145,667) $ (136,150) $
Business-type activities (2,171) (4,016) (1,861) 929 8,140
Total primary government
net expense (153,065) (166,088) (155,526) (144,738) (128,010)
General Revenues and Other
Changes in Net Position
Governmental activities:
Property taxes 152,523 150,503 143,292 139,086 135,680
Grants and contributions not
restricted to specific programs 3,948 3,986 4,209 4,203 4,269
Unrestricted investment earnings 1 453 619 830 1,311
Miscellaneous 894 72 29 - -
Transfers 600 680 602 562 553
Total governmental activities 157,966 155,694 148,751 144,681 141,813
Business-type activities:
Property transfer - - - - -
Unrestricted investment earnings 27 42 85 225 277
Grants and contributions not
restricted - - - - -
Transfers (600) (680) (602) (562) (553)
Total business-type activities (573) (638) (517) (337) (276)
Total primary government 157,393 155,056 148,234 144,344 141,537
Changes in Net Position
Governmental activities 7,072 (6,378) (4,914) (986) 5,663
Business-type activities (2,744) (4,654) (2,378) 592 7,864
Total primary government 4,328 $ (11,032) $ (7,292) $ (394) $ 13,527 $
Fiscal Year

106
Town of Stratford, Connecticut TABLE 3
Fund Balances, Governmental Funds
Last Ten Fiscal Years
(in thousands)
2017 2016 2015 2014 2013 2012 2011 2010 2009 2008
General fund:
Reserved -$ -$ -$ -$ -$ -$ -$ 1,894 $ 2,363 $ 3,469 $
Unreserved - - - - - - - 6,604 8,438 8,220
Nonspendable 1,120 1,071 770 670 - - - - - -
Restricted - - 116 116 - - - - - -
Assigned 211 17 127 612 1,666 2,284 2,322 - - -
Unassigned 7,983 7,238 7,985 9,006 9,497 8,790 6,261 - - -
Total general fund 9,314 $ 8,326 $ 8,998 $ 10,404 $ 11,163 $ 11,074 $ 8,583 $ 8,498 $ 10,801 $ 11,689 $
All other governmental funds:
Reserved -$ -$ -$ -$ -$ -$ -$ 24 $ 24 $ 24 $
Unreserved - - - - - - - 23,026 19,292 17,650
Nonspendable 33 36 34 29 28 32 33 - - -
Restricted 23,184 3,154 3,356 3,344 3,011 2,784 2,777 - - -
Committed 1,593 7,030 23,275 8,953 20,612 18,045 24,116 - - -
Unassigned (1,487) (1,270) (1,009) (569) (595) (338) (419) - - -
Total all other
governmental
funds 23,324 $ 8,950 $ 25,656 $ 11,757 $ 23,056 $ 20,523 $ 26,507 $ 23,050 $ 19,316 $ 17,674 $
Note: Schedule prepared on the modified accrual basis of accounting.
Note: Fund balance classifications were modified beginning in fiscal year 2011 with the adoption of GASB Statement No. 54.
Fiscal Year

107
Town of Stratford, Connecticut TABLE 4
Changes In Fund Balances, Governmental Funds
Last Ten Fiscal Years
(In Thousands)
(Unaudited)
2017 2016 2015 2014 2013 2012 2011 2010 2009 2008
Revenues:
Property taxes and assessments 174,282 $ 165,013 $ 163,967 $ 158,063 $ 154,248 $ 153,069 $ 150,408 $ 140,553 $ 139,446 $ 135,778 $
Intergovernmental 61,476 51,818 57,375 49,273 50,978 47,876 45,050 43,636 42,929 69,422
Department revenue 6,320 5,642 5,320 5,445 4,935 5,028 4,949 5,154 4,564 5,445
Licenses and permits 1,161 1,309 1,215 1,076 961 760 831 653 685 755
Investment income 489 67 159 349 209 1 454 351 830 1,310
Other 2,510 4,600 5,443 5,513 5,842 5,661 4,543 4,265 4,694 4,452
Total revenues 246,238 228,449 233,479 219,719 217,173 212,395 206,235 194,612 193,148 217,162
Expenditures:
Administration 4,979 4,591 4,821 4,247 4,115 4,421 4,354 4,534 4,369 4,207
Contingency 2,642 3,688 4,013 4,203 2,853 3,031 2,087 2,256 2,137 2,545
Employee benefits 20,423 19,573 21,433 181,535 27,030 26,010 25,324 21,169 19,096 18,522
Finance 2,194 2,120 2,075 2,219 1,956 2,115 2,015 1,890 1,969 1,825
Human development 8,055 8,828 7,427 7,375 8,087 8,554 7,762 7,032 7,082 6,184
Physical development 12,811 13,351 13,891 14,228 16,260 13,222 13,422 13,644 15,337 14,557
Public safety 25,817 25,428 23,936 23,789 23,630 22,487 22,389 21,673 22,025 22,001
Education 133,878 120,859 118,380 115,647 112,560 110,889 107,915 104,512 102,140 122,241
Capital outlay 16,208 17,124 32,595 20,305 23,392 19,134 11,143 8,056 8,800 6,421
Debt service:
Principal retirement 14,701 12,955 13,004 16,672 14,275 13,683 12,336 12,131 11,276 14,506
Interest and other charges 18,398 18,425 18,327 5,812 4,828 3,614 7,013 7,452 7,455 7,569
Total expenditures 260,106 246,942 259,902 396,032 238,986 227,160 215,760 204,349 201,686 220,578
Excess of revenue over
(under) expenditures (13,868) (18,493) (26,423) (176,313) (21,813) (14,765) (9,525) (9,737) (8,538) (3,416)
Other financing sources (uses):
Transfers in 4,715 6,533 4,982 6,482 2,580 2,091 2,402 2,587 2,790 1,958
Transfers out (4,015) (5,833) (4,282) (5,801) (1,980) (1,491) (1,722) (1,985) (2,229) (1,405)
Proceeds from capital leases - 414 1,263 253 2,097 2,300 - - - -
Payments to escrow agents - - (9,995) (18,139) - (19,325) (66,088) (22,906) - -
Proceeds from refunding bonds - - 8,945 16,418 - 18,062 65,572 21,825 - -
Premiums on refunding 3,270 - 4,207 - - 1,424 935 1,262 - -
Bonds issued 25,260 - 33,795 163,137 21,475 8,212 11,700 10,385 8,730 10,795
Premiums on bonds - - - 1,905 263 - 267 - - -
Total other financing
sources (uses) 29,230 1,114 38,915 164,255 24,435 11,273 13,066 11,168 9,291 11,348
Net changes in fund balances 15,362 $ (17,379) $ 12,492 $ (12,058) $ 2,622 $ (3,492) $ 3,541 $ 1,431 $ 753 $ 7,932 $
Debt service as a percentage of noncapital
expenditures 13.3% 13.4% 13.6% 6.0% 8.7% 9.0% 10.5% 11.1% 10.8% 11.5%
Note: Schedule prepared on the modified accrual basis of accounting.
Fiscal Year

108
Town of Stratford, Connecticut
Assessed Value and Estimated Actual Value of Taxable Property
Last Ten Fiscal Years
Total Taxable
Fiscal Grand List Personal Motor Vacant FYI Assessed
Year Year Residential Commercial Property Vehicle Land [Exemptions*] Value
2017 2015 3,416,830,810 $ 852,056,190 $ 471,695,576 $ 336,333,270 $ 67,718,570 $ 665,643,720 $ 4,478,990,696 $
2016 2014 2,971,201,570 844,890,450 469,248,532 329,035,740 71,197,880 242,736,347 4,442,837,825
2015 2013 3,166,610,661 770,298,898 470,025,485 322,740,590 69,325,260 240,770,110 4,558,230,784
2014 2012 3,596,965,670 768,877,270 459,170,270 314,680,673 68,079,820 676,320,015 4,531,453,688
2013 2011 3,581,639,410 777,220,780 453,255,181 320,711,877 65,140,265 672,951,970 4,525,015,543
2012 2010 3,570,829,400 785,349,560 441,827,463 301,629,984 68,917,280 655,421,799 4,513,131,888
2011 2009 3,556,241,420 823,073,260 437,012,137 291,330,813 71,772,455 617,750,252 4,561,679,833
2010 2008 3,703,369,750 686,179,150 387,991,848 292,972,012 56,160,560 500,062,834 4,626,610,486
2009 2007 3,677,306,412 677,498,179 324,965,038 301,530,992 58,273,060 463,854,444 4,575,719,237
2008 2006 3,651,929,210 628,681,490 296,714,314 294,560,508 89,108,960 433,404,716 4,527,589,766
Source: Town of Stratford, Office of Tax Assessor
Notes: (1) Totals as certified by Tax Assessor at signing of Grand List prior to adjustments.
(2) Exemptions total includes exempt real property and all other classes of exemptions.
Real Property

109
TABLE 5
Estimated
Total Actual Taxable Assessed
Direct Taxable Value as a Percentage
Tax Assessed of Actual
Rate Value Taxable Value
38.99 5,144,634,416 $ 87%
36.98 4,685,574,172 95%
35.63 4,799,000,894 95%
34.64 5,207,773,703 87%
34.48 5,197,967,513 87%
34.15 5,168,553,687 87%
33.32 5,179,430,085 88%
30.36 5,126,673,320 90%
30.51 5,039,573,681 91%
30.12 4,960,994,482 91%

110
Town of Stratford, Connecticut TABLE 6
Property Tax Levies and Collections
Last Ten Fiscal Years
Taxes Levied Collections in
Fiscal Grand List for the Percentage Subsequent Percentage
Year Year (1) Tax Year Amount of Levy Years(2) Amount of Levy
2017 2015 172,755,443 $ 168,761,349 $ 97.69% 3,006,859 $ 171,768,208 $ 99.43%
2016 2014 164,272,933 160,243,285 97.55% 3,183,122 163,426,407 99.48%
2015 2013 162,727,443 158,559,699 97.44% 2,270,908 160,830,607 98.83%
2014 2012 156,748,314 152,760,084 97.46% 2,290,831 155,050,915 98.92%
2013 2011 155,392,622 151,858,937 97.73% 2,791,583 154,650,520 99.52%
2012 2010 152,921,577 150,227,449 98.24% 2,467,439 152,694,888 99.85%
2011 2009 150,248,842 146,798,179 97.70% 3,290,284 150,088,463 99.89%
2010 2008 139,908,592 136,920,401 97.86% 2,921,812 139,842,213 99.95%
2009 2007 137,961,016 135,494,537 98.21% 2,448,606 137,943,143 99.99%
2008 2006 134,121,083 131,726,602 98.21% 2,325,809 134,052,411 99.95%
Source: Town of Stratford Tax Records
Notes: (1) Taxes are collectible in the year after they are levied.
(2) Adjusted for lawful corrections and transfers to suspense.
Collected Within the Total Collections
Fiscal Year of the Levy To Date

111
Town of Stratford, Connecticut TABLE 7
Principal Property Taxpayers
Current Year and Nine Years Ago
Percentage Percentage
Taxable of Total Town Taxable of Total Town
Assessed Taxable Assessed Taxable
Value * Assessed Value * Assessed
Taxpayer ($000's) Rank Value Taxpayer ($000's) Rank Value
United Illuminating $ 93,654 1 2.09% United Illuminating $ 12,180 10 0.27%
Sikorsky Aircraft 73,025 2 1.64% Sikorsky Aircraft 168,335 1 3.72%
Southern Connecticut Gas 25,759 3 0.59% Southern Connecticut Gas 16,448 7 0.36%
Second Avenue Development LLC 21,192 4 0.48%
Lockheed Martin 21,095 5 0.48%
Stonybrook Gardens Cooperative 19,100 6 0.44% Stonybrook Gardens Inc. 19,110 3 0.42%
UB Dockside LLC (Urstadt Biddle Prop) 17,097 7 0.39%
Avalon at Stratford LLC 16,277 8 0.37%
Kramont Operating Partnership 15,498 9 0.36% Kramont Operating Partnership 16,520 6 0.36%
UB Railside LLC (Urstadt Biddle Prop) 13,724 10 0.32%
Dock Incorporated 22,369 2 0.49%
Home Depot 16,922 4 0.37%
Walmart 16,730 5 0.37%
Exxon Mobil Oil Corp. 15,164 8 0.33%
Merritt 8 Acquisitions, LLC 12,409 9 0.27%
TOTAL $ 316,421 7.16% TOTAL $ 316,187 6.96%
Source: Town of Stratford, Office of Tax Assessor
* Net taxable assessed value
FY2017 FY2008
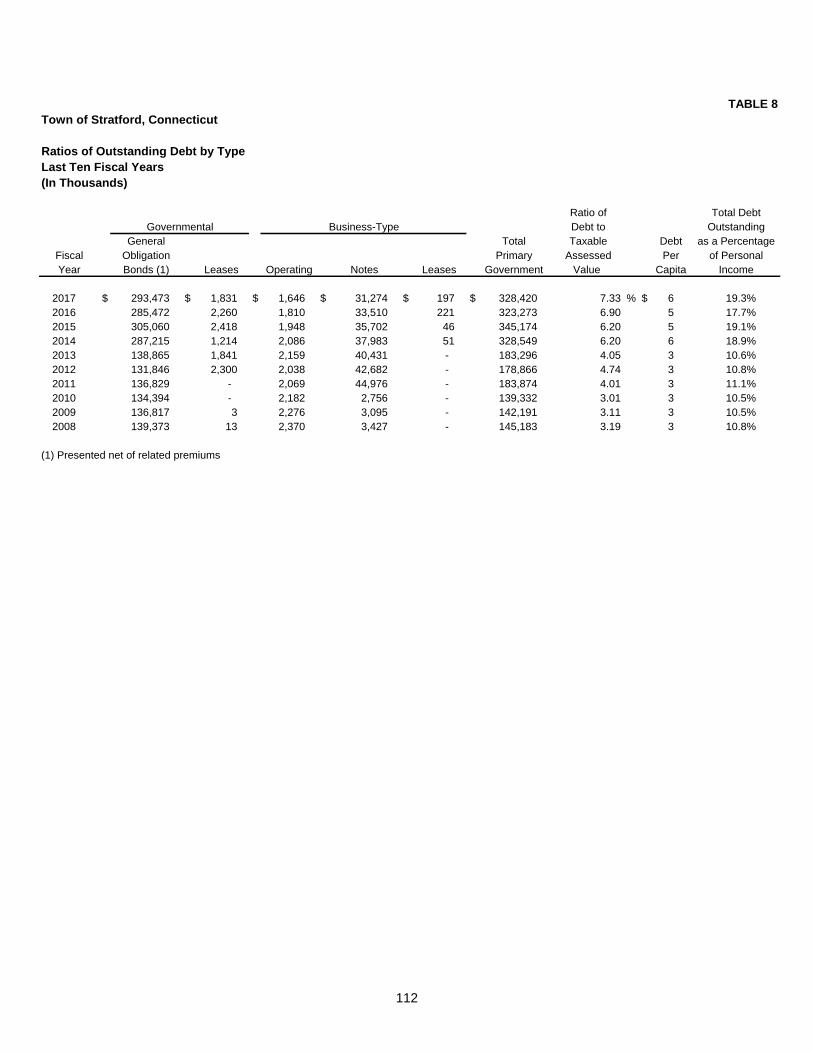
112
TABLE 8
Town of Stratford, Connecticut
Ratios of Outstanding Debt by Type
Last Ten Fiscal Years
(In Thousands)
Ratio of Total Debt
Governmental Business-Type Debt to Outstanding
General Total Taxable Debt as a Percentage
Fiscal Obligation Primary Assessed Per of Personal
Year Bonds (1) Leases Operating Notes Leases Government Value Capita Income
2017 $ 293,473 $ 1,831 $ 1,646 $ 31,274 $ 197 $ 328,420 7.33 % $ 6 19.3%
2016 285,472 2,260 1,810 33,510 221 323,273 6.90 5 17.7%
2015 305,060 2,418 1,948 35,702 46 345,174 6.20 5 19.1%
2014 287,215 1,214 2,086 37,983 51 328,549 6.20 6 18.9%
2013 138,865 1,841 2,159 40,431 - 183,296 4.05 3 10.6%
2012 131,846 2,300 2,038 42,682 - 178,866 4.74 3 10.8%
2011 136,829 - 2,069 44,976 - 183,874 4.01 3 11.1%
2010 134,394 - 2,182 2,756 - 139,332 3.01 3 10.5%
2009 136,817 3 2,276 3,095 - 142,191 3.11 3 10.5%
2008 139,373 13 2,370 3,427 - 145,183 3.19 3 10.8%
(1) Presented net of related premiums

113
Town of Stratford, Connecticut TABLE 9
Direct and Overlapping Governmental Activities Debt
As of June 30, 2017
None

114
TABLE 10
Town of Stratford, Connecticut
Ratios of General Bonded Debt Outstanding
Last Ten Fiscal Years
(In Thousands)
Percentage of
Estimated
Fiscal General Less: Amounts Actual Taxable Debt
Year Ended Obligation Available in Debt Value of Per
June 30 Bonds (1) Service Fund Total Property Capita
2017 $ 293,473 $ 443 $ 293,030 - % $ 6
2016 285,472 887 284,585 6.10 5
2015 305,060 1,387 303,673 5.87 5
2014 287,215 3,887 283,328 6.22 5
2013 138,865 - 138,865 3.11 3
2012 131,846 - 131,846 2.92 3
2011 136,829 - 136,829 3.02 3
2010 134,394 - 134,394 2.95 3
2009 136,817 - 136,817 3.04 3
2008 139,373 - 139,373 3.13 3
(1) Presented net of related premiums
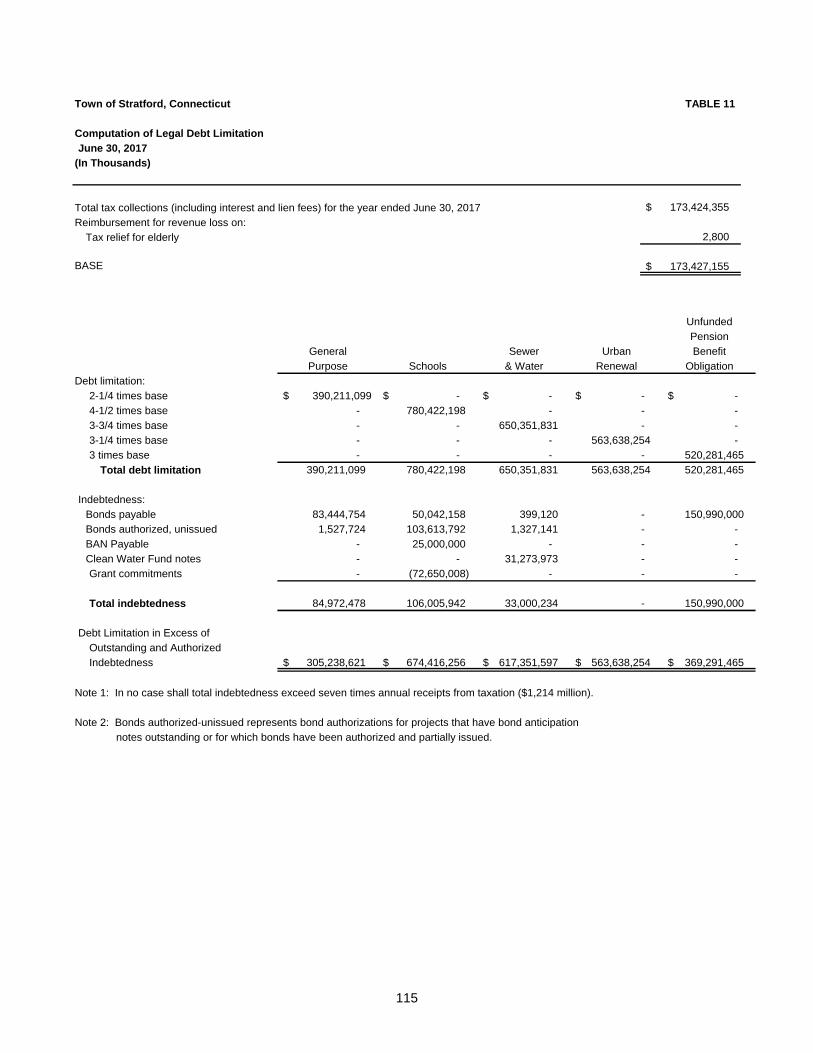
115
Town of Stratford, Connecticut TABLE 11
Computation of Legal Debt Limitation
June 30, 2017
(In Thousands)
Total tax collections (including interest and lien fees) for the year ended June 30, 2017 173,424,355 $
Reimbursement for revenue loss on:
Tax relief for elderly 2,800
BASE 173,427,155 $
Unfunded
Pension
General Sewer Urban Benefit
Purpose Schools & Water Renewal Obligation
Debt limitation:
2-1/4 times base 390,211,099$ -$ -$ -$ -$
4-1/2 times base - 780,422,198 - - -
3-3/4 times base - - 650,351,831 - -
3-1/4 times base - - - 563,638,254 -
3 times base - - - - 520,281,465
Total debt limitation 390,211,099 780,422,198 650,351,831 563,638,254 520,281,465
Indebtedness:
Bonds payable 83,444,754 50,042,158 399,120 - 150,990,000
Bonds authorized, unissued 1,527,724 103,613,792 1,327,141 - -
BAN Payable - 25,000,000 - - -
Clean Water Fund notes - - 31,273,973 - -
Grant commitments - (72,650,008) - - -
Total indebtedness 84,972,478 106,005,942 33,000,234 - 150,990,000
Debt Limitation in Excess of
Outstanding and Authorized
Indebtedness 305,238,621 $ 674,416,256 $ 617,351,597 $ 563,638,254 $ 369,291,465 $
Note 1: In no case shall total indebtedness exceed seven times annual receipts from taxation ($1,214 million).
Note 2: Bonds authorized-unissued represents bond authorizations for projects that have bond anticipation
notes outstanding or for which bonds have been authorized and partially issued.

116
TABLE 12
Town of Stratford, Connecticut
Legal Debt Margin Information
Last Ten Fiscal Years
(In Thousands)
2016 2016 2015 2014 2013 2012 2011 2010 2009 2008
Debt limitation $ 1,213,990 $ 1,154,855 $ 1,144,289 $ 1,098,867 $ 1,077,251 $ 1,074,213 $ 1,049,881 $ 980,203 $ 970,067 $ 939,939
Total net debt applicable to limit 374,969 458,836 407,698 430,861 257,927 253,557 260,439 203,804 189,096 142,126
Legal Debt Margin $ 839,021 $ 696,019 $ 736,591 $ 668,006 $ 819,324 $ 820,656 $ 789,442 $ 776,399 $ 780,971 $ 797,813
Total net debt applicable to the limit
as a percentage of debt limit 30.89% 39.73% 35.63% 39.21% 23.94% 23.60% 24.81% 20.79% 19.49% 15.12%
Source: Comprehensive annual financial report - Computation of Legal Debt Margin
Note: See Table 9 for calculation of current year debt limitation.
Fiscal Year

117
Town of Stratford, Connecticut TABLE 13
Demographic and Economic Statistics
Last Ten Calendar Years
Calendar Per Capita Median School Unemployment Personal
Year Population(1) Income(2) Age(3) Enrollment(4) Rate(5) Income
2017 52,715 $ 32,357 42.0 7,045 5.6% 1,705,699,255$
2016 52,609 34,775 43.0 7,016 6.4% 1,829,477,975
2015 52,734 34,215 42.5 6,997 6.3% 1,804,293,810
2014 51,384 33,805 42.5 7,198 6.4% 1,737,036,120
2013 51,384 33,716 42.2 7,411 8.7% 1,732,462,944
2012 51,384 32,357 41.1 7,407 10.5% 1,662,632,088
2011 51,384 32,357 41.1 7,234 7.4% 1,662,632,088
2010 48,952 27,000 40.3 7,435 9.4% 1,321,704,000
2009 49,976 27,000 40.3 7,496 7.9% 1,349,352,000
2008 49,976 27,000 40.3 7,534 5.5% 1,349,352,000
(1) Source: U.S. Census Bureau
(2) Source: U.S. Census Bureau
(3) Source: U.S. Census Bureau
(4) Source: Town of Stratford, BOE
(5) Source: State of Connecticut Dept. of Labor - Office of Research - Labor Market Info. [LMI]

118
Town of Stratford, Connecticut TABLE 14
Principal Employers
2017 and 2008
(Unaudited)
Percentage Percentage
of Total Town of Total Town
Business Name Nature of Business Employees Rank Employment Employees Rank Employment
Sikorsky Aircraft Manufacturer of Helicopters 6,153 1 23.43% 8,300 1 33.48%
Town of Stratford Government/Education 1,327 2 5.05% 1,400 2 5.65%
United Parcel Service Package Delivery 521 3 1.98% 415 5 1.67%
Lord Chamberlain Skilled Nursing Facility 415 4 1.58% 360 7 1.45%
Ashcroft Holdings Manufacturer of Gauges, Valves 399 5 1.52% 475 4 1.92%
Cablevision Cable Television, Internet, Telecom. 300 6 1.14% 300 8 1.21%
Connecticut Distributor Liquor Distributors 286 7 1.09% 238 14 0.96%
Aptar Manufacturer Pump Atomizers 271 8 1.03% NA NA NA
Yale New Haven Technology Center Electronic Storage 235 9 0.89% NA NA NA
ShopRite Retail Grocery Products 225 10 0.86% NA NA NA
Bridgeport Fittings Manufacturer of Electrical Fittings 203 11 0.77% 258 11 1.04%
Burns Construction Construction 199 12 0.76% NA NA N/A
William B. Myers Moving, Storage & Rigging 172 13 0.65% NA NA N/A
Stop & Shop Retail Grocery Products 165 14 0.63% 194 15 0.78%
Stratford Retailer Condo Assoc. Retail Chains NA NA N/A 569 3 2.30%
Dianon Systems Lab Testing NA NA N/A 385 6 1.55%
Walmart Consumer Goods NA NA N/A 280 9 1.13%
Applied Tech Products Health and Beauty Care NA NA N/A 267 10 1.08%
EMSAR Manufacturer Pump Atomizers NA NA N/A 253 12 1.02%
AT&T Telecommunications NA NA N/A 250 13 1.01%
Total 10,871 41.39% 13,944 56.25%
Total Employment 26,262 24,790
Source: Town of Stratford, Office of Community Development
NA- Not Applicable
2017 2008

119
Town of Stratford, Connecticut TABLE 15
Full-Time Equivalent Town Government Employees by Function/Program
Last Ten Fiscal Years
(Unaudited)
Function/Program 2017 2016 2015 2014 2013 2012 2011 2010 2009 2008
General government 91 81 79 78 83 64 89 90 86 75
Police 106 104 113 111 106 117 116 116 108 111
Fire 111 107 111 109 117 111 100 100 104 111
Refuse collection 28 29 31 29 28 29 32 32 31 33
Other public works 77 76 76 74 67 76 64 64 65 76
Parks 24 22 22 23 16 21 24 26 23 25
Recreation 4 4 4 5 3 6 7 7 7 7
Total Non-Education 441 423 436 429 420 424 432 435 424 438
Education 886 882 891 891 890 864 847 844 843 864
Total Including Education 1,327 1,305 1,327 1,320 1,310 1,288 1,279 1,279 1,267 1,302
Source: Town of Stratford, Human Resource Department
Town of Stratford, Board of Education
Fiscal Year

120
Town of Stratford, Connecticut TABLE 16
Operating Indicators by Function/Program
Last Ten Fiscal Years
(Unaudited)
Function/Program 2017 2016 2015 2014 2013 2012 2011 2010 2009 2008
General government:
Building permits issued 745 687 739 736 749 709 669 649 634 690
Building inspections conducted 3,713 3,665 3,889 3,426 3,151 3,090 3,188 3,136 3,186 3,475
Police:
Physical arrests 1,515 1,704 1,566 1,144 1,403 1,520 1,419 1,597 1,233 1,363
Parking violations 11,117 7,567 397 468 464 631 431 369 519 994
Traffic violations 1,802 1,558 1,386 1,767 2,158 2,595 2,969 4,009 4,259 3,611
Fire:
Emergency responses 6,088 6,092 5,749 5,749 6,772 5,556 5,707 4,577 5,307 5,196
Fires extinguished 10 219 208 208 318 304 311 435 530 367
Inspections 1,586 2,180 1,941 1,941 1,992 1,747 1,216 665 1,200 1,111
Refuse collection:
Refuse collected (tons per year) 22,103 20,522 21,571 21,961 23,100 24,035 24,636 26,747 25,657 27,073
Recyclables collected (tons per year) 3,332 3,297 3,232 3,196 3,126 3,173 3,365 3,487 3,718 4,047
Parks and recreation:
Athletic field permits issued 9,000 7,987 8,801 9,304 9,570 9,379 10,192 8,851 8,781 9,437
Wastewater:
Average daily sewage treatment
(thousands of gallons) 7,050 6,501 7,669 7,669 7,896 6,700 8,826 8,413 8,182 9,290
Source: Town of Stratford, Building/Engineering
Town of Stratford, Police Department
Town of Stratford, Fire Department
Town of Stratford, Public Works Department
Town of Stratford, Recreation Department
Town of Stratford, Library
Fiscal Year

121
Town of Stratford, Connecticut TABLE 17
Capital Asset Statistics by Function/Program
Last Ten Fiscal Years
(Unaudited)
Function/Program 2017 2016 2015 2014 2013 2012 2011 2010 2009 2008
Police:
Stations 1 1 1 1 1 1 1 1 1 1
Patrol units (Number of Vehicles) 59 31 33 33 32 32 30 30 29 28
Fire stations 4 4 4 4 4 4 4 4 4 4
Refuse collection:
Refuse collection trucks 4 4 4 4 4 4 4 4 4 4
Recycling collection trucks 3 3 3 3 3 3 3 3 3 3
Yard Waste Trucks 2 2 2 2 2 2 2 - - -
Parks and recreation:
Acreage 795 795 795 795 795 795 795 795 795 774
Playgrounds 30 30 30 27 27 27 27 27 27 23
Baseball/softball diamonds 34 38 38 42 45 45 45 45 45 45
Soccer/football fields 14 14 14 13 13 13 13 13 13 13
Community centers 2 2 2 2 2 2 2 2 2 2
Wastewater:
Sanitary sewers (miles) 191 170 200 200 200 200 200 200 200 200
Storm sewers (miles) 125 125 125 125 125 125 125 125 125 125
Treatment capacity (thousands of gallons) 14,500 14,500 14,500 14,500 14,500 14,500 14,500 14,500 14,500 11,500
Town of Stratford, Police Department
Town of Stratford, Fire Department
Town of Stratford, Public Works Department
Town of Stratford, Recreation Department
Town of Stratford, Engineering Department
Fiscal Year