town size and changes in iowa small towns€¦ · town size and changes in iowa’s small towns t...
TRANSCRIPT

R D I R U R A L DEVELOPMENT I N I T I A T I V E
IOWA STATE UNIVERSITY DEPARTMENT OF SOCIOLOGY
TOWN SIZE AND CHANGES IN IOWA’S SMALL TOWNS KERRY AGNITSCH • TERRY BESSER JEAN FRIESTAD • MONICA WHITHAM
RDI-226

TOWN SIZE AND CHANGES IN IOWA’S SMALL TOWNS
T raditionally, small towns have served as the cultural and socioeconomic hub for Iowa’s residents. In recent years, due to a variety of circumstances, the survival of many of
Iowa’s rural communities is in question. Declines in the number of farms and businesses have contributed to a steady out-migration of residents, leaving fewer individuals and decreasing public revenue to address an increasing number of problems. Recognizing the significance of rural towns to Iowa’s heritage, a major research effort was initiated in 1994 to assess the social conditions in Iowa’s small towns. The purpose of this project, called the Rural Development Initiative, was to provide data that would improve the basis for policy decisions to stimulate rural development and economic growth. This research focused on three main areas: commu-nity quality of life, the local social environment, and community involvement. To examine these issues, 99 communities between 500 and 10,000 in population that are not contiguous to a metropolitan area (cities with at least 50,000 population) were selected to repre-sent Iowa’s small towns. Questionnaires were completed by more than 10,000 residents in those selected communities, and the resulting information was provided to community residents and local leaders through a series of reports. Ten years later, in 2004, residents in the same communities were asked to participate in a similar study with the goal of learning how the so-cial conditions have changed. Another component was added in the 2004 study to examine the impact of relatively sudden events, called “economic shocks”, on the local economies of Iowa’s small towns. A recently released report presented the statewide results from this study.1 However, we know that towns face different opportunities and challenges based on their location in the state and on their population size. Accordingly, in this report, we are focusing on the impact of town size on changes in quality of life, the local social environment, and community involvement. Addition-ally, we will look at patterns surrounding economic shocks and how they differ by town size. To do this, the 99 towns have been divided into four town-size categories: 500 to 700 in popu-lation, 701 to 1,000 in population, 1,001 to 2,000 in population, and 2,001 to 10,000 in popula-tion. The characteristics of each town-size category are the average of the characteristics for the towns in each group. 1 See A Decade of Change in Iowa’s Small Towns at our website: www.soc.iastate.edu/rdiweb/.
ii

iii
TABLE OF CONTENTS
Introduction....................................................................................... Page ii
Table of Contents.............................................................................. Page iii
Acknowledgements........................................................................... Page iv
Study Design..................................................................................... Page v
Town Size and Quality of Life.......................................................... Pages 1-10
Government Services ................................................................... Pages 1-4
Non-Government Services........................................................... Pages 4-7
Local Patronage Patterns.............................................................. Pages 8-10
The Social Environment and Town Size .......................................... Pages 11-17
Social Qualities ............................................................................ Pages 11-13
Community Attachment............................................................... Page 14
Social Capital ............................................................................... Pages 15-16
Social Ties............................................................................. Pages 15
Trust ...................................................................................... Pages 16
Community Involvement and Town Size ......................................... Pages 18-23
Membership in Local Organizations........................................... Pages 18-20
Participation in Community Projects .......................................... Page 20
Limitations to Community Involvement..................................... Page 21
Informal Community Involvement ............................................. Page 22
Town Size and Economic Shocks..................................................... Pages 24-29
Number and Types of Shocks by Town Size.............................. Pages 24-26
Origin and Impact of Economic Shocks by Town Size.............. Page 27
Net Shock Significance............................................................... Page 28
Appendix (List of Communities, Counties, 1990 and 2000
Population Estimates, and Population Change) .......................... Pages 30-33

ACKNOWLEDGEMENTS
T his report (RDI-226) is one of a series of community reports available as part of Iowa State University Department of Sociology’s Rural Development Initiative Project.
Funding for this project was provided through the Iowa Agriculture and Home Economics Experiment Station, College of Agriculture, Iowa State University, and through the Na-tional Research Initiative, U.S. Department of Agriculture, under Agreement Number 2003-35401-13828. We wish to thank the students, staff, and faculty at Iowa State University who contributed to the completion of this report. From the mailing of surveys and telephone interviewing, to the writing of reports, the following individuals played a major role:
Samantha Archibald Phil DeKoster
Jana Drake Molly Drilling Laura Forster
Melissa Hickman Maggie Kasperbauer
Zach Knutsen Lori Merritt Lois Oldham Nick Recker
Tom Rice Calsee Robb Vern Ryan
We also wish to thank local officials, County Extension Education Directors, and repre-sentatives of the local media in the towns participating in this research. They assisted in providing sources of information and publicizing the results of the study. Last, but not least, we acknowledge the cooperation of the nearly 22,000 Iowa citizens who contributed to this research in both 1994 and 2004 by completing questionnaires or participating in telephone interviews. There is no better indication of the importance of small towns to Iowans than the fact that so many individuals voluntarily participated in a study of this type.
iv

STUDY DESIGN
T his study was designed to examine changes in Iowa’s rural communities over the ten-year period from 1994 to 2004. As such, the communities selected for the study remained the same in both
years. However, the residents who participated by completing the questionnaires differed. The follow-ing section discusses the methods utilized to select towns and participants. Probability sampling procedures were used to select participants in two stages: the selection of commu-nities (in 1994) and the selection of residents (in both 1994 and 2004). First, one community was ran-domly selected from those between 500 and 10,000 in size and not adjacent to a metropolitan area (50,000 persons or larger) from each of Iowa’s 99 counties. (See the Appendix for a list of communities divided by town size group, their corresponding counties, population, and percentage population gain or loss over the decade.) Communities with fewer than 500 residents were excluded from the study because basic services are typically unavailable, and therefore cannot be evaluated. Second, telephone directories were used to select households located in and around the 99 communities. One hundred and fifty house-holds were randomly chosen from the directories in each town. Within households, adult heads and co-heads of the household were randomly chosen by gender, with instructions that if the designated gender was not present, another adult member of the household should complete the questionnaire. Questionnaires were mailed to selected participants. Two additional mailings were sent thanking respon-dents for their participation and asking non-respondents to participate. Households for which the ques-tionnaire was returned by mail and deemed undeliverable were replaced with another household. Table 1 shows response rate information for both years in the town size groups.
Table 1: Response Rates for Town Size Groups 1994 2004
500 to 700 (n = 25) 73% 68%
701 to 1,000 (n = 22) 74% 70% 1,001 to 2,000 (n = 27) 74% 67% 2,001 to 10,000 (n = 25) 73% 66%
A NOTE ON INTERPRETATION
T hroughout this report, two types of statistically significant differences will be reported. Significant changes within a town size group between 1994 and 2004 will be noted with an asterisk (*). Sig-
nificant differences between town size groups within each year will be noted with a section sign (§). When looking at the results for various items, it is important to note that differences or changes of the same magnitude may not always be statistically significant across all graphs. (See A Decade of Change in Iowa’s Small Towns for more details). Moreover, a statistically significant change or differ-ence is not necessarily an important one. Statistical significance means that we are fairly certain that the difference or change is real. It is up to the reader to decide if the difference is important.
v

TOWN SIZE AND QUALITY OF LIFE Q uality of life is a broad term that refers to the extent to which the features of a community are able to
meet the needs and wants of its population. The availability and quality of local services and ameni-ties such as parks, grocery stores, medical facilities, public safety services, schools, and others determines, in part, the quality of life for local citizens. Because these services and amenities are dependent on local public or private revenue, it is likely that town size will impact both availability and quality of services. Residents in this study were asked to evaluate the services and facilities available in their communities and to tell us whether they stayed in town to meet their needs. The following pages show the results for towns of different sizes.
GOVERNMENT SERVICES Residents count on local governments to provide infrastructure, such as streets and water, as well as public safety services, such as police, fire, and emergency response. Eight different government services were listed in the survey with instructions for residents to rate each as “very good”, “good”, “fair”, or “poor”. A ninth question asked them to rate the overall quality of government services in their towns. Figures 1 through 9 show the percentage of residents who rated each service as “good” or “very good” by town size.
Residents’ ratings for fire protection are shown in Figure 2. The vast ma-jority of residents assigned ratings of “good” or “very good” to the fire pro-tection services in their towns, re-gardless of town size. No significant changes occurred in ratings between 1994 or 2004 for any town size group. There was a significant differ-ence across town size groups in 1994, however. Ratings for fire protection were significantly lower in the small-est towns, when compared to the mid-dle two town size groups.
1
Figure 1 shows residents’ ratings of the overall quality of government services in 1994 and 2004. In all town size groups, ratings increased over the decade. The most improvement was in the smallest communities where the percentage of positive ratings increased from 56 per-cent in 1994 to 65 percent in 2004—an increase of 9 percent. Additionally, rat-ings for overall quality of government services were significantly lower in the smallest towns than in the other town size groups in 1994. In 2004, there were no significant differences between town size groups.
56%
68% 71% 68%65%72% 73% 74%
0%
20%
40%
60%
80%
100%
* 500 to700
* 701 to1,000
* 1,001 to2,000
* 2,001 to10,000
Town Size
Perc
ent "
Very
Goo
d" o
r "G
ood"
1994
2004
Figure 1: Overall Quality of Government Services
§
Figure 2: Fire Protection
88%94% 94% 91%88% 93% 93% 91%
0%
20%
40%
60%
80%
100%
500 to 700 701 to1,000
1,001 to2,000
2,001 to10,000
Town Size
Perc
ent "
Very
Goo
d" o
r "G
ood"
1994
2004
§

Ratings of the quality of local public parks in towns of different sizes are shown in Figure 5. As with most government ser-vices, ratings are high—more than seven in ten residents in both years assigned posi-tive ratings to the quality of their city parks in both years. However, the percentage of favorable ratings decreased over the decade for those towns 701 to 1,000 in population size, from 84 percent in 1994 to 79 percent in 2004. Ratings for parks in other town size groups did not change significantly, nor were there any significant differences between town size groups.
Figure 4 displays the percentage of “good” or “very good” ratings for gar-bage collection for 1994 and 2004 by town size. Across all town size groups, the percentage of favorable ratings in-creased between 1994 and 2004. The largest increase occurred for the smallest towns, from 76 percent in 1994 to 88 per-cent in 2004—an increase of 12 percent. Ratings of the quality of garbage collec-tion increased by 6 percent in the middle two groups of towns, while those in the largest communities went up by 7 per-cent, from 81 percent in 1994 to 88 per-cent in 2004. There were no significant differences between town size groups in either 1994 or 2004.
Ratings for emergency response services in 1994 and 2004 are shown in Figure 3. As with fire protection, residents’ ratings re-mained high and stable. More than eight in ten residents assigned positive ratings to emergency response in all town size groups. No changes in ratings occurred within any town size group between 1994 and 2004. The percentage of favorable rat-ings was higher for towns between 701 and 2,000 in population when compared to the group of smallest towns in 1994. In 2004, ratings for the smallest towns were signifi-cantly lower than ratings for the 701 to 1,000 town size group.
2
75%84% 82% 81%
73%79% 80% 78%
0%
20%
40%
60%
80%
100%
500 to 700 * 701 to1,000
1,001 to2,000
2,001 to10,000
Town Size
Perc
ent "
Very
Goo
d" o
r "G
ood"
1994
2004
Figure 5: Condition of Parks
81%82%83%76%
88%88%89%88%
0%
20%
40%
60%
80%
100%
* 500 to 700 * 701 to1,000
* 1,001 to2,000
* 2,001 to10,000
Town Size
Perc
ent "
Very
Goo
d" o
r "G
ood"
1994
2004
Figure 4: Garbage Collection
85%93% 91% 89%86%
93% 91% 90%
0%
20%
40%
60%
80%
100%
500 to 700 701 to1,000
1,001 to2,000
2,001 to10,000
Town Size
Perc
ent "
Very
Goo
d" o
r "G
ood"
1994
2004
Figure 3: Emergency Response
§ §

Figure 8 shows the ratings for police protection by town size. Ratings did not change significantly over the dec-ade, but they varied substantially across town size groups in both years. Nearly three-fourths of residents were pleased with police protection in the largest towns in both years, while only one-third assigned positive rat-ings to police protection in the small-est towns. In both 1994 and 2004, just over one-half of residents rated police protection as “good” or “very good” in towns 701 to 1,000 in size, while 62 percent did so in towns with between 1,001 and 2,000 residents.
3
Figure 6 shows the percentage of “good” and “very good” ratings as-signed to public schools by residents in 1994 and 2004. Positive ratings were high and stable for the towns over 1,001 in population. However, a significant decrease occurred for the smallest towns. When comparing across town size groups, the percent-age of positive ratings for public schools was significantly lower for the smallest communities in both years than for the two groups of lar-ger towns.
Water services received positive ratings from roughly two-thirds of residents across towns of all sizes as shown in Figure 7. No signifi-cant changes in ratings occurred over the decade for any town size group, nor were there any signifi-cant differences between town size groups.
73%
62%55%
32%
74%
62%
52%
32%
0%
20%
40%
60%
80%
100%
500 to 700 701 to 1,000 1,001 to2,000
2,001 to10,000
Town Size
Perc
ent "
Very
Goo
d" o
r "G
ood"
1994
2004
Figure 8: Police Protection
§ §
65%
77%87% 86%
52%
72%
88% 87%
0%
20%
40%
60%
80%
100%
* 500 to 700 701 to 1,000 1,001 to2,000
2,001 to10,000
Town Size
Perc
ent "
Very
Goo
d" o
r "G
ood"
1994
2004
Figure 6: Public Schools
§ §
64% 64% 69% 68%69%65% 65%
73%
0%
20%
40%
60%
80%
100%
500 to 700 701 to 1,000 1,001 to2,000
2,001 to10,000
Town Size
Perc
ent "
Very
Goo
d" o
r "G
ood"
1994
2004
Figure 7: Water

Figure 9 shows the percentage of “good” and “very good” ratings residents assigned to the condi-tion of the streets in their commu-nities in 1994 and 2004. Ratings remained stable between the two years, with roughly half of resi-dents viewing their streets favora-bly in all groups of towns. Addi-tionally, there were no significant differences in ratings between town size groups for either 1994 or 2004.
NON-GOVERNMENT SERVICES
Non-government services, such as the availability of jobs, housing, medical services, shopping, and others also contribute to the quality of life in small towns. In this study, residents were asked to assign ratings of “very good”, “good”, “fair”, “poor”, or “not available” to the overall quality of non-government services in their towns and to a list of eight types of services. The percentage of residents who assigned ratings of “good” or “very good” to non-government services in each town size group are shown in Figures 10 through 18. (Note: The percentages shown for ratings of non-government services are calculated including “not available” responses. As a result, very low numbers, such as those for shopping facilities or recrea-tion/entertainment, may reflect the lack of services available for towns in a town size group.)
4
44%54% 53%
48%48% 52% 54%48%
0%
20%
40%
60%
80%
100%
500 to 700 701 to 1,000 1,001 to2,000
2,001 to10,000
Town Size
Perc
ent "
Very
Goo
d" o
r "G
ood"
1994
2004
Figure 9: Condition of Streets
59%57%53%
44%51%
44%36%
28%
0%
20%
40%
60%
80%
100%
* 500 to 700 * 701 to1,000
* 1,001 to2,000
* 2,001 to10,000
Town Size
Perc
ent "
Very
Goo
d" o
r "G
ood"
1994
2004
Figure 10: Overall Quality of Non-Government Services
§ §
Residents’ ratings of the changes in overall quality of non-government services from 1994 to 2004 by town size are shown in Figure 10. In both years, ratings were significantly lower in the group of smallest towns when compared to the two groups of largest communities. Addition-ally, the percentage of positive ratings declined significantly over the decade for all town sizes. However, the steepest decline in overall quality of non-government services occurred in the two groups of smaller towns.

5
While ratings for the overall quality of non-government ser-vices dropped between 1994 and 2004, positive ratings for housing increased significantly across all town sizes (see Figure 11). In 1994, ratings for hous-ing were lower for the smallest towns when compared to the 701 to 1,000 town size group. Similarly, the percentage of fa-vorable ratings assigned to housing was lower in the small-est towns when compared to all other groups in 2004.
Ratings of the quality of local child care services by town size for 1994 and 2004 are shown in Figure 12. The impact of town size on the rat-ings for child care services is evident. In both years, fewer than one-third of residents assigned favorable ratings for child care in the smallest towns, while over half did so in the larger towns. A significant increase in the percentage of “good” or “very good” ratings occurred from 1994 to 2004 in towns with between 701 and 1,000 residents and for those with 2,001 to 10,000 residents. Ratings for the other groups of towns were stable.
Ratings for senior programs are simi-larly impacted by town size—ratings are higher in the largest towns, and generally decrease as town size de-clines (see Figure 13). In 2004, rat-ings were significantly higher for the largest two groups of towns than for the 500 to 700 town size group. In 1994, however, ratings for senior pro-grams in the smallest towns were lower than those in all other towns. Additionally, compared to 1994, rat-ings for senior programs declined by 10 percent in the two groups of towns under 1,000 in population.
36%
47%38%
46%47%
61%55%
62%
0%
20%
40%
60%
80%
100%
* 500 to 700 * 701 to 1,000 * 1,001 to2,000
* 2,001 to10,000
Town Size
Perc
ent "
Very
Goo
d" o
r "G
ood"
1994
2004
Figure 11: Housing
§ §
31%39%
49%55%
29%
52% 54%
64%
0%
20%
40%
60%
80%
100%
500 to 700 * 701 to1,000
1,001 to2,000
* 2,001 to10,000
Town Size
Perc
ent "
Very
Goo
d" o
r "G
ood"
1994
2004
Figure 12: Child Care
§ §
63%54%55%
40%
61%
50%45%
30%
0%
20%
40%
60%
80%
100%
* 500 to 700 * 701 to1,000
1,001 to2,000
2,001 to10,000
Town Size
Perc
ent "
Very
Goo
d" o
r "G
ood"
1994
2004
Figure 13: Senior Programs
§ §

16% 20% 23% 26%
11% 12% 16%24%
0%
20%
40%
60%
80%
100%
* 500 to 700 * 701 to1,000
* 1,001 to2,000
2,001 to10,000
Town Size
Perc
ent "
Very
Goo
d" o
r "G
ood"
1994
2004
Figure 16: Recreation/Entertainment
§ §
Assessments of the quality of local medi-cal services in 1994 and 2004 for the town size groups are shown in Figure 14. Ratings are stable for groups of towns under 2,000 in population—no signifi-cant changes occurred between 1994 and 2004. However, ratings for medical ser-vices improved for the largest communi-ties. Additionally, the impact of town size on residents’ evaluations of quality is evident. Half or more of the residents in the two groups of larger towns as-signed positive ratings to local medical services, while fewer than one-fourth did so in the two groups of smaller communi-ties.
Evaluations of local recreation and enter-tainment in 1994 and 2004 by town size are shown in Figure 16. Across all town sizes, and for both years, relatively few residents assigned positive ratings to recreation and entertainment in their towns. In 1994, however, ratings were significantly higher in the largest towns compared to the small-est towns, while in 2004, the percentage of positive ratings for recreation was greater in the largest towns when compared to all other town size groups. Additionally, fa-vorable ratings declined over the decade for towns under 2,000 in population.
6
19%24%
50%58%
16%24%
53%
66%
0%
20%
40%
60%
80%
100%
500 to 700 701 to1,000
1,001 to2,000
* 2,001 to10,000
Town SizePe
rcen
t "Ve
ry G
ood"
or "
Goo
d"
1994
2004
Figure 14: Medical Services
§ §
34%32%31%21%
41%35%
27%20%
0%
20%
40%
60%
80%
100%
500 to 700 701 to 1,000 1,001 to2,000
* 2,001 to10,000
Town Size
Perc
ent "
Very
Goo
d" o
r "G
ood"
1994
2004
Figure 15: Programs for Youth
§ §
Figure 15 shows the percentage of residents who assigned “good” or “very good” ratings to youth pro-grams in 1994 and 2004 by town size. For the largest towns, rat-ings for youth programs of “good” or “very good” increased from 34 percent in 1994 to 41 percent in 2004. Additionally, ratings for youth programs were significantly higher in the largest towns com-pared to the smallest towns in 1994. In 2004, ratings were higher for the largest towns compared to both groups of smaller towns.

Residents’ evaluations of the qual-ity of local jobs for 1994 and 2004 by town size are shown in Figure 18. Not surprisingly, town size affects evaluations of local jobs. In the largest towns, 29 percent in 1994 and 25 percent in 2004 rated local jobs favorably. However, in the 700 to 1,000 town size group, only 10 percent were pleased with local jobs for both years, and only 6 percent rated jobs favorably in 2004 in the smallest towns. Addi-tionally, the percentage of positive ratings for local jobs declined in the smallest towns and those with 1,001 to 2,000 residents.
The percentage of “good” or “very good” ratings assigned by residents to local shopping facilities are displayed in Figure 17. Residents’ evaluations of shopping are stable over the dec-ade for all town size groups. As with recreation and entertainment, the per-centage of positive ratings is rela-tively low for all town sizes. Very few residents in the smallest towns were pleased with the shopping facili-ties in their towns in either 1994 or 2004. Ratings for shopping were sig-nificantly higher for the largest towns when compared to the two groups of smaller towns in both years.
7
25%
16%11%
7%
26%18%
12%5%
0%
20%
40%
60%
80%
100%
500 to 700 701 to 1,000 1,001 to2,000
2,001 to10,000
Town Size
Perc
ent "
Very
Goo
d" o
r "G
ood"
1994
2004
Figure 17: Shopping Facilities
§ §
10% 10%
22%29%
6%10%
14%
25%
0%
20%
40%
60%
80%
100%
* 500 to 700 701 to 1,000 * 1,001 to2,000
2,001 to10,000
Town Size
Perc
ent "
Very
Goo
d" o
r "G
ood"
1994
2004
Figure 18: Jobs
§ §

LOCAL PATRONAGE PATTERNS
For a variety of reasons, many residents of Iowa’s small towns rely on neighboring cities for services. However, the ability to meet one’s needs locally is an important component of the quality of life for a town’s residents. Therefore, residents were asked whether they obtained a variety of services mostly lo-cally or mostly outside of the community. Figures 19 through 24 show the percentage of residents who reported using six different services and amenities mostly in their home communities for each town size group.
8
The impact of town size on the per-centage of residents who reported shopping for daily needs in their home communities is shown in Fig-ure 19. Not surprisingly, the highest percentage of residents in both years who said that they shop for daily needs in their communities lived in the largest towns, followed by those in the 1,001 to 2,000 town size group. In the smallest towns, only 14 percent of residents shopped locally for their daily needs in 2004, down substan-tially from 25 percent in 1994. Simi-larly, the percentage of residents who reported shopping for daily needs lo-cally dropped in towns between 701 and 2,000 in population.
Figure 20 shows the percentage of residents in 1994 and 2004 who said they shop for “big ticket” items in their home communities. For both years, hardly any residents in the smallest towns shopped for “big ticket” items locally, and very few did so in the towns between 701 and 1,000 residents. Twice as many resi-dents in the largest communities re-ported shopping locally for big ticket items than did so in the towns be-tween 1,001 and 2,000. However, the smallest communities and both groups of larger towns experienced a significant decline in the percentage of residents who shopped locally for “big ticket” items between 1994 and 2004.
80%
53%
40%
25%
77%
48%
32%
14%
0%
20%
40%
60%
80%
100%
* 500 to 700 * 701 to1,000
* 1,001 to2,000
2,001 to10,000
Town Size
Perc
ent S
elec
ting
"Loc
al"
1994
2004
Figure 19: Shopping for Daily Needs
§ §
2% 5%11%
25%
1% 4% 7%
21%
0%
20%
40%
60%
80%
100%
* 500 to700
701 to1,000
* 1,001 to2,000
* 2,001 to10,000
Town Size
Perc
ent S
elec
ting
"Loc
al"
1994
2004
Figure 20: Shopping for Big Ticket Items
§ §

As with shopping, size of town im-pacts residents’ local use of primary health care services. Although there were no significant changes between 1994 and 2004, the percentage of resi-dents indicating local use of primary health care varied from about two-thirds for the largest towns to roughly one in ten for the smallest towns (see Figure 21). Approximately one-fifth of residents in towns with 701 to 1,000 residents sought primary health care locally, while just over 40 percent did so in towns between 1,001 and 2,000 in population.
The percentage of residents who reported staying in their commu-nities for recreation and enter-tainment in 1994 and 2004 is shown in Figure 23. As with shopping and primary health care, the percentage of residents who remained in town for rec-reation and entertainment is greatest in the largest communi-ties. This pattern occurred in both 1994 and 2004. Addition-ally, local use of recreation and entertainment declined for towns under 2,000.
9
Patterns of local use of specialized health care services were similar to those for shopping for big ticket items. Hardly any residents in towns under 1,000 used specialized health care services in their home commu-nities in either 1994 or 2004 (see Figure 22). Slightly more residents obtained specialized health care lo-cally in towns from 1,001 to 2,000 residents. In the largest towns, local use of specialized health care actu-ally increased, from 11 percent in 1994 to 19 percent in 2004.
67%
44%
19%13%
70%
43%
17%11%
0%
20%
40%
60%
80%
100%
500 to 700 701 to1,000
1,001 to2,000
2,001 to10,000
Town Size
Perc
ent S
elec
ting
"Loc
al"
1994
2004
Figure 21: Primary Health Care
§ §
11%6%2%2%
19%
8%1%1%
0%
20%
40%
60%
80%
100%
500 to 700 701 to 1,000 1,001 to2,000
* 2,001 to10,000
Town Size
Perc
ent S
elec
ting
"Loc
al"
19942004
Figure 22: Specialized Health Care
§ §
22%18%
27%35%
15% 17%23%
38%
0%
20%
40%
60%
80%
100%
* 500 to 700 * 701 to 1,000 * 1,001 to2,000
2,001 to10,000
Town Size
Perc
ent S
elec
ting
"Loc
al"
19942004
Figure 23: Recreation/Entertainment
§ §

SUMMARY: TOWN SIZE QUALITY OF LIFE For the most part, residents in all sizes of towns were pleased with the quality of local government ser-vices in both 1994 and 2004—indeed, ratings for overall quality even increased for all town size groups. There were a few exceptions, however. Ratings for public schools decreased over the decade in the smallest towns, and received fewer positive ratings in both years when compared to the larger towns. Similarly, about one third of residents in the smallest towns were pleased with local police protection in both 1994 and 2004, compared to over half in the other three town size groups. Ratings for non-government services were much lower than those for government services across all town size groups. Residents ratings of the overall quality of non-government services declined substan-tially over the decade for all town sizes, with the steepest declines occurring in the groups of towns with fewer than 1,000 residents. Again, there were exceptions. Ratings for the quality of local housing in-creased over the decade for all groups of towns. Residents’ assessments of local child care increased for the three groups of towns between 701 and 10,000 in population size. For most of the non-government services, positive assessments of quality increased with town size in that more favorable ratings were given by residents in larger communities than in smaller towns. There are also differences in the local use of services and amenities due to town size. In both 1994 and 2004, residents in the larger towns were more likely than those in smaller towns to attend church, shop, recreate, and obtain health care in their communities. However, local church attendance declined over the decade in all town size groups. Additionally, fewer residents in 2004 reported shopping for daily needs or recreating locally than did so in 1994 in the groups of towns under 2,000 in population. The percentage of residents who shopped for “big ticket” items locally declined over the decade for the small-est towns and those with more than 1,001 residents. Interestingly, local use of specialized health care increased in the largest towns.
10
Figure 24 shows the percentage of residents in 1994 and 2004 who re-ported attending church or a place of worship in their community by town size. Local church attendance de-clined across all town size groups, with the largest declines occurring in the towns under 1,000. Additionally, there were differences across town size groups. In both 1994 and 2004, local church attendance was lower in the smallest towns than it was in the towns with over 1,000 residents. There was no significant difference in local church attendance between the three groups of larger towns.
72% 75%79%
62%
50%
60%65%
71%
0%
20%
40%
60%
80%
100%
* 500 to 700 * 701 to1,000
* 1,001 to2,000
* 2,001 to10,000
Town Size
Perc
ent S
elec
ting
"Loc
al"
1994
2004
Figure 24: Attending Church or Other Place of Worship
§ §

THE SOCIAL ENVIRONMENT AND TOWN SIZE
I n spite of the frequently publicized economic challenges faced by many of Iowa’s small towns, they are often praised for having favorable social climates. Accordingly, a goal of this project has been
to determine the extent to which Iowa’s small communities possess favorable social environments. Does the size of a town impact the local social environment? The next several pages show residents’ assessments of different aspects of the social climate in Iowa’s small towns and how those assessments vary by town size.
Residents were presented with a list of social qualities and asked to evalu-ate their towns on each quality using a 1 to 7 scale. Figures 25 through 31 show the average ratings given to each quality in 1994 and 2004 by town size. Average ratings for friendliness are displayed in Figure 25. Ratings in 1994 are lower in the largest towns compared to all three groups of smaller towns; in 2004, the largest towns differed only from the smallest towns. In the town size groups be-tween 701 and 2,000 in population, ratings for friendliness declined dur-ing the period from 1994 to 2004.
Figure 26 shows the aver-age ratings for safety. In 1994, ratings were higher for towns with 701 to 1,000 residents than for the largest towns, but no differences in safety rat-ings existed in 2004. In all groups, however, the average ratings for safety declined over the decade.
11
5.35
5.42
5.57
5.62
5.36
5.59
5.71
5.64
1 2 3 4 5 6 7
2,001 to10,000
* 1,001 to2,000
* 701 to 1,000
500 to 700
Tow
n Si
ze
Average Rating
1994
2004
Figure 25: Friendliness
§ §
5.28
5.31
5.44
5.31
5.61
5.68
5.87
5.69
1 2 3 4 5 6 7
* 2,001 to10,000
* 1,001 to 2,000
* 701 to 1,000
* 500 to 700
Tow
n Si
ze
Average Rating
1994
2004
Figure 26: Safety
§

Figure 29 shows the average rat-ings for residents’ assessments of the extent to which their towns were “supportive”. Ratings are significantly lower for the largest towns when compared to the 701 to 1,000 town size group in 1994; in 2004, there was no difference in ratings for supportiveness between the town size groups. Compared to 1994, there has been a decline in ratings for supportiveness in the groups of towns with 701 to 2,000 residents.
12
Residents’ evaluations of the extent to which their communities were “well-kept” in 1994 and 2004 are shown in Figure 28. Although there were no significant differences in av-erage ratings due to town size, resi-dents in all town size groups felt their towns were less well-kept in 2004 when compared to 1994.
Average ratings for the extent to which residents felt their commu-nity was trusting are shown in Fig-ure 27. As with safety, 2004 rat-ings for trust declined for all town size groups when compared to 1994. There were no differences between town size groups in resi-dents assessments of the trusting nature of their communities in 2004, but in 1994, average ratings for trust were higher in the 701 to 1,000 group when compared to the largest communities.
5.06
5.04
5.13
4.87
5.32
5.37
5.53
5.11
1 2 3 4 5 6 7
* 2,001 to10,000
* 1,001 to2,000
* 701 to 1,000
* 500 to 700
Tow
n Si
ze
Average Rating
1994
2004
Figure 28: Appearance
4.86
4.91
5.06
5.00
4.98
5.18
5.35
5.14
1 2 3 4 5 6 7
* 2,001 to10,000
* 1,001 to2,000
* 701 to 1,000
* 500 to 700
Tow
n Si
ze
Average Rating
1994
2004
Figure 27: Trust
§
4.69
4.76
4.88
4.88
4.77
4.98
5.09
4.93
1 2 3 4 5 6 7
2,001 to10,000
* 1,001 to2,000
* 701 to 1,000
500 to 700
Tow
n Si
ze
Average Rating
1994
2004
Figure 29: Supportiveness
§

Residents’ assessments of the extent to which their towns are “tolerant” are shown in Figure 30. In 2004, residents in the smallest towns as-signed higher ratings to tolerance than did those in the largest towns. There were no differences between the other town size groups in 2004 or between any of the town size groups in 1994. Interestingly, there was an increase in residents’ assessments of tolerance in the smallest communities from 1994 to 2004—ratings in the other town size groups did not change significantly.
Figure 31 shows the average ratings residents gave to their community’s “openness to new ideas” in 1994 and 2004. As with tolerance, resi-dents in the smallest towns gave higher ratings to their town’s open-ness to new ideas than did residents of the largest towns in 2004. Rat-ings did not differ significantly be-tween town size groups in 1994. Further, ratings for openness to new ideas declined over the decade for all but the smallest towns.
13
4.30
4.39
4.47
4.30
4.36
4.34
4.34
4.28
1 2 3 4 5 6 7
2,001 to10,000
1,001 to 2,000
701 to 1,000
* 500 to 700
Tow
n Si
ze
Average Rating
1994
2004
Figure 30: Tolerance
§
4.05
4.14
4.18
4.25
4.33
4.45
4.47
4.38
1 2 3 4 5 6 7
* 2,001 to10,000
* 1,001 to2,000
* 701 to 1,000
500 to 700
Tow
n Si
ze
Average Rating
1994
2004
Figure 31: Openness to New Ideas
§

COMMUNITY ATTACHMENT
Community attachment refers to the extent local residents feel happy in and a part of their community. Residents who are “attached” to their towns are more likely to be interested in what happens locally and are more likely to partici-pate in community events or volunteer for local projects. Does the size of a town in-fluence community attach-ment? Figure 32 shows that the vast majority of resi-dents in all town sizes felt at home in their communities in both 1994 and 2004. However, in towns with 701 to 2,000 residents, the per-centage of residents who said that they feel at home declined over the decade.
Further, over three fourths of resi-dents in both years and in all town sizes said that they would be sorry to leave if they had to move away (see Figure 33). However, fewer resi-dents in all groups of towns ex-pressed this sentiment in 2004 when compared to 1994. Town size does not appear to greatly influence community attachment—residents in all town sizes were about equally attached to their com-munities. However, there was a de-cline in community attachment be-tween 1994 and 2004, particularly for communities between 701 and 2,000 in population.
14
93%
92%
92%
92%
93%
94%
95%
93%
0% 20% 40% 60% 80% 100%
2,001 to 10,000
* 1,001 to 2,000
* 701 to 1,000
500 to 700
Tow
n Si
ze
Percent
19942004
Figure 32: Residents Who “Feel at Home”
77%
75%
78%
75%
81%
83%
82%
78%
0% 20% 40% 60% 80% 100%
* 2,001 to10,000
* 1,001 to2,000
* 701 to 1,000
* 500 to 700
Tow
n Si
ze
Percent
1994
2004
Figure 33: Residents Who Would Be “Sorry to Leave”

38%
54%
60%
55%
36%
59%
67%
61%
0% 20% 40% 60% 80% 100%
2,001 to 10,000
* 1,001 to 2,000
* 701 to 1,000
* 500 to 700
Tow
n Si
ze
Percent
1994
2004
Figure 34: Know Half or More Residents By Name
§ §
15
SOCIAL CAPITAL
A n important feature of a local social environment is called “social capital”. Social capital is a term that refers to the relationships among residents—that is, how much local residents know and trust
one another. There are two main components of social capital: social ties and trust. Social ties are the connections among residents—acquaintanceships, friendships, and family relations. Trust refers to the extent to which local citizens trust each other, even those they do not know personally. A community rich in social capital will usually have an easier time accomplishing goals and making decisions. For example, recruiting volunteers for a local festival or fundraising for the local fire department is much easier in a town where people know and trust each other than in places where this is not the case. Because of these important implications for communities, we wanted to know more about the extent of social capital in Iowa’s small towns. The following pages show how social capital varies by town size and how it has changed since 1994.
SOCIAL TIES
Figure 34 shows the percentage of residents who said they know half or more of the other people in their towns. This percentage was significantly smaller in the largest communities than in the other three town size groups in both 1994 and 2004. Further, the extent to which residents know each others’ names has declined significantly over the ten-year period in those towns with 500 to 2,000 residents, and remained stable in the largest communities.
The percentage of residents who reported that half or more of their friends live locally is shown in Figure 35. In both 1994 and 2004, residents in the two groups of lar-ger communities reported having more local friends than those in the smallest communities. Addition-ally, local friendships declined over the decade for residents in the three groups of towns under 2,000 in population.
59%
54%
49%
41%
58%
57%
55%
45%
0% 20% 40% 60% 80% 100%
2,001 to 10,000
* 1,001 to 2,000
* 701 to 1,000
* 500 to 700
Tow
n Si
ze
Percent
19942004
Figure 35: Half or More of Friends Live in Community
§
§

Figure 36 shows the percentage of residents who said that half or more of their adult relatives and in-laws live in town. As with lo-cal friends, the extent of local relatives has decreased over the decade for residents in all but the group of largest towns. Further, residents in the largest communi-ties reported having significantly more local relatives than did those in the two groups of smallest towns in 2004. There were no significant differences between town size groups in 1994.
16
TRUST
During the 1990’s, research showed a general erosion in the amount of trust Americans have in insti-tutions and each other. For this reason, a series of questions was added in 2004 to measure trust in Iowa’s small towns. Figure 37 shows the percentage of residents who said they trust a variety of oth-ers “almost always” or “most of the time”. For the most part, residents in all town sizes trust local people and authorities—even those they do not know personally. However, residents in the largest towns reported less trust in local public officials than did those in the other town size groups.
27%
22%
21%
17%
26%
26%
25%
21%
0% 20% 40% 60% 80% 100%
2,001 to10,000
* 1,001 to2,000
* 701 to 1,000
* 500 to 700
Tow
n Si
zePercent
1994
2004 §
Figure 36: Half or More Relatives Live in Community
Figure 37: Trust in Local Authorities and Institutions
63%
93%
60%
61%
70%
81%
86%
93%
92%
81%
60%
66%
67%
75%
86%
92%
92%
61%
69%
80%
87%
93%
58%
61%
64%
80%
92%
91%
0% 20% 40% 60% 80% 100%
Trust Local People YouDon't Know Personally
Trust New Residents
Trust Local Teenagers
Trust Local PublicOfficials
Trust Local Police
Trust Neighbors
Trust Store Workers
Percent
500-700
701-1,0001,001-2,000
2,001-10,000
Trust Store Workers
Trust Neighbors
Trust Local Police
§ Trust Local Public Officials
Trust Local Teenagers
Trust New Residents
Trust Local People You Don’t Know
Personally

SUMMARY: SOCIAL ENVIRONMENT AND TOWN SIZE Overall, a favorable social environment still exists for Iowa’s small towns of all sizes. Although still relatively high in 2004, ratings for safety, trust, and appearance declined for all town size groups when compared to 1994. Ratings for friendliness and supportiveness also decreased in towns with 701 to 2,000 residents, while ratings for openness to new ideas declined in all but the smallest towns. Further, residents in the largest communities rated their towns as less friendly than did those in the smallest towns in both 1994 and 2004, while in 2004 residents in the smallest towns assigned higher ratings to tolerance and openness to new ideas. In 1994, ratings for safety, trust, and supportiveness were higher in the 701 to 1,000 town size group than in the largest towns. Community attachment did not vary substantially due to town size, although it did decline over the dec-ade, especially in towns with 701 to 2,000 residents. Overall, the extent of social ties declined since 1994 in Iowa’s towns with fewer than 2,000 residents. In 2004, residents in these three groups of towns reported knowing fewer other residents by name and having fewer local friends or relatives when compared to 1994. Interestingly, the extent of social ties did not change significantly for the largest communities. However, there were differences across town sizes. Fewer residents in the larg-est communities said they know half or more other residents by name when compared to the other town size groups. But, more residents in the larger towns reported having local friends and relatives. In 2004, the vast majority of residents in all town size groups said they trusted their neighbors and workers in local stores. However, compared to other town size groups, residents in the largest commu-nities reported less trust in local public officials.
17

COMMUNITY INVOLVEMENT AND TOWN SIZE Community involvement is an important feature of small towns. Many local accomplishments depend on local citizen’s willingness to volunteer their time on behalf of community goals. Citizens can get involved in their communities in formal ways, through local organizations and planned projects, and in informal ways, such as donating money to a fundraiser or participating in a spring clean-up. The trend in current times is for citizens to be less involved in their communities. This decline in “civicness” makes it more difficult for local communities to accomplish goals. The following six pages present the patterns of community involvement among residents of Iowa’s small towns of different sizes.
18
There are a variety of types of organi-zations present in many communities, ranging from church-related groups to those with a political or civic focus. Figures 39 through 43 show how mem-bership in these types of groups varied by town size in 1994 and 2004. Mem-bership in church-related organizations remained stable over the decade (see Figure 39). And, there were no signifi-cant differences in membership be-tween town size groups in 1994. How-ever, in 2004, membership in church related groups was significantly lower in the smallest towns than in the largest towns.
Local organizations play a key role in bringing people together to facilitate activities of various types. These or-ganizations sponsor fund-drives or lead the planning and implementation of events. The ability of local organi-zations to facilitate local action de-pends, to some degree, upon the will-ingness of the local citizenry to join organizations and actively participate in them. Figure 38 shows the per-centage of residents who reported be-longing to at least one organization in 1994 and 2004. In both years, fewer residents belonged to organizations in the smallest towns compared to the other groups of towns, where roughly two-thirds of residents reported belonging to a local group. Additionally, the percentage of residents who said they belong to local organizations declined from 1994 to 2004 in all but the largest towns.
60%68% 70% 69%
55%64% 65% 69%
0%
20%
40%
60%
80%
100%
* 500-700 * 701-1,000 * 1,001-2,000
2,001-10,000
Town Size
Perc
ent
1994
2004
Figure 38: Membership in Local Organizations
§ §
53%61% 62% 61% 62%59% 60%
52%
0%
20%
40%
60%
80%
100%
500-700 701-1,000 1,001-2,000 2,001-10,000
Town Size
Perc
ent W
ho A
re M
embe
rs
1994
2004 §
Figure 39: Membership in Church-Related Organizations

19
Membership in recreational groups declined over the dec-ade in all town size groups (see Figure 40). Additionally, the percentage of residents who belonged to recreational groups was significantly lower in the smallest towns when compared to the two groups of towns with more than 1,000 residents in both 1994 and 2004.
Figure 41 shows the percentage of residents who reported belonging to political and civic groups in 1994 and 2004. There are no significant differences in membership between town size groups—roughly one-fourth of residents reported belong-ing to political and civic groups in both years across all town sizes. However, there was a decline in membership for the smallest and largest communities over the ten year period.
Membership in job-related or-ganizations has declined over the period from 1994 to 2004 for all town size groups (see Figure 42). Additionally, in both years, more residents in the largest communities belonged to job-related organizations than did in the towns under 2,000 in population.
29%34% 35% 35% 32%30%27%
23%
0%
20%
40%
60%
80%
100%
* 500-700 * 701-1,000 * 1,001-2,000 * 2,001-10,000
Town SizePe
rcen
t Who
Are
Mem
bers
1994
2004
Figure 40: Membership in Recreational Groups
§ §
27%20%18%16%
22%17%16%13%
0%
20%
40%
60%
80%
100%
* 500-700 * 701-1,000 * 1,001-2,000 * 2,001-10,000
Town Size
Perc
ent W
ho A
re M
embe
rs
1994
2004
§ §
Figure 42: Membership in Job Related Organizations
27% 26% 26% 29% 26%26%25%23%
0%
20%
40%
60%
80%
100%
* 500-700 701-1,000 1,001-2,000 * 2,001-10,000
Town Size
Perc
ent W
ho A
re M
embe
rs
1994
2004
Figure 41: Membership in Political and Civic Groups

20
PARTICIPATION IN COMMUNITY PROJECTS
While membership in local organizations is an important feature of small towns, of ut-most importance is the extent to which the local citizenry is actively involved in the community, particularly to the extent of be-ing willing to participate in the completion of local projects. Figure 44 shows the percent-age of residents in each town size group who reported participating in a community im-provement project in 1994 and 2004. No sig-nificant changes in participation in a local project occurred over the decade for any town size group, nor were there any differ-ences in participation between town size groups.
The percentage of residents who de-scribed themselves as “somewhat” or “very” active in community activities and events is shown in Figure 45. In 1994, residents in the middle two groups of towns reported more “activeness” than those in the largest towns, while in 2004, only the 701 to 1,000 and the 2,001 to 10,000 town size groups differed significantly. The percentage of residents who de-scribe themselves as active in the community declined over the ten-year period for all town size groups.
As with job-related organizations and political and civic groups, mem-bership in service and fraternal or-ganizations declined over the decade in all town size groups (see Figure 43). In 2004, there were no signifi-cant differences between town size groups, while in 1994, more resi-dents reported belonging to service and fraternal organizations in the largest communities when compared to the 701 to 1,000 town size group.
48%52% 53% 49%50%
55% 53% 52%
0%
20%
40%
60%
80%
100%
500-700 701-1,000 1,001-2,000
2,001-10,000
Town Size
Perc
ent
1994
2004
Figure 44: Project Participation
38%45%47%
42%
32%35%39%36%
0%
20%
40%
60%
80%
100%
* 500-700 * 701-1,000 * 1,001-2,000
* 2,001-10,000
Town Size
Perc
ent S
elec
ting
"Som
ewha
t" o
r "Ve
ry"
Act
ive
1994
2004
§ §
Figure 45: Level of “Activeness”
17% 16% 19% 20%13% 14% 16% 15%
0%
20%
40%
60%
80%
100%
* 500-700 * 701-1,000 * 1,001-2,000
* 2,001-10,000
Town Size
Perc
ent W
ho A
re M
embe
rs
1994
2004
Figure 43: Membership in Service and Fraternal Organizations
§

Because community involvement is so important to the success or failure of many local projects, we wanted to know more about the reasons people do not get involved. Therefore, residents in 2004 were asked to tell us whether or not a variety of factors served to limit their involvement in community im-provement projects. Figure 46 shows the reasons residents in the different town size groups reported not volunteering in their communities.
LIMITATIONS TO COMMUNITY INVOLVEMENT
Not surprisingly, a majority of residents in all town size groups reported that a lack of time limits their involvement in community improvement projects, although this percentage is highest in the largest com-munities. About four in ten residents in all groups said they had not been asked to volunteer. Just over one fourth of residents in the towns under 2,000 in population indicated that they did not know how to become involved, compared with 30 percent in the largest communities. Lack of interest in participating was mentioned by about one quarter of residents in all town size groups as a factor that limits their in-volvement. Twenty-one percent of residents in the smallest towns and 24 percent in the other town size groups felt that they lacked the skills necessary to participate in local projects. Twenty-two percent of residents in the smallest towns reported that there were no projects that needed volunteers in their com-munities, which is significantly higher than the 16 percent occurring in the largest communities. Finally, 14 percent of residents in the smallest towns and 17 percent in the other town size groups said that they tried to help out with a local project, but their help was not accepted.
21
Figure 46: Reasons for Lack of Involvement in Community Projects (2004 Only)
17%
16%
24%
27%
30%
39%
17%
19%
24%
28%
28%
40%
17%
21%
24%
27%
28%
40%
60%
14%
22%
21%
25%
27%
38%
58%
62%58%
0% 20% 40% 60% 80% 100%
Help Was Not Accepted
No Community ProjectThat Needed Volunteers
Don't Have Skills
No Interest inParticipating
Don't Know How toBecome Involved
Not Asked to Volunteer
Don't Have Time to GetInvolved
Percent
500-700
701-1,000
1,001-2,000
2,001-10,000
§ Don’t Have Time To Get Involved
Not Asked to Volunteer
Don’t Know How to Become Involved
No Interest in Participating
Don’t Have Skills
§ No Community Projects That Needed Volunteers
Help Was Not Accepted

INFORMAL COMMUNITY INVOLVEMENT
A majority of residents in all town size groups believed that most other people in town would volunteer to stop watering their lawns during a water shortage or provide assistance during the aftermath of a tor-nado, although these percentages were lowest in the largest towns. In all town size groups, slightly fewer than half felt that fellow residents would provide donations of canned food for the needy in their towns. Approximately one fourth of residents in the 701 to 10,000 town size groups reported that most other citizens would donate money to sustain a locally owned grocery store, while 20 percent expressed that belief in the smallest towns. Seventeen percent of residents in the largest towns felt that most local citizens would volunteer their assistance in community-wide clean-up efforts, which was significantly less than the one fourth of residents in the towns under 2,000 in population who felt this way. As for volunteering to deliver meals to the elderly, about one in five residents in all town size groups reported that most other local citizens would help out in this way.
Community involvement is not limited to participation in formal organizations or projects. A citizen can be civic by doing a wide variety of activities that help out the local community. Figure 47 shows the percentage of residents in the different town size groups who believe that “most” other residents in their communities would volunteer their assistance in a variety of situations.
22
21%21%
26%
22%
25%
25%
49%
71%
20%
26%
20%
46%
69%
74%
45%
17%
24%
61%
68%
47%
23%
66%
72%72%
0% 20% 40% 60% 80% 100%
Deliver Meals to Elderly
Volunteer for Spring Clean-Up
Donations for Grocery Store
Donations for Needy
Volunteer for TornadoClean-Up
Stop Watering Law ns
500-700
701-1,000
1,001-2,000
2,001-10,000
§ Volunteer to Stop Watering During a Water Shortage
§ Volunteer Assistance in the Aftermath of a Tornado
Donations of Canned Food for the Needy
Donations to Sustain a Locally Owned Grocery
§ Volunteer Assistance in Community-Wide Clean-Up
Volunteer to Deliver Meals to the Elderly
Figure 47: Helping Behaviors Among Town Residents (2004 Only)
Percent Saying “Most” Residents Would Volunteer

Overall, community involvement in Iowa’s small towns has declined over the period from 1994 to 2004. But there are variations in community involvement across the town size groups. The percentage of residents who reported belonging to at least one local organization was lowest in the smallest towns and declined between 1994 and 2004 for all but the largest towns. Member-ship in most types of organizations also declined, and was lower in the smallest communities for church-related groups in 2004, for recreational groups and job-related organizations in both years, and for service and fraternal organizations in 1994. The percentage of residents who reported participating in a local community project did not change significantly for any town size group between 1994 and 2004, nor were there any sig-nificant differences between town sizes. Residents in all town size groups described themselves as less active in their communities in 2004 when compared to 1994, but those in the 701 to 1,000 group reported a greater level of “activeness” than those in the largest communities. Factors that limited residents’ community involvement in 2004 did not vary a great deal by town size, although residents in the largest towns were more likely to cite lack of time, but less likely to say there were no local projects that required volunteers. Finally, when compared to other towns, fewer residents in the largest communities felt that other local citizens would stop watering during a water shortage, help out in the aftermath of a tornado, or assist in a commu-nity-wide clean up.
SUMMARY: COMMUNITY INVOLVEMENT
23

T he state of the local economy has a significant impact on all aspects of community life. A community with a thriving economic sector will have a greater ability to provide residents
with services and amenities than one experiencing economic downturns. But, what happens when a town is faced with a sudden challenge to its economy? We sought to answer this question by studying towns that have experienced “economic shocks,” which are defined as relatively sudden events that have an impact on a community’s economy. To identify the significant economic events, we contacted five to eight community leaders in each of the 99 towns and asked them to list all the events occurring from 1990 through 2003 that had a significant impact on the local economy. They were also asked to rate the impact of the event on a one-to-five scale, to tell us whether the event was positive or negative for the community, and whether it was locally planned or externally generated. Those events mentioned by at least two persons and having a minimum average rating of 2.0 on the one-to-five scale of significance are designated as economic shocks. In this report, we are showing our results about the differences in types and qualities of economic shocks experienced by Iowa’s towns of different sizes.
TOWN SIZE AND ECONOMIC SHOCKS
24
Of the 152 economic shocks identified by re-spondents, 21 percent occurred in the smallest towns, 19 percent in the town with 701 to 1,000 residents, and 30 percent in each of the groups of larger communities. Additionally, some com-munities experienced multiple shocks while others did not have any. Figure 48 shows the number of shocks occur-ring in each of the town size groups. Differences
by town size are evident—larger communities are more likely to experience multiple shocks than are smaller communities. Additionally, more of the smaller towns reported no shocks when com-pared to the larger towns.
56%
48%
27%
32%
28%
33%
41%
32%
16%
19%
32%
36%
0% 20% 40% 60% 80% 100%
2,001-10,000
1,001-2,000
701-1,000
500-700
Tow
n Si
ze
Percent of Communities
Zero Shocks
1 Shock
2+ Shocks
Figure 48: Number of Shocks by Town Size
§
§
We grouped the shocks into seven categories and examined whether towns of different sizes are more or less likely to experience shocks of particular types. Categories included changes to lo-cal businesses (such as business openings/expansions or closures/downsizing), changes to gov-ernment services (such as improvements to local infrastructure), housing development, changes to non-government services and local amenities, school related changes (openings, closures, or consolidations), and natural disasters.
TYPES OF ECONOMIC SHOCKS BY TOWN SIZE
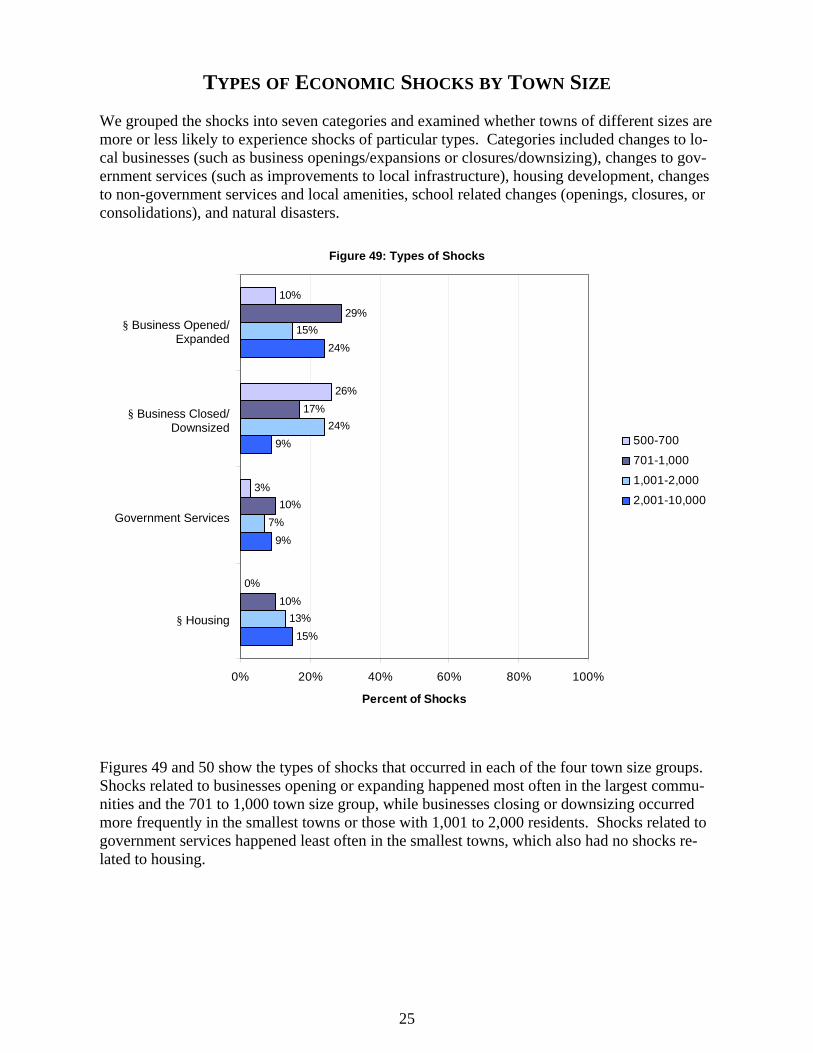
25
Figures 49 and 50 show the types of shocks that occurred in each of the four town size groups. Shocks related to businesses opening or expanding happened most often in the largest commu-nities and the 701 to 1,000 town size group, while businesses closing or downsizing occurred more frequently in the smallest towns or those with 1,001 to 2,000 residents. Shocks related to government services happened least often in the smallest towns, which also had no shocks re-lated to housing.
Figure 49: Types of Shocks
15%
9%
9%
24%
13%
7%
24%
15%
10%
10%
17%
29%
0%
3%
26%
10%
0% 20% 40% 60% 80% 100%
Housing
Government Services
BusinessClosed/Downsized
BusinessOpened/Expanded
Percent of Shocks
500-700
701-1,000
1,001-2,000
2,001-10,000
§ Business Opened/
Expanded
§ Business Closed/Downsized
Government Services
§ Housing

26
Changes to non-government services and amenities comprised about one-third of the shocks in the largest communities, while roughly one in ten occurred in the other town size groups. Con-versely, smaller communities were more likely to experience shocks related to schools than were larger towns. Shocks resulting from natural disasters also occurred more often in the smallest towns.
Figure 50: Types of Shocks (cont.)
4%
4%
4%
30%
2%
9%
17%
13%
7%
7%
14%
7%
3%
16%
23%
10%
0% 20% 40% 60% 80% 100%
Other
Disasters
Schools
Non-GovernmentServices/Amenities
Percent of Shocks
500-700
701-1,000
1,001-2,000
2,001-10,000
§ Non-Government Services/Amenities
§ Schools
Disasters
Other

Economic shocks can origi-nate from within the com-munity, such as efforts to attract businesses or plans for a new park, or from forces outside the commu-nity, such as with a natural disaster or unfunded state mandate. Figure 51 shows the percentage of shocks that were internal or exter-nal in origin by town size. Over half of the shocks in all town size groups origi-nate from within the com-munity.
Economic shocks can also have positive or negative impacts on a town’s econ-omy. The percentage of shocks deemed positive or negative by respondents as related to town size are shown in Figure 52. There is a dramatic difference be-tween town sizes. The vast majority of shocks in the largest towns had a positive effect on the local economy, while over half of the shocks in the smallest towns had a negative effect.
ORIGIN AND IMPACT OF ECONOMIC SHOCKS BY TOWN SIZE
27
57%55%
65%61%
39%44%45%
35%
0%
20%
40%
60%
80%
100%
500-700 701-1,000 1,001-2,000 2,001-10,000
Town Size
Perc
ent o
f Sho
cks
Internal
External
Figure 51: Shocks of Internal or External Origin
87%
67%62%
45%
55%
38%
13%
33%
0%
20%
40%
60%
80%
100%
500-700 701-1,000 1,001-2,000 2,001-10,000
Town Size
Perc
ent o
f Sho
cks
Positive
Negative
Figure 52: Positive or Negative Shocks
§ §

NET SHOCK SIGNIFICANCE
How do economic shocks affect small towns, and do they affect smaller towns differently than larger towns? Experiencing several small shocks within a span of 13 years may have as much impact on the local economy and community quality of life as experiencing one major one. Ad-ditionally, communities may experience shocks with both positive and negative impacts. To take the “summative” impact of multiple shocks into account, we created an indicator of “shock significance” by adding together the significance scores assigned to all the shocks experienced by each town. Significance scores for negative shocks were given a negative sign so that for towns experiencing both positive or negative shocks, we could roughly estimate the net effect of both positive and negative shocks. The shock significance scores for individual communities ranged from –7.2 to 16.9. Because the significance of individual shocks was scored from 1 to 5, a score of –7.2 indicates a town with at least two negative shocks during the study period. A shock significance score of 16.9 indicates that more than three positive shocks occurred in that town from 1990 to 2003.
Figure 53 shows the average net shock significance scores for the four town size groups. The largest communities had, on average, a much greater net positive shock significance than the other town size groups. Net shock significance was positive for the two groups of communities between 701 and 2,000 in population. However, for the 500 to 700 town size group, the net shock significance was negative, indicating that the combined effect of all shocks was generally negative for Iowa’s smallest communities.
28
-0.3
1.01.4
3.7
-1
0
1
2
3
4
5
Net
Sho
ck S
igni
fican
ce
Figure 53: Net Shock Significance §
500-700 701-1,000 1,001-2,000 2,001-10,000
Town Size

SUMMARY: TOWN SIZE AND ECONOMIC SHOCKS
While communities of all sizes experienced shocks, a greater number of economic shocks oc-curred in the larger communities, and larger communities were more likely to experience multi-ple shocks. The smallest towns were more likely than others not to experience an economic shock. There were also variations by town size in the types of shocks in the towns. Changes to local businesses comprised roughly 40 percent of the shocks in the towns under 2,000 in popu-lation, but only one-third of the shocks in the largest communities. More business closures or downsizings were reported in the smallest communities and in the 1,001 to 2,000 town size group, while business openings or expansions occurred more frequently in the other two groups of towns. No shocks related to housing development occurred in the smallest towns, while be-tween ten and fifteen percent of shocks in the other town size groups were related to housing. The largest towns were more likely than the others to have economic shocks related to non-government services and amenities, such as medical centers opening or closing or the develop-ment of a golf course. These towns were less likely, however, to experience changes to their local schools. In all town size groups, most economic shocks originated from within the community. How-ever, a larger percentage of shocks were internal in origin in the largest and smallest communi-ties. There was a dramatic difference in whether a shock was deemed positive or negative be-tween town size groups. Economic shocks in the larger communities were far more likely to have a positive effect on the local economy, while a majority shocks in the smaller towns had a negative effect according to respondents. This pattern held even when communities experi-enced multiple shocks.
29

APPENDIX 500 to 700 Population
Community County 1990 Population
2000 Population
% Population Gain/Loss
Agency Wapello 616 622 0.97%
Ainsworth Washington 506 524 3.56%
Albion Marshall 585 592 1.20%
Allerton Wayne 599 559 -6.68%
Batavia Jefferson 520 500 -3.85%
Bayard Guthrie 511 536 4.89%
Dumont Butler 705 676 -4.11%
Elgin Fayette 637 676 6.12%
Elk Horn Shelby 672 649 -3.42%
Elma Howard 653 598 -8.42%
Everly Clay 706 647 -8.36%
Fontanelle Adair 712 692 -2.81%
Grand Mound Clinton 619 676 9.21%
Hills Johnson 662 679 2.57%
Hopkinton Delaware 695 681 -2.01%
Hospers Sioux 643 672 4.51%
Moulton Appanoose 613 658 7.34%
Pacific Junction Mills 548 507 -7.48%
Quasqueton Buchanan 579 574 -0.86%
Radcliffe Hardin 574 607 5.75%
Sabula Jackson 710 670 -5.63%
Saint Charles Madison 537 619 15.27%
University Park Mahaska 598 536 -10.37%
Ventura Cerro Gordo 590 670 13.56%
What Cheer Keokuk 762 678 -11.02%
Average Population: 622.08 619.92
30
701 to 1,000 Population
Community County 1990 Population
2000 Population
% Population Gain/Loss
Afton Union 953 917 -3.78%
Albert City Buena Vista 779 709 -8.99%
Atkins Benton 637 977 53.38%
Bancroft Kossuth 857 808 -5.72%
Battle Creek Ida 818 743 -9.17%
Buffalo Center Winnebago 1081 963 -10.92%
Colo Story 771 868 12.58%
Correctionville Woodbury 897 851 -5.13%
Donnellson Lee 940 963 2.45%
Farmington Van Buren 655 756 15.42%
Fruitland Muscatine 511 703 37.57%
Garnavillo Clayton 727 754 3.71%
Gilbertville Black Hawk 748 767 2.54%
Graettinger Palo Alto 813 900 10.70%
Hartford Warren 768 759 -1.17%
Kanawha Hancock 763 739 -3.15%
Murray Clarke 731 766 4.79%
Neola Pottawattamie 909 845 -7.04%
Olin Jones 663 716 7.99%
Pomeroy Calhoun 762 710 -6.82%
Sheffield Franklin 1174 930 -20.78%
Wellsburg Grundy 682 716 4.99%
Average Population: 801.77 811.82
31

1,001 to 2,000 Population
Community County 1990 Population
2000 Population
% Population Gain/Loss
Anita Cass 1068 1049 -1.78%
Bedford Taylor 1528 1620 6.02%
Calmar Winneshiek 1026 1058 3.12%
Clarence Cedar 936 1008 7.69%
Columbus Junction Louisa 1616 1900 17.57%
Corning Adams 1806 1783 -1.27%
Epworth Dubuque 1303 1428 9.59%
George Lyon 1066 1051 -1.41%
Glidden Carroll 1099 1253 14.01%
Gowrie Webster 1028 1038 0.97%
Hamburg Fremont 1248 1240 -0.64%
Hartley O'Brien 1632 1733 6.19%
Lake Park Dickinson 996 1023 2.71%
Mapleton Monona 1294 1416 9.43%
Mediapolis Des Moines 1637 1644 0.43%
Monroe Jasper 1739 1808 3.97%
Montezuma Poweshiek 1651 1440 -12.78%
Mount Ayr Ringgold 1796 1822 1.45%
Nashua Chicasaw 1476 1618 9.62%
Nora Springs Floyd 1505 1532 1.79%
Pleasantville Marion 1536 1539 0.20%
Pocahontas Pocahontas 2085 1970 -5.52%
Saint Ansgar Mitchell 1063 1031 -3.01%
Traer Tama 1552 1594 2.71%
Villisca Montgomery 1332 1344 0.90%
Winfield Henry 1051 1131 7.61%
Woodward Dallas 1197 1200 0.25%
1380.22 1417.52 Average Population:
32
2,001 to 10,000 Population
Community County 1990 Population
2000 Population
% Population Gain/Loss
Albia Monroe 3870 3706 -4.24%
Altoona Polk 7242 10345 42.85%
Audubon Audubon 2524 2382 -5.63%
Bloomfield Davis 2580 2601 0.81%
Center Point Linn 1693 2007 18.55%
Chariton Lucas 4616 4573 -0.93%
Cherokee Cherokee 6026 5369 -10.90%
Clarinda Page 5104 5690 11.48%
Denison Crawford 6604 7339 11.13%
Eagle Grove Wright 3671 3712 1.12%
Estherville Emmet 6720 6656 -0.95%
Humboldt Humboldt 4438 4452 0.32%
Jefferson Greene 4292 4626 7.78%
Lamoni Decatur 2319 2444 5.39%
LeClaire Scott 2734 2847 4.13%
LeMars Plymouth 8454 9237 9.26%
Madrid Boone 2395 2264 -5.47%
Missouri Valley Harrison 2888 2992 3.60%
Northwood Worth 1940 2050 5.67%
Sac City Sac 2516 2368 -5.88%
Sibley Osceola 2815 2796 -0.67%
Waukon Allamakee 4019 4131 2.79%
Waverly Bremer 8539 8968 5.02%
Webster City Hamilton 7894 8176 3.57%
Williamsburg Iowa 2174 2622 20.61%
4322.68 4574.12 Average Population:
33