toxicologic evaluation of dichrostachys glomerata extract
TRANSCRIPT
Food and Chemical Toxicology 69 (2014) 120–131
Contents lists available at ScienceDirect
Food and Chemical Toxicology
journal homepage: www.elsevier .com/locate/ foodchemtox
Toxicologic evaluation of Dichrostachys glomerata extract: Subchronicstudy in rats and genotoxicity tests
http://dx.doi.org/10.1016/j.fct.2014.03.0450278-6915/� 2014 Elsevier Ltd. All rights reserved.
Abbreviations: ALP, alkaline phosphatase; ALT, alanine aminotransferase; AST,aspartate aminotransferase; BUN, blood urea nitrogen; FDA, food and drugadministration; GGT, gamma-glutamyl transferase; GLDH, glutamate dehydroge-nase; MCH, mean corpuscular hemoglobin; MCV, mean corpuscular volume;MNPCE, micronucleated polychromatic erythrocytes; NOAEL, no-observed-adverse-effect level; OECD, Organization for Economic Co-operation and Develop-ment; PCE, polychromatic erythrocytes.⇑ Corresponding author. Tel.: +1 772 299 0746; fax: +1 772 299 5382.
E-mail address: [email protected] (M.G. Soni).
Shil C. Kothari a, Prasad Shivarudraiah b, Suresh Babu Venkataramaiah b, Swapna Gavara b,Shri Natrajan Arumugam b, Madhu G. Soni c,⇑a Gateway Health Alliances Inc., 4769 Mangels Blvd, Fairfield, CA 94534, USAb Anthem Biosciences Pvt. Ltd., #49, Canara Bank Road, Bommasandra Industrial Area, Phase I, Hosur Road, Bangalore 560099, Karnataka, Indiac Soni and Associates Inc., 973 37th Place, Vero Beach, FL 32960, USA
a r t i c l e i n f o
Article history:Received 21 January 2014Accepted 29 March 2014Available online 5 April 2014
Keywords:Dichrostachys glomerataDietary supplementSafetyToxicity
a b s t r a c t
In western Cameroon, edible fruits and seeds from the plant Dichrostachys glomerata are commonly usedas spices. Extract from the fruit pods has been reported as a good natural source of antioxidants and mayprovide health benefits. The objective of the present study was to investigate potential adverse effects, ifany, of D. glomerata fruit pod extract (Dyglomera™) in a subchronic toxicity study and in genotoxicitystudies. In the toxicity study, Sprague Dawley rats (20/sex/group) were gavaged with D. glomerata extractat dose levels of 0, 100, 1000 and 2500 mg/kg body weight (bw)/day for 90-days. Dyglomera™ adminis-tration did not result in mortality or show treatmentrelated changes in clinical signs of toxicity, bodyweights, body weight gain or feed consumption. Similarly, no toxicologically significant treatment-related changes in hematological, clinical chemistry, urine analysis parameters, and organ weights werenoted. Macroscopic and microscopic examinations did not reveal treatment-related abnormalities. Muta-genic and clastogenic potentials as evaluated by Ames assay, in vitro and in vivo chromosomal aberrationtest and in vivo micronucleus test did not reveal any genotoxicity of the extract. The results of subchronictoxicity study supports the no-observed-adverse-effect level (NOAEL) for D. glomerata extract as2500 mg/kg bw/day, the highest dose tested.
� 2014 Elsevier Ltd. All rights reserved.
1. Introduction
Dichrostachys glomerata (Forssk.) also referred as D. cinerea andbelonging to the Leguminosae family (Mimosaceae), is a deciduoussmall tree or shrub from Senegal to Western Cameroon, andextending across Africa to Sudan, Uganda and Zaire and also foundin Asia and Australia. The plant produces edible fruits that aremostly elongated pods, fleshy, wooly, leathery or papery, contain-ing several seeds and splitting open in the majority of cases. Thepod is known as ‘‘dundu’’ in Hausa, ‘‘burli’’ in Fulani, ‘‘Kara’’ in Yor-uba and ‘‘ami ogwu’’ in Igbo. The dry dehiscent constricted fruit
pods of this plant are commonly used as spices in a traditionalsoup of the western provinces of Cameroon called ‘‘Nah po’’, con-sumed along with taro (Tchiegang and Mbougueng, 2005; Kuateet al., 2011).
In addition to its flavoring effects, the fruit and its preparationshave been reported to possess several beneficial properties such asantioxidant or free radical scavenging activity (Kuate, 2010; Kuateet al., 2010; Abdou Bouba et al., 2010), anti-hypertensive effectsand antibacterial effects (Fotie et al., 2004; Fankam et al., 2011).Based on the findings from in vitro and in vivo investigations,Kuate et al. (2010) reported antioxidant activity, along with LDLoxidation inhibiting property from the fruit extract of D. glomerata.The fruit extract has also been shown to reduce fasting serum glu-cose levels and lower glycosylated hemoglobin in experimentaldiabetic rats (Kuate, 2010). Given the growing interest and atten-tion on the roles of polyphenols and antioxidants in human health,several investigators studied the phenolic and other chemical con-stituents from D. glomerata fruit extract prepared by using solventssuch as hexane (Koudou et al., 1994), ethyl acetate (Fotie et al.,2004), and methanol (Abdou Bouba et al., 2010). In an efficacy
S.C. Kothari et al. / Food and Chemical Toxicology 69 (2014) 120–131 121
clinical trial with obese and obese/diabetic participants, dailyadministration of D. glomerata ground dried pods (400 mg) to nor-moglycemic obese groups and type-2 diabetic obese groups for8 weeks resulted in favorable changes in body weight, BMI, waistand hip circumference, body fat, blood pressure, blood cholesterol,triglycerides, glucose, and glycosylated hemoglobin (Kuate et al.,2011). The results of this study indicate that D. glomerata grounddried pod may reduce cardiovascular disease risk factors in obesenormoglycemic and obese type-2 diabetic human subjects.
Given the potential uses of D. glomerata fruit pod extract as adietary supplement, and lack of safety-related information, adverseeffects of Dyglomera™ were investigated in a long-term repeatdose toxicity study and in genotoxicity studies. In the repeat dosesubchronic toxicity study, a detailed assessment of the toxic poten-tials of a standardized ethanolic extract of D. glomerata extract(Dyglomera™) prepared from dried fruits of the plant whenadministered daily for 90-days via oral gavage to Sprague Dawleyrats was undertaken. The potential genotoxic effects of D. glomera-ta fruit extract were investigated in bacterial reverse mutationassay (Ames test) using Salmonella typhimurium strains, in vitromammalian chromosomal aberration assay in CHO-K1 cell line,in vivo chromosomal aberration study in rats, and in vivo mamma-lian erythrocyte micronucleus test in rats.
2. Materials and methods
2.1. Subchronic study
2.1.1. Study designThe study was performed in accordance with (A) FDA Redbook (2000): Chapter
IV.C.4.a Subchronic Toxicity Studies with Rodents, (B) Organization for EconomicCo-operation and Development (OECD) Principles of Good Laboratory Practices(1997), (C) The standard operating procedures at Anthem Biosciences and Bioneedsand as per the mutually agreed study plan with the Sponsor, and (D) The recom-mendation of the Committee for the Purpose of Control and Supervision of Experi-ments on Animals (CPCSEA) guidelines for laboratory animal facility published inthe gazette of India, December 15th 1998 (CPCSEA, 1998). Standard safety precau-tions were observed during the course of study. The study protocol (BIO-IAEC-219-10/04) was approved by the Institutional Animal Ethics Committee (IAEC) on 10thApril 2010.
2.1.2. Test itemDichrostachys glomerata fruit pod extract (Dyglomera™) used in the present
study was produced by Synthite Industries Ltd., Kerala, India at a ISO certified facil-ity that follows the HACCP protocols. The extract (Dyglomera™) is manufacturedaccording to current good manufacturing practices (cGMP). The fruit pods from D.glomerata plant are collected, dried and the powder is prepared by grinding. Thepowder is subjected to solvent (ethanol) extraction and insoluble material isremoved by filtration. The filtrate is subjected to concentration and desolvanizationprocess under vacuum. The concentrate is checked for polyphenols and spray driedfollowed by pulverization and sieving to conform to 80-mesh specifications. Thepreparation procedure assures a consistent and high-quality product.
The extract is standardized and well-characterized. The physical characteristicsand chemical specifications of the product are presented in Table 1. Dyglomera™ isa light-brown, non-fibrous powder with slightly nutty odor and taste. The powder ispartly (sparingly) soluble in water. The dry powder is standardized to contain 10%polyphenols. Batch-to-batch consistency and product identification are verified byIR-analysis and HPLC fingerprint techniques. The product is routinely assayed forcontaminants such as heavy metals, pesticide residues and microbial agents toensure that the product meets the established specifications for humanconsumption.
2.1.3. AnimalsSprague Dawley rats (Bioneeds, Laboratory Animals and Preclinical Services,
Bangalore, India), following examination by a veterinarian were used for the pres-ent study. The males and females were acclimatized for five and six days, respec-tively, to laboratory conditions. One hundred sixty rats were equally divided into4 groups (20/sex/group). The average age at the time of treatment was 6–7 weeksand the average weight (±20% variation) for males ranged from 110 to 128 g, whilefor females it ranged from 100 to 121 g. All animals were housed under standardlaboratory conditions and in accordance with CPCSEA (1998) guidelines. The ani-mals were fed with Nutrilab rodent feed (Provimi Animal Nutrition India Pvt.
Ltd., Bangalore, India) throughout the acclimatization and experimental period.All animals were provided with clean and potable drinking water in polypropylenewater bottles with stainless steel sipper tubes.
2.1.4. TreatmentThe rats divided into four groups were treated orally (gavage) once daily with D.
glomerata fruit pod extract (Dyglomera™) preparation at dose levels of 0 (Group I –vehicle control; distilled water), 100 (Group II – low dose), 1000 (Group III – middose), and 2500 (Group IV – high dose) mg/kg bw (dose volume 10 mL/kg) for 90consecutive days. The available historical use of D. glomerata pod as an edible fruitspice and also human clinical study indicates innocuous nature of the extract. Thedose selection for the study was based on these observations, intended maximumconsumption in humans and the preliminary dose range finding study of Dyglom-era™ in rats which was conducted prior to the main study. The 14-day dose-rangefindings study at dose levels 0, 100, 1000 and 2500 mg/kg bw/day revealed noadverse toxic effects in rats. Based on these observations, it was concluded thatthe test item Dichrostachys glomerata extract administered to Sprague Dawley Ratsby oral gavage was non-toxic at doses up to 2500 mg/kg/day under the experimen-tal conditions and doses employed. Based on pre-formulation assessment, distilledwater was found to be a better vehicle on physical observation as compared to theother suspending agents. For both 14-day and 90-day toxicity study, formulation indistilled water was prepared freshly on a daily basis and was vortexed beforeadministration to each rat. The test item was stable in water even after 24 h.
2.1.5. Parameters investigated2.1.5.1. Clinical examination, body weight and feed consumption. All animals weresubjected to detailed clinical examinations before initiation of the treatment andweekly thereafter (varied by ±1–2 days) during the study. Individual animal bodyweights were recorded at receipt, on the day of initiation of treatment and weeklythereafter (±2 days) during the course of study. Fasting body weights were recordedat terminal euthanasia. Individual animal feed consumption was recorded weekly(±2 days) except for the animals during interim blood collection. Group mean feedconsumption was calculated.
2.1.5.2. Neurological/functional, ophthalmoloscopic examination. Neurological/func-tional examination was carried out during 12th week for control and high dosegroup animals. For neurological examinations cage-side observations includedmovements (gait), respiratory pattern, skin and hair coat, salivation, and lacrima-tion. Neurological observations on examination table included tactile responseand response to tail pinch-unreceptive stimulus. Additional neurological measure-ments included locomotor activity, head shaking, grasping strength and equilib-rium test. Functional observation record included visual response, auditoryresponse, and response to proprioceptive stimulus (gait, landing foot splay, rightingreflex). Ophthalmological examination was performed on all animals before thestudy begins and on control and high dose group animals during 12th week ofthe study.
2.1.6. Clinical pathology2.1.6.1. Hematology. Blood samples were collected from 10 rats of each sex pergroup on Days 15, 45, and at termination (day 91). The animals were fasted over-night before blood collection. Water was provided ad libitum during fasting period.Blood samples were collected from the animals separately into tubes containing K2-
EDTA and heparin for hematology and clinical chemistry, respectively. A series ofhematology parameters as listed in Tables 2 and 3 were analyzed using Sysmex,KX-21, Hematology analyzer (Transasia Bio-Medicals Ltd., India). Standard micros-copy of blood smear, stained with Leishman’s stain, counting 100 cells was per-formed to count neutrophils, lymphocytes, eosinophils and monocytes.
2.1.6.2. Clinical chemistry. Plasma was separated by centrifuging the blood samplesat 5000 rpm for 10 min and a series of clinical chemistry parameters listed in Tables4 and 5 were analyzed using the ‘‘EM-360 Fully automated clinical chemistry ana-lyzer’’ (Transasia Bio-Medicals Ltd., India). Sodium and potassium was estimatedusing Easylyte Na/K analyzer (Medica Corporation, USA).
2.1.6.3. Urinalysis. On completion of 90-days of treatment period, urine was col-lected in metabolic cages from 10 rats of each sex of the group. Animals were fastedovernight but water was provided ad libitum during this period. The urine wasanalyzed for the following parameters: appearance, color, volume (for 12 h), pH,specific gravity, occult blood, leucocytes, bilirubin, urobilinogen, ketone bodies,proteins, glucose, nitrite and microscopic examination of urine sediments.
2.1.7. Pathology2.1.7.1. Gross necropsy. At the end of treatment period (day 90), all the animals werefasted overnight. The next day, animals were weighed before exsanguinations andeuthanized using carbon dioxide asphyxiation. The external and internal grosspathological examination was conducted.
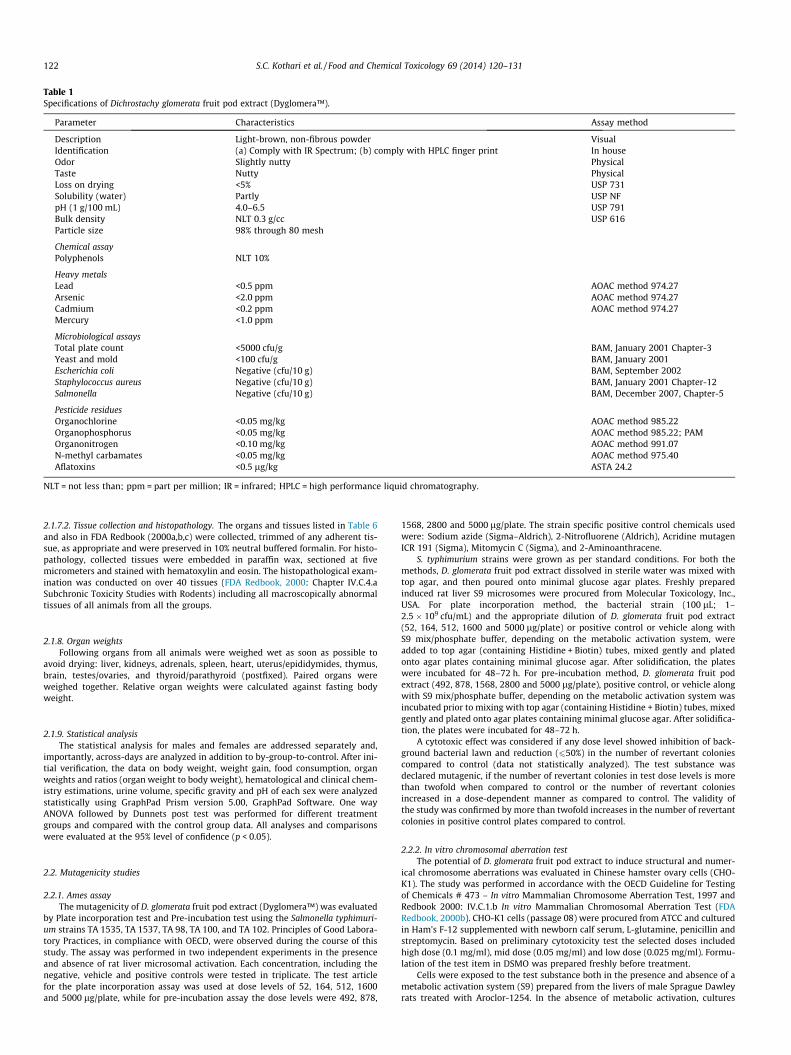
Table 1Specifications of Dichrostachy glomerata fruit pod extract (Dyglomera™).
Parameter Characteristics Assay method
Description Light-brown, non-fibrous powder VisualIdentification (a) Comply with IR Spectrum; (b) comply with HPLC finger print In houseOdor Slightly nutty PhysicalTaste Nutty PhysicalLoss on drying <5% USP 731Solubility (water) Partly USP NFpH (1 g/100 mL) 4.0–6.5 USP 791Bulk density NLT 0.3 g/cc USP 616Particle size 98% through 80 mesh
Chemical assayPolyphenols NLT 10%
Heavy metalsLead <0.5 ppm AOAC method 974.27Arsenic <2.0 ppm AOAC method 974.27Cadmium <0.2 ppm AOAC method 974.27Mercury <1.0 ppm
Microbiological assaysTotal plate count <5000 cfu/g BAM, January 2001 Chapter-3Yeast and mold <100 cfu/g BAM, January 2001Escherichia coli Negative (cfu/10 g) BAM, September 2002Staphylococcus aureus Negative (cfu/10 g) BAM, January 2001 Chapter-12Salmonella Negative (cfu/10 g) BAM, December 2007, Chapter-5
Pesticide residuesOrganochlorine <0.05 mg/kg AOAC method 985.22Organophosphorus <0.05 mg/kg AOAC method 985.22; PAMOrganonitrogen <0.10 mg/kg AOAC method 991.07N-methyl carbamates <0.05 mg/kg AOAC method 975.40Aflatoxins <0.5 lg/kg ASTA 24.2
NLT = not less than; ppm = part per million; IR = infrared; HPLC = high performance liquid chromatography.
122 S.C. Kothari et al. / Food and Chemical Toxicology 69 (2014) 120–131
2.1.7.2. Tissue collection and histopathology. The organs and tissues listed in Table 6and also in FDA Redbook (2000a,b,c) were collected, trimmed of any adherent tis-sue, as appropriate and were preserved in 10% neutral buffered formalin. For histo-pathology, collected tissues were embedded in paraffin wax, sectioned at fivemicrometers and stained with hematoxylin and eosin. The histopathological exam-ination was conducted on over 40 tissues (FDA Redbook, 2000: Chapter IV.C.4.aSubchronic Toxicity Studies with Rodents) including all macroscopically abnormaltissues of all animals from all the groups.
2.1.8. Organ weightsFollowing organs from all animals were weighed wet as soon as possible to
avoid drying: liver, kidneys, adrenals, spleen, heart, uterus/epididymides, thymus,brain, testes/ovaries, and thyroid/parathyroid (postfixed). Paired organs wereweighed together. Relative organ weights were calculated against fasting bodyweight.
2.1.9. Statistical analysisThe statistical analysis for males and females are addressed separately and,
importantly, across-days are analyzed in addition to by-group-to-control. After ini-tial verification, the data on body weight, weight gain, food consumption, organweights and ratios (organ weight to body weight), hematological and clinical chem-istry estimations, urine volume, specific gravity and pH of each sex were analyzedstatistically using GraphPad Prism version 5.00, GraphPad Software. One wayANOVA followed by Dunnets post test was performed for different treatmentgroups and compared with the control group data. All analyses and comparisonswere evaluated at the 95% level of confidence (p < 0.05).
2.2. Mutagenicity studies
2.2.1. Ames assayThe mutagenicity of D. glomerata fruit pod extract (Dyglomera™) was evaluated
by Plate incorporation test and Pre-incubation test using the Salmonella typhimuri-um strains TA 1535, TA 1537, TA 98, TA 100, and TA 102. Principles of Good Labora-tory Practices, in compliance with OECD, were observed during the course of thisstudy. The assay was performed in two independent experiments in the presenceand absence of rat liver microsomal activation. Each concentration, including thenegative, vehicle and positive controls were tested in triplicate. The test articlefor the plate incorporation assay was used at dose levels of 52, 164, 512, 1600and 5000 lg/plate, while for pre-incubation assay the dose levels were 492, 878,
1568, 2800 and 5000 lg/plate. The strain specific positive control chemicals usedwere: Sodium azide (Sigma–Aldrich), 2-Nitrofluorene (Aldrich), Acridine mutagenICR 191 (Sigma), Mitomycin C (Sigma), and 2-Aminoanthracene.
S. typhimurium strains were grown as per standard conditions. For both themethods, D. glomerata fruit pod extract dissolved in sterile water was mixed withtop agar, and then poured onto minimal glucose agar plates. Freshly preparedinduced rat liver S9 microsomes were procured from Molecular Toxicology, Inc.,USA. For plate incorporation method, the bacterial strain (100 lL; 1–2.5 � 109 cfu/mL) and the appropriate dilution of D. glomerata fruit pod extract(52, 164, 512, 1600 and 5000 lg/plate) or positive control or vehicle along withS9 mix/phosphate buffer, depending on the metabolic activation system, wereadded to top agar (containing Histidine + Biotin) tubes, mixed gently and platedonto agar plates containing minimal glucose agar. After solidification, the plateswere incubated for 48–72 h. For pre-incubation method, D. glomerata fruit podextract (492, 878, 1568, 2800 and 5000 lg/plate), positive control, or vehicle alongwith S9 mix/phosphate buffer, depending on the metabolic activation system wasincubated prior to mixing with top agar (containing Histidine + Biotin) tubes, mixedgently and plated onto agar plates containing minimal glucose agar. After solidifica-tion, the plates were incubated for 48–72 h.
A cytotoxic effect was considered if any dose level showed inhibition of back-ground bacterial lawn and reduction (650%) in the number of revertant coloniescompared to control (data not statistically analyzed). The test substance wasdeclared mutagenic, if the number of revertant colonies in test dose levels is morethan twofold when compared to control or the number of revertant coloniesincreased in a dose-dependent manner as compared to control. The validity ofthe study was confirmed by more than twofold increases in the number of revertantcolonies in positive control plates compared to control.
2.2.2. In vitro chromosomal aberration testThe potential of D. glomerata fruit pod extract to induce structural and numer-
ical chromosome aberrations was evaluated in Chinese hamster ovary cells (CHO-K1). The study was performed in accordance with the OECD Guideline for Testingof Chemicals # 473 – In vitro Mammalian Chromosome Aberration Test, 1997 andRedbook 2000: IV.C.1.b In vitro Mammalian Chromosomal Aberration Test (FDARedbook, 2000b). CHO-K1 cells (passage 08) were procured from ATCC and culturedin Ham’s F-12 supplemented with newborn calf serum, L-glutamine, penicillin andstreptomycin. Based on preliminary cytotoxicity test the selected doses includedhigh dose (0.1 mg/ml), mid dose (0.05 mg/ml) and low dose (0.025 mg/ml). Formu-lation of the test item in DSMO was prepared freshly before treatment.
Cells were exposed to the test substance both in the presence and absence of ametabolic activation system (S9) prepared from the livers of male Sprague Dawleyrats treated with Aroclor-1254. In the absence of metabolic activation, cultures
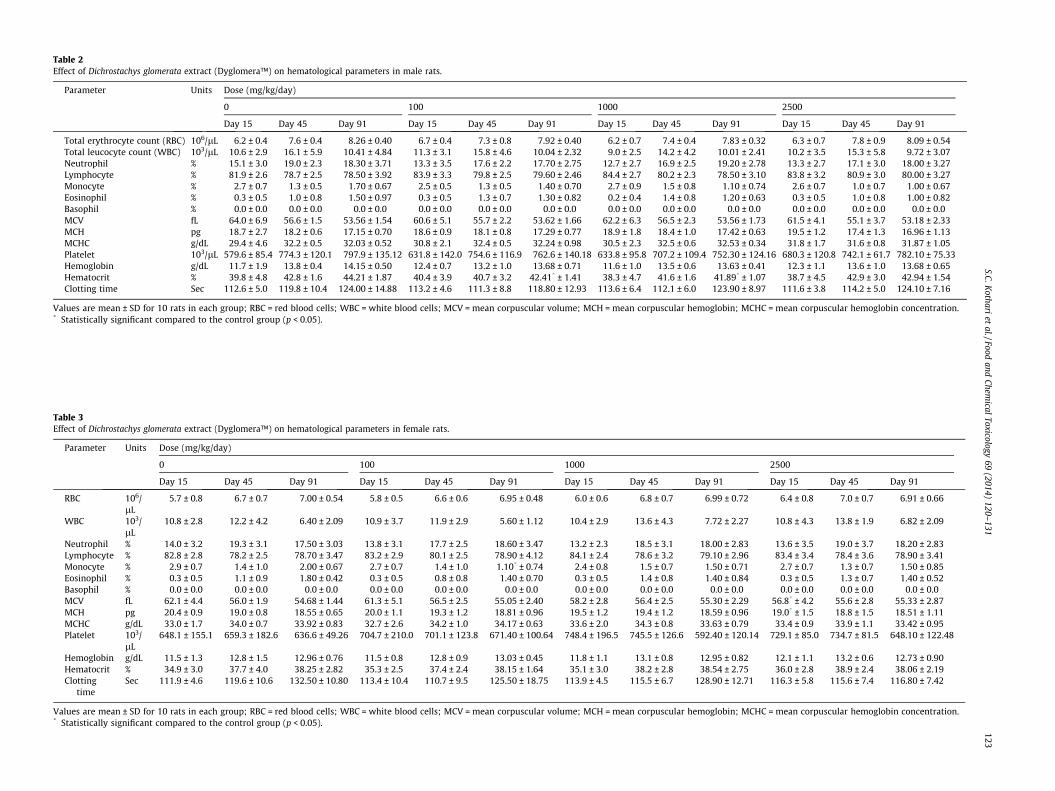
Table 2Effect of Dichrostachys glomerata extract (Dyglomera™) on hematological parameters in male rats.
Parameter Units Dose (mg/kg/day)
0 100 1000 2500
Day 15 Day 45 Day 91 Day 15 Day 45 Day 91 Day 15 Day 45 Day 91 Day 15 Day 45 Day 91
Total erythrocyte count (RBC) 106/lL 6.2 ± 0.4 7.6 ± 0.4 8.26 ± 0.40 6.7 ± 0.4 7.3 ± 0.8 7.92 ± 0.40 6.2 ± 0.7 7.4 ± 0.4 7.83 ± 0.32 6.3 ± 0.7 7.8 ± 0.9 8.09 ± 0.54Total leucocyte count (WBC) 103/lL 10.6 ± 2.9 16.1 ± 5.9 10.41 ± 4.84 11.3 ± 3.1 15.8 ± 4.6 10.04 ± 2.32 9.0 ± 2.5 14.2 ± 4.2 10.01 ± 2.41 10.2 ± 3.5 15.3 ± 5.8 9.72 ± 3.07Neutrophil % 15.1 ± 3.0 19.0 ± 2.3 18.30 ± 3.71 13.3 ± 3.5 17.6 ± 2.2 17.70 ± 2.75 12.7 ± 2.7 16.9 ± 2.5 19.20 ± 2.78 13.3 ± 2.7 17.1 ± 3.0 18.00 ± 3.27Lymphocyte % 81.9 ± 2.6 78.7 ± 2.5 78.50 ± 3.92 83.9 ± 3.3 79.8 ± 2.5 79.60 ± 2.46 84.4 ± 2.7 80.2 ± 2.3 78.50 ± 3.10 83.8 ± 3.2 80.9 ± 3.0 80.00 ± 3.27Monocyte % 2.7 ± 0.7 1.3 ± 0.5 1.70 ± 0.67 2.5 ± 0.5 1.3 ± 0.5 1.40 ± 0.70 2.7 ± 0.9 1.5 ± 0.8 1.10 ± 0.74 2.6 ± 0.7 1.0 ± 0.7 1.00 ± 0.67Eosinophil % 0.3 ± 0.5 1.0 ± 0.8 1.50 ± 0.97 0.3 ± 0.5 1.3 ± 0.7 1.30 ± 0.82 0.2 ± 0.4 1.4 ± 0.8 1.20 ± 0.63 0.3 ± 0.5 1.0 ± 0.8 1.00 ± 0.82Basophil % 0.0 ± 0.0 0.0 ± 0.0 0.0 ± 0.0 0.0 ± 0.0 0.0 ± 0.0 0.0 ± 0.0 0.0 ± 0.0 0.0 ± 0.0 0.0 ± 0.0 0.0 ± 0.0 0.0 ± 0.0 0.0 ± 0.0MCV fL 64.0 ± 6.9 56.6 ± 1.5 53.56 ± 1.54 60.6 ± 5.1 55.7 ± 2.2 53.62 ± 1.66 62.2 ± 6.3 56.5 ± 2.3 53.56 ± 1.73 61.5 ± 4.1 55.1 ± 3.7 53.18 ± 2.33MCH pg 18.7 ± 2.7 18.2 ± 0.6 17.15 ± 0.70 18.6 ± 0.9 18.1 ± 0.8 17.29 ± 0.77 18.9 ± 1.8 18.4 ± 1.0 17.42 ± 0.63 19.5 ± 1.2 17.4 ± 1.3 16.96 ± 1.13MCHC g/dL 29.4 ± 4.6 32.2 ± 0.5 32.03 ± 0.52 30.8 ± 2.1 32.4 ± 0.5 32.24 ± 0.98 30.5 ± 2.3 32.5 ± 0.6 32.53 ± 0.34 31.8 ± 1.7 31.6 ± 0.8 31.87 ± 1.05Platelet 103/lL 579.6 ± 85.4 774.3 ± 120.1 797.9 ± 135.12 631.8 ± 142.0 754.6 ± 116.9 762.6 ± 140.18 633.8 ± 95.8 707.2 ± 109.4 752.30 ± 124.16 680.3 ± 120.8 742.1 ± 61.7 782.10 ± 75.33Hemoglobin g/dL 11.7 ± 1.9 13.8 ± 0.4 14.15 ± 0.50 12.4 ± 0.7 13.2 ± 1.0 13.68 ± 0.71 11.6 ± 1.0 13.5 ± 0.6 13.63 ± 0.41 12.3 ± 1.1 13.6 ± 1.0 13.68 ± 0.65Hematocrit % 39.8 ± 4.8 42.8 ± 1.6 44.21 ± 1.87 40.4 ± 3.9 40.7 ± 3.2 42.41* ± 1.41 38.3 ± 4.7 41.6 ± 1.6 41.89* ± 1.07 38.7 ± 4.5 42.9 ± 3.0 42.94 ± 1.54Clotting time Sec 112.6 ± 5.0 119.8 ± 10.4 124.00 ± 14.88 113.2 ± 4.6 111.3 ± 8.8 118.80 ± 12.93 113.6 ± 6.4 112.1 ± 6.0 123.90 ± 8.97 111.6 ± 3.8 114.2 ± 5.0 124.10 ± 7.16
Values are mean ± SD for 10 rats in each group; RBC = red blood cells; WBC = white blood cells; MCV = mean corpuscular volume; MCH = mean corpuscular hemoglobin; MCHC = mean corpuscular hemoglobin concentration.* Statistically significant compared to the control group (p < 0.05).
Table 3Effect of Dichrostachys glomerata extract (Dyglomera™) on hematological parameters in female rats.
Parameter Units Dose (mg/kg/day)
0 100 1000 2500
Day 15 Day 45 Day 91 Day 15 Day 45 Day 91 Day 15 Day 45 Day 91 Day 15 Day 45 Day 91
RBC 106/lL
5.7 ± 0.8 6.7 ± 0.7 7.00 ± 0.54 5.8 ± 0.5 6.6 ± 0.6 6.95 ± 0.48 6.0 ± 0.6 6.8 ± 0.7 6.99 ± 0.72 6.4 ± 0.8 7.0 ± 0.7 6.91 ± 0.66
WBC 103/lL
10.8 ± 2.8 12.2 ± 4.2 6.40 ± 2.09 10.9 ± 3.7 11.9 ± 2.9 5.60 ± 1.12 10.4 ± 2.9 13.6 ± 4.3 7.72 ± 2.27 10.8 ± 4.3 13.8 ± 1.9 6.82 ± 2.09
Neutrophil % 14.0 ± 3.2 19.3 ± 3.1 17.50 ± 3.03 13.8 ± 3.1 17.7 ± 2.5 18.60 ± 3.47 13.2 ± 2.3 18.5 ± 3.1 18.00 ± 2.83 13.6 ± 3.5 19.0 ± 3.7 18.20 ± 2.83Lymphocyte % 82.8 ± 2.8 78.2 ± 2.5 78.70 ± 3.47 83.2 ± 2.9 80.1 ± 2.5 78.90 ± 4.12 84.1 ± 2.4 78.6 ± 3.2 79.10 ± 2.96 83.4 ± 3.4 78.4 ± 3.6 78.90 ± 3.41Monocyte % 2.9 ± 0.7 1.4 ± 1.0 2.00 ± 0.67 2.7 ± 0.7 1.4 ± 1.0 1.10* ± 0.74 2.4 ± 0.8 1.5 ± 0.7 1.50 ± 0.71 2.7 ± 0.7 1.3 ± 0.7 1.50 ± 0.85Eosinophil % 0.3 ± 0.5 1.1 ± 0.9 1.80 ± 0.42 0.3 ± 0.5 0.8 ± 0.8 1.40 ± 0.70 0.3 ± 0.5 1.4 ± 0.8 1.40 ± 0.84 0.3 ± 0.5 1.3 ± 0.7 1.40 ± 0.52Basophil % 0.0 ± 0.0 0.0 ± 0.0 0.0 ± 0.0 0.0 ± 0.0 0.0 ± 0.0 0.0 ± 0.0 0.0 ± 0.0 0.0 ± 0.0 0.0 ± 0.0 0.0 ± 0.0 0.0 ± 0.0 0.0 ± 0.0MCV fL 62.1 ± 4.4 56.0 ± 1.9 54.68 ± 1.44 61.3 ± 5.1 56.5 ± 2.5 55.05 ± 2.40 58.2 ± 2.8 56.4 ± 2.5 55.30 ± 2.29 56.8* ± 4.2 55.6 ± 2.8 55.33 ± 2.87MCH pg 20.4 ± 0.9 19.0 ± 0.8 18.55 ± 0.65 20.0 ± 1.1 19.3 ± 1.2 18.81 ± 0.96 19.5 ± 1.2 19.4 ± 1.2 18.59 ± 0.96 19.0* ± 1.5 18.8 ± 1.5 18.51 ± 1.11MCHC g/dL 33.0 ± 1.7 34.0 ± 0.7 33.92 ± 0.83 32.7 ± 2.6 34.2 ± 1.0 34.17 ± 0.63 33.6 ± 2.0 34.3 ± 0.8 33.63 ± 0.79 33.4 ± 0.9 33.9 ± 1.1 33.42 ± 0.95Platelet 103/
lL648.1 ± 155.1 659.3 ± 182.6 636.6 ± 49.26 704.7 ± 210.0 701.1 ± 123.8 671.40 ± 100.64 748.4 ± 196.5 745.5 ± 126.6 592.40 ± 120.14 729.1 ± 85.0 734.7 ± 81.5 648.10 ± 122.48
Hemoglobin g/dL 11.5 ± 1.3 12.8 ± 1.5 12.96 ± 0.76 11.5 ± 0.8 12.8 ± 0.9 13.03 ± 0.45 11.8 ± 1.1 13.1 ± 0.8 12.95 ± 0.82 12.1 ± 1.1 13.2 ± 0.6 12.73 ± 0.90Hematocrit % 34.9 ± 3.0 37.7 ± 4.0 38.25 ± 2.82 35.3 ± 2.5 37.4 ± 2.4 38.15 ± 1.64 35.1 ± 3.0 38.2 ± 2.8 38.54 ± 2.75 36.0 ± 2.8 38.9 ± 2.4 38.06 ± 2.19Clotting
timeSec 111.9 ± 4.6 119.6 ± 10.6 132.50 ± 10.80 113.4 ± 10.4 110.7 ± 9.5 125.50 ± 18.75 113.9 ± 4.5 115.5 ± 6.7 128.90 ± 12.71 116.3 ± 5.8 115.6 ± 7.4 116.80 ± 7.42
Values are mean ± SD for 10 rats in each group; RBC = red blood cells; WBC = white blood cells; MCV = mean corpuscular volume; MCH = mean corpuscular hemoglobin; MCHC = mean corpuscular hemoglobin concentration.* Statistically significant compared to the control group (p < 0.05).
S.C.Kothari
etal./Food
andChem
icalToxicology
69(2014)
120–131
123
124 S.C. Kothari et al. / Food and Chemical Toxicology 69 (2014) 120–131
were incubated with the test article for 15–16 h, washed, placed in fresh culturemedium containing colchicine (0.3 lg/mL), and incubated for an additional 2–3 h.In the presence of metabolic activation, cultures were incubated with the test arti-cle for 5–6 h, washed, placed in freshly prepared culture medium containing colchi-cine, exposed for 2–3 h before harvesting. The cells were trypsinized and incubatedin hypotonic solution (Swierenga et al., 1991). The cells were then fixed thrice withice-cold glacial acetic acid: methanol solution and stained with Giemsa. Two hun-dred well-spread metaphases were scored per concentration and control.
The study was conducted in five groups of CHO-K1 cell cultures with presenceand absence of metabolic activation (S9) in triplicates. Groups labeled G1 and G2served as vehicle control and positive control respectively. Group G1 in presenceand absence of S9 fraction were treated with 0.1% DMSO for a period of 5–6 hand 15–16 h respectively. Group G2 was treated with cyclophosphamide (10 lg/mL) in presence of S9 for 5–6 h (G2a) and mitomycin (0.4 lg/mL) in absence ofS9 for 15–16 h (G2b). Cells in groups G3, G4 and G5 were treated with test itemat 0.1, 0.05, 0.025 mg/mL both in presence and absence of S9 for 5–6 h and 15–16 h, respectively. After the treatment, cells were analyzed for structural andnumerical chromosome aberrations.
2.2.3. In vivo chromosomal aberration testMammalian bone marrow chromosome aberration test was carried out in Spra-
gue Dawley rats in accordance with (A) OECD Guideline No. 475 for Testing ofChemicals, adopted: 21st July 1997, (B) OECD Principles of GLP (1997). For thisstudy, rats were divided into five groups (5/sex/group) and dosed once a day fora period of 14 consecutive days. Groups labeled G1 and G2 served as vehicle controland positive control respectively and daily received distilled water orally by gavagefor 14 days. Animals in Group G2 were treated with cyclophosphamide (40 mg/kgbw) intraperitoneally on Day 14. The animals in Groups G3, G4 and G5 were admin-istered (via oral gavage) daily 100, 1000 and 2500 mg D. glomerata fruit pod extract/kg bw for 14 days, respectively. On Day 15, 3 h prior to euthanasia all the animalswere treated with a metaphase-arresting agent, colchicine at 4 mg/kg bwintraperitoneally.
All the animals were euthanized, 22–24 h after the last treatment, to obtain cellsuspensions from the femur bone marrow. The marrows were flushed out with pre-warmed fetal bovine serum (FBS) in to a tube and centrifuged. Supernatant werediscarded and the cell pellet were suspended in freshly prepared hypotonic KClsolution. Suspensions were centrifuged, supernatant discarded and cell pellet wereresuspended with freshly prepared cold fixative (3:1 methanol glacial acetic acid).Suspensions were kept at room temperature centrifuged and cold fixative treat-ments were repeated twice. After the third treatment, suspensions were stored atrefrigeration temperature for 1 h and centrifuged. Supernatant were discarded, coldfixative were added to the cell pellet and resuspended cells in fixative were droppedon chilled slides, the slides were dried in water bath and were stained with 5%Geimsa for microscopic evaluation. The mitotic index were determined as a mea-sure of cytotoxicity in minimum of 1000 cells per animal for all treated animals.For each animal, at least 100 metaphase cells were analyzed and cells scored con-tain 2n ± 2 number of centromeres. The data on body weight, mitotic index, chro-mosome gap and break, ring chromosome, acentric fragments, chromatid gap andbreak, pulverization, polyploidy, endoreduplication, chromosome and chromatidexchanges were analyzed statistically.
2.2.4. In vivo mammalian micronucleus testThis study was performed in accordance with the (A) Redbook 2000: IV.C.1.d
Mammalian Erythrocyte Micronucleus Test (FDA Redbook, 2000c) and (B) OECDGuideline for Principles of GLP. In this dose–response study, D. glomerata fruitpod extract was administered daily for 14 consecutive days through oral gavageto male and female Sprague Dawley rats. For this study, rats were divided into fivegroups each consisting of 10 rats (5/sex/group). A vehicle control and positive con-trol groups were treated with distilled water and the treatment group rats weretreated with at a dose level of 100, 1000, 2500 mg/kg bw/day (low, mid and highdose groups, respectively) for 14 consecutive days. On Day 14, positive controlgroup rats were treated intraperitoneally with cyclophosphamide (40 mg/kg bw).All animals were observed once daily for clinical signs of toxicity and twice dailyfor mortality and morbidity. Individual animal body weights were recorded onthe Day 1 before test item administration and at twice weekly thereafter. All theanimals were euthanized 24 h after the last treatment to obtain cell suspensionsfrom the femur bone marrow.
The animals were euthanized with CO2 anesthesia after 24 h of the final treat-ment and bone marrows cells were harvested, cells processed and slides preparedfor evaluation according to standard procedures. The air dried slides were stainedwith May-Gruenwald and Giemsa stain for evaluation. For each animal, at least200 erythrocytes (which include mature and immature erythrocytes) were scoredfrom the slides prepared for that animal to determine the ratio of polychromaticerythrocytes (PCE) to total number of erythrocytes (TE). For each animal, a mini-mum of 2000 PCE was scored for the incidence of micronucleated polychromaticerythrocytes (MNPCE). The data was subjected to statistical analyses using Graph-Pad Prism version 5.00, GraphPad Software. The data on body weight, ratio of PCE toTE and MNPCE to PCE estimations was analyzed statistically. One-way ANOVA with
Dunnett’s post test was done for different treatment groups comparing with thecontrol group data. All analyses and comparisons was evaluated at the 95% levelof confidence (p < 0.05).
3. Results
3.1. Subchronic toxicity study
3.1.1. Survival, clinical observations, neurological, ophthalmologicalexamination
All animals survived until the scheduled necropsy. There wereno clinical signs of toxicity in any of the four groups of animals dur-ing the course of the study. The detailed clinical examination ofanimals revealed normal health status throughout the study per-iod. As compared to control group, none of the animals in the highdose group receiving D. glomerata extract showed changes in theneurological and functional observations carried out during week12 (data not shown). Similarly, no alterations were recorded inthe ophthalmological examination carried out prior to the admin-istration of test item and at the end of study period (data notshown).
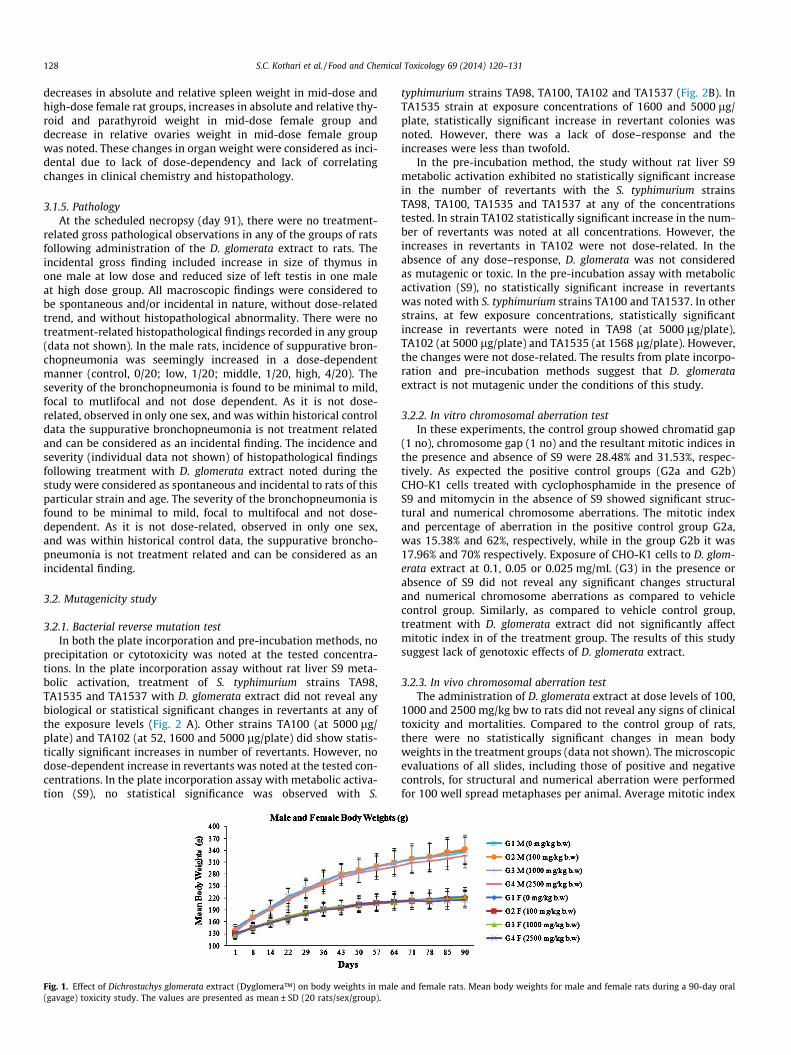
3.1.2. Body weights and feed consumptionThere were no statistically significant treatment related
changes in body weights (Fig. 1) and percent body weight gain inboth the sexes during the study period (data not shown). However,a single incidence of statistically significant decrease (p < 0.05) inpercent body weight gain was noted on day 22 in high dosefemales receiving D. glomerata extract. As the change was notobserved during subsequent study period, this decrease was con-sidered as incidental. The mean feed consumption (g/rat/day)was comparable in all the dose groups of both the sexes (datanot shown). However, in all three treatment groups some statisti-cally significant changes (p < 0.05) in weekly feed intake werenoted at few time points (week 4- Group IV female decreased;week 6 Group IV male increased; week 7 Group IV male decreased;week 8 and 9 Group II male decreased). These data did not revealany trend and the changes were not considered as biologicallysignificant.
3.1.3. Clinical pathology3.1.3.1. Hematology. As compared to control group, there were notreatment-related biologically or toxicologically significantchanges in hematology parameters analyzed from blood samplescollected on Days 15, 45 and 91 (termination) in any of the treatedgroups of male (Table 2) and female (Table 3) rats followingadministration of D. glomerata extract. However, compared to con-trol group some statistically significant changes as described belowwere noted: At 15 day sampling, the MCV and MCH weredecreased in females receiving high dose (Group IV) of D. glomerataextract. Additionally, at Day 91 sampling, hematocrit was signifi-cantly lower in males of low-dose (Group II) and mid-dose (GroupIII) treatment groups. Although all these changes showed statisticalsignificance compared to control group, they were not observed inboth sexes, lacked correlating changes in other red cell parameters,were of small magnitude, and/or were not noted in a dose-relatedand time-related manner. Hence, these changes were considered asincidental biological variations and not treatment-related adverseeffects.
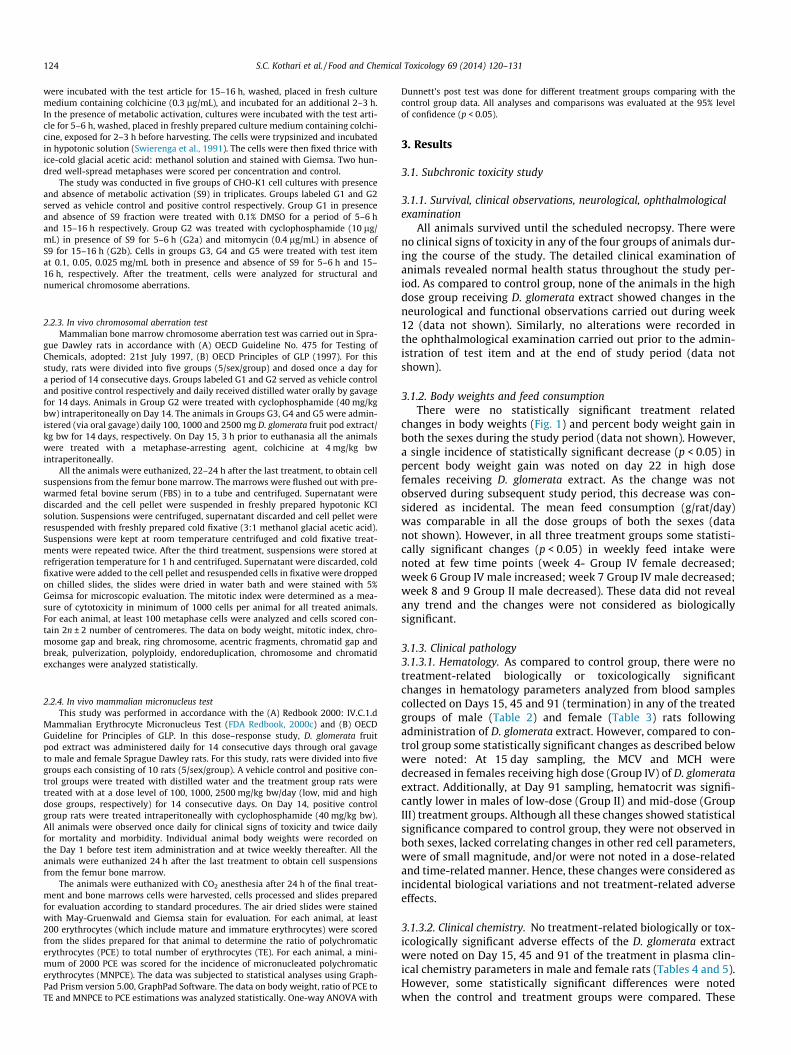
3.1.3.2. Clinical chemistry. No treatment-related biologically or tox-icologically significant adverse effects of the D. glomerata extractwere noted on Day 15, 45 and 91 of the treatment in plasma clin-ical chemistry parameters in male and female rats (Tables 4 and 5).However, some statistically significant differences were notedwhen the control and treatment groups were compared. These
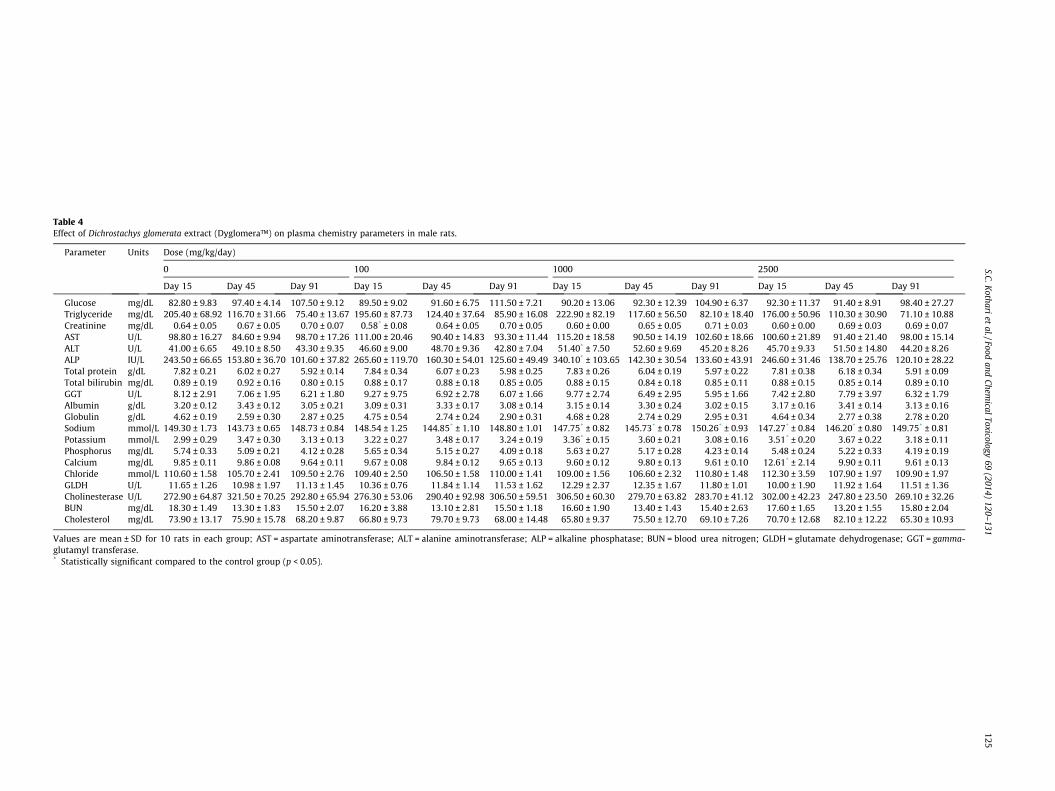
Table 4Effect of Dichrostachys glomerata extract (Dyglomera™) on plasma chemistry parameters in male rats.
Parameter Units Dose (mg/kg/day)
0 100 1000 2500
Day 15 Day 45 Day 91 Day 15 Day 45 Day 91 Day 15 Day 45 Day 91 Day 15 Day 45 Day 91
Glucose mg/dL 82.80 ± 9.83 97.40 ± 4.14 107.50 ± 9.12 89.50 ± 9.02 91.60 ± 6.75 111.50 ± 7.21 90.20 ± 13.06 92.30 ± 12.39 104.90 ± 6.37 92.30 ± 11.37 91.40 ± 8.91 98.40 ± 27.27Triglyceride mg/dL 205.40 ± 68.92 116.70 ± 31.66 75.40 ± 13.67 195.60 ± 87.73 124.40 ± 37.64 85.90 ± 16.08 222.90 ± 82.19 117.60 ± 56.50 82.10 ± 18.40 176.00 ± 50.96 110.30 ± 30.90 71.10 ± 10.88Creatinine mg/dL 0.64 ± 0.05 0.67 ± 0.05 0.70 ± 0.07 0.58* ± 0.08 0.64 ± 0.05 0.70 ± 0.05 0.60 ± 0.00 0.65 ± 0.05 0.71 ± 0.03 0.60 ± 0.00 0.69 ± 0.03 0.69 ± 0.07AST U/L 98.80 ± 16.27 84.60 ± 9.94 98.70 ± 17.26 111.00 ± 20.46 90.40 ± 14.83 93.30 ± 11.44 115.20 ± 18.58 90.50 ± 14.19 102.60 ± 18.66 100.60 ± 21.89 91.40 ± 21.40 98.00 ± 15.14ALT U/L 41.00 ± 6.65 49.10 ± 8.50 43.30 ± 9.35 46.60 ± 9.00 48.70 ± 9.36 42.80 ± 7.04 51.40* ± 7.50 52.60 ± 9.69 45.20 ± 8.26 45.70 ± 9.33 51.50 ± 14.80 44.20 ± 8.26ALP IU/L 243.50 ± 66.65 153.80 ± 36.70 101.60 ± 37.82 265.60 ± 119.70 160.30 ± 54.01 125.60 ± 49.49 340.10* ± 103.65 142.30 ± 30.54 133.60 ± 43.91 246.60 ± 31.46 138.70 ± 25.76 120.10 ± 28.22Total protein g/dL 7.82 ± 0.21 6.02 ± 0.27 5.92 ± 0.14 7.84 ± 0.34 6.07 ± 0.23 5.98 ± 0.25 7.83 ± 0.26 6.04 ± 0.19 5.97 ± 0.22 7.81 ± 0.38 6.18 ± 0.34 5.91 ± 0.09Total bilirubin mg/dL 0.89 ± 0.19 0.92 ± 0.16 0.80 ± 0.15 0.88 ± 0.17 0.88 ± 0.18 0.85 ± 0.05 0.88 ± 0.15 0.84 ± 0.18 0.85 ± 0.11 0.88 ± 0.15 0.85 ± 0.14 0.89 ± 0.10GGT U/L 8.12 ± 2.91 7.06 ± 1.95 6.21 ± 1.80 9.27 ± 9.75 6.92 ± 2.78 6.07 ± 1.66 9.77 ± 2.74 6.49 ± 2.95 5.95 ± 1.66 7.42 ± 2.80 7.79 ± 3.97 6.32 ± 1.79Albumin g/dL 3.20 ± 0.12 3.43 ± 0.12 3.05 ± 0.21 3.09 ± 0.31 3.33 ± 0.17 3.08 ± 0.14 3.15 ± 0.14 3.30 ± 0.24 3.02 ± 0.15 3.17 ± 0.16 3.41 ± 0.14 3.13 ± 0.16Globulin g/dL 4.62 ± 0.19 2.59 ± 0.30 2.87 ± 0.25 4.75 ± 0.54 2.74 ± 0.24 2.90 ± 0.31 4.68 ± 0.28 2.74 ± 0.29 2.95 ± 0.31 4.64 ± 0.34 2.77 ± 0.38 2.78 ± 0.20Sodium mmol/L 149.30 ± 1.73 143.73 ± 0.65 148.73 ± 0.84 148.54 ± 1.25 144.85* ± 1.10 148.80 ± 1.01 147.75* ± 0.82 145.73* ± 0.78 150.26* ± 0.93 147.27* ± 0.84 146.20* ± 0.80 149.75* ± 0.81Potassium mmol/L 2.99 ± 0.29 3.47 ± 0.30 3.13 ± 0.13 3.22 ± 0.27 3.48 ± 0.17 3.24 ± 0.19 3.36* ± 0.15 3.60 ± 0.21 3.08 ± 0.16 3.51* ± 0.20 3.67 ± 0.22 3.18 ± 0.11Phosphorus mg/dL 5.74 ± 0.33 5.09 ± 0.21 4.12 ± 0.28 5.65 ± 0.34 5.15 ± 0.27 4.09 ± 0.18 5.63 ± 0.27 5.17 ± 0.28 4.23 ± 0.14 5.48 ± 0.24 5.22 ± 0.33 4.19 ± 0.19Calcium mg/dL 9.85 ± 0.11 9.86 ± 0.08 9.64 ± 0.11 9.67 ± 0.08 9.84 ± 0.12 9.65 ± 0.13 9.60 ± 0.12 9.80 ± 0.13 9.61 ± 0.10 12.61* ± 2.14 9.90 ± 0.11 9.61 ± 0.13Chloride mmol/L 110.60 ± 1.58 105.70 ± 2.41 109.50 ± 2.76 109.40 ± 2.50 106.50 ± 1.58 110.00 ± 1.41 109.00 ± 1.56 106.60 ± 2.32 110.80 ± 1.48 112.30 ± 3.59 107.90 ± 1.97 109.90 ± 1.97GLDH U/L 11.65 ± 1.26 10.98 ± 1.97 11.13 ± 1.45 10.36 ± 0.76 11.84 ± 1.14 11.53 ± 1.62 12.29 ± 2.37 12.35 ± 1.67 11.80 ± 1.01 10.00 ± 1.90 11.92 ± 1.64 11.51 ± 1.36Cholinesterase U/L 272.90 ± 64.87 321.50 ± 70.25 292.80 ± 65.94 276.30 ± 53.06 290.40 ± 92.98 306.50 ± 59.51 306.50 ± 60.30 279.70 ± 63.82 283.70 ± 41.12 302.00 ± 42.23 247.80 ± 23.50 269.10 ± 32.26BUN mg/dL 18.30 ± 1.49 13.30 ± 1.83 15.50 ± 2.07 16.20 ± 3.88 13.10 ± 2.81 15.50 ± 1.18 16.60 ± 1.90 13.40 ± 1.43 15.40 ± 2.63 17.60 ± 1.65 13.20 ± 1.55 15.80 ± 2.04Cholesterol mg/dL 73.90 ± 13.17 75.90 ± 15.78 68.20 ± 9.87 66.80 ± 9.73 79.70 ± 9.73 68.00 ± 14.48 65.80 ± 9.37 75.50 ± 12.70 69.10 ± 7.26 70.70 ± 12.68 82.10 ± 12.22 65.30 ± 10.93
Values are mean ± SD for 10 rats in each group; AST = aspartate aminotransferase; ALT = alanine aminotransferase; ALP = alkaline phosphatase; BUN = blood urea nitrogen; GLDH = glutamate dehydrogenase; GGT = gamma-glutamyl transferase.* Statistically significant compared to the control group (p < 0.05).
S.C.Kothari
etal./Food
andChem
icalToxicology
69(2014)
120–131
125
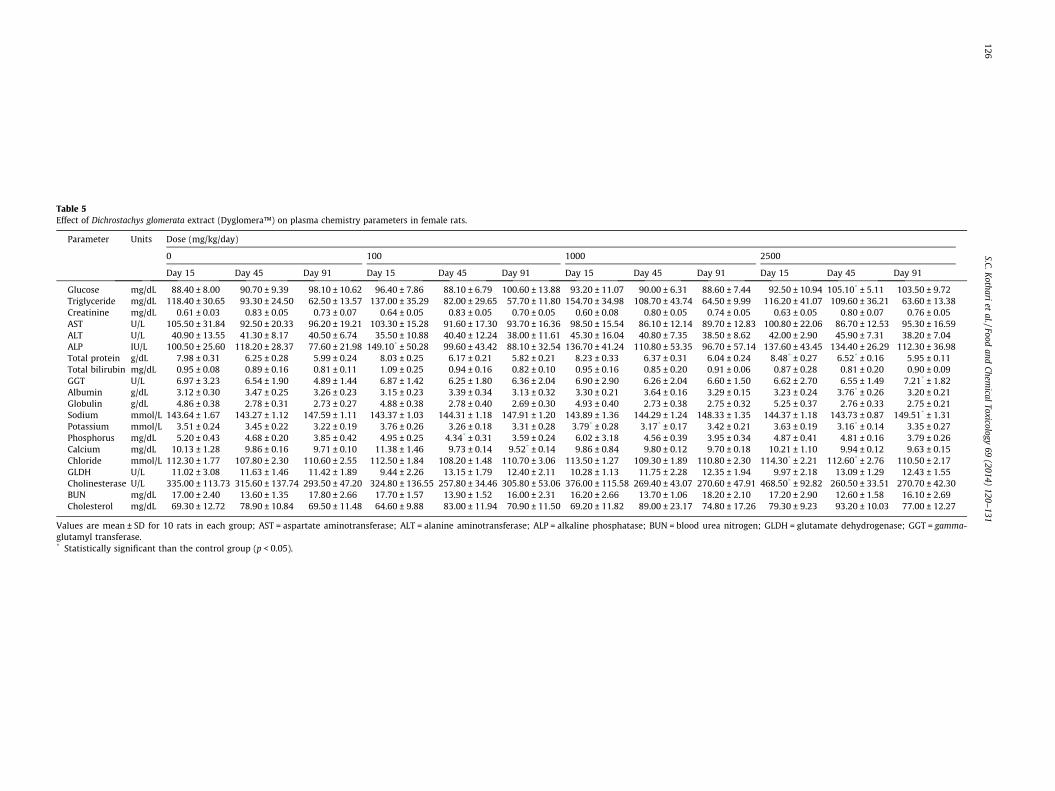
Table 5Effect of Dichrostachys glomerata extract (Dyglomera™) on plasma chemistry parameters in female rats.
Parameter Units Dose (mg/kg/day)
0 100 1000 2500
Day 15 Day 45 Day 91 Day 15 Day 45 Day 91 Day 15 Day 45 Day 91 Day 15 Day 45 Day 91
Glucose mg/dL 88.40 ± 8.00 90.70 ± 9.39 98.10 ± 10.62 96.40 ± 7.86 88.10 ± 6.79 100.60 ± 13.88 93.20 ± 11.07 90.00 ± 6.31 88.60 ± 7.44 92.50 ± 10.94 105.10* ± 5.11 103.50 ± 9.72Triglyceride mg/dL 118.40 ± 30.65 93.30 ± 24.50 62.50 ± 13.57 137.00 ± 35.29 82.00 ± 29.65 57.70 ± 11.80 154.70 ± 34.98 108.70 ± 43.74 64.50 ± 9.99 116.20 ± 41.07 109.60 ± 36.21 63.60 ± 13.38Creatinine mg/dL 0.61 ± 0.03 0.83 ± 0.05 0.73 ± 0.07 0.64 ± 0.05 0.83 ± 0.05 0.70 ± 0.05 0.60 ± 0.08 0.80 ± 0.05 0.74 ± 0.05 0.63 ± 0.05 0.80 ± 0.07 0.76 ± 0.05AST U/L 105.50 ± 31.84 92.50 ± 20.33 96.20 ± 19.21 103.30 ± 15.28 91.60 ± 17.30 93.70 ± 16.36 98.50 ± 15.54 86.10 ± 12.14 89.70 ± 12.83 100.80 ± 22.06 86.70 ± 12.53 95.30 ± 16.59ALT U/L 40.90 ± 13.55 41.30 ± 8.17 40.50 ± 6.74 35.50 ± 10.88 40.40 ± 12.24 38.00 ± 11.61 45.30 ± 16.04 40.80 ± 7.35 38.50 ± 8.62 42.00 ± 2.90 45.90 ± 7.31 38.20 ± 7.04ALP IU/L 100.50 ± 25.60 118.20 ± 28.37 77.60 ± 21.98 149.10* ± 50.28 99.60 ± 43.42 88.10 ± 32.54 136.70 ± 41.24 110.80 ± 53.35 96.70 ± 57.14 137.60 ± 43.45 134.40 ± 26.29 112.30 ± 36.98Total protein g/dL 7.98 ± 0.31 6.25 ± 0.28 5.99 ± 0.24 8.03 ± 0.25 6.17 ± 0.21 5.82 ± 0.21 8.23 ± 0.33 6.37 ± 0.31 6.04 ± 0.24 8.48* ± 0.27 6.52* ± 0.16 5.95 ± 0.11Total bilirubin mg/dL 0.95 ± 0.08 0.89 ± 0.16 0.81 ± 0.11 1.09 ± 0.25 0.94 ± 0.16 0.82 ± 0.10 0.95 ± 0.16 0.85 ± 0.20 0.91 ± 0.06 0.87 ± 0.28 0.81 ± 0.20 0.90 ± 0.09GGT U/L 6.97 ± 3.23 6.54 ± 1.90 4.89 ± 1.44 6.87 ± 1.42 6.25 ± 1.80 6.36 ± 2.04 6.90 ± 2.90 6.26 ± 2.04 6.60 ± 1.50 6.62 ± 2.70 6.55 ± 1.49 7.21* ± 1.82Albumin g/dL 3.12 ± 0.30 3.47 ± 0.25 3.26 ± 0.23 3.15 ± 0.23 3.39 ± 0.34 3.13 ± 0.32 3.30 ± 0.21 3.64 ± 0.16 3.29 ± 0.15 3.23 ± 0.24 3.76* ± 0.26 3.20 ± 0.21Globulin g/dL 4.86 ± 0.38 2.78 ± 0.31 2.73 ± 0.27 4.88 ± 0.38 2.78 ± 0.40 2.69 ± 0.30 4.93 ± 0.40 2.73 ± 0.38 2.75 ± 0.32 5.25 ± 0.37 2.76 ± 0.33 2.75 ± 0.21Sodium mmol/L 143.64 ± 1.67 143.27 ± 1.12 147.59 ± 1.11 143.37 ± 1.03 144.31 ± 1.18 147.91 ± 1.20 143.89 ± 1.36 144.29 ± 1.24 148.33 ± 1.35 144.37 ± 1.18 143.73 ± 0.87 149.51* ± 1.31Potassium mmol/L 3.51 ± 0.24 3.45 ± 0.22 3.22 ± 0.19 3.76 ± 0.26 3.26 ± 0.18 3.31 ± 0.28 3.79* ± 0.28 3.17* ± 0.17 3.42 ± 0.21 3.63 ± 0.19 3.16* ± 0.14 3.35 ± 0.27Phosphorus mg/dL 5.20 ± 0.43 4.68 ± 0.20 3.85 ± 0.42 4.95 ± 0.25 4.34* ± 0.31 3.59 ± 0.24 6.02 ± 3.18 4.56 ± 0.39 3.95 ± 0.34 4.87 ± 0.41 4.81 ± 0.16 3.79 ± 0.26Calcium mg/dL 10.13 ± 1.28 9.86 ± 0.16 9.71 ± 0.10 11.38 ± 1.46 9.73 ± 0.14 9.52* ± 0.14 9.86 ± 0.84 9.80 ± 0.12 9.70 ± 0.18 10.21 ± 1.10 9.94 ± 0.12 9.63 ± 0.15Chloride mmol/L 112.30 ± 1.77 107.80 ± 2.30 110.60 ± 2.55 112.50 ± 1.84 108.20 ± 1.48 110.70 ± 3.06 113.50 ± 1.27 109.30 ± 1.89 110.80 ± 2.30 114.30* ± 2.21 112.60* ± 2.76 110.50 ± 2.17GLDH U/L 11.02 ± 3.08 11.63 ± 1.46 11.42 ± 1.89 9.44 ± 2.26 13.15 ± 1.79 12.40 ± 2.11 10.28 ± 1.13 11.75 ± 2.28 12.35 ± 1.94 9.97 ± 2.18 13.09 ± 1.29 12.43 ± 1.55Cholinesterase U/L 335.00 ± 113.73 315.60 ± 137.74 293.50 ± 47.20 324.80 ± 136.55 257.80 ± 34.46 305.80 ± 53.06 376.00 ± 115.58 269.40 ± 43.07 270.60 ± 47.91 468.50* ± 92.82 260.50 ± 33.51 270.70 ± 42.30BUN mg/dL 17.00 ± 2.40 13.60 ± 1.35 17.80 ± 2.66 17.70 ± 1.57 13.90 ± 1.52 16.00 ± 2.31 16.20 ± 2.66 13.70 ± 1.06 18.20 ± 2.10 17.20 ± 2.90 12.60 ± 1.58 16.10 ± 2.69Cholesterol mg/dL 69.30 ± 12.72 78.90 ± 10.84 69.50 ± 11.48 64.60 ± 9.88 83.00 ± 11.94 70.90 ± 11.50 69.20 ± 11.82 89.00 ± 23.17 74.80 ± 17.26 79.30 ± 9.23 93.20 ± 10.03 77.00 ± 12.27
Values are mean ± SD for 10 rats in each group; AST = aspartate aminotransferase; ALT = alanine aminotransferase; ALP = alkaline phosphatase; BUN = blood urea nitrogen; GLDH = glutamate dehydrogenase; GGT = gamma-glutamyl transferase.* Statistically significant than the control group (p < 0.05).
126S.C.K
othariet
al./Foodand
Chemical
Toxicology69
(2014)120–
131
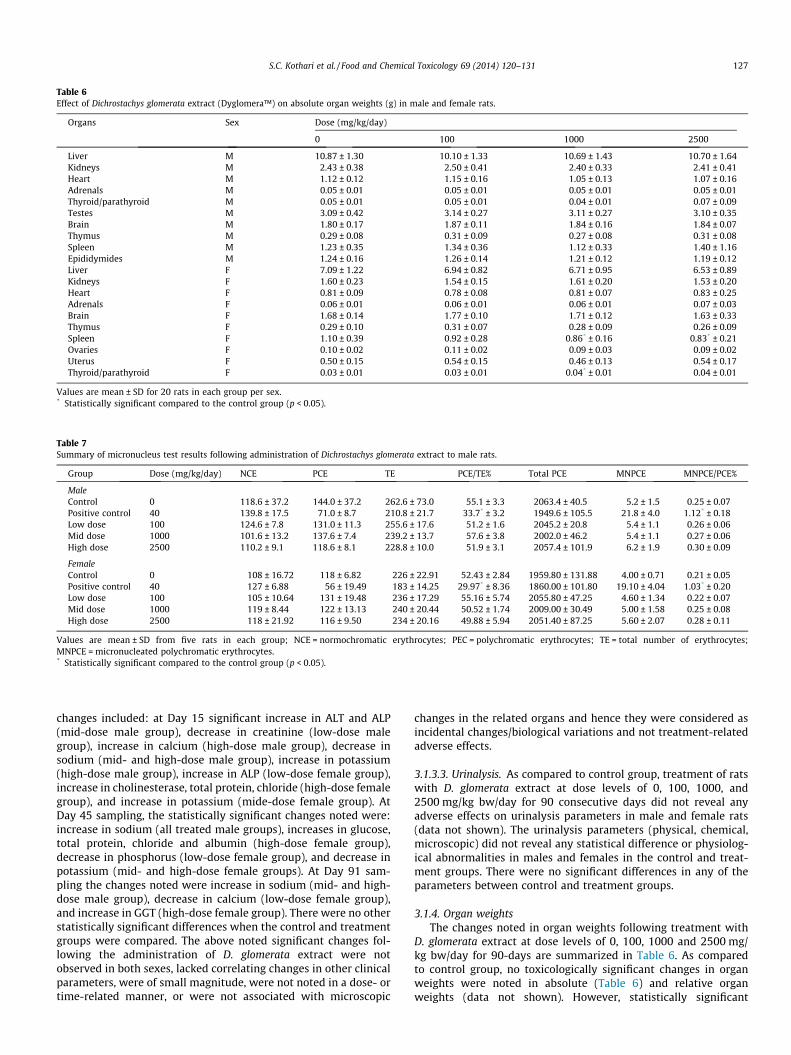
Table 6Effect of Dichrostachys glomerata extract (Dyglomera™) on absolute organ weights (g) in male and female rats.
Organs Sex Dose (mg/kg/day)
0 100 1000 2500
Liver M 10.87 ± 1.30 10.10 ± 1.33 10.69 ± 1.43 10.70 ± 1.64Kidneys M 2.43 ± 0.38 2.50 ± 0.41 2.40 ± 0.33 2.41 ± 0.41Heart M 1.12 ± 0.12 1.15 ± 0.16 1.05 ± 0.13 1.07 ± 0.16Adrenals M 0.05 ± 0.01 0.05 ± 0.01 0.05 ± 0.01 0.05 ± 0.01Thyroid/parathyroid M 0.05 ± 0.01 0.05 ± 0.01 0.04 ± 0.01 0.07 ± 0.09Testes M 3.09 ± 0.42 3.14 ± 0.27 3.11 ± 0.27 3.10 ± 0.35Brain M 1.80 ± 0.17 1.87 ± 0.11 1.84 ± 0.16 1.84 ± 0.07Thymus M 0.29 ± 0.08 0.31 ± 0.09 0.27 ± 0.08 0.31 ± 0.08Spleen M 1.23 ± 0.35 1.34 ± 0.36 1.12 ± 0.33 1.40 ± 1.16Epididymides M 1.24 ± 0.16 1.26 ± 0.14 1.21 ± 0.12 1.19 ± 0.12Liver F 7.09 ± 1.22 6.94 ± 0.82 6.71 ± 0.95 6.53 ± 0.89Kidneys F 1.60 ± 0.23 1.54 ± 0.15 1.61 ± 0.20 1.53 ± 0.20Heart F 0.81 ± 0.09 0.78 ± 0.08 0.81 ± 0.07 0.83 ± 0.25Adrenals F 0.06 ± 0.01 0.06 ± 0.01 0.06 ± 0.01 0.07 ± 0.03Brain F 1.68 ± 0.14 1.77 ± 0.10 1.71 ± 0.12 1.63 ± 0.33Thymus F 0.29 ± 0.10 0.31 ± 0.07 0.28 ± 0.09 0.26 ± 0.09Spleen F 1.10 ± 0.39 0.92 ± 0.28 0.86* ± 0.16 0.83* ± 0.21Ovaries F 0.10 ± 0.02 0.11 ± 0.02 0.09 ± 0.03 0.09 ± 0.02Uterus F 0.50 ± 0.15 0.54 ± 0.15 0.46 ± 0.13 0.54 ± 0.17Thyroid/parathyroid F 0.03 ± 0.01 0.03 ± 0.01 0.04* ± 0.01 0.04 ± 0.01
Values are mean ± SD for 20 rats in each group per sex.* Statistically significant compared to the control group (p < 0.05).
Table 7Summary of micronucleus test results following administration of Dichrostachys glomerata extract to male rats.
Group Dose (mg/kg/day) NCE PCE TE PCE/TE% Total PCE MNPCE MNPCE/PCE%
MaleControl 0 118.6 ± 37.2 144.0 ± 37.2 262.6 ± 73.0 55.1 ± 3.3 2063.4 ± 40.5 5.2 ± 1.5 0.25 ± 0.07Positive control 40 139.8 ± 17.5 71.0 ± 8.7 210.8 ± 21.7 33.7* ± 3.2 1949.6 ± 105.5 21.8 ± 4.0 1.12* ± 0.18Low dose 100 124.6 ± 7.8 131.0 ± 11.3 255.6 ± 17.6 51.2 ± 1.6 2045.2 ± 20.8 5.4 ± 1.1 0.26 ± 0.06Mid dose 1000 101.6 ± 13.2 137.6 ± 7.4 239.2 ± 13.7 57.6 ± 3.8 2002.0 ± 46.2 5.4 ± 1.1 0.27 ± 0.06High dose 2500 110.2 ± 9.1 118.6 ± 8.1 228.8 ± 10.0 51.9 ± 3.1 2057.4 ± 101.9 6.2 ± 1.9 0.30 ± 0.09
FemaleControl 0 108 ± 16.72 118 ± 6.82 226 ± 22.91 52.43 ± 2.84 1959.80 ± 131.88 4.00 ± 0.71 0.21 ± 0.05Positive control 40 127 ± 6.88 56 ± 19.49 183 ± 14.25 29.97* ± 8.36 1860.00 ± 101.80 19.10 ± 4.04 1.03* ± 0.20Low dose 100 105 ± 10.64 131 ± 19.48 236 ± 17.29 55.16 ± 5.74 2055.80 ± 47.25 4.60 ± 1.34 0.22 ± 0.07Mid dose 1000 119 ± 8.44 122 ± 13.13 240 ± 20.44 50.52 ± 1.74 2009.00 ± 30.49 5.00 ± 1.58 0.25 ± 0.08High dose 2500 118 ± 21.92 116 ± 9.50 234 ± 20.16 49.88 ± 5.94 2051.40 ± 87.25 5.60 ± 2.07 0.28 ± 0.11
Values are mean ± SD from five rats in each group; NCE = normochromatic erythrocytes; PEC = polychromatic erythrocytes; TE = total number of erythrocytes;MNPCE = micronucleated polychromatic erythrocytes.* Statistically significant compared to the control group (p < 0.05).
S.C. Kothari et al. / Food and Chemical Toxicology 69 (2014) 120–131 127
changes included: at Day 15 significant increase in ALT and ALP(mid-dose male group), decrease in creatinine (low-dose malegroup), increase in calcium (high-dose male group), decrease insodium (mid- and high-dose male group), increase in potassium(high-dose male group), increase in ALP (low-dose female group),increase in cholinesterase, total protein, chloride (high-dose femalegroup), and increase in potassium (mide-dose female group). AtDay 45 sampling, the statistically significant changes noted were:increase in sodium (all treated male groups), increases in glucose,total protein, chloride and albumin (high-dose female group),decrease in phosphorus (low-dose female group), and decrease inpotassium (mid- and high-dose female groups). At Day 91 sam-pling the changes noted were increase in sodium (mid- and high-dose male group), decrease in calcium (low-dose female group),and increase in GGT (high-dose female group). There were no otherstatistically significant differences when the control and treatmentgroups were compared. The above noted significant changes fol-lowing the administration of D. glomerata extract were notobserved in both sexes, lacked correlating changes in other clinicalparameters, were of small magnitude, were not noted in a dose- ortime-related manner, or were not associated with microscopic
changes in the related organs and hence they were considered asincidental changes/biological variations and not treatment-relatedadverse effects.
3.1.3.3. Urinalysis. As compared to control group, treatment of ratswith D. glomerata extract at dose levels of 0, 100, 1000, and2500 mg/kg bw/day for 90 consecutive days did not reveal anyadverse effects on urinalysis parameters in male and female rats(data not shown). The urinalysis parameters (physical, chemical,microscopic) did not reveal any statistical difference or physiolog-ical abnormalities in males and females in the control and treat-ment groups. There were no significant differences in any of theparameters between control and treatment groups.
3.1.4. Organ weightsThe changes noted in organ weights following treatment with
D. glomerata extract at dose levels of 0, 100, 1000 and 2500 mg/kg bw/day for 90-days are summarized in Table 6. As comparedto control group, no toxicologically significant changes in organweights were noted in absolute (Table 6) and relative organweights (data not shown). However, statistically significant
128 S.C. Kothari et al. / Food and Chemical Toxicology 69 (2014) 120–131
decreases in absolute and relative spleen weight in mid-dose andhigh-dose female rat groups, increases in absolute and relative thy-roid and parathyroid weight in mid-dose female group anddecrease in relative ovaries weight in mid-dose female groupwas noted. These changes in organ weight were considered as inci-dental due to lack of dose-dependency and lack of correlatingchanges in clinical chemistry and histopathology.
3.1.5. PathologyAt the scheduled necropsy (day 91), there were no treatment-
related gross pathological observations in any of the groups of ratsfollowing administration of the D. glomerata extract to rats. Theincidental gross finding included increase in size of thymus inone male at low dose and reduced size of left testis in one maleat high dose group. All macroscopic findings were considered tobe spontaneous and/or incidental in nature, without dose-relatedtrend, and without histopathological abnormality. There were notreatment-related histopathological findings recorded in any group(data not shown). In the male rats, incidence of suppurative bron-chopneumonia was seemingly increased in a dose-dependentmanner (control, 0/20; low, 1/20; middle, 1/20, high, 4/20). Theseverity of the bronchopneumonia is found to be minimal to mild,focal to mutlifocal and not dose dependent. As it is not dose-related, observed in only one sex, and was within historical controldata the suppurative bronchopneumonia is not treatment relatedand can be considered as an incidental finding. The incidence andseverity (individual data not shown) of histopathological findingsfollowing treatment with D. glomerata extract noted during thestudy were considered as spontaneous and incidental to rats of thisparticular strain and age. The severity of the bronchopneumonia isfound to be minimal to mild, focal to multifocal and not dose-dependent. As it is not dose-related, observed in only one sex,and was within historical control data, the suppurative broncho-pneumonia is not treatment related and can be considered as anincidental finding.
3.2. Mutagenicity study
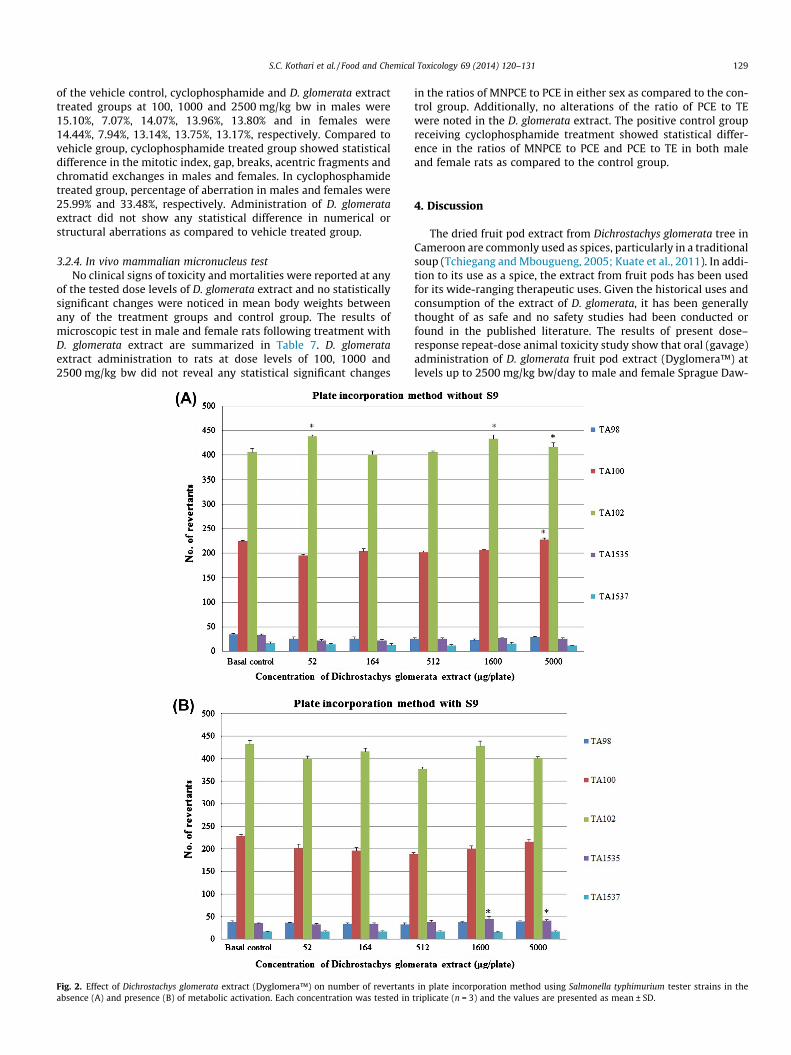
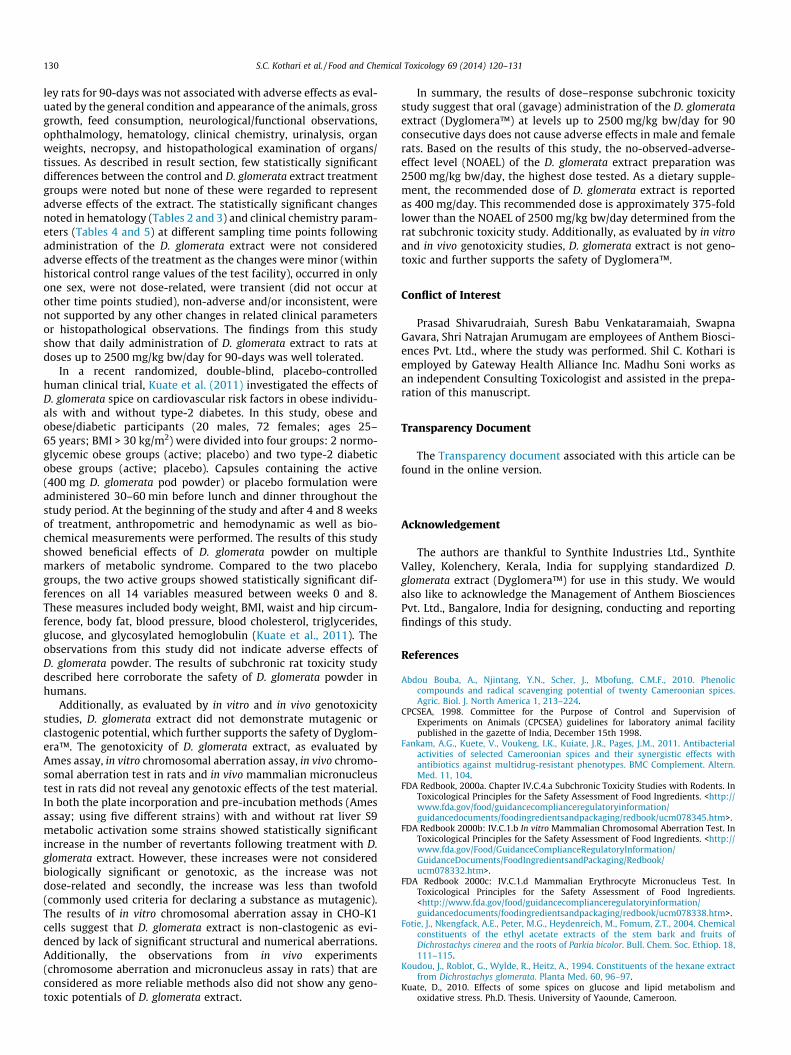
3.2.1. Bacterial reverse mutation testIn both the plate incorporation and pre-incubation methods, no
precipitation or cytotoxicity was noted at the tested concentra-tions. In the plate incorporation assay without rat liver S9 meta-bolic activation, treatment of S. typhimurium strains TA98,TA1535 and TA1537 with D. glomerata extract did not reveal anybiological or statistical significant changes in revertants at any ofthe exposure levels (Fig. 2 A). Other strains TA100 (at 5000 lg/plate) and TA102 (at 52, 1600 and 5000 lg/plate) did show statis-tically significant increases in number of revertants. However, nodose-dependent increase in revertants was noted at the tested con-centrations. In the plate incorporation assay with metabolic activa-tion (S9), no statistical significance was observed with S.
Fig. 1. Effect of Dichrostachys glomerata extract (Dyglomera™) on body weights in male(gavage) toxicity study. The values are presented as mean ± SD (20 rats/sex/group).
typhimurium strains TA98, TA100, TA102 and TA1537 (Fig. 2B). InTA1535 strain at exposure concentrations of 1600 and 5000 lg/plate, statistically significant increase in revertant colonies wasnoted. However, there was a lack of dose–response and theincreases were less than twofold.
In the pre-incubation method, the study without rat liver S9metabolic activation exhibited no statistically significant increasein the number of revertants with the S. typhimurium strainsTA98, TA100, TA1535 and TA1537 at any of the concentrationstested. In strain TA102 statistically significant increase in the num-ber of revertants was noted at all concentrations. However, theincreases in revertants in TA102 were not dose-related. In theabsence of any dose–response, D. glomerata was not consideredas mutagenic or toxic. In the pre-incubation assay with metabolicactivation (S9), no statistically significant increase in revertantswas noted with S. typhimurium strains TA100 and TA1537. In otherstrains, at few exposure concentrations, statistically significantincrease in revertants were noted in TA98 (at 5000 lg/plate),TA102 (at 5000 lg/plate) and TA1535 (at 1568 lg/plate). However,the changes were not dose-related. The results from plate incorpo-ration and pre-incubation methods suggest that D. glomerataextract is not mutagenic under the conditions of this study.
3.2.2. In vitro chromosomal aberration testIn these experiments, the control group showed chromatid gap
(1 no), chromosome gap (1 no) and the resultant mitotic indices inthe presence and absence of S9 were 28.48% and 31.53%, respec-tively. As expected the positive control groups (G2a and G2b)CHO-K1 cells treated with cyclophosphamide in the presence ofS9 and mitomycin in the absence of S9 showed significant struc-tural and numerical chromosome aberrations. The mitotic indexand percentage of aberration in the positive control group G2a,was 15.38% and 62%, respectively, while in the group G2b it was17.96% and 70% respectively. Exposure of CHO-K1 cells to D. glom-erata extract at 0.1, 0.05 or 0.025 mg/mL (G3) in the presence orabsence of S9 did not reveal any significant changes structuraland numerical chromosome aberrations as compared to vehiclecontrol group. Similarly, as compared to vehicle control group,treatment with D. glomerata extract did not significantly affectmitotic index in of the treatment group. The results of this studysuggest lack of genotoxic effects of D. glomerata extract.
3.2.3. In vivo chromosomal aberration testThe administration of D. glomerata extract at dose levels of 100,
1000 and 2500 mg/kg bw to rats did not reveal any signs of clinicaltoxicity and mortalities. Compared to the control group of rats,there were no statistically significant changes in mean bodyweights in the treatment groups (data not shown). The microscopicevaluations of all slides, including those of positive and negativecontrols, for structural and numerical aberration were performedfor 100 well spread metaphases per animal. Average mitotic index
and female rats. Mean body weights for male and female rats during a 90-day oral
S.C. Kothari et al. / Food and Chemical Toxicology 69 (2014) 120–131 129
of the vehicle control, cyclophosphamide and D. glomerata extracttreated groups at 100, 1000 and 2500 mg/kg bw in males were15.10%, 7.07%, 14.07%, 13.96%, 13.80% and in females were14.44%, 7.94%, 13.14%, 13.75%, 13.17%, respectively. Compared tovehicle group, cyclophosphamide treated group showed statisticaldifference in the mitotic index, gap, breaks, acentric fragments andchromatid exchanges in males and females. In cyclophosphamidetreated group, percentage of aberration in males and females were25.99% and 33.48%, respectively. Administration of D. glomerataextract did not show any statistical difference in numerical orstructural aberrations as compared to vehicle treated group.
3.2.4. In vivo mammalian micronucleus testNo clinical signs of toxicity and mortalities were reported at any
of the tested dose levels of D. glomerata extract and no statisticallysignificant changes were noticed in mean body weights betweenany of the treatment groups and control group. The results ofmicroscopic test in male and female rats following treatment withD. glomerata extract are summarized in Table 7. D. glomerataextract administration to rats at dose levels of 100, 1000 and2500 mg/kg bw did not reveal any statistical significant changes
Fig. 2. Effect of Dichrostachys glomerata extract (Dyglomera™) on number of revertantsabsence (A) and presence (B) of metabolic activation. Each concentration was tested in
in the ratios of MNPCE to PCE in either sex as compared to the con-trol group. Additionally, no alterations of the ratio of PCE to TEwere noted in the D. glomerata extract. The positive control groupreceiving cyclophosphamide treatment showed statistical differ-ence in the ratios of MNPCE to PCE and PCE to TE in both maleand female rats as compared to the control group.
4. Discussion
The dried fruit pod extract from Dichrostachys glomerata tree inCameroon are commonly used as spices, particularly in a traditionalsoup (Tchiegang and Mbougueng, 2005; Kuate et al., 2011). In addi-tion to its use as a spice, the extract from fruit pods has been usedfor its wide-ranging therapeutic uses. Given the historical uses andconsumption of the extract of D. glomerata, it has been generallythought of as safe and no safety studies had been conducted orfound in the published literature. The results of present dose–response repeat-dose animal toxicity study show that oral (gavage)administration of D. glomerata fruit pod extract (Dyglomera™) atlevels up to 2500 mg/kg bw/day to male and female Sprague Daw-
in plate incorporation method using Salmonella typhimurium tester strains in thetriplicate (n = 3) and the values are presented as mean ± SD.
130 S.C. Kothari et al. / Food and Chemical Toxicology 69 (2014) 120–131
ley rats for 90-days was not associated with adverse effects as eval-uated by the general condition and appearance of the animals, grossgrowth, feed consumption, neurological/functional observations,ophthalmology, hematology, clinical chemistry, urinalysis, organweights, necropsy, and histopathological examination of organs/tissues. As described in result section, few statistically significantdifferences between the control and D. glomerata extract treatmentgroups were noted but none of these were regarded to representadverse effects of the extract. The statistically significant changesnoted in hematology (Tables 2 and 3) and clinical chemistry param-eters (Tables 4 and 5) at different sampling time points followingadministration of the D. glomerata extract were not consideredadverse effects of the treatment as the changes were minor (withinhistorical control range values of the test facility), occurred in onlyone sex, were not dose-related, were transient (did not occur atother time points studied), non-adverse and/or inconsistent, werenot supported by any other changes in related clinical parametersor histopathological observations. The findings from this studyshow that daily administration of D. glomerata extract to rats atdoses up to 2500 mg/kg bw/day for 90-days was well tolerated.
In a recent randomized, double-blind, placebo-controlledhuman clinical trial, Kuate et al. (2011) investigated the effects ofD. glomerata spice on cardiovascular risk factors in obese individu-als with and without type-2 diabetes. In this study, obese andobese/diabetic participants (20 males, 72 females; ages 25–65 years; BMI > 30 kg/m2) were divided into four groups: 2 normo-glycemic obese groups (active; placebo) and two type-2 diabeticobese groups (active; placebo). Capsules containing the active(400 mg D. glomerata pod powder) or placebo formulation wereadministered 30–60 min before lunch and dinner throughout thestudy period. At the beginning of the study and after 4 and 8 weeksof treatment, anthropometric and hemodynamic as well as bio-chemical measurements were performed. The results of this studyshowed beneficial effects of D. glomerata powder on multiplemarkers of metabolic syndrome. Compared to the two placebogroups, the two active groups showed statistically significant dif-ferences on all 14 variables measured between weeks 0 and 8.These measures included body weight, BMI, waist and hip circum-ference, body fat, blood pressure, blood cholesterol, triglycerides,glucose, and glycosylated hemoglobulin (Kuate et al., 2011). Theobservations from this study did not indicate adverse effects ofD. glomerata powder. The results of subchronic rat toxicity studydescribed here corroborate the safety of D. glomerata powder inhumans.
Additionally, as evaluated by in vitro and in vivo genotoxicitystudies, D. glomerata extract did not demonstrate mutagenic orclastogenic potential, which further supports the safety of Dyglom-era™. The genotoxicity of D. glomerata extract, as evaluated byAmes assay, in vitro chromosomal aberration assay, in vivo chromo-somal aberration test in rats and in vivo mammalian micronucleustest in rats did not reveal any genotoxic effects of the test material.In both the plate incorporation and pre-incubation methods (Amesassay; using five different strains) with and without rat liver S9metabolic activation some strains showed statistically significantincrease in the number of revertants following treatment with D.glomerata extract. However, these increases were not consideredbiologically significant or genotoxic, as the increase was notdose-related and secondly, the increase was less than twofold(commonly used criteria for declaring a substance as mutagenic).The results of in vitro chromosomal aberration assay in CHO-K1cells suggest that D. glomerata extract is non-clastogenic as evi-denced by lack of significant structural and numerical aberrations.Additionally, the observations from in vivo experiments(chromosome aberration and micronucleus assay in rats) that areconsidered as more reliable methods also did not show any geno-toxic potentials of D. glomerata extract.
In summary, the results of dose–response subchronic toxicitystudy suggest that oral (gavage) administration of the D. glomerataextract (Dyglomera™) at levels up to 2500 mg/kg bw/day for 90consecutive days does not cause adverse effects in male and femalerats. Based on the results of this study, the no-observed-adverse-effect level (NOAEL) of the D. glomerata extract preparation was2500 mg/kg bw/day, the highest dose tested. As a dietary supple-ment, the recommended dose of D. glomerata extract is reportedas 400 mg/day. This recommended dose is approximately 375-foldlower than the NOAEL of 2500 mg/kg bw/day determined from therat subchronic toxicity study. Additionally, as evaluated by in vitroand in vivo genotoxicity studies, D. glomerata extract is not geno-toxic and further supports the safety of Dyglomera™.
Conflict of Interest
Prasad Shivarudraiah, Suresh Babu Venkataramaiah, SwapnaGavara, Shri Natrajan Arumugam are employees of Anthem Biosci-ences Pvt. Ltd., where the study was performed. Shil C. Kothari isemployed by Gateway Health Alliance Inc. Madhu Soni works asan independent Consulting Toxicologist and assisted in the prepa-ration of this manuscript.
Transparency Document
The Transparency document associated with this article can befound in the online version.
Acknowledgement
The authors are thankful to Synthite Industries Ltd., SynthiteValley, Kolenchery, Kerala, India for supplying standardized D.glomerata extract (Dyglomera™) for use in this study. We wouldalso like to acknowledge the Management of Anthem BiosciencesPvt. Ltd., Bangalore, India for designing, conducting and reportingfindings of this study.
References
Abdou Bouba, A., Njintang, Y.N., Scher, J., Mbofung, C.M.F., 2010. Phenoliccompounds and radical scavenging potential of twenty Cameroonian spices.Agric. Biol. J. North America 1, 213–224.
CPCSEA, 1998. Committee for the Purpose of Control and Supervision ofExperiments on Animals (CPCSEA) guidelines for laboratory animal facilitypublished in the gazette of India, December 15th 1998.
Fankam, A.G., Kuete, V., Voukeng, I.K., Kuiate, J.R., Pages, J.M., 2011. Antibacterialactivities of selected Cameroonian spices and their synergistic effects withantibiotics against multidrug-resistant phenotypes. BMC Complement. Altern.Med. 11, 104.
FDA Redbook, 2000a. Chapter IV.C.4.a Subchronic Toxicity Studies with Rodents. InToxicological Principles for the Safety Assessment of Food Ingredients. <http://www.fda.gov/food/guidancecomplianceregulatoryinformation/guidancedocuments/foodingredientsandpackaging/redbook/ucm078345.htm>.
FDA Redbook 2000b: IV.C.1.b In vitro Mammalian Chromosomal Aberration Test. InToxicological Principles for the Safety Assessment of Food Ingredients. <http://www.fda.gov/Food/GuidanceComplianceRegulatoryInformation/GuidanceDocuments/FoodIngredientsandPackaging/Redbook/ucm078332.htm>.
FDA Redbook 2000c: IV.C.1.d Mammalian Erythrocyte Micronucleus Test. InToxicological Principles for the Safety Assessment of Food Ingredients.<http://www.fda.gov/food/guidancecomplianceregulatoryinformation/guidancedocuments/foodingredientsandpackaging/redbook/ucm078338.htm>.
Fotie, J., Nkengfack, A.E., Peter, M.G., Heydenreich, M., Fomum, Z.T., 2004. Chemicalconstituents of the ethyl acetate extracts of the stem bark and fruits ofDichrostachys cinerea and the roots of Parkia bicolor. Bull. Chem. Soc. Ethiop. 18,111–115.
Koudou, J., Roblot, G., Wylde, R., Heitz, A., 1994. Constituents of the hexane extractfrom Dichrostachys glomerata. Planta Med. 60, 96–97.
Kuate, D., 2010. Effects of some spices on glucose and lipid metabolism andoxidative stress. Ph.D. Thesis. University of Yaounde, Cameroon.

S.C. Kothari et al. / Food and Chemical Toxicology 69 (2014) 120–131 131
Kuate, D., Etoundi, B.C.O., Soukontoua, Y.B., Ngondi, J.L., Oben, J.E., 2010. Antioxidantcharacteristics of Dichrostachys glomerata spice extracts. CyTA – J. Food 8, 23–37.
Kuate, D., Etoundi, B.C., Ngondi, J.L., Oben, J.E., 2011. Effects of Dichrostachysglomerata spice on cardiovascular diseases risk factors in normoglycemic andtype 2 diabetic obese volunteers. Food Res. Int. 44 (5), 1197–1202.
Swierenga, S.H.H., Heddle, J.A., Sigal, E.A., Gilman, J.P.W., Brillinger, R.L., Douglas,G.R., Nestmann, E.R., 1991. Recommended protocols based on a survey of
current practice in genotoxicity testing laboratories, IV. Chromosomeaberration and sister-chromatid exchange in Chinese hamster ovary, V79Chinese hamster lung and human lymphocyte cultures. Mutat. Res. 246, 301–322.
Tchiegang, C., Mbougueng, P.D., 2005. Chemical composition of spices used in thecooking of nah poh and nkui of western Cameroon. Tropicultura 23, 193–200.