toxicologic pathology -...
TRANSCRIPT
http://tpx.sagepub.com/Toxicologic Pathology
http://tpx.sagepub.com/content/40/7/1049The online version of this article can be found at:
DOI: 10.1177/0192623312444765
2012 40: 1049 originally published online 11 May 2012Toxicol PatholKristel Buyens and Ann Lampo
Petra Vinken, Sofie Starckx, Erio Barale-Thomas, Adriana Looszova, Manisha Sonee, Nick Goeminne, Loes Versmissen,Tissue Kim-1 and Urinary Clusterin as Early Indicators of Cisplatin-Induced Acute Kidney Injury in Rats
Published by:
http://www.sagepublications.com
On behalf of:
Society of Toxicologic Pathology
can be found at:Toxicologic PathologyAdditional services and information for
http://tpx.sagepub.com/cgi/alertsEmail Alerts:
http://tpx.sagepub.com/subscriptionsSubscriptions:
http://www.sagepub.com/journalsReprints.navReprints:
http://www.sagepub.com/journalsPermissions.navPermissions:
What is This?
- May 11, 2012OnlineFirst Version of Record
- Sep 27, 2012Version of Record >>
at NATIONAL CHUNG HSING UNIV on May 25, 2013tpx.sagepub.comDownloaded from
Tissue Kim-1 and Urinary Clusterin as Early Indicators ofCisplatin-Induced Acute Kidney Injury in Rats
PETRA VINKEN1, SOFIE STARCKX
1, ERIO BARALE-THOMAS1, ADRIANA LOOSZOVA
1, MANISHA SONEE2, NICK GOEMINNE
1,
LOES VERSMISSEN1, KRISTEL BUYENS
1, AND ANN LAMPO1
1Drug Safety Sciences, Janssen Research & Development, a division of Janssen Pharmaceutica N.V., Beerse, Belgium2Drug Safety Sciences, Janssen Research and Development, L.L.C., Raritan, New Jersey, USA
ABSTRACT
The kidney is one of the main targets of drug toxicity, and early detection of renal damage is critical in preclinical drug development. A model of
cisplatin-induced nephrotoxicity in male Sprague Dawley rats treated for 1, 3, 5, 7, or 14 days at 1 mg/kg/day was used to monitor the spatial and
temporal expression of various indicators of kidney toxicity during the progression of acute kidney injury (AKI). As early as 1 day after cisplatin
treatment, positive kidney injury molecule-1 (Kim-1) immunostaining, observed in the outer medulla of the kidney, and changes in urinary clusterin
indicated the onset of proximal tubular injury in the absence of functional effects. After 3 days of treatment, Kim-1 protein levels in urine increased
more than 20-fold concomitant with a positive clusterin immunostaining and an increase in urinary osteopontin. Tubular basophilia was also noted,
while serum creatinine and blood urea nitrogen levels were elevated only after 5 days, together with tubular degeneration. In conclusion, tissue Kim-1
and urinary clusterin were the most sensitive biomarkers for detection of cisplatin-induced kidney damage. Thereafter, urinary Kim-1 and osteopon-
tin, as well as clusterin immunostaining accurately correlated with the histopathological findings. When AKI is suspected in preclinical rat studies,
Kim-1, clusterin, and osteopontin should be part of urinalysis and/or IHC can be performed.
Keywords: nephrotoxicity; biomarker; Kim-1; clusterin; rat; urinalysis; immunohistochemistry; cisplatin.
INTRODUCTION
Proximal tubular injury due to drug-induced nephrotoxicity
occurs more frequently than other nephrotoxic effects, reflecting
the high number of xenobiotics that are reabsorbed and excreted
within the proximal tubule. The evaluation of nephrotoxicity is
therefore important for determination of the safety of drug candi-
dates. In addition to several urinary tests (e.g., urine density, dip-
stick analysis, and microscopy of urine sediment), blood urea
nitrogen (BUN) and serum creatinine are the traditional clinical
pathology markers for detecting kidney injury. Neither markers
are, however, very specific nor very sensitive, as there is usually
a significant loss of renal function and renal mass before BUN and
creatinine increase. Furthermore, their levels are also affected by
a range of other parameters, as the synthesis and release of BUN
into the blood depends on protein intake, catabolism, and liver
function, whereas serum creatinine levels depend on muscle
mass, age, and dehydration status.
It is therefore clear that there is a need for more specific and
sensitive biomarkers not only in clinical settings but also in pre-
clinical development, allowing early detection of potential
nephrotoxic drug candidates. In recent years, collaborative
cross-pharma projects, also involving regulatory agencies,
have delivered new tools for improved assessment of nephro-
toxicity, but also for improved clinical care and increased diag-
nostic performance (Dieterle et al. 2008, 2010; Vaidya et al;
2010). The Predictive Safety Testing Consortium (PSTC),
organized by the Critical Path Institute (C-Path), qualified a
‘‘kidney biomarker panel,’’ including Kim-1, clusterin, albu-
min, total protein, b2-microglobulin, cystatin C, and trefoil fac-
tor 3 (TFF3) in urine that was approved by the FDA and
EMEA in the context of nonclinical drug development (FDA
2008; EMEA 2008). In addition, renal papillary antigen-1
(RPA-1) was qualified by the ILSI/HESI consortium as urinary
biomarker for the detection of renal collecting duct injury in
male rats (EMA 2010). Other urinary renal safety biomarkers
such as osteopontin, neutrophil gelatinase-associated lipocalin
(NGAL), and a-gluthathione-S-transferase (a-GST) have been
described in recent literature (Gautier et al. 2010; Haase et al.
2009; Yang et al. 2007) as associated with renal injury.
Some of these novel biomarkers can also be useful in other
preclinical species than the rat, like Kim-1 mRNA, described as
a predictive biomarker for AKI in dogs at time points earlier
than serum creatinine (McDuffie et al. 2010). Furthermore, the
investigation of several of the above mentioned kidney biomar-
kers in dogs and nonhuman primates is an ongoing effort by the
PSTC.
Address correspondence to: Petra Vinken, Janssen Research &
Development, Drug Safety Sciences, Turnhoutseweg 30, B-2340 Beerse, Bel-
gium; e-mail: [email protected].
Abbreviations: AKI, acute kidney injury; a-GST, a-glutathione-S-
transferase; BUN, blood urea nitrogen; C, control group; C-Path, Critical
Path Institute; CDDP, cisplatin, or cis-diamminedichloroplatinum(II); EGF,
endothelial growth factor; ELISA, enzyme-linked immunosorbent assay;
EMEA, European Medicines Agency (EMA); FDA, U.S. Food and Drug
Administration; H&E, hematoxylin and eosin; HESI, Health and Environmen-
tal Sciences Institute; IHC, immunohistochemistry; ILSI, International Life
Sciences Institute; Kim-1, kidney injury molecule-1; NGAL, neutrophil
gelatinase-associated lipocalin/lipocalin-2; OSOM, outer stripe of the outer
medulla; PSTC, Predictive Safety Testing Consortium; RPA-1, renal papillary
antigen-1; SD, Sprague Dawley; TFF3, trefoil factor 3; VEGF, vascular
endothelial growth factor.
1049
Toxicologic Pathology, 40: 1049-1062, 2012
Copyright # 2012 by The Author(s)
ISSN: 0192-6233 print / 1533-1601 online
DOI: 10.1177/0192623312444765
at NATIONAL CHUNG HSING UNIV on May 25, 2013tpx.sagepub.comDownloaded from

The present study focuses on AKI in male Sprague Dawley
(SD) rats after administration of CDDP (cisplatin, or cis-diam-
minedichloroplatinum(II)), a well-established nephrotoxicant
that induces lesions in the renal proximal tubules and comprises
the spatio-temporal characterization of a set of urinary biomar-
kers compared with the traditional end points. Kim-1, clusterin,
NGAL, osteopontin, albumin, b2-microglobulin, a-GST, and
RPA-1 protein levels were analyzed in urine and/or kidney sam-
ples using a combination of ELISA-techniques, multiplex biolo-
gical assays, and immunohistochemical (IHC) staining.
MATERIALS AND METHODS
Statement of Ethical Approval
All animal experiments were performed in accordance with
the European (ETS No. 123; 2007) and Belgian (Belgian Law
1991) guidelines, and with the principles of euthanasia as stated
in the ‘‘AVMA Guidelines on Euthanasia’’ (AVMA 2007). The
experiment was approved by the Janssen Research & Develop-
ment Ethical Committee and conducted in an AAALAC-
approved facility.
Animals and Maintenance
Fifty male Sprague Dawley rats (Crl: CD (SD) IGS) of
approximately 5 weeks of age upon arrival were supplied by
Charles River Laboratories and acclimatized for 1 week before
the start of the experiment. They were group-housed (5 rats/
cage) in polysulphone cages with a wire-mesh roof under rou-
tine conditions of temperature, relative humidity, ventilation,
and illumination. A pelleted maintenance diet (Ssniff, Ger-
many) was available ad libitum with free and continuous access
to drinking water. Prior to blood sampling, during urine collec-
tion, and prior to terminal kill, animals had access to water but
were fasted (20 hr + 30 min).
Study Design
Prior to the start of treatment, the rats were randomly allo-
cated to each of the control or CDDP group. CDDP (Sigma-
Aldrich, Germany) was prepared in sterile saline at a concen-
tration of 1 mg/kg body weight and administered once daily via
the intraperitoneal route (ip) for 1, 3, 5, 7, or 14 days. Control
animals received sterile saline at the same volume dosage
according to the same schedule.
Urine and blood samples were collected once before start of
treatment, on days 1, 3, 5, 7, and 14. Urine samples were col-
lected on ice overnight during approximately 20 hr via
individual metabolic cages, aliquoted, and stored at approxi-
mately –80�C until analysis. Blood for clinical chemistry was
collected from fasted rats from the sublingual veins after iso-
flurane anesthesia. On days 1, 3, 5, 7, and 14, 5 treated and 5
control animals were euthanized. The study design is depicted
in Table 1.
Laboratory Tests
Urine samples were analyzed for the following parameters
using standard laboratory procedures: urine volume (measured
gravimetrically and corrected for specific gravity), specific
gravity (Urisys 2400, Roche Diagnostics, Switzerland), creati-
nine, total urinary protein, and urinary glucose (Hitachi Modu-
lar, Roche Diagnostics, Switzerland). a-GST and RPA-1 in
urine were evaluated via enzyme immunoassay with commer-
cial antibodies (Biotrin, Ireland). Commercially available Rat
ELISA kits for detection of b2-microglobulin and clusterin
were used (BioVendor Laboratory Medicine, Czech Republic).
Rat albumin, Kim-1, osteopontin, and NGAL were measured in
a multiplex assay, Rat Kidney Injury Panel 1, on a Sector Ima-
ger–type instrument (Meso Scale Discovery, United States).
Concentrations of urinary biomarkers were normalized to
urinary creatinine, which was shown not to change in this
study. Routine blood chemistry parameters, including BUN
and serum creatinine, were obtained utilizing a Hitachi-
Modular automated clinical chemistry analyzer and Roche
reagents (Roche Diagnostics, Switzerland). Creatinine clear-
ance was calculated from the creatinine concentration in the
collected urine sample, the urine flow rate (volume/min), and
the creatinine serum concentration, and corrected for body
weight.
Histology and IHC
On the day of necropsy, a complete physical examination
was performed and the body weight was recorded for all rats.
After anesthesia with isoflurane, they were euthanatized by
exsanguination via the carotid artery, and a necropsy was per-
formed where all macroscopic changes were recorded. The
brain and kidneys were weighed (the brain weights were used
to calculate the kidney to brain weight ratio) and sampled
together with all tissues showing macroscopic changes in
10% formalin.
Kidneys were processed routinely (trimming, embedding,
sectioning at 3–5 mm, and staining with hematoxylin and eosin
[H&E] histochemical stain).
TABLE 1.—Experimental design.
Treatment Rats: number per time point [total] Blood collection: days Urine collection: days Necropsy: days
Control 10 (5)a [25] (–1)b – 1 – 3 – 5 – 7 – 14 (–2)–(–1)b, 0–1, 2–3, 4–5, 6–7, 13–14 1 – 3 – 5 – 7 – 14
CDDP: 1 mg/kg/day ip 10 (5)a [25] (–1)b – 1 – 3 – 5 – 7 – 14 (–2)–(–1)b, 0–1, 2–3, 4–5, 6–7, 13–14 1 – 3 – 5 – 7 – 14
a N ¼ 10 for blood and urine collections on days 1, 3, 5, and 7; N ¼ 5 for histopathology on all time points and blood and urine samples on day 14.b Predose collection N ¼ 50.
1050 VINKEN ET AL. TOXICOLOGIC PATHOLOGY
at NATIONAL CHUNG HSING UNIV on May 25, 2013tpx.sagepub.comDownloaded from
Additional sections of kidney fixed by immersion in 10%buffered formalin for 48 hr and embedded in paraffin were
prepared on silane-coated glass slides, and manually immu-
nostained for Kim-1 or clusterin detection. Briefly, for the
anti-Kim-1 antibody, after routine deparaffination and rehy-
dration through gradient ethanol immersions, the slides were
exposed to peroxidase-blocking solution (Dako, Denmark),
then avidin and biotin blocking solutions (Dako, Denmark)
according to the manufacturer. Then, normal horse serum
(Vector Laboratories, USA) at 1/10 was applied for 30 min
at 4�C, and the primary antibody (TIM/KIM-1, ref. AF3689,
R&D Systems, USA) at 3 mg/ml was incubated for 2 hr at
4�C, a horse anti-goat biotinylated secondary antibody
(Vector Laboratories, USA) was incubated at 1/200 for 30
min at room temperature, an avidine-biotine complex (VEC-
TASTAIN Elite ABC Kit, Vector Laboratories, USA) was
applied. Diaminobenzidine (Liquid DABþ, Dako, Denmark)
was used as chromogen, Mayer’s hematoxylin as counter-
stain, then the slides were dehydrated and coverslipped with
a synthetic mounting media. The buffer used in all steps
was TBS (prepared in the laboratory). For the anti-
clusterin antibody (Clusterin [H-330], ref. sc-8354, Santa
Cruz Biotechnology Inc., USA), the protocol was similar
except that the blocking steps were preceded by a heat-
induced epitope retrieval step (microwave technique with
Target Retrieval, pH 9, Dako, Denmark: 3 min at 600 W,
then 2 � 5 min at 180 W), the primary anti-clusterin anti-
body was incubated for 1 hr at room temperature, and PBS
(Invitrogen, USA) was used as buffer. A secondary antibody
control (Burry 2011) was performed by eliminating the pri-
mary antibody (‘‘negative control’’).
Organ weight and gross and histopathology data were captured
with the PathData system (PDS Preclinical Data Systems, Inc.,
USA) for statistical analysis and reporting. A pathologist per-
formed the assessment of each animal and recorded the findings
with a qualitative scale of 5 grades (minimal, slight, moderate,
marked, severe) indicating either an increase in the number of cells
affected or in the distribution of the finding, or an increase in the
staining intensity, particularly for the IHC stains. The individual
findings and their grades were then compiled in Tables 6 to 8.
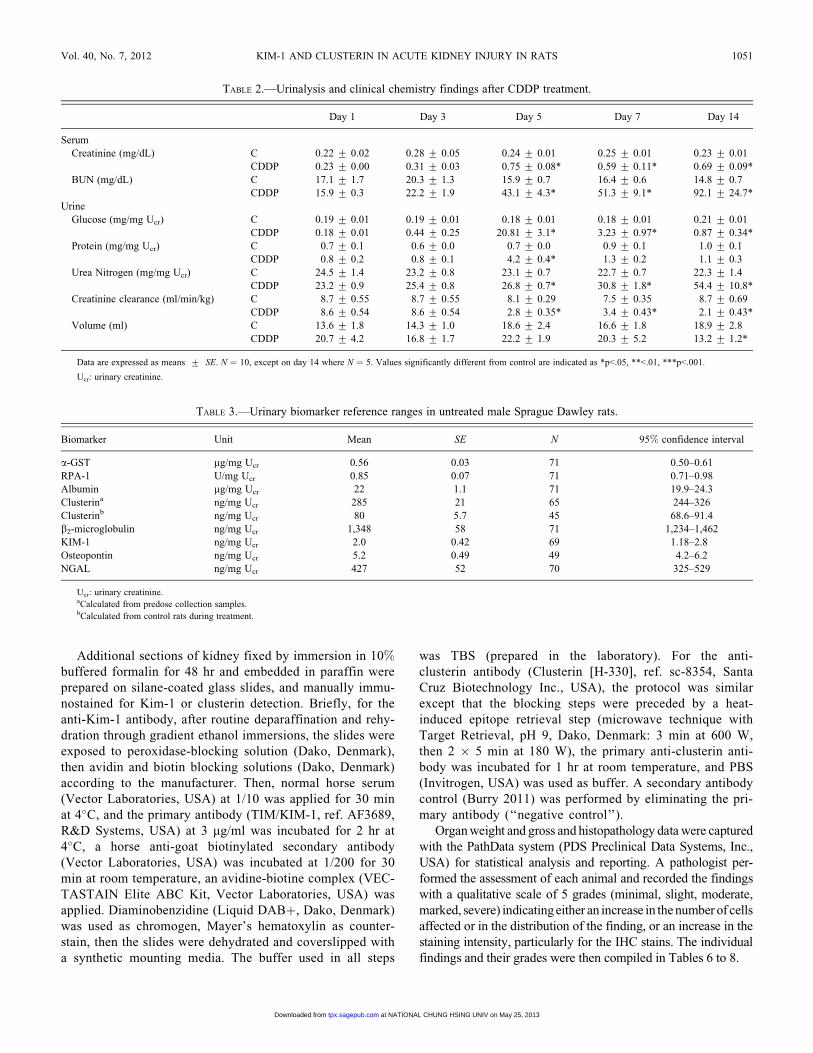
TABLE 2.—Urinalysis and clinical chemistry findings after CDDP treatment.
Day 1 Day 3 Day 5 Day 7 Day 14
Serum
Creatinine (mg/dL) C 0.22 + 0.02 0.28 + 0.05 0.24 + 0.01 0.25 + 0.01 0.23 + 0.01
CDDP 0.23 + 0.00 0.31 + 0.03 0.75 + 0.08* 0.59 + 0.11* 0.69 + 0.09*
BUN (mg/dL) C 17.1 + 1.7 20.3 + 1.3 15.9 + 0.7 16.4 + 0.6 14.8 + 0.7
CDDP 15.9 + 0.3 22.2 + 1.9 43.1 + 4.3* 51.3 + 9.1* 92.1 + 24.7*
Urine
Glucose (mg/mg Ucr) C 0.19 + 0.01 0.19 + 0.01 0.18 + 0.01 0.18 + 0.01 0.21 + 0.01
CDDP 0.18 + 0.01 0.44 + 0.25 20.81 + 3.1* 3.23 + 0.97* 0.87 + 0.34*
Protein (mg/mg Ucr) C 0.7 + 0.1 0.6 + 0.0 0.7 + 0.0 0.9 + 0.1 1.0 + 0.1
CDDP 0.8 + 0.2 0.8 + 0.1 4.2 + 0.4* 1.3 + 0.2 1.1 + 0.3
Urea Nitrogen (mg/mg Ucr) C 24.5 + 1.4 23.2 + 0.8 23.1 + 0.7 22.7 + 0.7 22.3 + 1.4
CDDP 23.2 + 0.9 25.4 + 0.8 26.8 + 0.7* 30.8 + 1.8* 54.4 + 10.8*
Creatinine clearance (ml/min/kg) C 8.7 + 0.55 8.7 + 0.55 8.1 + 0.29 7.5 + 0.35 8.7 + 0.69
CDDP 8.6 + 0.54 8.6 + 0.54 2.8 + 0.35* 3.4 + 0.43* 2.1 + 0.43*
Volume (ml) C 13.6 + 1.8 14.3 + 1.0 18.6 + 2.4 16.6 + 1.8 18.9 + 2.8
CDDP 20.7 + 4.2 16.8 + 1.7 22.2 + 1.9 20.3 + 5.2 13.2 + 1.2*
Data are expressed as means + SE. N ¼ 10, except on day 14 where N ¼ 5. Values significantly different from control are indicated as *p<.05, **<.01, ***p<.001.
Ucr: urinary creatinine.
TABLE 3.—Urinary biomarker reference ranges in untreated male Sprague Dawley rats.
Biomarker Unit Mean SE N 95% confidence interval
a-GST mg/mg Ucr 0.56 0.03 71 0.50–0.61
RPA-1 U/mg Ucr 0.85 0.07 71 0.71–0.98
Albumin mg/mg Ucr 22 1.1 71 19.9–24.3
Clusterina ng/mg Ucr 285 21 65 244–326
Clusterinb ng/mg Ucr 80 5.7 45 68.6–91.4
b2-microglobulin ng/mg Ucr 1,348 58 71 1,234–1,462
KIM-1 ng/mg Ucr 2.0 0.42 69 1.18–2.8
Osteopontin ng/mg Ucr 5.2 0.49 49 4.2–6.2
NGAL ng/mg Ucr 427 52 70 325–529
Ucr: urinary creatinine.aCalculated from predose collection samples.bCalculated from control rats during treatment.
Vol. 40, No. 7, 2012 KIM-1 AND CLUSTERIN IN ACUTE KIDNEY INJURY IN RATS 1051
at NATIONAL CHUNG HSING UNIV on May 25, 2013tpx.sagepub.comDownloaded from

Statistical Analysis
Routine biochemistry and biomarker data were expressed as
means + standard error (SE). The significance of differences
between the CDDP-dosed group and the control group was
assessed by the Mann-Whitney U-test for pairwise comparison
(Siegel and Castellan 1988) (two-tailed with correction for
ties). Fold-changes of serum and urinary biomarkers results
were expressed versus time matched controls. Kidney weights
were expressed as means + standard deviation, and analyzed
by the closed Dunn’s test (Dunn 1964). Values significantly
FIGURE 1.—Analysis of serum (creatinine, BUN) and urinary (glucose, total protein, albumin, RPA-1,a-GST, NGAL,b2-microglobulin, clusterin, Kim-1,
and osteopontin) biomarkers in male SD rats treated with CDDP (1 mg/kg) for 1, 3, 5, 7, and 14 days. Parameters were also analyzed prior to CDDP treat-
ment on day –1 (predose). All urinary parameters are normalized to urinary creatinine. Data are expressed as means+ SE. N¼ 50 on day –1, N¼ 10 on
days 1,3, 5, and 7, N¼ 5 on day 14. Values significantly different from control are indicated as *p < .05, **p < .01, and ***p < .001 at each sampling point.
1052 VINKEN ET AL. TOXICOLOGIC PATHOLOGY
at NATIONAL CHUNG HSING UNIV on May 25, 2013tpx.sagepub.comDownloaded from
TA
BL
E4.—
Fin
albody
wei
ghts
and
kid
ney
wei
ghts
.
Day
of
trea
tmen
t1
35
714
Tre
atm
ent
CC
DD
PC
CD
DP
CC
DD
PC
CD
DP
CC
DD
P
Num
ber
of
anim
als
55
55
55
55
55
Body
wei
ght
(g)
260.4
+11.9
264.4
+7.5
268.4
+10.8
264.0
+11.1
291.4
+12.6
264.6
+17.1
303.6
+10.4
243.4
+18.6
315.2
+18.1
203.8
+18.1
%var
iati
on
from
concu
rren
t
contr
ol
1.5
–1.6
–9.2
–19.8
**
–35.3
**
Kid
ney
s(g
)2.0
6+
0.1
62.1
1+
0.1
52.0
5+
0.1
22.1
9+
0.1
62.2
3+
0.1
32.4
4+
0.2
12.3
0+
0.1
72.2
8+
0.3
32.3
7+
0.1
02.0
8+
0.3
5
%var
iati
on
from
concu
rren
t
contr
ol
2.4
36.9
89.2
4–0.8
7–12.2
8
Kid
ney
s(%
tobody
wei
ght)
0.7
9+
0.0
50.8
0+
0.0
60.7
6+
0.0
30.8
3+
0.0
40.7
7+
0.0
30.9
3+
0.1
10.7
6+
0.0
60.9
4+
0.1
60.7
5+
0.0
61.0
3+
0.1
9
%var
iati
on
from
concu
rren
t
contr
ol
0.9
48.6
920.8
524.1
736.0
6
Kid
ney
s(%
tobra
in)
109.4
0+
5.3
8106.5
4+
10.4
9106.5
2+
6.8
9112.2
6+
5.1
6113.2
+6.1
1124.6
5+
12.5
3114.3
7+
8.8
9120.3
9+
9.2
5114.5
7+
4.6
7107.2
5+
18.3
8
%var
iati
on
from
concu
rren
t
contr
ol
–2.6
25.3
910.1
25.2
6–6.3
9
Val
ues
signif
ican
tly
dif
fere
nt
from
contr
ol
are
indic
ated
as*p<
.05,
**p<
.01,
***p<
.001.
at NATIONAL CHUNG HSING UNIV on May 25, 2013tpx.sagepub.comDownloaded from

different from control were indicated as *p < .05, **p < .01,
and ***p < .001.
RESULTS
Urinalysis and Serum Chemistry
After administration of CDDP at 1 mg/kg/day ip daily for up
to 14 days, the levels of nephrotoxicity biomarkers were
analyzed. Routine urinalysis and serum chemistry data are
shown in Table 2. Traditional measurements for detection of
renal damage were statistically (p < .05) increased from day 5
onward. Serum creatinine was increased by 2- to 3-fold on day
5, 7, and 14; and BUN showed a gradual increase from 3-fold
on day 5 up to 6-fold by day 14. Glucose was detected in urine
from day 5 onward (150-fold increase on day 5, 18-fold on day
7, and 5-fold on day 14, relative to controls), with no biologically
relevant alterations observed in serum glucose. Additionally on
day 5 and thereafter, creatinine clearance in CDDP-treated rats
was decreased to 24–40% of that in control rats, signaling
decreased renal functionality.
Analysis of Urinary Biomarkers
In control animals, urinary biomarker concentrations were
consistent with the predose data throughout the study, except
for RPA-1 and clusterin (Table 3). RPA-1 levels showed a gra-
dual increase in control rats during the 14-day period, whereas
clusterin levels in the control group were consistently lower
during the treatment period than for predose values (Figure 1).
Following repeated dosing with CDDP, the urinary concen-
trations of several biomarkers exhibited a time-related
increase, apparent from day 1 with an increase in clusterin,
urinary albumin, and NGAL. Clusterin in urine was increased
2- to 3-fold (p < .05) on day 1 and day 3 and 13-fold (p <
.001) on day 5 as compared with concurrent controls. There-
after clusterin levels declined but were still significantly
increased compared with control. Urinary albumin showed an
early and significant (p < .05) 3-fold increase in the CDDP
group on day 1, and although there was no measurable change
on day 3, remarkable increases of 73-, 29-, and 15-fold on day
5, 7, and 14, respectively, were observed. Increased urinary
protein levels were detected on day 5 only. Urinary NGAL was
increased in the CDDP dose group on day 1 (1.9-fold, p < .05)
and on days 5, 7, and 14 (up to 5.5-fold, p < .05) but did not
show a statistically significant increase on day 3.
The CDDP treated rats exhibited a marked elevation of urin-
ary Kim-1 in a time-dependent manner starting at day 3. Kim-1
exhibited a 22-, 60-, 57-, and 79-fold increase (p < .001)
compared with the control group on day 3, 5, 7, and 14, respec-
tively. An increase in urine osteopontin concentrations in urine
was detected after 3 days of treatment (3-fold increase, not sta-
tistically significant) and peaked on day 7 (18-fold increase, p <
.001) in the CDDP group, although the values remained mark-
edly elevated until the end of the study.
Urinary a-GST displayed a significant increase on day 5
(10-fold; p < .001) and day 7 (2-fold increase, p < .001) but
returned to baseline values comparable with control rats by day
14. Urinary b2-microglobulin was also increased on day 5 (2-
fold, p < .001) and on day 14 (2-fold, p < .01), but was compa-
rable with control levels on day 7.
No relevant treatment-related changes were observed for
RPA-1.
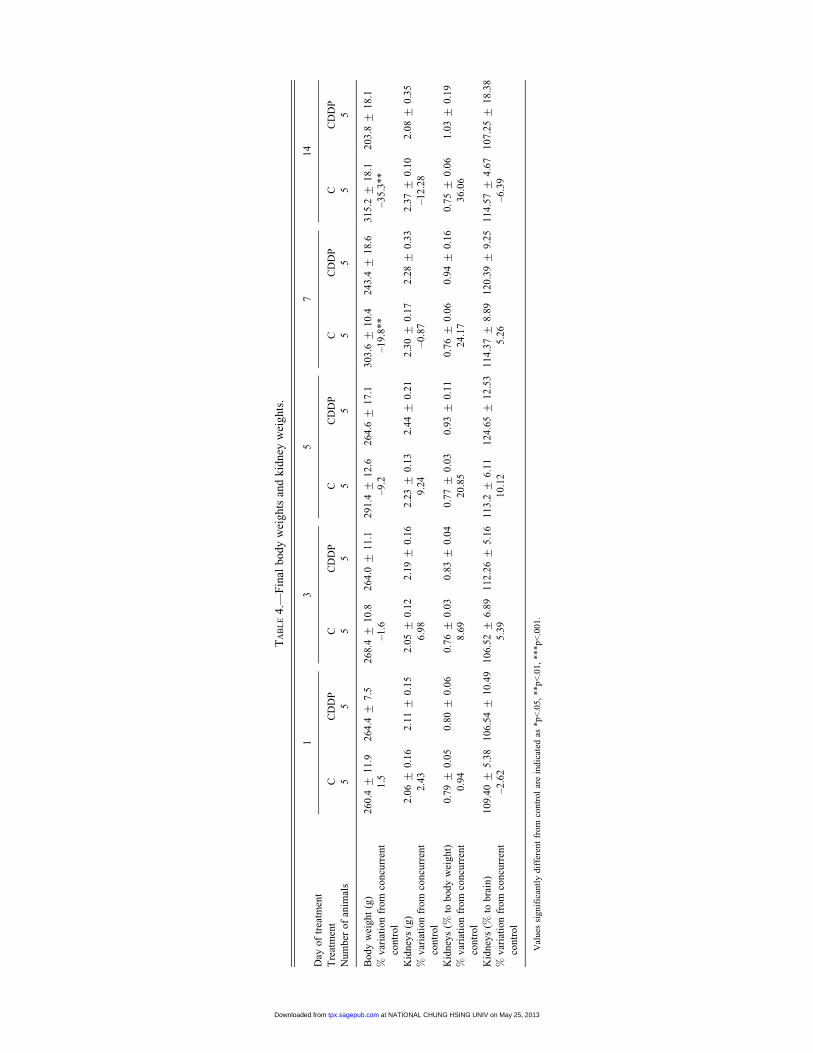
Body Weights, Organ Weights, Necropsy Findings
A toxicologically significant decrease in final body weights
in the groups dosed for 7 or 14 days with CDDP resulted in an
apparent increase in kidney to body weights (Table 4); as other
weight parameters were not modified, kidney weight change
was not considered toxicologically relevant. Pale discolora-
tions were noted in the kidney (Table 5), particularly at the cor-
ticomedullary junction, with an increasing incidence from day
5 to day 14. These findings are consistent with the histopatho-
logical changes seen in these groups (tubular dilatation, accu-
mulation of cell debris, and hyaline casts).
Histopathology Findings
No noteworthy findings were recorded in the control group
at any time point.
Microscopic examination of H&E slides showed typical
changes associated with CDDP administration (Yao et al.
2007) as shown in Figures 2 and 4. Table 6 presents the changes
recorded in relevant pathological processes. Tubular basophilia
with apoptosis in the pars recta of the proximal tubules (S3)
close to the outer stripe of the outer medulla (OSOM), of a min-
imal severity, was seen after 3 days of treatment. With
increased dosing duration, other degenerative changes were
noted: tubular giant cells, crowded basophilic nuclei with pro-
minent nucleoli and megalokaryosis, thickened basement
membrane in basophilic/degenerative tubules; tubular necrosis;
hyalin casts and cell debris/exfoliation in the lumen, tubular
dilatation. The incidence and severity of the changes increased
over time, and the distribution extended from the OSOM to the
medullary rays (straight tubules, then upper collecting ducts),
the cortex (proximal, S2 tubules), and the papilla (loop of
Henle, lower collecting ducts).
A minimal positive Kim-1 staining in the brush border of
cells of the pars recta was detected in the control animals.
In the treated animals, an increase of the specific staining
was seen first in the OSOM at day 1, as summarized in
Tables 7 and 8 and shown in Figures 3, 5, and 6. Its inten-
sity and extent increased with the treatment duration, in
close correlation with the histopathological changes. On day
1, the apical cytoplasm of OSOM tubular cells was stained
TABLE 5.—Macroscopic findings in CDDP-treated groups.
Day of treatment 1 3 5 7 14
Number of animals 5 5 5 5 5
Pale kidney 0 0 1 3 5
No animal from the concurrent control groups showed this macroscopic change.
1054 VINKEN ET AL. TOXICOLOGIC PATHOLOGY
at NATIONAL CHUNG HSING UNIV on May 25, 2013tpx.sagepub.comDownloaded from

(Figure 3B); in the later time points, all the cytoplasm and
the luminal debris were stained. Conversely, the loops of
Henle and collecting ducts in the papilla showed a positive
staining of luminal debris first, and a cytoplasmic staining
in later time points.
The clusterin staining followed a pattern similar to the Kim-
1 staining, except that there was no positive staining at day 1,
the staining was generally less intense, mainly luminal and
rarely cytoplasmic (and in only 1 animal at day 3), and less
areas were positively stained in the cortex and medulla,
although more areas were stained in the papilla (Figure 7).
The staining similarities between Kim-1 and clusterin were
exemplified in 2 animals: both markers correctly detected that
the severity of the findings of 1 animal dosed for 5 days was
lower than the mean of its group, while it was higher in 1 ani-
mal dosed for 3 days (however, the clusterin staining was less
intense than the Kim-1).
Overall, there was a close correlation between the kidney to
body weight increase (after dosing for 7 and 14 days), necropsy
findings (discoloration after dosing for 5, 7, and 14 days), and
microscopy (tubular and ductular degeneration to necrosis), in
relation to dose duration.
DISCUSSION
The purpose of this 2-week study was to evaluate the time
course of both newly qualified and traditional nephrotoxicity
biomarkers after repeated CDDP dosing in parallel with histo-
pathology assessments, in a well-characterized model of
nephrotoxicity in Sprague Dawley rats. Due to the number of
time points, and to reduce the number of animals included in
the study, it was decided to only use male rats. The animals
were dosed daily at 1 mg/kg/day for 1, 3, 5, 7, or 14 consecutive
days. The simultaneous collection of serum, urine, and kidney
samples allowed us to relate the response of biomarkers in
serum or urine to renal histopathology and IHC of specific
biomarkers.
Histologically, administration of CDDP resulted in the
expected kidney changes, namely degeneration and necrosis
FIGURE 2.—H&E stain. A (control) and B (CDDP, 1 day): no finding. C (CDDP, 3 days): basophilic tubules (Þ). D (CDDP, 7 days): tubular dila-
tion (Ł) and tubular cell debris. (¤). E (CDDP, 7 days): hyaline casts in collecting ducts (�). F (14 days): marked changes. 1: cortex; 2: OSOM;
3: inner stripe of the outer medulla; 4: pelvis; 5: inner medulla. Original magnification: 5�, bar ¼ 250 mm.
Vol. 40, No. 7, 2012 KIM-1 AND CLUSTERIN IN ACUTE KIDNEY INJURY IN RATS 1055
at NATIONAL CHUNG HSING UNIV on May 25, 2013tpx.sagepub.comDownloaded from

of the S3 segment of the renal proximal tubules (Yao et al.
2007), and confirmed the validity of our experiment.
We interpreted the minimally positive immunostaining seen
in control animals as a limited specific expression of Kim-1 in
untreated animals, rather than a background or nonspecific
staining, because it was limited to the brush border of cells in
the pars recta, very different from an edge effect seen in the
subcapsular area, and there was no background staining in the
negative control in our experiment. Moreover, this result is in
line with previous reports of low levels of Kim-1 mRNA (van
Timmeren et al. 2006) and low kidney Kim-1 protein expres-
sion (de Borst et al. 2007) in control rats.
The increase in specific Kim-1 IHC staining allowed detec-
tion of the kidney damage as early as 24 hours after the first
CDDP dose, and showed a large magnitude of change over time
with the progression of toxicity. Changes in urinary Kim-1 par-
alleled renal Kim-1 staining although with a slight time lag,
with elevated levels by day 3 of CDDP administration, as
Kim-1 expression on the apical membrane of the proximal
tubule is required before Kim-1 can be shed in the lumen and
detected in urine. All these data are consistent with other
reports of Kim-1 as a highly sensitive marker of acute drug-
induced kidney injury (Vaidya et al. 2010; Tonomura et al.
2010) and a useful biomarker for monitoring toxicity progres-
sion following repeated dosing up to 90 days in a subchronic
setting (Hoffmann, Fuchs, et al. 2010).
Clusterin immunostaining was as specific but less notice-
able than Kim-1, in contrast with urinalysis, where clusterin
was more sensitive than Kim-1 for early detection, although the
response magnitude was smaller and the biomarker’s progres-
sion differed from that of Kim-1. Levels peaked at day 5 but did
not increase further with progressing toxicity at subsequent
time points, although still remained elevated compared with
controls. Clusterin upregulation has been described with prox-
imal tubule and collecting duct degeneration and regeneration
(Harpur et al. 2011). However, the more limited clusterin
FIGURE 3.—Kim-1 stain. A (control): specific cytoplasmic staining, apical, in pars recta (S3) in the OSOM (Þ); insert: similar area in a negative
control at higher magnification. B (CDDP, 1 day): slight cytoplasmic staining in the same area (Ð). C (CDDP, 3 days) and D (CDDP, 7 days): the
staining extends in the medullary rays (¤) with an increased intensity. E (CDDP, 7 days): the staining reaches the collecting ducts in the medulla
(�). F (CDDP, 14 days): medullary hyalin casts are stained (�); in the cortex, the only areas preserved are around glomeruli (not shown). Original
magnification: 5�, bar ¼ 250 mm. Respective images from Figures 2 and 3 are taken from serial sections.
1056 VINKEN ET AL. TOXICOLOGIC PATHOLOGY
at NATIONAL CHUNG HSING UNIV on May 25, 2013tpx.sagepub.comDownloaded from
immunostaining, compared to both the urine clusterin data and
the Kim-1 immunostaining, suggests that the antibody and the
immunostaining method lacked sensitivity.
Osteopontin showed a similar time course as urine Kim-1
but seemed somewhat less sensitive for early detection. Osteo-
pontin in urine indicated kidney damage on day 3, which is
comparable in time scale with H&E staining. Similarly to
Kim-1, osteopontin gradually increased with the duration of
dosing and its levels in urine correlated with the degree of kid-
ney damage.
Urinary albumin, NGAL, a-GST, and b2-microglobulin did
not increase consistently prior to day 5 and hence did not show
a greater sensitivity compared with the standard clinical pathol-
ogy parameters. However, the magnitude of increase in these
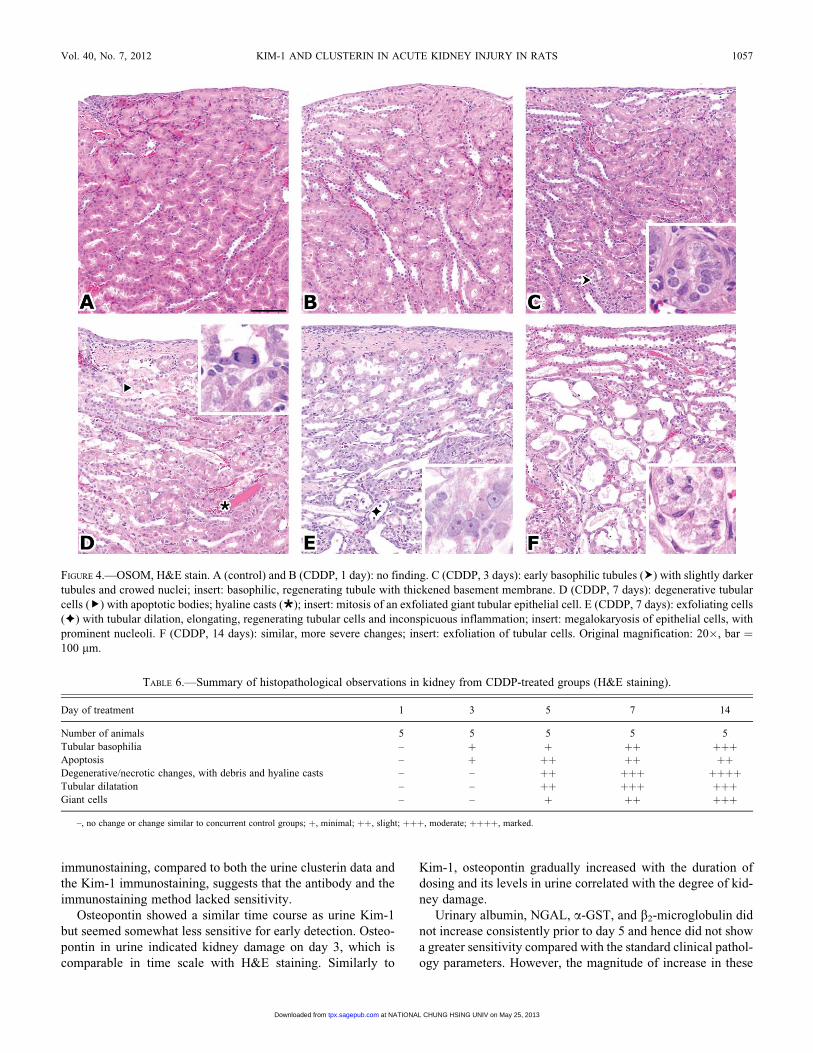
FIGURE 4.—OSOM, H&E stain. A (control) and B (CDDP, 1 day): no finding. C (CDDP, 3 days): early basophilic tubules (Þ) with slightly darker
tubules and crowed nuclei; insert: basophilic, regenerating tubule with thickened basement membrane. D (CDDP, 7 days): degenerative tubular
cells (Ð) with apoptotic bodies; hyaline casts (�); insert: mitosis of an exfoliated giant tubular epithelial cell. E (CDDP, 7 days): exfoliating cells
(Ł) with tubular dilation, elongating, regenerating tubular cells and inconspicuous inflammation; insert: megalokaryosis of epithelial cells, with
prominent nucleoli. F (CDDP, 14 days): similar, more severe changes; insert: exfoliation of tubular cells. Original magnification: 20�, bar ¼100 mm.
TABLE 6.—Summary of histopathological observations in kidney from CDDP-treated groups (H&E staining).
Day of treatment 1 3 5 7 14
Number of animals 5 5 5 5 5
Tubular basophilia – þ þ þþ þþþApoptosis – þ þþ þþ þþDegenerative/necrotic changes, with debris and hyaline casts – – þþ þþþ þþþþTubular dilatation – – þþ þþþ þþþGiant cells – – þ þþ þþþ
–, no change or change similar to concurrent control groups; þ, minimal; þþ, slight; þþþ, moderate; þþþþ, marked.
Vol. 40, No. 7, 2012 KIM-1 AND CLUSTERIN IN ACUTE KIDNEY INJURY IN RATS 1057
at NATIONAL CHUNG HSING UNIV on May 25, 2013tpx.sagepub.comDownloaded from
novel biomarkers was larger than for serum creatinine or BUN,
and their correlation with specific kidney areas is said to be
higher (Dieterle et al. 2008).
In contrast to Kim-1 and osteopontin, the concentrations of
other urinary markers of toxicity, including glucose, total pro-
tein, albumin, and a-GST, displayed peak levels in urine gen-
erally on day 5 but declined thereafter, despite ongoing and
progressive damage to the kidneys as evidenced by micro-
scopy. The reason for this discrepancy between expanding kid-
ney damage and regressing markers of toxicity is unclear. It
may be postulated, however, that due to an overload state at the
level of the remaining intact proximal tubular cells, cell signal-
ing pathways and gene transcription become altered and as a
result the expression and activity of renal transporters is modu-
lated to compensate for the glucose and protein loss (Mather
and Pollock 2011; Baines and Brunskill 2010). For a-GST,
which can be found in proximal tubular cells, this regression
could be related to the abnormal physiology of cells which are
either deeply damaged or contributing to tubular regeneration
(see Figures 4 and 5); in contrast, Kim-1 secretion would be
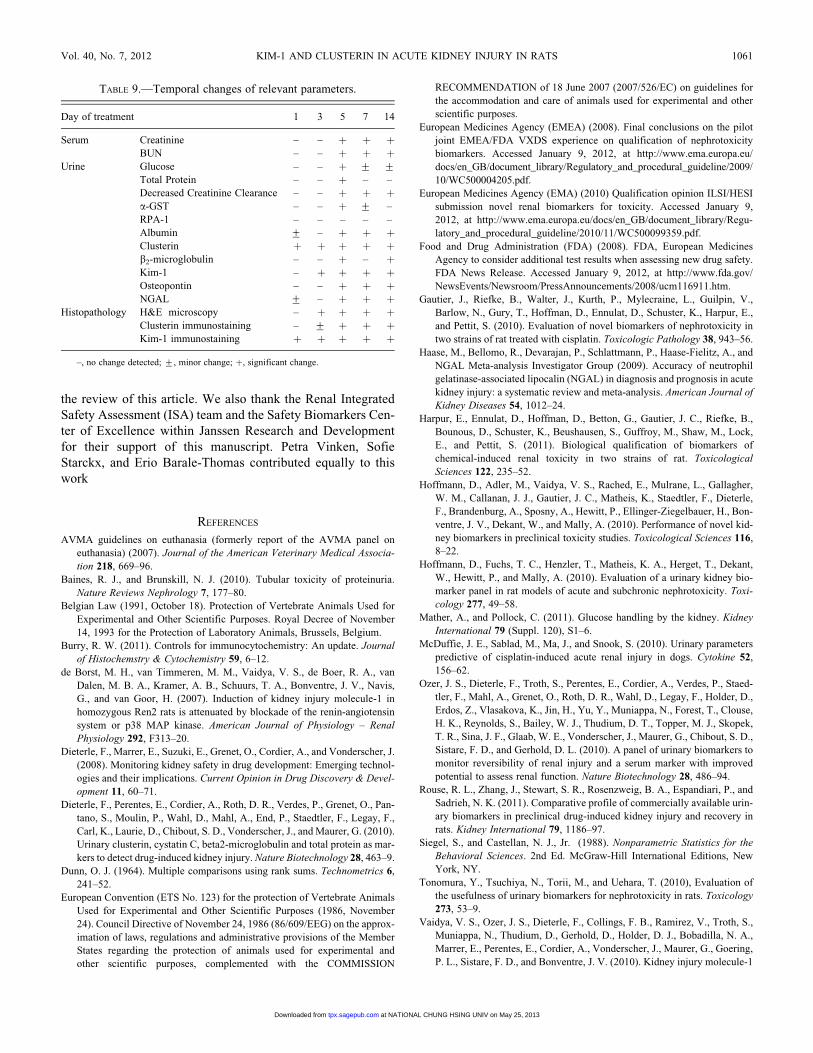
very robust as long as the cell is not dead. The temporal expres-
sion of all the parameters is summarized in Table 9.
Urinary biomarkers were also measured prior to start of
treatment to establish a preliminary reference range and to
assess the physiological and biological variation of the new
urinary biomarkers. Despite known differences in immunoas-
say results due to differences in sensitivity and specificity of
antibodies and differences in standardization, the normal range
obtained for the different biomarkers was generally in line with
other published data (Hoffmann, Adler, et al. 2010; Ozer et al.
2010; Zhou et al. 2008). It should be noted that predose sam-
ples were collected under suboptimal conditions because the
rats were not allowed time to acclimatize to the metabolism
cages. As a consequence, urinary clusterin values were remark-
ably higher in control animals during the predose collection
compared with the results obtained during the dosing period.
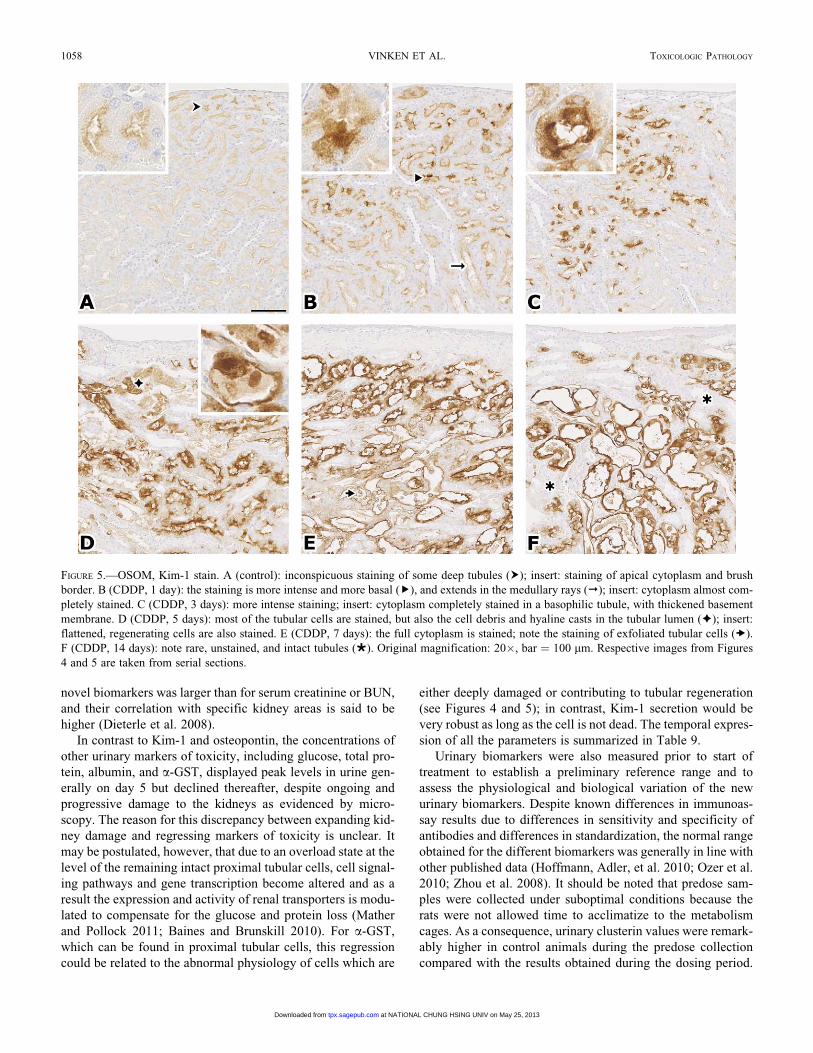
FIGURE 5.—OSOM, Kim-1 stain. A (control): inconspicuous staining of some deep tubules (Þ); insert: staining of apical cytoplasm and brush
border. B (CDDP, 1 day): the staining is more intense and more basal (Ð), and extends in the medullary rays (¤); insert: cytoplasm almost com-
pletely stained. C (CDDP, 3 days): more intense staining; insert: cytoplasm completely stained in a basophilic tubule, with thickened basement
membrane. D (CDDP, 5 days): most of the tubular cells are stained, but also the cell debris and hyaline casts in the tubular lumen (Ł); insert:
flattened, regenerating cells are also stained. E (CDDP, 7 days): the full cytoplasm is stained; note the staining of exfoliated tubular cells (�).
F (CDDP, 14 days): note rare, unstained, and intact tubules (�). Original magnification: 20�, bar ¼ 100 mm. Respective images from Figures
4 and 5 are taken from serial sections.
1058 VINKEN ET AL. TOXICOLOGIC PATHOLOGY
at NATIONAL CHUNG HSING UNIV on May 25, 2013tpx.sagepub.comDownloaded from
We therefore believe that the results for clusterin obtained from
control animals during the study (ip saline) are more represen-
tative than those collected predose. Several urinary RPA-1 data
in control animals are published, showing either steady concen-
trations (Gautier et al. 2010) or a degree of variation at different
time points (Rouse et al. 2011), and in this study, RPA-1 also
showed a trend for a continuous increase over time in control
animals. In view of the observed variability we consider
RPA-1 a less robust marker in our experiment. Furthermore,
RPA-1 levels in treated rats did not differ from the controls and
this was in contrast to Kim-1 IHC staining in the papilla at day
5 (lumen only) and at days 7 and 14 (lumen and cytoplasm).
In conclusion, the advantage of the novel urinary biomar-
kers is that they provide a noninvasive and quick way for the
early assessment of kidney injury, and that they also allow
monitoring of the pathophysiological process in the same ani-
mal. This is an important feature in preclinical toxicity studies,
to enable the detection of potential issues related to kidney
toxicity earlier during the screening and development of new
drug candidates. Our experiment in male SD rats demonstrated
once more that traditional biomarkers, which are primarily
functional endpoints, fail to detect minimal to moderate kidney
injury. Tissue Kim-1 and urine clusterin were the most sensi-
tive parameters for detection of CDDP-induced proximal tubu-
lar toxicity before any histopathological alterations occurred.
Thereafter, levels of urinary Kim-1 and osteopontin, as well
as clusterin immunostaining accurately correlated with the pro-
gression of kidney injury. In preclinical rat studies, the combi-
natorial use of the above-described biomarkers with traditional
endpoints allows the early detection and monitoring of nephro-
toxicity, together with tissue Kim-1 for the precise localization
of the region of kidney injury.
ACKNOWLEDGMENTS
We thank the laboratory staff of the Drug Safety Sciences
department for the labour intensive tasks involved in this study,
Tim Erkens for his helpful suggestions, and Graham Bailey for
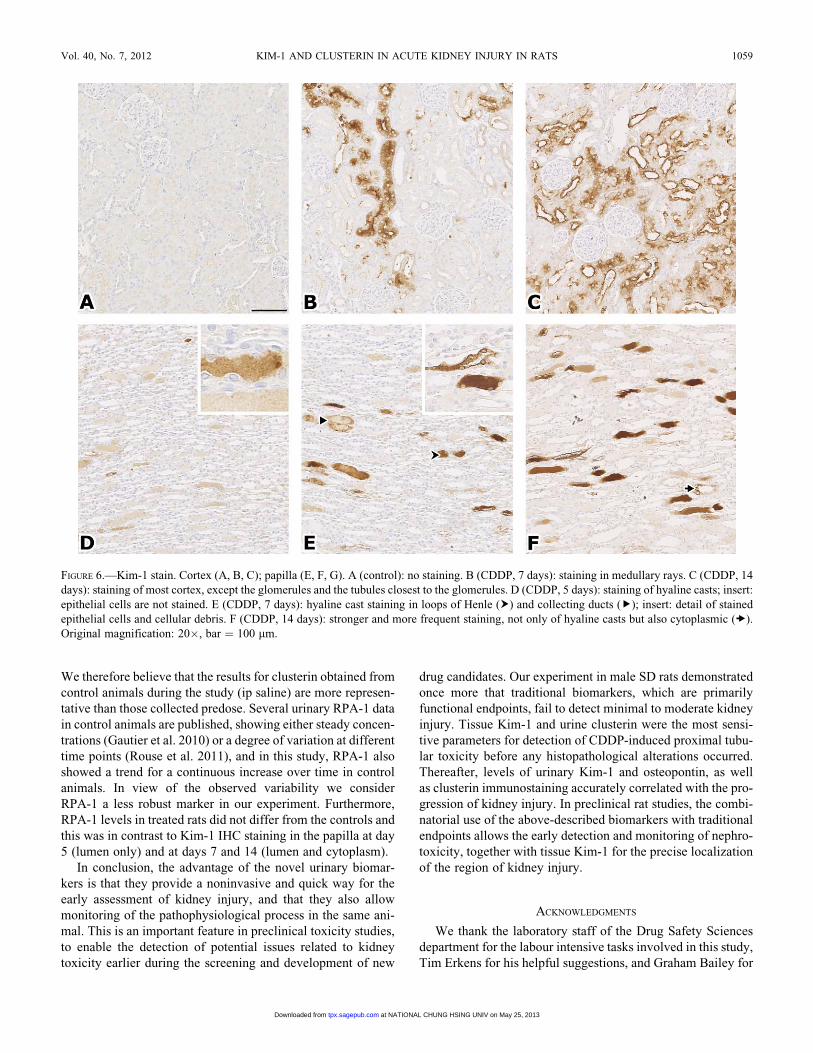
FIGURE 6.—Kim-1 stain. Cortex (A, B, C); papilla (E, F, G). A (control): no staining. B (CDDP, 7 days): staining in medullary rays. C (CDDP, 14
days): staining of most cortex, except the glomerules and the tubules closest to the glomerules. D (CDDP, 5 days): staining of hyaline casts; insert:
epithelial cells are not stained. E (CDDP, 7 days): hyaline cast staining in loops of Henle (Þ) and collecting ducts (Ð); insert: detail of stained
epithelial cells and cellular debris. F (CDDP, 14 days): stronger and more frequent staining, not only of hyaline casts but also cytoplasmic (�).
Original magnification: 20�, bar ¼ 100 mm.
Vol. 40, No. 7, 2012 KIM-1 AND CLUSTERIN IN ACUTE KIDNEY INJURY IN RATS 1059
at NATIONAL CHUNG HSING UNIV on May 25, 2013tpx.sagepub.comDownloaded from
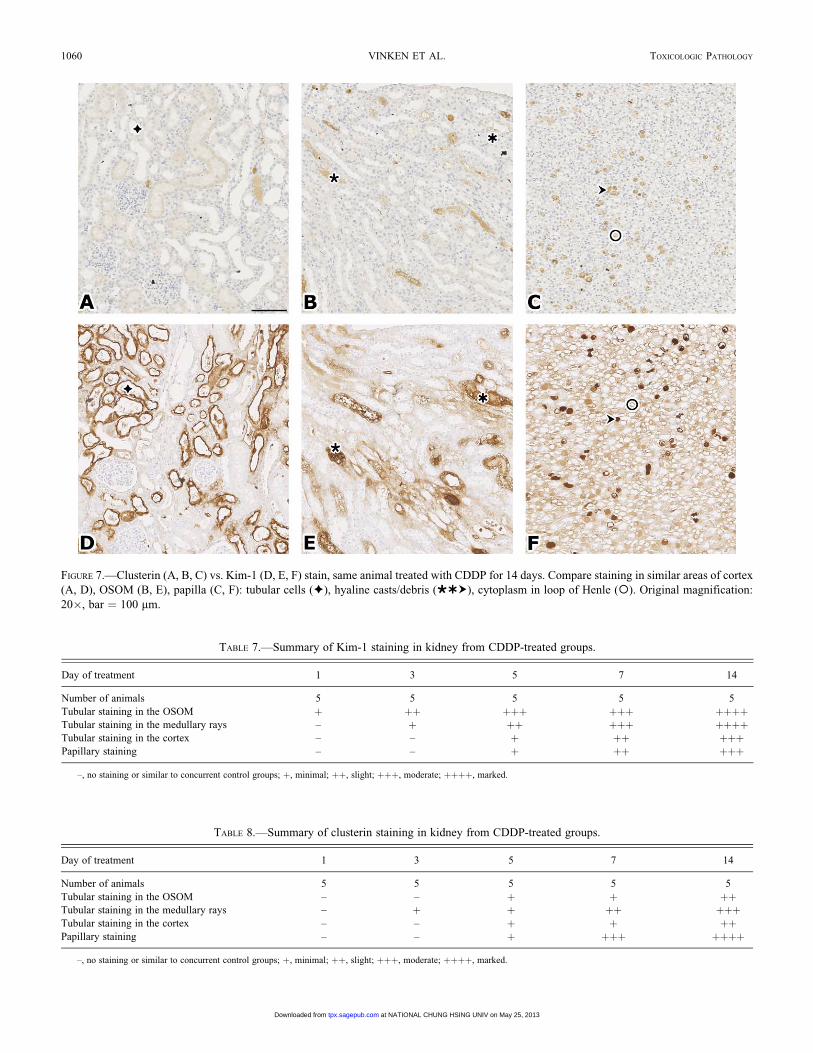
FIGURE 7.—Clusterin (A, B, C) vs. Kim-1 (D, E, F) stain, same animal treated with CDDP for 14 days. Compare staining in similar areas of cortex
(A, D), OSOM (B, E), papilla (C, F): tubular cells (Ł), hyaline casts/debris (��Þ), cytoplasm in loop of Henle (¡). Original magnification:
20�, bar ¼ 100 mm.
TABLE 7.—Summary of Kim-1 staining in kidney from CDDP-treated groups.
Day of treatment 1 3 5 7 14
Number of animals 5 5 5 5 5
Tubular staining in the OSOM þ þþ þþþ þþþ þþþþTubular staining in the medullary rays – þ þþ þþþ þþþþTubular staining in the cortex – – þ þþ þþþPapillary staining – – þ þþ þþþ
–, no staining or similar to concurrent control groups; þ, minimal; þþ, slight; þþþ, moderate; þþþþ, marked.
TABLE 8.—Summary of clusterin staining in kidney from CDDP-treated groups.
Day of treatment 1 3 5 7 14
Number of animals 5 5 5 5 5
Tubular staining in the OSOM – – þ þ þþTubular staining in the medullary rays – þ þ þþ þþþTubular staining in the cortex – – þ þ þþPapillary staining – – þ þþþ þþþþ
–, no staining or similar to concurrent control groups; þ, minimal; þþ, slight; þþþ, moderate; þþþþ, marked.
1060 VINKEN ET AL. TOXICOLOGIC PATHOLOGY
at NATIONAL CHUNG HSING UNIV on May 25, 2013tpx.sagepub.comDownloaded from
the review of this article. We also thank the Renal Integrated
Safety Assessment (ISA) team and the Safety Biomarkers Cen-
ter of Excellence within Janssen Research and Development
for their support of this manuscript. Petra Vinken, Sofie
Starckx, and Erio Barale-Thomas contributed equally to this
work
REFERENCES
AVMA guidelines on euthanasia (formerly report of the AVMA panel on
euthanasia) (2007). Journal of the American Veterinary Medical Associa-
tion 218, 669–96.
Baines, R. J., and Brunskill, N. J. (2010). Tubular toxicity of proteinuria.
Nature Reviews Nephrology 7, 177–80.
Belgian Law (1991, October 18). Protection of Vertebrate Animals Used for
Experimental and Other Scientific Purposes. Royal Decree of November
14, 1993 for the Protection of Laboratory Animals, Brussels, Belgium.
Burry, R. W. (2011). Controls for immunocytochemistry: An update. Journal
of Histochemstry & Cytochemistry 59, 6–12.
de Borst, M. H., van Timmeren, M. M., Vaidya, V. S., de Boer, R. A., van
Dalen, M. B. A., Kramer, A. B., Schuurs, T. A., Bonventre, J. V., Navis,
G., and van Goor, H. (2007). Induction of kidney injury molecule-1 in
homozygous Ren2 rats is attenuated by blockade of the renin-angiotensin
system or p38 MAP kinase. American Journal of Physiology – Renal
Physiology 292, F313–20.
Dieterle, F., Marrer, E., Suzuki, E., Grenet, O., Cordier, A., and Vonderscher, J.
(2008). Monitoring kidney safety in drug development: Emerging technol-
ogies and their implications. Current Opinion in Drug Discovery & Devel-
opment 11, 60–71.
Dieterle, F., Perentes, E., Cordier, A., Roth, D. R., Verdes, P., Grenet, O., Pan-
tano, S., Moulin, P., Wahl, D., Mahl, A., End, P., Staedtler, F., Legay, F.,
Carl, K., Laurie, D., Chibout, S. D., Vonderscher, J., and Maurer, G. (2010).
Urinary clusterin, cystatin C, beta2-microglobulin and total protein as mar-
kers to detect drug-induced kidney injury. Nature Biotechnology 28, 463–9.
Dunn, O. J. (1964). Multiple comparisons using rank sums. Technometrics 6,
241–52.
European Convention (ETS No. 123) for the protection of Vertebrate Animals
Used for Experimental and Other Scientific Purposes (1986, November
24). Council Directive of November 24, 1986 (86/609/EEG) on the approx-
imation of laws, regulations and administrative provisions of the Member
States regarding the protection of animals used for experimental and
other scientific purposes, complemented with the COMMISSION
RECOMMENDATION of 18 June 2007 (2007/526/EC) on guidelines for
the accommodation and care of animals used for experimental and other
scientific purposes.
European Medicines Agency (EMEA) (2008). Final conclusions on the pilot
joint EMEA/FDA VXDS experience on qualification of nephrotoxicity
biomarkers. Accessed January 9, 2012, at http://www.ema.europa.eu/
docs/en_GB/document_library/Regulatory_and_procedural_guideline/2009/
10/WC500004205.pdf.
European Medicines Agency (EMA) (2010) Qualification opinion ILSI/HESI
submission novel renal biomarkers for toxicity. Accessed January 9,
2012, at http://www.ema.europa.eu/docs/en_GB/document_library/Regu-
latory_and_procedural_guideline/2010/11/WC500099359.pdf.
Food and Drug Administration (FDA) (2008). FDA, European Medicines
Agency to consider additional test results when assessing new drug safety.
FDA News Release. Accessed January 9, 2012, at http://www.fda.gov/
NewsEvents/Newsroom/PressAnnouncements/2008/ucm116911.htm.
Gautier, J., Riefke, B., Walter, J., Kurth, P., Mylecraine, L., Guilpin, V.,
Barlow, N., Gury, T., Hoffman, D., Ennulat, D., Schuster, K., Harpur, E.,
and Pettit, S. (2010). Evaluation of novel biomarkers of nephrotoxicity in
two strains of rat treated with cisplatin. Toxicologic Pathology 38, 943–56.
Haase, M., Bellomo, R., Devarajan, P., Schlattmann, P., Haase-Fielitz, A., and
NGAL Meta-analysis Investigator Group (2009). Accuracy of neutrophil
gelatinase-associated lipocalin (NGAL) in diagnosis and prognosis in acute
kidney injury: a systematic review and meta-analysis. American Journal of
Kidney Diseases 54, 1012–24.
Harpur, E., Ennulat, D., Hoffman, D., Betton, G., Gautier, J. C., Riefke, B.,
Bounous, D., Schuster, K., Beushausen, S., Guffroy, M., Shaw, M., Lock,
E., and Pettit, S. (2011). Biological qualification of biomarkers of
chemical-induced renal toxicity in two strains of rat. Toxicological
Sciences 122, 235–52.
Hoffmann, D., Adler, M., Vaidya, V. S., Rached, E., Mulrane, L., Gallagher,
W. M., Callanan, J. J., Gautier, J. C., Matheis, K., Staedtler, F., Dieterle,
F., Brandenburg, A., Sposny, A., Hewitt, P., Ellinger-Ziegelbauer, H., Bon-
ventre, J. V., Dekant, W., and Mally, A. (2010). Performance of novel kid-
ney biomarkers in preclinical toxicity studies. Toxicological Sciences 116,
8–22.
Hoffmann, D., Fuchs, T. C., Henzler, T., Matheis, K. A., Herget, T., Dekant,
W., Hewitt, P., and Mally, A. (2010). Evaluation of a urinary kidney bio-
marker panel in rat models of acute and subchronic nephrotoxicity. Toxi-
cology 277, 49–58.
Mather, A., and Pollock, C. (2011). Glucose handling by the kidney. Kidney
International 79 (Suppl. 120), S1–6.
McDuffie, J. E., Sablad, M., Ma, J., and Snook, S. (2010). Urinary parameters
predictive of cisplatin-induced acute renal injury in dogs. Cytokine 52,
156–62.
Ozer, J. S., Dieterle, F., Troth, S., Perentes, E., Cordier, A., Verdes, P., Staed-
tler, F., Mahl, A., Grenet, O., Roth, D. R., Wahl, D., Legay, F., Holder, D.,
Erdos, Z., Vlasakova, K., Jin, H., Yu, Y., Muniappa, N., Forest, T., Clouse,
H. K., Reynolds, S., Bailey, W. J., Thudium, D. T., Topper, M. J., Skopek,
T. R., Sina, J. F., Glaab, W. E., Vonderscher, J., Maurer, G., Chibout, S. D.,
Sistare, F. D., and Gerhold, D. L. (2010). A panel of urinary biomarkers to
monitor reversibility of renal injury and a serum marker with improved
potential to assess renal function. Nature Biotechnology 28, 486–94.
Rouse, R. L., Zhang, J., Stewart, S. R., Rosenzweig, B. A., Espandiari, P., and
Sadrieh, N. K. (2011). Comparative profile of commercially available urin-
ary biomarkers in preclinical drug-induced kidney injury and recovery in
rats. Kidney International 79, 1186–97.
Siegel, S., and Castellan, N. J., Jr. (1988). Nonparametric Statistics for the
Behavioral Sciences. 2nd Ed. McGraw-Hill International Editions, New
York, NY.
Tonomura, Y., Tsuchiya, N., Torii, M., and Uehara, T. (2010), Evaluation of
the usefulness of urinary biomarkers for nephrotoxicity in rats. Toxicology
273, 53–9.
Vaidya, V. S., Ozer, J. S., Dieterle, F., Collings, F. B., Ramirez, V., Troth, S.,
Muniappa, N., Thudium, D., Gerhold, D., Holder, D. J., Bobadilla, N. A.,
Marrer, E., Perentes, E., Cordier, A., Vonderscher, J., Maurer, G., Goering,
P. L., Sistare, F. D., and Bonventre, J. V. (2010). Kidney injury molecule-1
TABLE 9.—Temporal changes of relevant parameters.
Day of treatment 1 3 5 7 14
Serum Creatinine – – þ þ þBUN – – þ þ þ
Urine Glucose – – þ + +Total Protein – – þ – –
Decreased Creatinine Clearance – – þ þ þa-GST – – þ + –
RPA-1 – – – – –
Albumin + – þ þ þClusterin þ þ þ þ þb2-microglobulin – – þ – þKim-1 – þ þ þ þOsteopontin – – þ þ þNGAL + – þ þ þ
Histopathology H&E microscopy – þ þ þ þClusterin immunostaining – + þ þ þKim-1 immunostaining þ þ þ þ þ
–, no change detected; +, minor change; þ, significant change.
Vol. 40, No. 7, 2012 KIM-1 AND CLUSTERIN IN ACUTE KIDNEY INJURY IN RATS 1061
at NATIONAL CHUNG HSING UNIV on May 25, 2013tpx.sagepub.comDownloaded from
outperforms traditional biomarkers of kidney injury in preclinical biomar-
ker qualification studies. Nature Biotechnology 28, 478–85.
van Timmeren, M. M., Bakker, S. J. L., Vaidya, V. S., Bailly, V., Schuurs, T.
A., Damman, J., Stegeman, C. A., Bonventre, J. V., and van Goor, H.
(2006). Tubular kidney injury molecule-1 in protein-overload nephropathy.
American Journal of Physiology - Renal Physiology 291, F456–64.
Yang, A., Traikovic, D., Illanes, O., and Ramiro-Ibanez, F. (2007). Clinico-
pathological and tissue indicators of para-aminophenol nephrotoxicity in
Sprague-Dawley rats. Toxicologic Pathology 35, 521–32.
Yao, X., Panichpisal, K., Kurtzman, N., and Nugent, K. (2007). Cisplatin
nephrotoxicity: A review. American Journal of the Medical Sciences
334, 115–24.
Zhou, Y., Vaidya, V. S., Brown, R. P., Zhang, J., Rosenzweig, B. A.,
Thompson, K. L., Miller, T. J., Bonventre, J. V., and Goering, P. L.
(2008). Comparison of kidney injury molecule-1 and other nephrotoxi-
city biomarkers in urine and kidney following acute exposure to
gentamycin, mercury, and chromium. Toxicological Sciences 101,
159–70.
For reprints and permissions queries, please visit SAGE’s Web site at http://www.sagepub.com/journalsPermissions.nav.
1062 VINKEN ET AL. TOXICOLOGIC PATHOLOGY
at NATIONAL CHUNG HSING UNIV on May 25, 2013tpx.sagepub.comDownloaded from