toyota motor energy analysis and modeling by yang (eva
TRANSCRIPT

Toyota Motor Energy Analysis and Modeling
by
Yang (Eva) Liu, Rui Sun, Ziren Wang
Dr. Gale Boyd, Advisor

Acknowledgements
We would like to thank our advisor Dr. Gale Boyd for his time advising on this project, for providing us with a background of the auto industry and for support when we struggled to find
solutions.

Executive Summary
The automobile manufacturing industry in the U.S. uses over 800 trillion British Thermal
Units (Btus) of energy and spends about $3.6 billion on it each year. As a leading automobile
manufacturing corporation, our client Toyota Motor Engineering & Manufacturing North
America, Inc. (Toyota) seeks opportunities to improve their accuracy in predicting manufacture
energy use. With a better understanding of future energy use, Toyota will be able to identify energy
efficiency opportunities and improve the overall budgeting accuracy at corporate level. To
accomplish this goal, this project uses five years of historical energy consumption data to test
existing energy models and identify possible improvements that can be done on a process and plant
level. The products of this study include revised energy models for manufacture energy use and
administrative energy use for both electricity and total energy consumption. Toyota could use our
models as a reliable reference to predict future energy performance.

Table of Contents
Executive Summary ...................................................................................................................... 3
1. Introduction ........................................................................................................................... 5
2. Literature and Model Review .................................................................................................. 7
2.1 Literature Review ................................................................................................................. 7
2.2 Model Review ....................................................................................................................... 9
3. Research Objective ................................................................................................................. 11
4. Method ..................................................................................................................................... 11
4.1 Data Introduction ......................................................................................................... 11
4.2 Model ............................................................................................................................ 15
4.3 Model Improvement Method ....................................................................................... 16
4.4 Model Selection ............................................................................................................ 18
5. Results and Discussion ............................................................................................................ 20
5.1 Plant Level Total Energy Consumption Model ................................................................ 20
5.2 Plant Level Total Energy Consumption Prediction and Analysis ................................... 23
5.3 Shop Level Electricity Consumption Model .................................................................... 27
6. Conclusion ............................................................................................................................... 33
1. Introduction
Our client, Toyota Motor Engineering & Manufacturing North America, Inc. (Toyota) is
one of the leading automobile manufacturing corporations in the world. Toyota seeks opportunities
to improve energy efficiency at their assembly plants, and requires accurate energy models to
predict future energy use and the corporate budgets. Toyota utilizes an Excel-based model that
have been used for this purpose. However, it is a simple model with low accuracy. In 2014, a Duke
University Bass Connection team updated the model at the request of Toyota to compare energy
performance across plants. The objective of our project is to test the previous energy models,
identify possible improvement that can be made and create comprehensive models using statistical
methods to capture accurate energy consumption patterns.
The automobile manufacturing industry is one of the most important sectors in the United
States and produces more output than any other industries (McAlinden et al., 2003). As of 2001,
the industry had 76 plants in the U.S. with the majority of them located in the Midwest.
Approximately 13 million vehicles (cars and trucks) are produced every year, and the value of the
output is almost $360 billion (Galitsky and Worrell, 2008). The vehicle assembly industry in the
U.S. consumes a tremendous amount of energy; the annual energy consumption is over 800 trillion
British Thermal Units (Btus), and in 2009 the industry spent $3.6 billion on energy costs (DOE,
2008). As the automotive manufacturing market becomes more competitive, improvements in
energy efficiency not only help manufacturers lower production and maintenance costs, but also
improve competitiveness without adverse effects on productivity and product quality (DOE, 2008;
Galitsky and Worrell, 2008). Additionally, improved efficiency could reduce greenhouse gases
and pollutant emissions from the production processes (DOE, 2008).

Automobile manufacturing includes six major processes: powertrain, stamping, plastic,
body welding, painting and assembly. Each of these processes requires energy inputs mainly from
electricity and natural gas. Figure 1 describes the manufacturing processes and energy
consumption in an assembly plant. The powertrain process focuses on a vehicle’s power generation
components, which includes engine and transmission. Stamping deals with metal parts, while the
plastic process produces plastic parts for a vehicle. Body welding joins components together to
make the body of a vehicle, and painting gives the vehicle a color and a coating to avoid corrosion.
Assembly is the final step, which brings mechanical parts and interior trimmings together. The
energy consumption in each process varies based on the plant’s production and the vehicle size.
Painting consumes the most energy in the overall manufacturing process due to its energy-
intensive steps such as coating and drying.
Figure 1. Process Shops and Energy Consumption from Primary and Secondary Sources for Assembly Plant

Having recognized the importance of energy efficiency for the automobile industry and the
environment, in 1992, the U.S. Environmental Protection Agency (EPA) introduced ENERGY
STAR, a voluntary government and industry partnership program which aimed to reduce air
pollution through energy efficiency improvements (Boyd et al, 2008). The auto manufacturing
industry was the first industry to use tools and measurements provided by this program. Toyota
also participated in the ENERGY STAR program and received Sustained Excellence Award in
Energy Management in 2015 (Energy Star, 2016). There is much potential for energy efficiency
improvement in auto manufacturing industry. Galitsky and Worrell (2008) discuss available
energy efficiency opportunities for auto manufacturing and listes cost and payback periods for
each energy efficiency measure. In addition, the Department of Energy (DOE) also generated a
technology roadmap to help reduce energy intensity in the auto manufacturing industry.
2. Literature and Model Review 2.1LiteratureReview
In order to better understand energy efficiency opportunities in the automobile
manufacturing industry, we reviewed literature articles in three major areas: Evaluation,
Measurement and Verification (EM&V), U.S. automobile manufacturing industry energy
efficiency opportunities, and efficiency measurement models. EM&V is widely used in the
industrial sectors to evaluate energy efficiency. One of the primary objectives of the EM&V
program is to determine the effectiveness of certain energy efficiency measurements and make
recommendations to improve future energy savings. Our project follows the same goals and
processes of EM&V and evaluates energy efficiency by using statistical methods.
Recent studies show that there have been an industry-wide efficiency improvement of
U.S. automobile assembly plants, especially since early the 2000s (Boyd, 2014). Based on a
statistical analysis using ENERGY STAR data, Boyd (2014) shows that the production
efficiency of the Frontier Plant, which is the most efficient plant in the industry, has improved its
efficiency, and even previously inefficient plants have reached higher efficiency. The significant
industry-wide efficiency improvement is driven by cost reduction and various efficiency
programs implemented by utilities and energy service companies. As one of the studied
automobile manufacturers in the ENERGY STAR program, Toyota understands that reducing
energy consumption in plants and manufacturing processes will not only save operational costs,
but will allow the company to ultimately achieve its long-term zero emissions goal.
To estimate efficiency improvement, various types of statistical models and methods
have been adopted and tested. We found Boyd (2014)’s efficiency frontier model, developed
based on linear regression analysis is closely related to our research objectives. In Boyd (2014),
an efficiency factor following gamma distribution is added to a linear model that measures
energy usage per production unit by fitting wheelbase, heating degree days (HDD), plant
utilization rate and year fixed effects. As part of the model design, the efficiency factor value
will be zero for the frontier plant, while others have a positive efficiency value, indicating its
extra energy per unit consumption above the frontier plant. Two sets of data with time periods of
1998-2000 and 2003-2005 were evaluated using this model. The result of the model estimation
shows that the 2003-2005 period had a lower energy per production unit value for frontier plant
(efficiency factor = 0) compared to the 1998-2000 period. This result shows that the efficiency in
auto assembly industry has improved. Another result of the model was a significant decrease in
variance following a mild decrease in the mean of the efficiency factor in 2003-2005. This
decrease demonstrates a shrinking range of efficiency among all plants and all plants have
shifted towards a higher efficiency level. Thus, inefficient plants have reached the same level as

the higher performing plants (Boyd, 2005). A similar linear regression based statistical modeling
method is utilized in this project to measure efficiency progress in Toyota assembly plants.
Additionally, according to research conducted by Ernest Orlando Lawrence Berkeley
National Laboratory, electricity are the major energy sources in automobile manufacturing, with
the majority of electricity used for painting, lighting, and HVAC. The majority of natural gas is
used for space heating and drying processes (Galitsky and Worrell, 2008). It can be seen that
energy efficiency opportunities vary dramatically across energy sources and production
processes. In summary, our literature review results indicates that energy models using a linear
regression methodology specifically designed for an individual automobile manufacturing plant
is an effective way to evaluate cost-effective energy saving opportunities.
2.2ModelReviewAside from reviewing literature related to our research topic, two models were reviewed:
a original Toyota energy model and the Bass Connection team model. The original Toyota
energy model provides a simple linear regression model with a limited number of input
variables. The Bass Connections team revised the Toyota model by adding more input variables
to improve accuracy.
Toyota Energy Consumption Analysis Model
The Toyota energy model has three main steps: retrieve selected input data, perform
statistical regression and analyze regression outputs. The input data is compiled on a monthly
basis and stored in Toyota’s internal reporting system. The data includes the number of vehicles
produced, HDD and CDD. HDD and CDD are measurements that reflect heating and cooling

energy demands of certain amount of days in buildings. The Toyota energy model uses single
linear regression as a statistical method. In order to run statistical regression, the model needs to
select a specific fiscal year and select either electricity or natural gas consumption as the targeted
output. Once a regression is performed in Microsoft Excel, a linear equation and R-squared value
are displayed to indicate the fitness of this model. Toyota uses the regression equation to predict
future electricity and natural gas consumption.
The original Toyota energy model provides a simple statistical analysis and predictions
for energy consumption. However, this model only reflects the electricity and natural gas
consumption based on weather and production information. This model does not consider
sufficient variables that influence total energy usage. For example, there are many other
variables, such as operational days per month and type of vehicle produced, which affect total
energy consumption. In addition, the simple linear regression model will result in large
discrepancies when there are outliers or missing data in a selected data range. Therefore,
Toyota’s model may not predict an accurate pattern of future energy use and revision is
necessary in order to meet certain energy saving goals.
Duke Bass Connection Energy Model
The Duke Bass Connections team created a revised model for Toyota in May 2014. The
Bass Connections model used Microsoft Excel to process data from five Toyota manufacturing
plants (TMMC-N, TMMK-1, TMMK-2, TMMI-E, and TMMI-W) in fiscal years 2003 to 2013.
The five production processes selected in each plant were painting, assembly, body welding,
plastic and stamping. The Bass Connections model used a linear regression structure for both
natural gas and electricity consumption while adding new variables, including plant-fiscal year
interaction terms to improve accuracy. The regression, performed by STATA, provides
coefficients for input variables as well as p-values and R-squared values to evaluate the fitness of
this model. Based on the coefficients determined by the regressions, Toyota can use this model
to predict future electricity or natural gas consumption. Using the original regression model, the
Duke Bass Connections team also aggregated electricity and natural gas consumption in a single
model. The accuracy of the regression and predictions for selected plants was improved
significantly compared to Toyota’s original energy model. However, the linear regression model
was not able to reflect the energy pattern of Toyota’s 13 plants in North America. The Bass
Connections model was focused on manufacture energy, excluding administrative energy use for
analysis, which limits the use of the model to only cross plant manufacture energy comparison.
3. Research Objective The goal of this project is to establish an energy consumption model for efficiency and
planning purposes for our client, the energy management department at the Toyota corporate
headquarters. Specifically, we aim to develop a tool for Toyota that can be used in two ways:
(1) Planning : ex-ante energy forecast and
(2) Evaluation: ex-post evaluation of energy saving
We built a STATA command package that contains our model. The tool can take any
future production data as an input and generate an energy consumption prediction as output.
4. Method 4.1 Data Introduction

Monthly energy consumption data for all North American manufacturing plants was
provided by our client. The four plants with the most complete data from fiscal year 2008 to 2013
were selected to be used in this project. All four plants are assembly plants located in the U.S. or
Canada. However, their geographic regions and climate conditions are quite different. For
assembly plants, the production process includes: assembly, body-welding, stamping, painting,
plastic and powertrain. Other than monthly energy consumption data, the following data variables
for each plant were collected by our team:
• Weather condition variables: HDD and CDD measured onsite
• Production output – number of automobiles or engines produced monthly
• Operational days per month
• Operational year – number of years in operation since groundbreaking
• Product size – automobiles are categorized into six levels based on size (Table 1.)1
• Plant size – sq.ft. of plant campus
ProductSizeCode ProductType1 Corolla1.5 Corolla,RAV4,Lexus2 Camary,Lexus,Avalon,Venza3 Highlander,Sequoia,Sienna4 Tundra,TacomaPick-upTrucks
Table 1. Product size code and product types.
To understand the general energy consumption pattern at each plant, energy intensity and
production data was analyzed at the beginning stage of this project, along with summary
statistics at the plant level and process level (Table.2). Figure. 2 below shows the energy
1 Product size is a replacement of wheelbase because the data was not available.

intensity at each plant. Energy intensity is a measure of energy consumption per unit of
production, which is an estimation of production efficiency. As can be seen, energy intensities at
each plant are different in both electricity and total energy consumption. This comparison
provides a rough cross-plant efficiency assessment, however, each plant produces different types
of cars and have distinctive climate conditions. Therefore, this estimation cannot be used simply
as the measure of efficiency.
Figure. 2 Energy Intensity by Plant Summary Statistics
Figure. 3 shows the monthly production mean and quartiles at each plant. The quartiles show a a
production schedule that fluctuate on a monthly basis, which could be caused by seasonal variation
of demand for automobiles or variation in the supply chain schedule.
594.894
932.36999.51 945.43
6.14
8.147.05 6.874
0
2
4
6
8
10
0
200
400
600
800
1000
1200
TMMC TMMI TMMK TMMTX
kWh MMBtu
EnergyIntensitySummaryStatistics
MeanElectricityUsage(KWh) MeanTotalEnergyUsage(MMBtu)
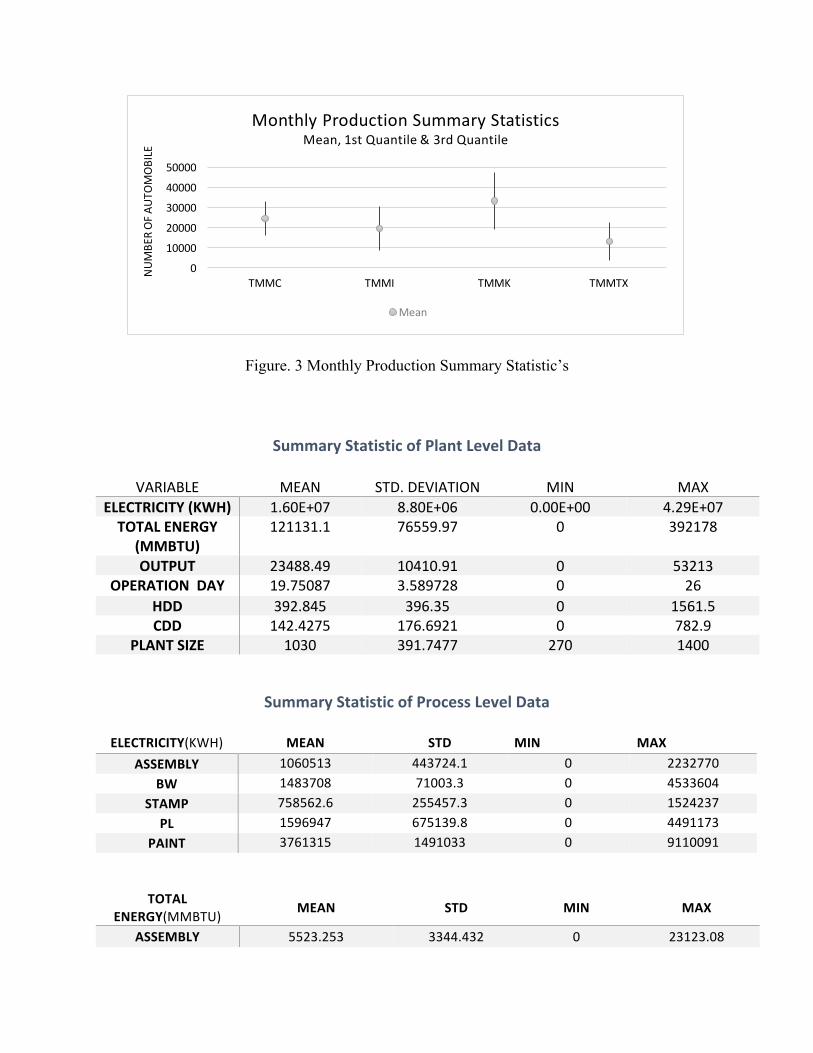
Figure. 3 Monthly Production Summary Statistic’s
SummaryStatisticofPlantLevelData
VARIABLE MEAN STD.DEVIATION MIN MAXELECTRICITY(KWH) 1.60E+07 8.80E+06 0.00E+00 4.29E+07TOTALENERGY
(MMBTU)121131.1 76559.97 0 392178
OUTPUT 23488.49 10410.91 0 53213OPERATIONDAY 19.75087 3.589728 0 26
HDD 392.845 396.35 0 1561.5CDD 142.4275 176.6921 0 782.9
PLANTSIZE 1030 391.7477 270 1400
SummaryStatisticofProcessLevelData
ELECTRICITY(KWH) MEAN STD MIN MAXASSEMBLY 1060513 443724.1 0 2232770
BW 1483708 71003.3 0 4533604STAMP 758562.6 255457.3 0 1524237
PL 1596947 675139.8 0 4491173PAINT 3761315 1491033 0 9110091
TOTALENERGY(MMBTU) MEAN STD MIN MAX
ASSEMBLY 5523.253 3344.432 0 23123.08
0
10000
20000
30000
40000
50000
TMMC TMMI TMMK TMMTX
NUM
BEROFAU
TOMOBILE
MonthlyProductionSummaryStatisticsMean,1stQuantile&3rdQuantile
Mean

BW 6944.348 3337.264 0 19911.19STAMP 3466.924 1930.205 0 24475.15
PL 14871.3 9890.696 0 71206.66PAINT 43552 23289.7 0 151012.4
Table. 2 Summary Statistic of Plant and Process Level Data
From an energy input perspective, each manufacturing plant has two primary sources of
energy: electricity and natural gas. As demonstrated in Figure 1 above, electricity is used directly
in all manufacturing processes, while a portion of electricity is used in the production of a
secondary energy source -- compressed air. Similarly, natural gas is used directly in some
manufacturing processes and for the onsite production of another secondary energy source -- steam.
Thus, at each production process level four types of energy are available: electricity, natural gas,
steam and compressed air.
Aside from manufacture energy, electricity and natural gas are also used in operation and
maintenance (O&M) activities in the plants, such as lighting, air conditioning and heating for
administrative offices. Our client, the energy management department at Toyota is interested in
both manufacture energy consumption and plant level total energy consumption including O&M.
Therefore, we developed our study into two parts: electricity and natural gas use at the process
level and total electricity and total primary energy consumption at the plant level. Total energy in
Million British Thermal Units (MMBtus) is calculated by converting Kilowatt Hours (KWh) of
electricity using a factor of 3.412e-3 MMBtu/KWh.
4.2 Model

Based on previous models and the literature reviews on EM&V, particularly Boyd (2008)
and Boyd (2014), a linear regression model with a year dummy variable was developed for this
project, as shown in the example model equation below. In this model, 𝑥"to 𝑥# are variables such
as HDD and production output, that capture the significant variation in energy consumption. The
year fixed effect term “𝛽%𝐹𝑖𝑠𝑐𝑎𝑙𝑌𝑒𝑎𝑟” considers of yearly variations that are not accounted for
in the 𝑥#variables.
𝐸𝑛𝑒𝑟𝑔𝑦 = 𝛽5 + 𝛽"𝑥" + 𝛽7𝑥7 + ⋯+ 𝛽#𝑥# + 𝛽%𝐹𝑖𝑠𝑐𝑎𝑙𝑌𝑒𝑎𝑟%
Assuming production conditions at a plant are the same each year, using the previous
year fixed effect term value, a prediction of next year’s energy consumption can be found. At the
end of a year, if the actual energy consumption is smaller than the prediction, we can say that the
general energy efficiency has been improved in this year. Additionally, 𝛽% is an estimate
measurement of efficiency improvement at each plant comparing to a base year, thus can be used
to track long term efficiency performance.
4.3 Model Improvement Method
As discussed in the model review section, Toyota’s Energy Consumption Analysis model
have been used at the corporate level for energy management and budgeting purposes for many
years. However, we think the model can be improved in two major ways: aggregating multiple
years of data and integrating process specification and plant individualization.
Aggregating data, including multiple years of energy consumption rather than just one,
provides a more information about the relationship between weather and energy consumption.

That is, the variation in data will improve the estimation of the weather-related coefficient. Thus,
the prediction will be more accurate in the case of a strong fluctuation in weather in a specific year.
This improvement is especially useful at a time with a changing climate and increasing extreme
weather events.
Process specification and plant individualization can be adopted to improve model
accuracy. Toyota’s original method used one model used for all plants and assumed energy
consumption is determined by the same factors across plants. However, Toyota’s assembly plants
are spread across North America and are manufacturing different products which vary dramatically
in size. Therefore, individual models for each plant can capture plant and process differences in
energy consumption.
We have considered two methods of integrating process specification and plant
individualization: plant specific and process specific models. That is, for plant total energy, one
model is created for each plant to best capture the unique energy consumption characteristics. For
manufacture energy models, since most of plants have similar production processes and each
manufacturing process is different energy consumption, we developed shop specific models that
capture the energy consumption pattern of each process. Then a total energy consumption model
for each plant can be found by taking the sum of the model for each manufacturing process.
In summary, two categories of models were developed: plant total energy model and the
manufacture energy model. Within each category, two sets of models were developed based on
the energy sources: an electricity model and a total energy model that considers both electricity
and natural gas consumption (Figure. 4).

Figure. 4 Model Categories Demonstration
4.4 ModelSelection
We used STATA software for the statistical analysis portion of this project. After
summarizing the data by month with coded plant and process numbers, we conducted a regression
analysis with variables discussed above.
Data transformation and quadratic effects were considered in our model selection process.
We tested the log transformed energy consumption by plotting the histograms of electricity and
total energy use data. As is shown in Figure. 5 below, non of the histograms are close to a normal
distribution. Therefore, to meet the normality assumption of a regression analysis, we log
transformed the data. The post-transformation data is much closer to a normal distribution. The
log transformation also allows us to study the per-unit manufacture energy consumption.
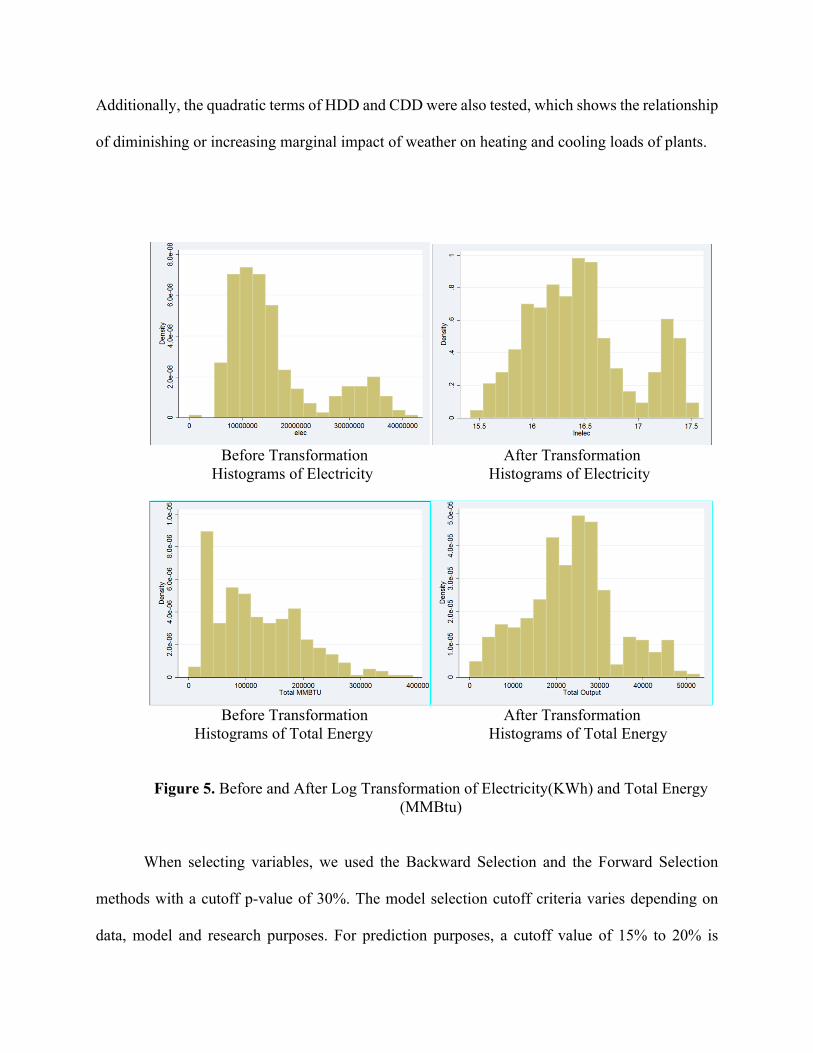
Additionally, the quadratic terms of HDD and CDD were also tested, which shows the relationship
of diminishing or increasing marginal impact of weather on heating and cooling loads of plants.
Before Transformation After Transformation Histograms of Electricity Histograms of Electricity
Before Transformation After Transformation
Histograms of Total Energy Histograms of Total Energy
Figure 5. Before and After Log Transformation of Electricity(KWh) and Total Energy
(MMBtu) When selecting variables, we used the Backward Selection and the Forward Selection
methods with a cutoff p-value of 30%. The model selection cutoff criteria varies depending on
data, model and research purposes. For prediction purposes, a cutoff value of 15% to 20% is

appropriate (Pintelon & Schoukens, 2012). However, due to the limited number of variables in this
dataset, we used a cutoff value of 30%.
When the number of variables in a model increases, the p value of the model increases
regardless of the true contribution of these variables to the variation of y. Knowing that we will be
using more variables in the model than Toyota’s three variable simple linear regression model, we
used the Akaike Information Criterion (AIC) and Bayesian Information Criterion (BIC) as
additional criteria (Kadane & Lazar, 2004). AIC and BIC are tools that take into consideration the
number of variables used in a model while measuring the fit of the model. The absolute value of
AIC and BIC do not have legitimate meanings, but models with lower AIC and BIC scores are
better balanced in terms of likelihood and number of variables.
5. Results and Discussion 5.1PlantLevelTotalEnergyConsumptionModelAfter testing all variables with data from 2008 to 2013, the following models for plant level energy
consumption were created:
TMMC
𝑙𝑜𝑔𝐸𝑙𝑒𝑐 = 𝛽5 + 𝛽"𝐿𝑜𝑔 𝑇𝑜𝑡𝑎𝑙𝑂𝑢𝑡𝑝𝑢𝑡 + 𝛽7𝐻𝐷𝐷 + 𝛽B𝐻𝐷𝐷7 + 𝛽C𝐶𝐷𝐷 + 𝛽E𝐶𝐷𝐷7+ 𝛽F𝑂𝑝𝐷𝑎𝑦 + 𝛽%𝐹𝑖𝑠𝑐𝑎𝑙𝑌𝑒𝑎𝑟
𝑙𝑜𝑔𝑇𝑜𝑡𝑎𝑙𝑀𝑀𝐵𝑇
= 𝛽5 + 𝛽"𝐿𝑜𝑔 𝑇𝑜𝑡𝑎𝑙𝑂𝑢𝑡𝑝𝑢𝑡 + 𝛽7𝐻𝐷𝐷 + 𝛽B𝐻𝐷𝐷7 + 𝛽C𝑂𝑝𝐷𝑎𝑦+ 𝛽%𝐹𝑖𝑠𝑐𝑎𝑙𝑌𝑒𝑎𝑟
TMMI
𝑙𝑜𝑔𝐸𝑙𝑒𝑐 = 𝛽5 + 𝛽"𝐿𝑜𝑔 𝑇𝑜𝑡𝑎𝑙𝑂𝑢𝑡𝑝𝑢𝑡 + 𝛽7𝐻𝐷𝐷 + 𝛽B𝐻𝐷𝐷7 + 𝛽C𝐶𝐷𝐷7 + 𝛽C𝑂𝑝𝐷𝑎𝑦+ 𝛽%𝐹𝑖𝑠𝑐𝑎𝑙𝑌𝑒𝑎𝑟

𝑙𝑜𝑔𝑇𝑜𝑡𝑎𝑙𝑀𝑀𝐵𝑇= 𝛽5 + 𝛽"𝐿𝑜𝑔 𝑇𝑜𝑡𝑎𝑙𝑂𝑢𝑡𝑝𝑢𝑡 + 𝛽7𝐻𝐷𝐷7 + 𝛽B𝐶𝐷𝐷 + 𝛽C𝐶𝐷𝐷7+ 𝛽%𝐹𝑖𝑠𝑐𝑎𝑙𝑌𝑒𝑎𝑟
TMMK
𝑙𝑜𝑔𝐸𝑙𝑒𝑐 = 𝛽5 + 𝛽"𝐿𝑜𝑔 𝑇𝑜𝑡𝑎𝑙𝑂𝑢𝑡𝑝𝑢𝑡 + 𝛽7𝐶𝐷𝐷 + 𝛽B𝑂𝑝𝐷𝑎𝑦 + 𝛽%𝐹𝑖𝑠𝑐𝑎𝑙𝑌𝑒𝑎𝑟 𝑙𝑜𝑔𝑇𝑜𝑡𝑎𝑙𝑀𝑀𝐵𝑇𝑈
=𝛽5 + 𝛽"𝐿𝑜𝑔 𝑇𝑜𝑡𝑎𝑙𝑂𝑢𝑡𝑝𝑢𝑡 + 𝛽7𝐻𝐷𝐷 + 𝛽B𝐻𝐷𝐷7 + 𝛽C𝐶𝐷𝐷 + 𝛽C𝑂𝑝𝐷𝑎𝑦+ 𝛽%𝐹𝑖𝑠𝑐𝑎𝑙𝑌𝑒𝑎𝑟
TMMTX
𝑙𝑜𝑔𝐸𝑙𝑒𝑐 = 𝛽5 + 𝛽"𝐿𝑜𝑔 𝑇𝑜𝑡𝑎𝑙𝑂𝑢𝑡𝑝𝑢𝑡 + 𝛽7𝐶𝐷𝐷 + 𝛽B𝐶𝐷𝐷7 + 𝛽%𝐹𝑖𝑠𝑐𝑎𝑙𝑌𝑒𝑎𝑟
𝑙𝑜𝑔𝑇𝑜𝑡𝑎𝑙𝑀𝑀𝐵𝑡𝑢 = 𝛽5 + 𝛽"𝐿𝑜𝑔 𝑇𝑜𝑡𝑎𝑙𝑂𝑢𝑡𝑝𝑢𝑡 + 𝛽7𝐻𝐷𝐷 + 𝛽%𝐹𝑖𝑠𝑐𝑎𝑙𝑌𝑒𝑎𝑟
These plant-level models are a better estimation of electricity and total energy consumption
because they accounted for specific characteristics of each plant. HDD are more relevant to heating
most of the time, thus the total energy model has a stronger correlation with HDD than CDD for
most of plants.
To validate the plant-level models, we ran these models against the original Toyota three-
variable model and compared the results of fitness using adjusted R-square. The results are shown
below in Table 3 and Table 4. The values in the tables are the adjusted R-squares of the new models.
Green cells represent cases where plant-specific models have a higher adjusted R-square value
than Toyota’s original model. As can be seen, the plant-specific model captured the energy
consumption pattern much better than Toyota’s original model.
AdjR-squared TMMC TMMI TMMK TMMTX
2008 0.96 0.96 0.94 0.96
2009 0.88 0.92 0.75 0.85
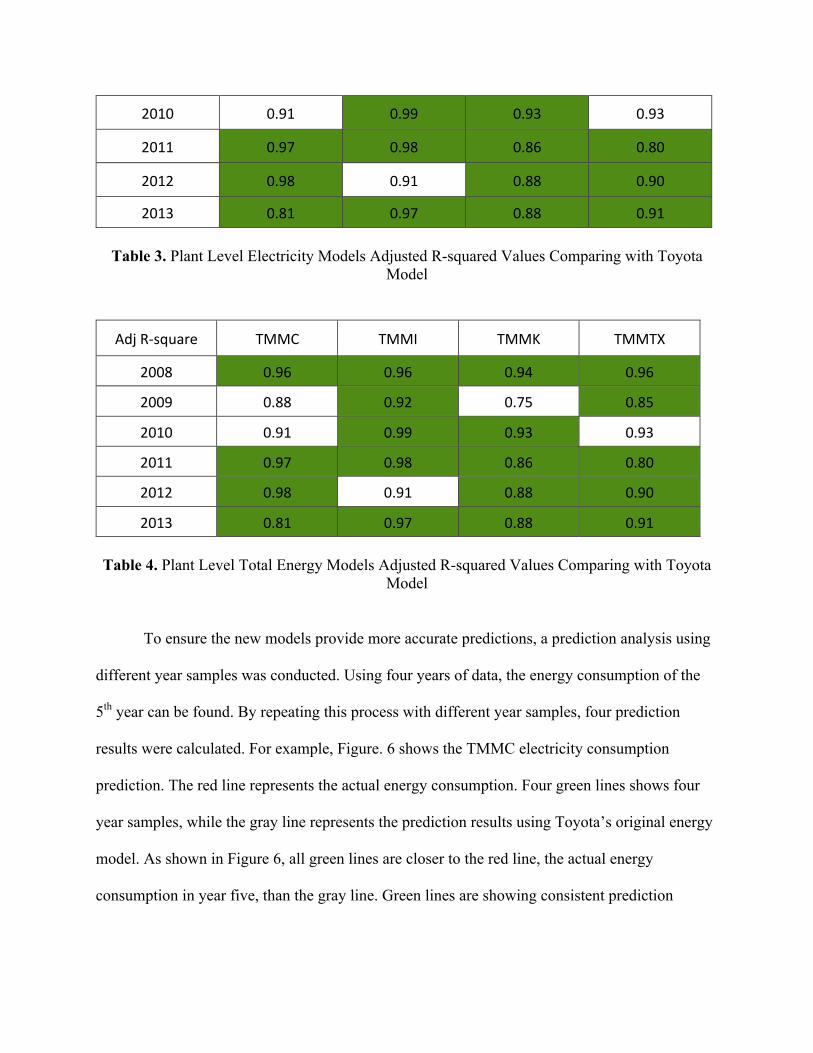
2010 0.91 0.99 0.93 0.93
2011 0.97 0.98 0.86 0.80
2012 0.98 0.91 0.88 0.90
2013 0.81 0.97 0.88 0.91
Table 3. Plant Level Electricity Models Adjusted R-squared Values Comparing with Toyota Model
AdjR-square TMMC TMMI TMMK TMMTX
2008 0.96 0.96 0.94 0.96
2009 0.88 0.92 0.75 0.85
2010 0.91 0.99 0.93 0.93
2011 0.97 0.98 0.86 0.80
2012 0.98 0.91 0.88 0.90
2013 0.81 0.97 0.88 0.91 Table 4. Plant Level Total Energy Models Adjusted R-squared Values Comparing with Toyota
Model
To ensure the new models provide more accurate predictions, a prediction analysis using
different year samples was conducted. Using four years of data, the energy consumption of the
5th year can be found. By repeating this process with different year samples, four prediction
results were calculated. For example, Figure. 6 shows the TMMC electricity consumption
prediction. The red line represents the actual energy consumption. Four green lines shows four
year samples, while the gray line represents the prediction results using Toyota’s original energy
model. As shown in Figure 6, all green lines are closer to the red line, the actual energy
consumption in year five, than the gray line. Green lines are showing consistent prediction

results with steady trends, which also indicates the new models’ ability to provide accurate
prediction results under different historical energy consumption scenarios.
Figure 6. Prediction Results of 2013 TMMC Electricity Model using Different Year Samples 5.2PlantLevelTotalEnergyConsumptionPredictionandAnalysis
In the new plant-level models, a year fixed effect term “𝛽%𝐹𝑖𝑠𝑐𝑎𝑙𝑌𝑒𝑎𝑟” captures yearly
variations that is not accounted for by weather, production quantity, operation years or operation
days, which are significant variables that explains the majority of variation in energy consumption.
Assuming production conditions remain same at each plant each year, then the “𝛽%𝐹𝑖𝑠𝑐𝑎𝑙𝑌𝑒𝑎𝑟” is
an estimate measurement of efficiency improvement at each plant. For instance, assuming all other
variables are held constant, an increasing 𝛽% indicates a decrease in energy efficiency from the
base year while an decrease of 𝛽% shows an improvement in energy efficiency from the base year.
Additionally, by assuming the energy consumption pattern is the same as the previous year, the
same 𝛽% could be used to predict of next year’s energy consumption. Thus, if the actual energy
consumption is smaller than the prediction level, we can say that the general energy efficiency has
been improved in this year.
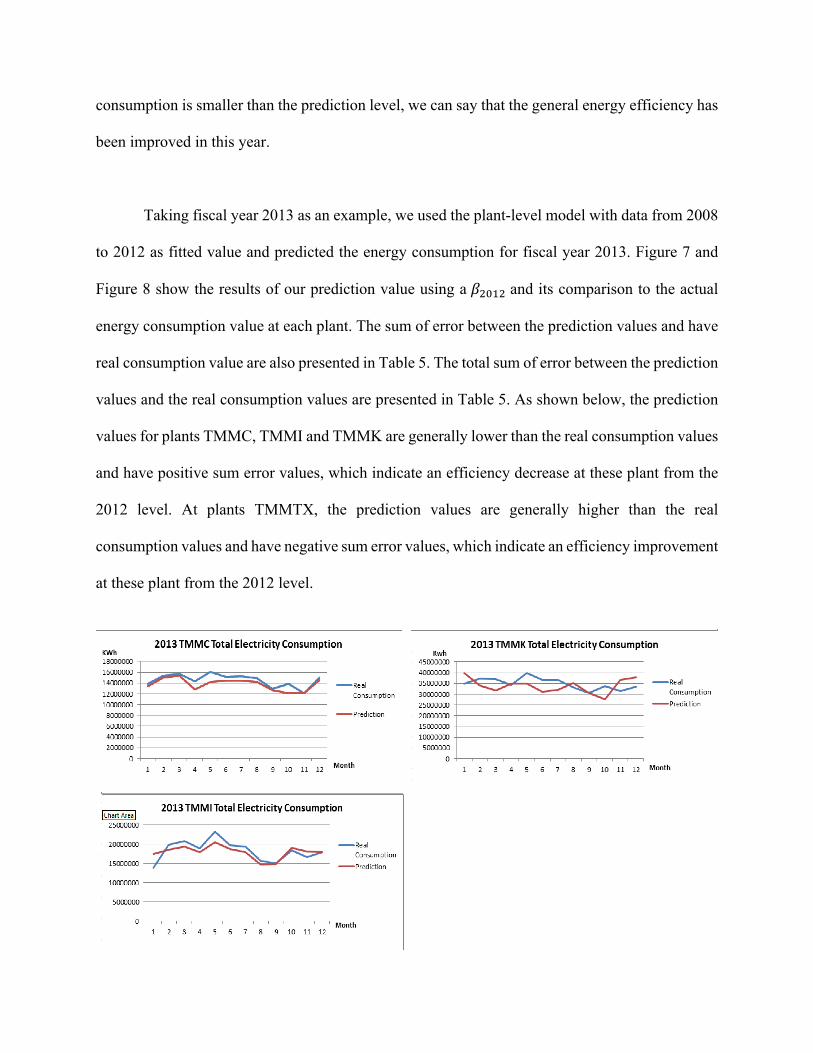
Taking fiscal year 2013 as an example, we used the plant-level model with data from 2008
to 2012 as fitted value and predicted the energy consumption for fiscal year 2013. Figure 7 and
Figure 8 show the results of our prediction value using a 𝛽75"7 and its comparison to the actual
energy consumption value at each plant. The sum of error between the prediction values and have
real consumption value are also presented in Table 5. The total sum of error between the prediction
values and the real consumption values are presented in Table 5. As shown below, the prediction
values for plants TMMC, TMMI and TMMK are generally lower than the real consumption values
and have positive sum error values, which indicate an efficiency decrease at these plant from the
2012 level. At plants TMMTX, the prediction values are generally higher than the real
consumption values and have negative sum error values, which indicate an efficiency improvement
at these plant from the 2012 level.
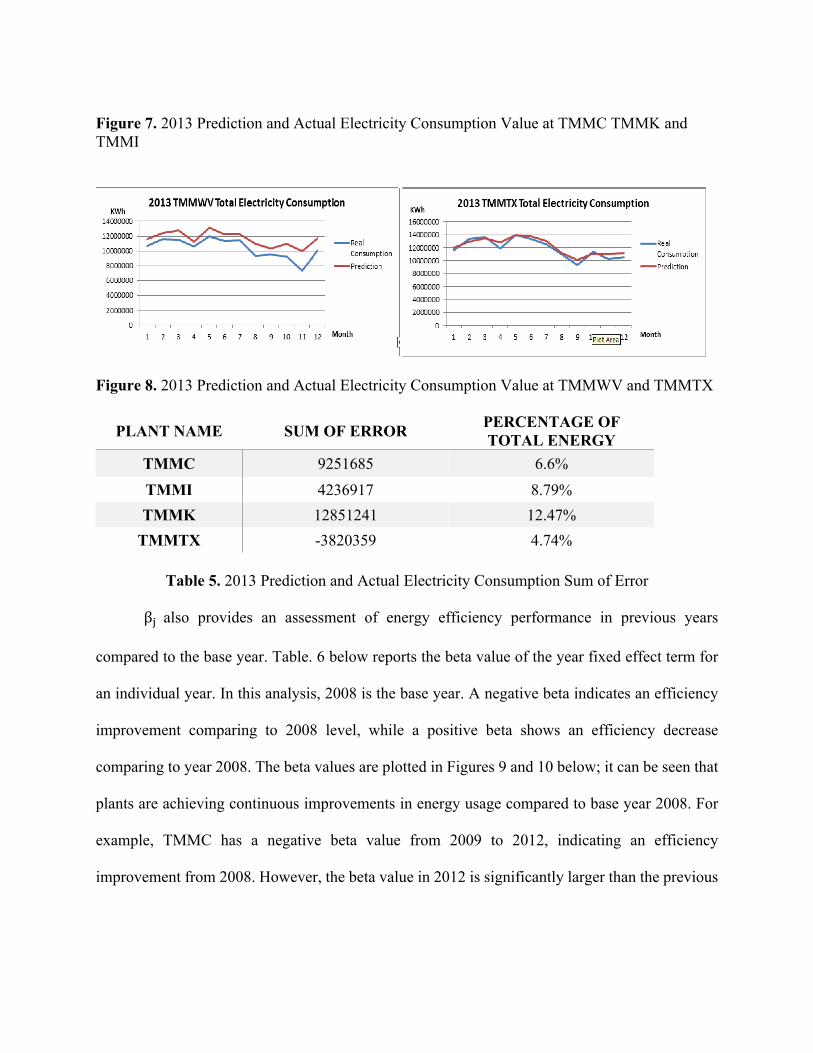
Figure 7. 2013 Prediction and Actual Electricity Consumption Value at TMMC TMMK and TMMI
Figure 8. 2013 Prediction and Actual Electricity Consumption Value at TMMWV and TMMTX
PLANT NAME SUM OF ERROR PERCENTAGE OF TOTAL ENERGY
TMMC 9251685 6.6% TMMI 4236917 8.79% TMMK 12851241 12.47%
TMMTX -3820359 4.74%
Table 5. 2013 Prediction and Actual Electricity Consumption Sum of Error
βK also provides an assessment of energy efficiency performance in previous years
compared to the base year. Table. 6 below reports the beta value of the year fixed effect term for
an individual year. In this analysis, 2008 is the base year. A negative beta indicates an efficiency
improvement comparing to 2008 level, while a positive beta shows an efficiency decrease
comparing to year 2008. The beta values are plotted in Figures 9 and 10 below; it can be seen that
plants are achieving continuous improvements in energy usage compared to base year 2008. For
example, TMMC has a negative beta value from 2009 to 2012, indicating an efficiency
improvement from 2008. However, the beta value in 2012 is significantly larger than the previous

year, thus indicating a decrease of efficiency from the 2011 level. As exemplified in the results,
beta provides an indicator of the efficiency trend at each plant.
YEAR TMMC TMMI TMMK TMMTX
ELECTRICITYMODELBETA
2009 -0.05 0.024 -0.025 -0.14662010 -0.06 0.022 -0.007 0.0222011 -0.06 0.02 0.045 -0.0692012 -0.01 0.019 0.041 -0.045
TOTALENERGYMODELBETA
2009 -0.08 0.025 -0.037 -0.1742010 -0.97 0.027 -0.119 0.0212011 -0.13 -0.012 0.034 -0.1022012 -0.38 -0.044 0.068 -0.063
Table 6. Year Fixed Effect Coefficient Value
Figure 9. Year Fixed Effect Coefficient Value for Plant Level Electricity Model
-0.2
-0.15
-0.1
-0.05
0
0.05
0.1
TMMC TMMI TMMK TMMTX
FiscalYearBetaResultsPlant-levelElectricityModel
2009 2010 2011 2012

Figure 10. Year Fixed Effect Coefficient Value for Plant Level Total Energy Model
5.3ProcessLevelElectricityConsumptionModel Included below are the process-specific models we created using electricity and total energy consumption data from 2008 to 2012. Assembly 𝐸𝑙𝑒𝑐 = 𝛽5 + 𝛽"𝑙𝑜𝑔 𝑇𝑜𝑡𝑎𝑙𝑂𝑢𝑡𝑝𝑢𝑡 + 𝛽7𝐻𝐷𝐷7 + 𝛽B𝐶𝐷𝐷 + 𝛽C𝐶𝐷𝐷7 + 𝛽E𝑂𝑝𝐷𝑎𝑦 +𝛽%𝐹𝑖𝑠𝑐𝑎𝑙𝑌𝑒𝑎𝑟 + 𝛽L𝑃𝑙𝑎𝑛𝑡 𝑇𝑜𝑡𝑎𝑙𝑀𝑀𝐵𝑡 = 𝛽5 + 𝛽"𝑙𝑜𝑔 𝑇𝑜𝑡𝑎𝑙𝑂𝑢𝑡𝑝𝑢𝑡 + 𝛽7𝐻𝐷𝐷 + 𝛽B𝐶𝐷𝐷7 + 𝛽C𝑂𝑝𝐷𝑎𝑦 +𝛽E𝑂𝑝𝑌𝑒𝑎𝑟+𝛽F𝑝𝑙𝑎𝑛𝑡𝑠𝑖𝑧𝑒 +𝛽%𝐹𝑖𝑠𝑐𝑎𝑙𝑌𝑒𝑎𝑟 + 𝛽L𝑃𝑙𝑎𝑛𝑡 Body-Welding log(𝐸𝑙𝑒𝑐) = 𝛽5 + 𝛽"𝑙𝑜𝑔 𝑇𝑜𝑡𝑎𝑙𝑂𝑢𝑡𝑝𝑢𝑡 + 𝛽7𝐻𝐷𝐷 + 𝛽B𝐻𝐷𝐷7 + 𝛽C𝐶𝐷𝐷 + 𝛽E𝐶𝐷𝐷7 +𝛽F𝑂𝑝𝐷𝑎𝑦 + 𝛽%𝐹𝑖𝑠𝑐𝑎𝑙𝑌𝑒𝑎𝑟 + 𝛽L𝑃𝑙𝑎𝑛𝑡 log 𝑇𝑜𝑡𝑎𝑙𝑀𝑀𝐵𝑡 = 𝛽5 + 𝛽"𝑙𝑜𝑔 𝑇𝑜𝑡𝑎𝑙𝑂𝑢𝑡𝑝𝑢𝑡 + 𝛽7𝐻𝐷𝐷 + 𝛽B𝐻𝐷𝐷7 + 𝛽C𝐶𝐷𝐷 +𝛽E𝐶𝐷𝐷7 + 𝛽F𝑂𝑝𝐷𝑎𝑦 + 𝛽T𝑝𝑙𝑎𝑛𝑡𝑠𝑖𝑧𝑒 + 𝛽%𝐹𝑖𝑠𝑐𝑎𝑙𝑌𝑒𝑎𝑟 + 𝛽L𝑃𝑙𝑎𝑛𝑡 Stamping 𝐸𝑙𝑒𝑐 = 𝛽5 + 𝛽"𝑙𝑜𝑔 𝑇𝑜𝑡𝑎𝑙𝑂𝑢𝑡𝑝𝑢𝑡 + 𝛽7𝐻𝐷𝐷 + 𝛽B𝐶𝐷𝐷 + 𝛽C𝑂𝑝𝐷𝑎𝑦 +𝛽%𝐹𝑖𝑠𝑐𝑎𝑙𝑌𝑒𝑎𝑟 + 𝛽L𝑃𝑙𝑎𝑛𝑡 𝑇𝑜𝑡𝑎𝑙𝑀𝑀𝐵𝑡𝑢 = 𝛽5 + 𝛽"𝑙𝑜𝑔 𝑇𝑜𝑡𝑎𝑙𝑂𝑢𝑡𝑝𝑢𝑡 + 𝛽7𝐻𝐷𝐷 + 𝛽B𝐻𝐷𝐷7 + 𝛽C𝐶𝐷𝐷 +𝛽E𝐶𝐷𝐷7+𝛽F𝑂𝑝𝐷𝑎𝑦 + 𝛽%𝐹𝑖𝑠𝑐𝑎𝑙𝑌𝑒𝑎𝑟 + 𝛽L𝑃𝑙𝑎𝑛𝑡
-1.2
-1
-0.8
-0.6
-0.4
-0.2
0
0.2
TMMC TMMI TMMK TMMTX
FiscalYearBetaResultsPlant-levelTotalEnergyModel
2009 2010 2011 2012

Plastics log(𝐸𝑙𝑒𝑐) = 𝛽5 + 𝛽"𝑙𝑜𝑔 𝑇𝑜𝑡𝑎𝑙𝑂𝑢𝑡𝑝𝑢𝑡 + 𝛽7𝐻𝐷𝐷 + 𝛽B𝐻𝐷𝐷7 + 𝛽C𝑂𝑝𝑌𝑒𝑎𝑟 +𝛽E𝑂𝑝𝐷𝑎𝑦 + 𝛽%𝐹𝑖𝑠𝑐𝑎𝑙𝑌𝑒𝑎𝑟 + 𝛽L𝑃𝑙𝑎𝑛𝑡
log 𝑇𝑜𝑡𝑎𝑙𝑀𝑀𝐵𝑡𝑢= 𝛽5 + 𝛽"𝑙𝑜𝑔 𝑇𝑜𝑡𝑎𝑙𝑂𝑢𝑡𝑝𝑢𝑡 + 𝛽7𝐻𝐷𝐷 + 𝛽B𝐶𝐷𝐷 + 𝛽C𝐶𝐷𝐷7+𝛽E𝑂𝑝𝐷𝑎𝑦+ 𝛽%𝐹𝑖𝑠𝑐𝑎𝑙𝑌𝑒𝑎𝑟 + 𝛽L𝑃𝑙𝑎𝑛𝑡
Painting log(𝐸𝑙𝑒𝑐) = 𝛽5 + 𝛽"𝑙𝑜𝑔 𝑇𝑜𝑡𝑎𝑙𝑂𝑢𝑡𝑝𝑢𝑡 + 𝛽7𝐻𝐷𝐷 + 𝛽B𝐻𝐷𝐷7 + 𝛽C𝐶𝐷𝐷 + 𝛽E𝐶𝐷𝐷7 +𝛽F𝑂𝑝𝐷𝑎𝑦 + 𝛽%𝐹𝑖𝑠𝑐𝑎𝑙𝑌𝑒𝑎𝑟 + 𝛽L𝑃𝑙𝑎𝑛𝑡
log(𝑇𝑜𝑡𝑎𝑙𝑀𝑀𝐵𝑡𝑢)= 𝛽5 + 𝛽"𝑙𝑜𝑔 𝑇𝑜𝑡𝑎𝑙𝑂𝑢𝑡𝑝𝑢𝑡 + 𝛽7𝐻𝐷𝐷 + 𝛽B𝐶𝐷𝐷7 + 𝛽C𝑂𝑝𝐷𝑎𝑦+ 𝛽%𝐹𝑖𝑠𝑐𝑎𝑙𝑌𝑒𝑎𝑟 + 𝛽L𝑃𝑙𝑎𝑛𝑡
As was done for the plant-specific models, the quadratic terms of HDD and CDD were
added in process-specific models to consider the differential impact that weather has on energy
use. We also added a year fixed effect term, 𝛽%𝐹𝑖𝑠𝑐𝑎𝑙𝑌𝑒𝑎𝑟 , and a plant fixed effect term,
𝛽L𝑃𝑙𝑎𝑛𝑡, in our process-specific models. As we discussed in the plant-specific model section, the
year fixed effect term takes account year variations that are not captured by other key variables
like production, weather, and operational days or the operation year. Since the energy consumption
of a similar process shop may vary among plants due to different production conditions,
proficiency level of workers, and plant planning, we added a plant fixed effect term to account this
effect. As is discussed in previous sections, the 𝛽%𝐹𝑖𝑠𝑐𝑎𝑙𝑌𝑒𝑎𝑟 can be used to estimate the
efficiency improvement at a plant. This is also applicable in our process-specific model, by
assuming all production conditions of a specific shop within a plant remain constant. We can use
the model to evaluate the energy performance of a specific shop within a plant over years.

To test the performance of our process-specific models, we compared the adjusted R-
squared values with those of the Duke Bass Connections Energy Model, which applies one model
to all process shops. The results are shown in Table 7. Though the adjusted R-squared value for
the 2013 stamping total energy use is lower than that of the Bass Connections Energy Model, the
remaining adjusted R-squared values of our new models are higher, which indicates that the
process-specific model more accurately reflects the pattern of energy usage in each shop.
Adj-R2 values of total energy model
Assembly BodyWeld Stamping Plastic Painting
2008 0.84 0.85 0.39 0.85 0.84
2009 0.71 0.93 0.51 0.91 0.90
2010 0.62 0.93 0.51 0.92 0.93
2011 0.63 0.94 0.47 0.90 0.93
2012 0.68 0.92 0.38 0.85 0.96
2013 0.66 0.90 0.34 0.89 0.87
Adj-R2 values of electricity model
Assembly BodyWeld Stamping Plastic Painting
2008 0.86 0.97 0.94 0.81 0.95
2009 0.91 0.96 0.92 0.88 0.84
2010 0.90 0.98 0.95 0.93 0.81
2011 0.94 0.97 0.78 0.89 0.93
2012 0.90 0.97 0.82 0.93 0.92
2013 0.93 0.97 0.95 0.95 0.92 Table 7. Adjusted R-squared value comparison between new process-specific models and Duke Bass Connection Energy Model.
As we did for the plant-specific models, we used data from 2008 to 2012 to predict the
energy usage of each shop in a plant in fiscal year 2013, and then compared the results with real
energy consumption data to determine if there was an efficiency improvement at the plant. Figure
11 shows the results for the painting shop. We used the electricity consumption of the painting
shop for the comparison since painting is energy-intensive. For the painting process, the predicted
value is generally lower than actual consumption value for plants TMMK-1, TMMK-2, and
TMMI-4, indicating a decrease in energy efficiency in the painting process in fiscal year 2013. For
plant TMMC-6, the predicted consumption is higher than the actual electricity use, suggesting
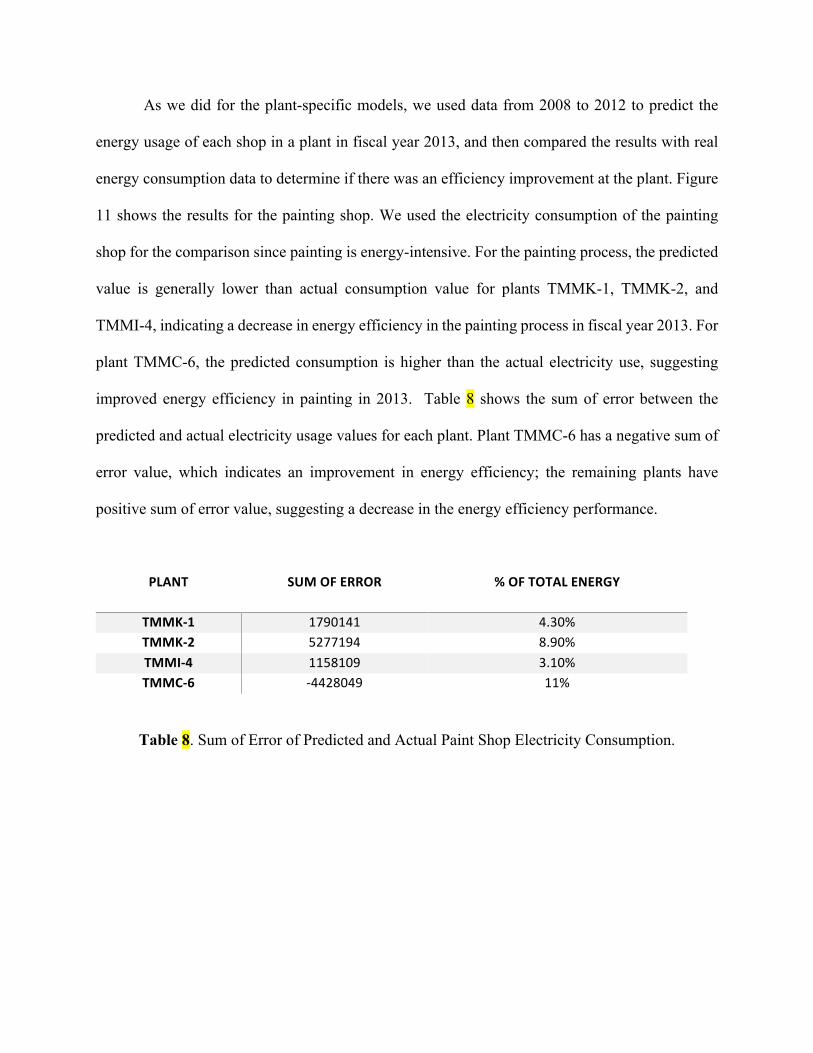
improved energy efficiency in painting in 2013. Table 8 shows the sum of error between the
predicted and actual electricity usage values for each plant. Plant TMMC-6 has a negative sum of
error value, which indicates an improvement in energy efficiency; the remaining plants have
positive sum of error value, suggesting a decrease in the energy efficiency performance.
PLANT SUMOFERROR %OFTOTALENERGY
TMMK-1 1790141 4.30%TMMK-2 5277194 8.90%TMMI-4 1158109 3.10%TMMC-6 -4428049 11%
Table 8. Sum of Error of Predicted and Actual Paint Shop Electricity Consumption.
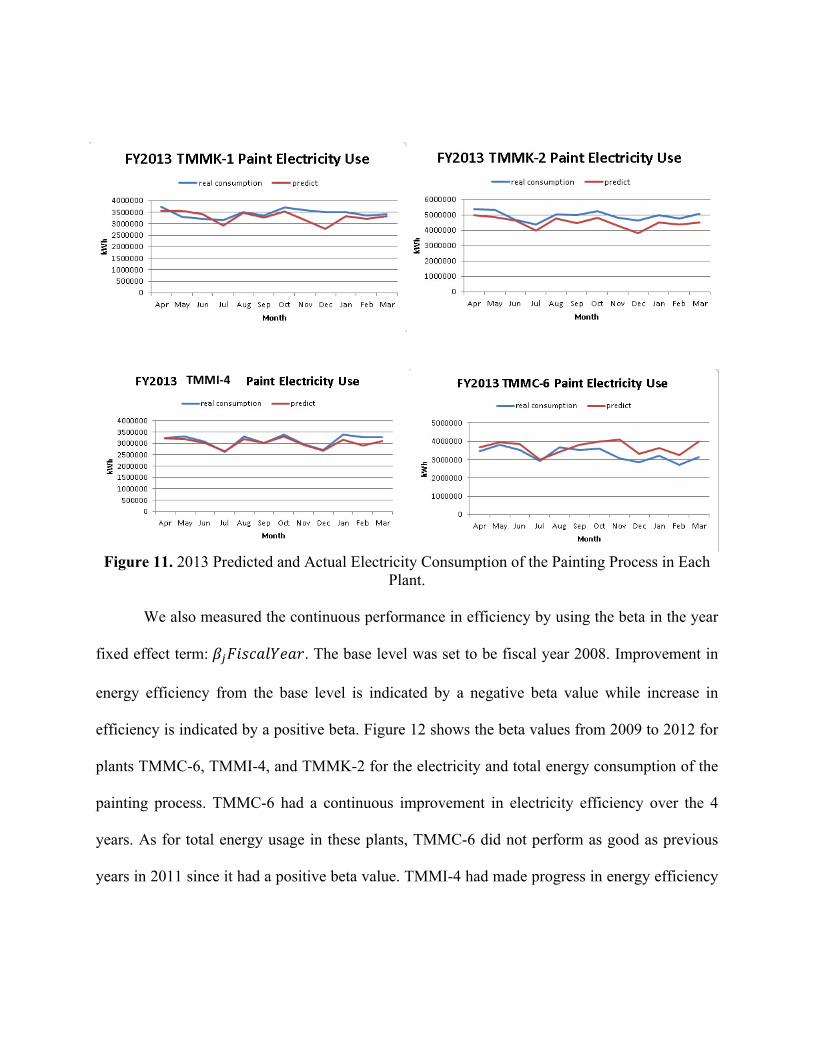
Figure 11. 2013 Predicted and Actual Electricity Consumption of the Painting Process in Each Plant.
We also measured the continuous performance in efficiency by using the beta in the year
fixed effect term: 𝛽%𝐹𝑖𝑠𝑐𝑎𝑙𝑌𝑒𝑎𝑟. The base level was set to be fiscal year 2008. Improvement in
energy efficiency from the base level is indicated by a negative beta value while increase in
efficiency is indicated by a positive beta. Figure 12 shows the beta values from 2009 to 2012 for
plants TMMC-6, TMMI-4, and TMMK-2 for the electricity and total energy consumption of the
painting process. TMMC-6 had a continuous improvement in electricity efficiency over the 4
years. As for total energy usage in these plants, TMMC-6 did not perform as good as previous
years in 2011 since it had a positive beta value. TMMI-4 had made progress in energy efficiency
TMMI-4
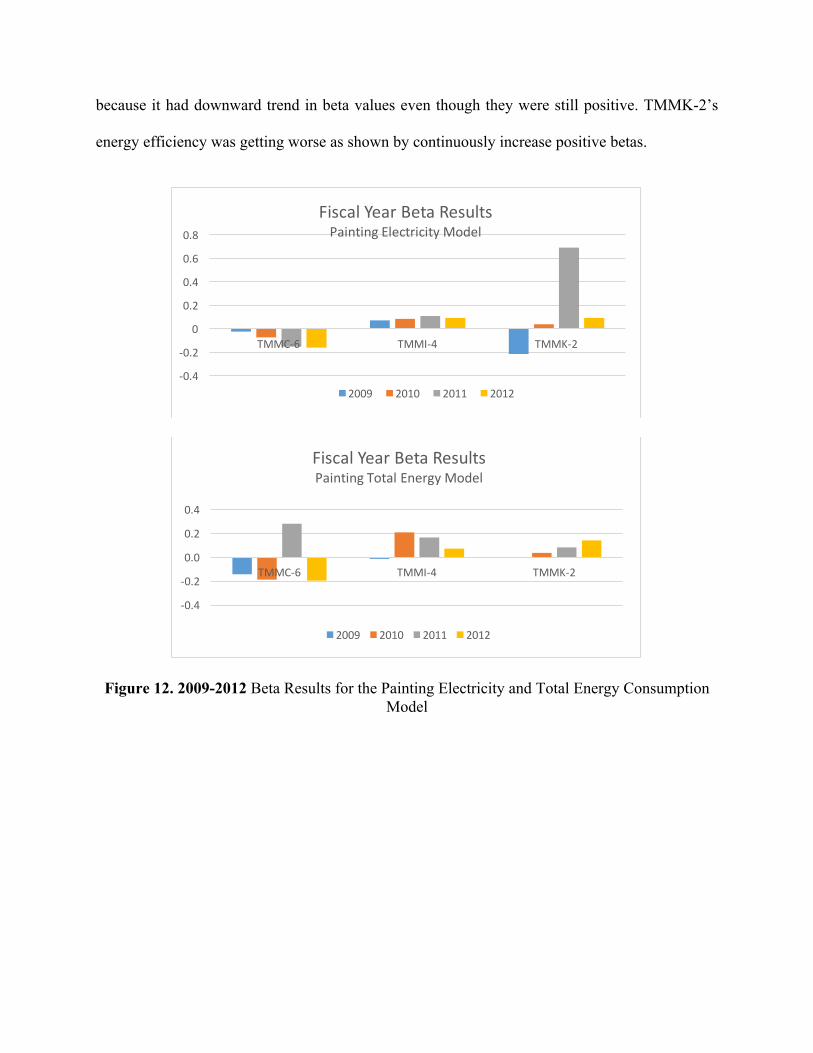
because it had downward trend in beta values even though they were still positive. TMMK-2’s
energy efficiency was getting worse as shown by continuously increase positive betas.
Figure 12. 2009-2012 Beta Results for the Painting Electricity and Total Energy Consumption Model
-0.4
-0.2
0
0.2
0.4
0.6
0.8
TMMC-6 TMMI-4 TMMK-2
FiscalYearBetaResultsPaintingElectricityModel
2009 2010 2011 2012
-0.4
-0.2
0.0
0.2
0.4
TMMC-6 TMMI-4 TMMK-2
FiscalYearBetaResultsPaintingTotalEnergyModel
2009 2010 2011 2012
6. Conclusion
In this project, we improved the initial existing models by using multiple years of
energy consumption data and creating models based on specific characteristics of the plants and
manufacturing processes. Both methods used to integrate specification and individualization into
the prediction of energy consumption—plant-specific and process-specific models—resulted in
improved model fit. For electricity and total energy consumption at plant level, the majority of
our models’ R-squared values are higher than those of the original Toyota one-fit-all model. For
shop level models, all of our R-squared values are higher than the Bass Connection Energy
Model for Shops. The new models developed in this project can be used by our client as a
reliable reference to set energy consumption targets, evaluate performance and track long term
efficiency improvement.

References
Boyd, Gale A. (2005)."A method for measuring the efficiency gap between average and best
practice energy use: The Energy Star industrial energy performance indicator." Journal of
Industrial Ecology 9.3: 51-65.
Boyd, Gale A. (2014)."Estimating the changes in the distribution of energy efficiency in the US
automobile assembly industry." Energy Economics 42: 81-87.
Department of Energy. (2008). Technology roadmap for energy reduction in automotive
manufacturing. Retrieved on
https://www1.eere.energy.gov/manufacturing/intensiveprocesses/pdfs/auto_industry_roadmap.pd
f
Energy Star. (2015). Industrial Insights: Automobile Assembly Plants. Retrieved on
https://www.energystar.gov/buildings/tools-and-
resources/industrial_insights_automobile_assembly_plants
Galitsky, Christina. (2008)."Energy efficiency improvement and cost saving opportunities for the
vehicle assembly industry: an energy star guide for energy and plant managers." Lawrence
Berkeley National Laboratory.
Pintelon, R., & Schoukens, J. (2012). System identification: a frequency domain approach. John
Wiley & Sons.
James, G., Witten, D., Hastie, T., & Tibshirani, R. (2013). An introduction to statistical learning
(Vol. 112). New York: springer.