tp#3 - project 4 flutter and modal simulation and analysis
TRANSCRIPT

TP#3 - Project 4
Flutter and Modal Simulation and Analysis of Reeds
EME 139 Stability of Flexible Dynamic Systems
Professor N. Sarigul-Klijn
TA: Matthew Gabel
Lab Section: #4, Fri 11-2pm
A-TEAM
Nathan Ross ([email protected])
Daniel Rowles ([email protected])
Erik Rubio-Gomez ([email protected])
Emre Mengi ([email protected])
06/06/2020
2
Table of Contents
Table of Contents 2
Abstract 3
Introduction 4
Procedure 7
Results 10
Modal Analysis 10
Flutter and Divergence Analysis 21
Discussion and Conclusion 29
Modal Analysis 29
Flutter and Divergence Analysis 30
Project and Course Overview 31
References 33
Appendices 34

3
Abstract
This term paper includes the flutter and modal analysis of a woodwind instrument reed. A
reed is used in instruments such as a tenor saxophone to generate vibrations. A player can choose
to constrain the reed in different ways to change the acoustics of the instrument. In this study,
seven cases with different boundary conditions were analyzed for normal modes and flutter. Modal
analysis was performed using PATRAN/NASTRAN by creating a 3D reed model. The results
indicated that ligature and teeth placement changed mode shape and frequencies while lip pressure
distribution did not affect reed vibrating frequencies. Then, the same cases were used for flutter
analysis on PATRAN/NASTRAN. Using damping and velocity values, V-g diagrams were
constructed to find the operational envelope of the system in different cases. In addition, hand-
calculations were included for a general reed to compare it to computational results. Flutter
occurred in the lower end (20 mph) and upper end (50 mph) for different cases, which validates
the given flow speed recommendation of 35 mph in the problem statement. Overall, the project
helped reinforce concepts related to modal analysis and flutter characteristics by analyzing a real-
life engineering system.

4
Introduction
The purpose of this project is to perform a convergence study on 15 converged modes,
divergence, and flutter speeds for a synthetic reed from a single reed woodwind instrument by
analyzing a 3D model of the reed in PATRAN/NASTRAN. There are boundary conditions made
from using the instrument under operating conditions using the reed attachment points to its
housing; the mouthpiece and ligature shown in Figure 1. Loads of the reed are due to the dynamic
pressure of the air flowing past the reed into the mouthpiece, ligature supports, force of musician's
lips, tongue, and teeth, supporting the reed and mouthpiece. This study will look at how the
different boundary conditions affect the results.
Figure 1: Woodwind instrument reed and appropriate Boundary conditions [2]
There were seven cases studied in this paper that display the different boundary conditions.
The seven loading cases have different reed setups for attachment to a tenor saxophone mouthpiece
using a ligature.
The first case displayed below in Figure 2 is with the “Forward Ligature” which means
that the ligature is placed at the start of the file of the reed.
Figure 2: Case 1, Ligature Forward [2]

5
The second case displayed below in Figure 3 is with the “Ligature Aft” setup where the
ligature is placed at the butt of the reed.
Figure 3: Case 2, Ligature Aft [2]
The third case displayed below in Figure 4 is with the “Ligature Forward with Lip
Footprint” which means that the sax player is using the same setup as Case 1, but the player is
holding onto the reed with their lips.
Figure 4: Case 3, Ligature Forward with Lip Footprint [2]
The fourth case displayed below in Figure 5 is with the “Forward with Center-Lip and
Center Teeth” which means that the sax player is using the same setup as Case 1, but the player is
holding the reed with their lips and their teeth.
Figure 5: Case 4, Ligature Forward with Lip and Center Teeth [2]

6
The fifth case displayed below in Figure 6 is with the “Forward with SideTooth” which
means that the sax player is using a similar setup as Case 4, but the player holds the reed with their
teeth to one side of the reed tip.
Figure 6: Case 5, Forward with SideTooth [2]
The sixth case displayed below in Figure 7 is with the “Forward with CenterTeeth” where
the player uses the same setup as Case 1, but they support the reed with their teeth only and no lip.
Figure 7: Case 6, Forward with CenterTeeth [2]
The seventh case displayed below in Figure 8 is with the “No Lip Aft Side-Teeth” which
means that the player uses a similar setup as Case 1 supported their teeth on the side of the reed
tip.
Figure 8: Case 7, No Lip Aft Side-Teeth [2]

7
Procedure
PATRAN modal analysis was used as the system analysis model. The tenor saxophone
reed geometry was modelled using Solidworks modelling software according to dimensions listed
in the “Synthetic Reed Operating Conditions, Geometry and Material Data” handout [2]. The
surfaces where the ligatures, teeth and lips contact the reed were defined by scribing sketches onto
the reed surface with the Solidworks “wrap” feature. The solid geometry was exported as a
parasolid file type, which was then exported into the PATRAN Flightloads database. Table 1 and
Figure 9 define the modelling dimensions used or the reed.
Table 1: Reed dimensions.
Dimension Value [inches]
L1 3.1780
L2 1.5170
L3 1.8790
L4 3.0590
w1 0.5845
w2 0.6750
t1 0.0705
t2 0.1155
t3 0.1165
t4 0.0060
Figure 9. The reed geometry

8
Figure 10. The final reed geometry, as modeled in Solidworks
In PATRAN, the material property set was created according to the information displayed
in Table 1. Both the failure and linear elastic models were used. The reed was modeled as a 3d
object and assigned the previously created material property set. Next, the boundary conditions
were applied. A zero rotation and translation displacement condition was applied at the ligature
and teeth, and a pressure of 5 kPa (0.725 psi) was used for the lip pressure. This pressure value
was determined from Almeida, George, Smith, and Wolfe’s assessment [3] of the effects of lip
pressure on instrument sound quality.
Next, a convergence study was performed to determine the appropriate element edge length
required for accurate analysis. The reed was modelled with element edge lengths of 0.9, 0.7, 0.5,
0.3, 0.1, and 0.05, and a convergence plot was constructed. With the appropriate edge length
determined, the reed was meshed at the specified global edge length value. Analysis was performed
in NASTRAN using a distributed mass model, and the first 15 mode shapes and frequencies were
solved for. See the discussion section for discussion of the mode shapes and frequencies.
For the PATRAN flutter study we began by creating a new model for our reed. This model
was simplified to resemble a plate with the rough dimensions of the reed. The width was 0.62975
in (the average of w1 and w2), the thickness was 0.0705 in (t1), and the length was 3.1780 in (L1).
The boundary condition zones were defined as before, by using the wrap function in solidworks
to create independent surfaces on the solid. Boundary condition zones were created for each case
and exported as a parasolid to be imported into PATRAN. Flightloads were used for the flutter
analysis and the reed material properties were kept as before. The Lab 4 guide for flutter was
mostly followed, but deviations from the guide were necessary for our model. In the Flat Plate
Modeling section of Flightloads we set our chord elements to 20 and our span elements to 5. In
the Unsteady section we set the Mach number to our calculated value of 0.03135, Kmin to 0.01,
Kmax to 0.05 and number to 10. To define the structural nodes in the Structural Coupling section
we followed the guide on preventing spline errors and utilized the tool to only select nodes visible
in the viewport. For our Velocity sets we wanted to study the range of velocities from 20 to 50
mph in 5 mph increments, so we converted or set to ft/s and input the range of values. With these
settings we were able to run the aeroelastic analysis and output the .f06 file to plot the V-g data
and find the flutter speeds and frequencies.

9
In addition to flutter analysis in PATRAN, the reed’s flutter behavior was assessed using
mathematical models. Equations listed in Appendix A were used for this analysis. First, the reed
was simplified to a rectangular prism shape, similar to the PATRAN flutter analysis. The mass
ratio was determined from a volume estimate in Solidworks, the density of Polypropylene, the reed
dimensions and the air density (assumed sea level operation). The aerodynamic center of the reed
was assumed to be at the quarter chord point, the mass center was assumed to be at the half chord,
and the shear center was assumed to be at one third of the chord. Using these dimensions, ē and x̅θ
were determined. To determine the normalized radius of gyration, the reed was assumed to have a
rotational inertia of a cuboid, and this was combined with the parallel axis theorem to find the
rotational inertia of the reed about its end. This rotational inertia was divided by the mass and the
half chord length to determine the normalized radius of gyration. The natural frequency of the
uncoupled mode was assumed to be the first flapwise mode frequency obtained from the modal
analysis of the case 1 reed. Similarly, the natural frequency of the uncoupled torsion mode was
assumed to be the first torsion mode frequency obtained from the modal analysis of the case 1
reed. With this information, a range of velocity data was generated and used to compute reed
frequency. This reed frequency was plotted against velocity, which allowed the speed at which
flutter occurs to be determined from the plot. It is important to note that the boundary conditions
are difficult to enforce for this method, and as a result it was only completed once for the general
case.
Several assumptions were made for the modelling process. It was assumed that lip contact
acted as a uniformly distributed pressure load, and that the ligatures and teeth contact allowed zero
translations or rotations of the reed. In actuality, the lips would provide a displacement condition
as well as a varying pressure, rather than a uniform pressure. Additionally, the teeth would most
likely allow slight movements of the reed. Additionally, it was assumed that the reed was of
uniform, isentropic composition. For the flutter case specifically, a simplified geometry of a
rectangular cuboid was assumed. Additionally, it was assumed that the reed could be modeled as
a wing, and thus there (2𝜋 lift curve slope).
Table 2: The reed material properties.
Property Value Units
Elastic Modulus 1.95 × 10⁵ psi
Poisson's Ratio 0.43
Density 0.0010162 slug/in3
Shear Modulus 180000 psi
Compressive Modulus 0 psi
Compressive Stress limit 7000 psi
Tension Stress Limit 4800 psi
Shear Stress Limit 7000 psi
Reference Temperature 68 ℉

10
Results
Modal Analysis Convergence Study
A convergence study is performed to determine the asymptotic convergence value for the
analysis. For the convergence study, Case 4 was chosen. Case 4 includes the most strict boundary
conditions as the reed is fixed at three points (ligature and teeth) and has a lip pressure distribution.
It is expected to observe high mode frequencies due to these boundary conditions. Therefore, in
terms of stability, Case 4 was set to be the focus of the convergence study.
The reed model was meshed using a solid mesh with a specified global edge length that
varies the number of mesh elements. Global edge lengths of 0.9”, 0.7”, 0.5”, 0.3”, 0.1”, and 0.05”
were used. As the global edge was decreased the mesh became finer and the number of mesh
elements increased. For each mesh, case 4 was analyzed and matching mode shapes were
determined. Mode 2 was used for GEL 0.9, 0.7, and 0.5 while mode 3 was used for GEL 0.3, 0.1,
and 0.05. This difference might have been a result of new modes that appeared with a finer mesh
size. The mode frequency corresponding to the mode shape for each mesh size was tabulated and
the example mode shapes for Mode 2-3 were graphed below:
Figure 11. Mode shape plot for 240 elements (Mode 2).
Figure 12. Mode shape plot for 380 elements (Mode 2).
Figure 13. Mode shape plot for 608 elements (Mode 2).
Figure 14. Mode shape plot for 1,230 elements (Mode 3).

11
Figure 15. Mode shape plot for 4,643 elements (Mode 3).
Figure 16. Mode shape plot for 12,365 elements (Mode 3).
Table 3. Mode frequency convergence values.
# of Elements Mode 1 [Hz] Mode 2-3 [Hz] Mode 4-5-6 [Hz]
240 940.62 980.92 2599.20
380 719.67 953.09 1875.50
608 752.79 930.52 2016.60
1230 651.86 939.17 1663.40
4643 566.43 914.45 1420.80
12365 538.11 900.61 1339.90
Using the mode frequency values for different mesh sizes, a convergence plot can be graphed:
Figure 17. Case 4 convergence study.
The plot indicates convergence around a global edge length of 0.05” (12,365 elements), therefore,
the remainder of the cases use GEL of 0.05”. Detailed interpretation of the convergence study
results can be found in the discussion/conclusion section. However, it is important to note that the
reason the modes in the graph are labeled as Mode 2-3 and Mode 4-5-6 is due to mode shapes

12
switching between different mesh sizes. As the mesh got finer, new mode shapes were introduced
and visual inspection was needed to find the same mode shapes and corresponding frequencies
between mesh sizes to plot convergence. Therefore, the first 6 modes were collectively plotted for
convergence while the rest were left out because it was not possible to find the same mode shapes
in different mesh size cases. The plotted curves do show a visual convergence, so it was decided
that a GEL of 0.05” was adequate for the study. Also, it is important to note that there is a visible
oscillation in the convergence plots for Mode 1 and Mode 4-5-6 for the second mesh size case.
This could be a result of a mesh problem that impacted the solution of the modal analysis.
Figure 18. Reed model mesh at GEL 0.05” (12,365 elements).

13
Case 1
Figure 19. Mode shape plot for Case 1 (Order goes: left to right).

14
Case 2
Figure 20. Mode shape plot for Case 2 (Order goes: left to right).

15
Case 3
Figure 21. Mode shape plot for Case 3 (Order goes: left to right).

16
Case 4
Figure 22. Mode shape plots for Case 4 (Order goes: left to right).

17
Case 5
Figure 23. Mode shape plots for Case 5 (Order goes: left to right).

18
Case 6
Figure 24. Mode shape plots for Case 6 (Order goes: left to right).

19
Case 7
Figure 25. Mode shape plots for Case 7 (Order goes: left to right).

20
Overall mode frequencies are tabulated below for comparison:
Table 4. Mode frequency for all 7 cases.
M
O
D
E
Mode
Frequency
[Hz] -
Case 1
Mode
Frequency
[Hz] -
Case 2
Mode
Frequency
[Hz] -
Case 3
Mode
Frequency
[Hz] -
Case 4
Mode
Frequency
[Hz] -
Case 5
Mode
Frequency
[Hz] -
Case 6
Mode
Frequency
[Hz] -
Case 7
1 97.516 79.607 97.495 538.1 363.6 538.1 363.6
2 256.44 215.25 256.22 799.1 493 799.1 493
3 309.74 249.44 309.57 900.6 646.5 901 646.5
4 552.07 459.76 551.33 1339.9 908.6 1339.8 908.6
5 629.89 485.84 629.16 1697.5 919.7 1697.4 919.7
6 783.58 503.18 783.44 1814.3 1176.7 1815.2 1176.7
7 825.72 733.92 824.49 2044.2 1487.8 2044.1 1487.8
8 900.61 806.92 899.95 2526.2 1735.5 2526 1735.5
9 965.27 918.29 963.53 2627.3 1825.2 2627.3 1825.2
10 1177.4 1181.3 1175.7 2681.2 1892.7 2679.3 1892.7
11 1391.2 1269.5 1387.9 2929.5 2150.9 2929.4 2150.9
12 1397.3 1456.8 1394 3186.2 2224.4 3186.1 2224.4
13 1761.1 1538 1757.3 4016.9 2495.8 4016.4 2495.8
14 1814.3 1649.6 1811.1 4254.4 2619.7 4254.4 2619.7
15 1802.5 1861.3 1816.6 4383.3 2705.2 4384.9 2705.2

21
Flutter and Divergence Analysis
MATLAB and “By Hand” Flutter Analysis
Figure 26. MATLAB Flutter Analysis
Note that there is no way to implement boundary conditions, and thus the “by hand” method was
performed for a general reed.

22
Case 1
Figure 27. Overall V-g diagram for Case 1
Figure 30. Mode 15 V-g diagram for Case 1.
23
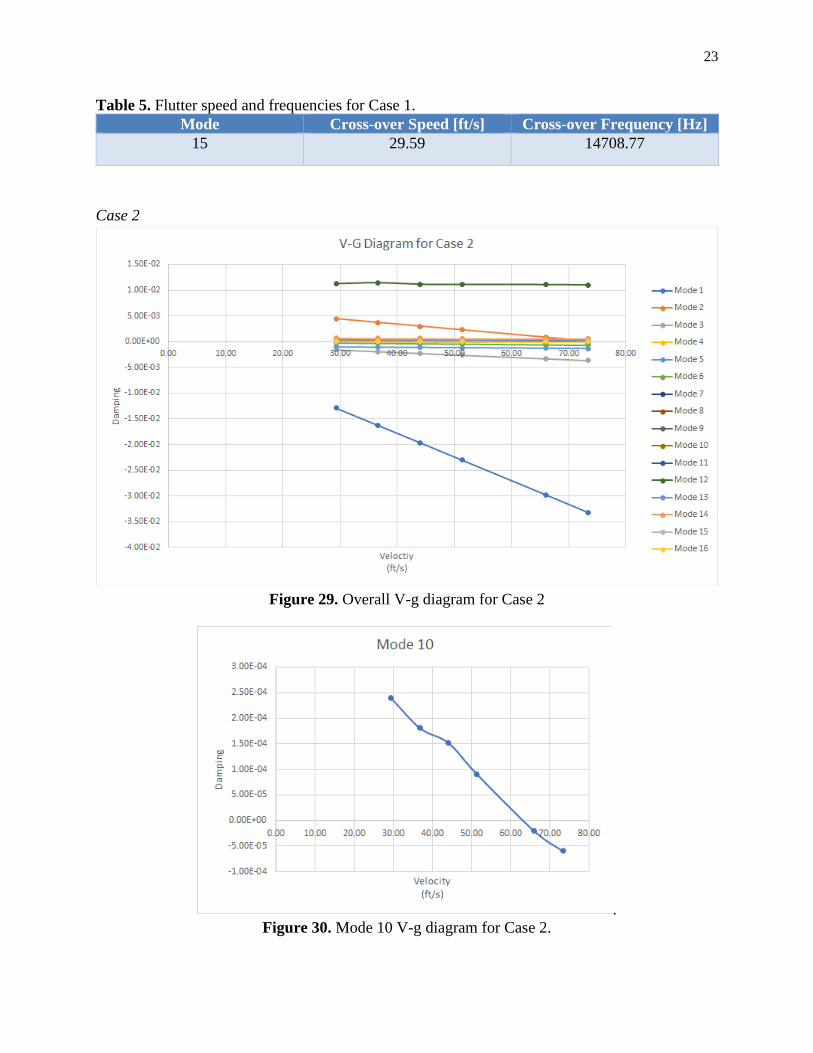
Table 5. Flutter speed and frequencies for Case 1.
Mode Cross-over Speed [ft/s] Cross-over Frequency [Hz]
15 29.59 14708.77
Case 2
Figure 29. Overall V-g diagram for Case 2
.
Figure 30. Mode 10 V-g diagram for Case 2.

24
Figure 31. Mode 15 V-g diagram for Case 2.
Table 6. Flutter speed and frequencies for Case 2.
Mode Cross-over Speed [ft/s] Cross-over Frequency [Hz]
10 63.36 7931.8567
15 37.16 27350.664
15 50.05 24350.665
15 53.88 27350.661
Case 3
Case 3 results do not differ from Case 1 results, as lip pressure forces does not affect flutter speed.
Therefore, refer to Case 1 results for flutter speeds, frequencies, and respective V-g plots.

25
Case 4
Figure 32. Overall V-g diagram for Case 4.
Figure 33. Mode 11 V-g diagram for Case 4.
Figure 34. Mode 13 V-g diagram for Case 4.

26
Figure 35. Mode 14 V-g diagram for Case 4.
Figure 36. Mode 15 V-g diagram for Case 4.
Figure 37. Mode 16 V-g diagram for Case 4.

27
Table 7. Flutter speed and frequencies for Case 4. Mode Cross-over Speed [ft/s] Cross-over Frequency [Hz]
11 29.85 15221.75
13 35.30 17780.08
13 38.87 17780.08
14 34.92 20041.02
15 40.85 27098.04
16 38.55 30800.88
16 58.18 30800.88
16 69.40 30800.88
Case 5
Figure 38. Overall V-g diagram for Case 5

28
Figure 39. Mode 14 V-g diagram for Case 5.
Figure 40. Mode 16 V-g diagram for Case 5.
Table 8. Flutter speed and frequencies for Case 5. Mode Cross-over Speed [ft/s] Cross-over Frequency [Hz]
14 35.02 17292
16 33.63 28797
16 56.03 28797

29
Case 6
Case 6 results do not differ from Case 4 results, as lip pressure forces does not affect flutter speed.
Therefore, refer to Case 4 results for flutter speeds, frequencies, and respective V-g plots.
Case 7
Case 6 results do not differ from Case 5 results, as lip pressure forces does not affect flutter speed.
Therefore, refer to Case 5 results for flutter speeds, frequencies, and respective V-g plots.
Discussion and Conclusion
Modal Analysis
Convergence study on the reed model for Case 4 indicated that the mode frequencies
started to converge around a global edge length of 0.05, which is 12,365 mesh elements. For the
study, each case used a GEL of 0.05 as a result. Although GEL 0.05 was close to convergence, a
finer meshing attempt resulted in the computer freezing. Thus, future work would include running
the analysis on a more powerful workstation with a mesh finer than 12,365 elements to accurately
find the asymptotic convergence value.
For Case 1 there were two modes that saw deflection at the base of the reed where the cross
section is the thickest being mode 8 and mode 14. Other than these two modes for case 1 and 2
vibration occurred at the tip. The frequencies ranged from about 80Hz to about 1850 Hz for the
mode shapes. The placement of the ligature directly impacts the direction of the bending that
occurs in the modes. The forward position of the ligature (case 1) saw downward bending in modes
1 and 3 versus the upward bending of the reed in cases 1 and 2 of the aft setup for the ligature. For
this reason the position of the ligature can be noted to have significant effect on the modes of the
reed.
Case 3 had similar results as Case 1 in that modes 8 and 14 saw deflection at the base of
the reed at the thickest point in the cross-sectional area. Just as in Case 1, the rest of the modes
exhibited vibration at the reed tip. The frequencies for the mode shapes ranged between about
97.5Hz to 116.5Hz. The lip pressure can be seen to not significantly change the reed mode shape
and frequency characteristics.
Case 4 and Case 6 frequencies vary from 538 Hz to 4383 Hz. Both cases exhibit the same
mode shapes as it can be seen from Figures 22 and 24. The mode frequencies for these two cases
are also similar despite the additional pressure boundary conditions applied in Case 4. Mode 1 and
mode 2 frequencies are the same for both cases, which are 538.1 Hz and 799.1 Hz. The rest of the

30
mode frequency values differ slightly, but it can be said that the lip pressure does not significantly
change the reed mode shape and frequency characteristics.
In cases 5 and 7, the lip pressure was again shown to have no effect on the mode shapes or
values. In future analysis, the lip pressure will be evaluated for its effect on flutter speed. Cases 5
and 7 showed a minimum mode frequency of 364 Hz at mode 1, and a maximum frequency of
2705 Hz at mode 15. In general, the mode frequencies for cases 5 and 7 were lower than the mode
frequencies for cases 4 and 6, indicating that biting down on only one side of the reed allows lower
frequency vibrations to occur. This makes sense, as a larger part of the reed is unconstrained. This
reasoning also explains why the mode frequencies for cases 5 and 7 were higher than for cases 1,
2 and 3. When no force from the teeth is applied, more mass at the free end of the reed can vibrate,
resulting in lower vibration frequencies.
For all cases (except case 2, where the ligature constrains the end of the reed), the reed
showed at least one mode shape where the back end of the reed vibrated. Although this is most
likely an accurate mode shape, it can be expected that this modal vibration has minimal impact on
instrument sound, as it is not in direct contact with air entering the saxophone. It is important to
note that the displayed mode shapes are not the actual reed displacements; depending on the flow,
the reed vibrates according to a combination of numerous mode shapes. Also, it is important to
mention that various websites indicate that the lowest note playable on a tenor saxophone is
Gb2/Ab2, which is 103.83 Hz [4][5]. This value is very close to our results, where the lowest
frequency obtained was 97.50 Hz. This confirms that the analysis of the 3D reed model is relatively
accurate and representative of the real-life system.
Flutter and Divergence Analysis
For Case 1 flutter was observed on the V-g plot for mode 15. The damping for mode 15
had a very small value that was extremely close to zero. The velocity at which flutter seemed to
occur was at 29.59 ft/s and a frequency of 14708.77. Having a damping value so close to zero
means that this may not be a true case of flutter and they may be ignored. This could mean that the
Patran model does not accurately predict flutter for the given assumptions and parameters used in
the analysis. Otherwise, the speed that the player must play at in order to avoid potential flutter
would be to blow at speeds that are greater than 29.59 ft/s or 20 mph.
For Case 2 flutter was seen on the V-g plot for modes 10 and 15. The damping for mode
15 was very small (close to zero) and resulted in the damping going back and forth across the axis,
leading to three flutter speeds and frequencies. The values being close to zero likely means that
these speeds and frequencies can be disregarded. Mode 10 saw flutter at 63.36 ft/s and 7931.8567
Hz. This speed is higher than the 35 mph speed indicated for analysis in the project guide for the
reed, and can be avoided by blowing lower than 63.36 ft/s when the reed is in the aft position.
For cases 4 and 6, flutter results were identical. This means that the lip pressure distribution
boundary condition does not affect the operational envelope of the reed. These two cases showed
flutter points on the V-g diagram for Modes 11, 13, 14, 15, and 16. The damping values are

31
considerably small and cause Mode 13, 15, and 16 V-g diagrams to have multiple flutter speeds &
frequencies. Therefore, these flutter speeds can be ignored due to damping values being close to
zero. Mode 11 and 14 indicate flutter speeds & frequencies of 29.85 ft/s - 15,221.75 Hz and 34.92
ft/s - 20,041.02 Hz respectively. These values indicate that flutter occurs at speeds lower than 35
mph (51.3 ft/s), which is the specified flow speed for this system. This could mean that the Patran
model does not accurately predict flutter for the given assumptions and parameters used in the
analysis. Alternatively, this could mean that the flutter ends before reaching the flow speed of 35
mph, which is used by the instrument player. Thus, the player would avoid flutter of the reed by
blowing harder than 34.92 ft/s, which is the highest flutter speed for Case 4 and 6.
Cases 5 and 7 also showed that the pressure force from the lips does not affect the flutter
behavior of the reed, as the flutter results for both cases were identical. These cases showed flutter
behavior in only two modes: mode 14 and mode 16. Mode 14 showed a flutter onset speed of 35
ft/s (23.9 mph) and 17292 Hz and mode 16 showed flutter onset at 43ft/s (29.3 mph) and 28797
Hz. Both of these speeds are under the assumed operational speed. These speeds are higher than
the “full teeth” cases 4 and 6, but lower than the flutter speeds of cases 1, 2 and 3 indicating that
increasing the constraints on a reed decreases the flutter speed. It is important to note that the
damping ratios obtained in Flightloads were all relatively low. For this reason, it is often difficult
to determine which changes in damping ratio sign correspond to flutter, and which result from
noise.
For future analysis of the reed, a study of the effects of the kmin and kmax modelling
parameters should be conducted. This would allow the appropriate tolerances in Flightloads to be
determined, increasing the validity of the model.
The hand calculations and MATLAB script gave a flutter onset speed of 347 ft/s. This
flutter onset speed is significantly higher than the speed obtained in the PATRAN analysis. This
may be due to the significant model assumptions made for the hand calculations case, specifically
the aerodynamic assumptions (aerodynamic center at the ¼ chord, shear center at the ⅓ chord, 2𝜋
lift curve slope, etc.). Also the inability to enforce boundary conditions also affects these results
for flutter onset speed. All assumptions made decrease the model’s ability to accurately represent
the real-world system. Future work should be completed to refine this assessment of the reed’s
flutter onset speed.
Project and Course Overview
Teamwork was essential for this project. The reed model was analyzed under seven cases
with various boundary conditions for normal modes and flutter & divergence. Thus, the team split
the tasks while keeping each other in check. Seven cases were divided between members: Erik
analyzed cases 1 and 3, Daniel analyzed cases 1 and 2, Emre analyzed cases 4 and 6, and Nathan

32
analyzed cases 5 and 7. Also, there were other tasks that were assigned to each team member. Erik
verified the accuracy of modal analysis for each case. Nathan rendered the 3D reed model in
SolidWorks and did the hand-calculations/MATLAB for flutter. Daniel did research on lip
pressure characteristics on a reed during playing conditions and planned the flutter/divergence
analysis on the reed. Emre studied the convergence of the system for modal analysis. While these
tasks were performed by these individuals, everyone checked each other's work to ensure that there
was no miscommunication. Teamwork helped us identify our weaknesses and strengths. We
greatly benefited from our teamwork during this project and appreciated working together to
analyze a real engineering system.
This class benefited our team by strengthening our respect and understanding of flutter in
flexible dynamic systems. We learned about how dangerous flutter can be, like with the disaster
of the Tacoma Narrows bridge collapse where flutter went unaccounted for. However we also
learned where flutter can be of great benefit, like intentionally induced flutter for benefits such as
power generation. We learned that our model is just a model and won’t always be representative
of the real system. Learning to model systems in Patran and Flightloads was possibly the greatest
benefit this class had, as FEA analysis is a highly sought after skill in the mechanical and aerospace
engineering fields. This term project also taught us how to cooperate on a team while using a
complex software. Learning how to find frequency and mode shapes by hand, with Matlab and
using Patran also demonstrated the benefits of being able to use multiple methods to find the
solution to engineering problems.
33
References
[1] Sarigul-Klijn, Nesrin. “Project 4: Reed Valve and Modeling and Simulation of Reeds.” EME
139 Stability of Flexible Dynamic Systems, University of California-Davis. (2020).
[2] Sarigul-Klijn, Nesrin. “Synthetic Reed Operating Conditions, Geometry and Material Data.”
EME 139 Stability of Flexible Dynamic Systems, University of California-Davis. (2020).
[3] Almeida, Andre, David George, John Smith, and Joe Wolfe. "The clarinet: How blowing
pressure, lip force, lip position and reed “hardness” affect pitch, sound level, and spectrum." The
Journal of the Acoustical Society of America 134, no. 3 (2013): 2247-2255.
[4] Kenyon, Bob R. “2.1 Baritone, Tenor, Alto, Soprano.” Saxophone Frequently Asked Questions,
2008, www.bobrk.com/saxfaq/2.1.html.
[5] Green, Grant. “Frequencies and Ranges.” Frequencies, 2009,
www.contrabass.com/pages/frequency.html.

34
Appendices
Appendix A. Flutter Equations
The system equation for the reed is:
Solving the system is completed using the quadratic formula:
Where: