tpc-v: a benchmark for evaluating the performance of … · tpc-v: a benchmark for evaluating the...
TRANSCRIPT

TPC-V: A Benchmark for Evaluating the Performance of Database Applications in Virtual EnvironmentsPriya Sethuraman and H. Reza Taheri, VMWare, Inc.{psethuraman, rtaheri}@vmware.com
© 2010 VMware Inc. All rights reserved
TPCTC 2010Singapore

Agenda/Topics� Introduction to virtualization� Existing benchmarks� Genesis of TPC-V
2 TPC TC 2010
� But what is TPC-E???� TPC-V design considerations� Set architectures, variability, and elasticity� Benchmark development status� Answers to some common questions
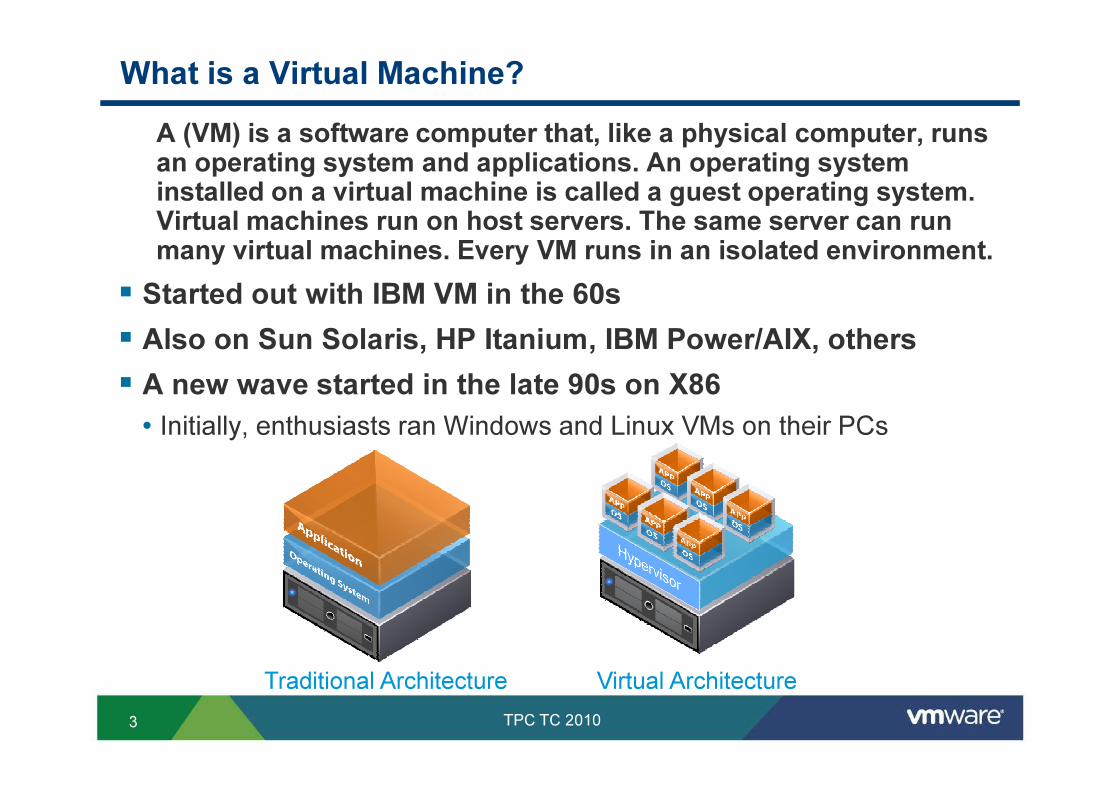
What is a Virtual Machine?A (VM) is a software computer that, like a physical computer, runs an operating system and applications. An operating system installed on a virtual machine is called a guest operating system. Virtual machines run on host servers. The same server can run many virtual machines. Every VM runs in an isolated environment.
� Started out with IBM VM in the 60s� Also on Sun Solaris, HP Itanium, IBM Power/AIX, others� A new wave started in the late 90s on X86
3 TPC TC 2010
� A new wave started in the late 90s on X86• Initially, enthusiasts ran Windows and Linux VMs on their PCs
Traditional Architecture Virtual Architecture

Why virtualize a server?� Server consolidation• The vast majority of server are grossly underutilized• Reduces both CapEx and OpEx
� Migration of VMs (both storage and CPU/memory)• Enables live load balancing• Facilitates maintenance
� High availability
4 TPC TC 2010
� High availability• Allows a small number of generic servers to back up all servers
� Fault tolerance• Lock-step execution of two VMs
� Cloud computing! Utility computing was finally enabled by• Ability to consolidate many VMs on a server• Ability to live migrate VMs in reaction to workload change

Databases: Why Use VMs for databases?� Virtualization at hypervisor level provides the best abstraction• Each DBA has their own hardened, isolated, managed sandbox
� Strong Isolation• Security• Performance/Resources• Configuration•
5 TPC TC 2010
• Fault Isolation� Scalable Performance• Low-overhead virtual Database performance• Efficiently stack databases on one host

Need for a benchmark� Virtualization is becoming the norm for servers, especially database servers
� Server buyers rely on benchmarks to make purchasing decisions
� Benchmarking database servers is complex; it requires a well crafted specification
� Don’t want to go back to the Wild West days of the 1980s benchmark wars
6 TPC TC 2010
benchmark wars
It follows that we need an industry standard benchmark with a DBMS workload

Today’s visualization benchmarks� VMmark• Developed by VMware in 2007• De facto industry standard• 120 results from 13 vendors• TPC-E, which came out at the same time, lists 39 disclosure from 7 vendors
� SPECvirt• Industry standard•
7 TPC TC 2010
• Was released this summer• But not a DBMS/backend server benchmark
� vConsolidate• Developed by IBM and Intel in 2007
� vApus Mark I from Sizing Server Lab � vServCon developed for internal use by Fujitsu Siemens Computers

VMmark• Aimed at server consolidation market• A mix of workloads
• Tile is a collection of VMs executing a set of diverse workloads
Workload Application Virtual Machine PlatformMail server Exchange 2003 Windows 2003, 2 CPU, 1GB RAM,
24GB diskJava server SPECjbb®2005- Windows 2003, 2 CPU, 1GB RAM,
8 TPC TC 2010
Java server SPECjbb®2005-based
Windows 2003, 2 CPU, 1GB RAM, 8GB disk
Standby server None Windows 2003,1 CPU, 256MB RAM, 4GB disk
Web server SPECweb®2005-based
SLES 10, 2 CPU, 512MB RAM, 8GB disk
Database server MySQL SLES 10, 2 CPU, 2GB RAM, 10GB disk
File server dbench SLES 10, 1 CPU, 256MB RAM, 8GBdisk

VMmark client workload drivers
Client 0
Client 1Files
Web Java Order EntryOLTP Database
Files
Web Java Order EntryOLTP Database
Files
Files
MailMail
9 TPC TC 2010
ESX 18 VMs
Web Java Order EntryOLTP DatabaseWeb Java Order EntryOLTP Database
Web Java Order EntryOLTP DatabaseWeb Java Order EntryOLTP DatabaseClient 2Files
Web Java Order EntryOLTP Database
Files
Web Java Order EntryOLTP Database
Three Tiles

VMmark is the de-facto Virtualization Benchmark
80100120140
Cum
ulat
ive
Num
ber
Number of VMmark Submissions
10 TPC TC 2010
0204060
Q3 2007
Q4 2007
Q1 2008
Q2 2008
Q3 2008
Q4 2008
Q1 2009
Q2 2009
Q3 2009
Q4 2009
Q1 2010
Q2 2010
Q3 2010
Cum
ulat
ive
Num
ber
(as of 9/2010)

SPECvirt_sc2010� Released on 7/14/2010• 2 results published
� Similar to VMmark• Tile architecture• 6 VMs per tile
• Low disk I/O• 96 drives in RAID5 for a 2-socket, 12-core Westmere EP (X5680) server
• Same caliber systems with TPC-E used 532-584 drives in RAID1
11 TPC TC 2010
• Same caliber systems with TPC-E used 532-584 drives in RAID1� Different from VMmark• Industry standard benchmark• No hypervisor specified• Free hand in choosing the software stack

So why do we need a new benchmark?� The prominent virtual benchmarks today cover consolidation of diverse workloads
� None are aimed at transaction processing or decision support applications, the traditional areas addressed by TPC benchmarks.
� The new frontier is virtualization of resource-intensive workloads, including those which are distributed across multiple physical servers.
12 TPC TC 2010
multiple physical servers.� None of the existing virtual benchmarks available today measure the database-centric properties that have made TPC benchmarks the industry standard that they are today.

Birth of a new benchmarks� We presented a paper in the 2009 TPCTC• Quantitative data showing that you can virtualize databases• But no proper benchmark exists
� At the December 2009 TPC meeting, the General Council passed the following:Recommend that the GC form a working group to scope a virtualization benchmark that is not comparable to other benchmarks and report back on options to the GC at the February meeting
13 TPC TC 2010
back on options to the GC at the February meeting

Benchmark requirements� Satisfies the industry need for a benchmark that:• Has a database-centric workload• Stresses virtualization layer• Moderate # of VMs, exercising enterprise applications• Healthy storage and networking I/O content; emphasizes I/O in a virtualized environment• NOT many app environments in an app consolidation scenario
� Timely development cycle (1-2 years)
14 TPC TC 2010
• Based on the TPC-E benchmark and borrows a lot from it• But is a different workload mix and the results cannot possibly be compared to TPC-E results
� Results not comparable to other TPC benchmarks� Generates information not covered by other benchmarks

30000-foot view of TPC-V� Rely on TPC-E as much as you can:• EGen => Vgen• Schema and table definitions• Transactions• Application logic
� Divide the TPC-E transactions into two groups• VM 1 handles the OLTP transactions (and is CPU heavy)
15 TPC TC 2010
•
• VM 2 handles the DSS queries (and is I/O heavy)• The two VMs and their databases are not aware of each other
� Variable # of VMs, tied to overall performance� Varies the load dynamically during MI� The last two properties make it unique and appealing since they emulate real-world• But also challenging to implement

What is TPC-E� TPC-E is theTPC’s latest OLTP benchmark• More complex than TPC-C• Less I/O than TPC-C• A lot of the code is TPC-supplied
� Models a brokerage firmCustomers Brokers MarketCustomers Brokers Market
16 TPC TC 2010
READ-WRITE•Market-Feed•Trade-Order •Trade-Result•Trade-Update
•Security-Detail•Trade-Lookup•Trade-Status
READ-ONLY•Broker-Volume•Customer-Position•Market-Watch
Invoke the following transactions …
… against the following data
Customer Data Brokerage Data Market Data
READ-WRITE•Market-Feed•Trade-Order •Trade-Result•Trade-Update
•Security-Detail•Trade-Lookup•Trade-Status
READ-ONLY•Broker-Volume•Customer-Position•Market-Watch
READ-WRITE•Market-Feed•Trade-Order •Trade-Result•Trade-Update
•Security-Detail•Trade-Lookup•Trade-Status
READ-ONLY•Broker-Volume•Customer-Position•Market-Watch
Invoke the following transactions …
… against the following data
Customer Data Brokerage Data Market Data

Abstraction of the Functional Components in an OLTP Environment
UserInterfaces Network
NetworkDatabaseServices
Modeled Business
ApplicationAnd
Business LogicServices
PresentationServicesUser
Interfaces NetworkNetwork
DatabaseServices
Modeled Business
ApplicationAnd
Business LogicServices
PresentationServicesUser
Interfaces NetworkNetwork
DatabaseServices
Modeled Business
ApplicationAnd
Business LogicServices
PresentationServices
17 TPC TC 2010
MarketExchange Legend
CustomerSponsor Provided
Stock Market
MarketExchangeMarket
Exchange LegendCustomer
Sponsor ProvidedStock Market
LegendLegendCustomer
Sponsor ProvidedStock Market
CustomerSponsor Provided
Stock Market

Functional Components of TPC-E Test Configuration
SponsorProvided
EGenDriver Connector
EGenDriverCE
CE…
…CE
EGenDriverMEE
MEE…
…MEE
EGenDriverDM
DM…
…DM
Driving and Reporting
EGenDriver
SponsorProvided
TPC DefinedInterfaces
Network
SponsorProvided
EGenDriver Connector
EGenDriverCE
CE…
…CE
EGenDriverMEE
MEE…
…MEE
EGenDriverDM
DM…
…DM
Driving and Reporting
EGenDriver
SponsorProvided
TPC DefinedInterfaces
Network
18 TPC TC 2010
Frame Implementation
Database Logic
EGenTxnHarness Connector
TPC-E Logic and Frame CallsEGenTxnHarness
CommercialProduct
SponsorProvided
SponsorProvided
TPC DefinedInterface
DBMS Commercial ProductTPC Provided
Sponsor Provided
TPC DefinedInterface
LegendDatabase Interface
Frame Implementation
Database Logic
EGenTxnHarness Connector
TPC-E Logic and Frame CallsEGenTxnHarness
CommercialProduct
SponsorProvided
SponsorProvided
TPC DefinedInterface
DBMS Commercial ProductTPC Provided
Sponsor Provided
TPC DefinedInterface
Legend
Commercial ProductTPC Provided
Sponsor Provided
TPC DefinedInterface
LegendDatabase Interface

TPC-V design considerations� TPC-V does not specify the resource allocation (CPUs, memory, virtual disk and network …) of each VM• Only the load (throughput) placed on each Set/VM
� Devised a Set architecture:• Different Sets on a system have different load levels• Because a virtualized host has to deal with the challenge of managing resources across VMs with varying demands
• As throughput increases, TPC-V will have both more Sets and higher
19 TPC TC 2010
• As throughput increases, TPC-V will have both more Sets and higher performance per Set• Because VMs on more power servers process more load
� Chose not to define the load based on virtual processors or physical cores• Not all cores are created equal

Set architecture in TPC-V� Set: a grouping of 3 or more Virtual Machines: • One or more Tier A VMs • One or more transaction specific Tier B VMs that implement the I/O heavy transactions (TL and TU)
• One or more transaction specific Tier B VMs that implement the CPU heavy trade transactions
� At a given overall performance at the system level, the benchmark specifies:
20 TPC TC 2010
benchmark specifies:• how many Sets of VMs• how much of the overall throughput is contributed by each Set
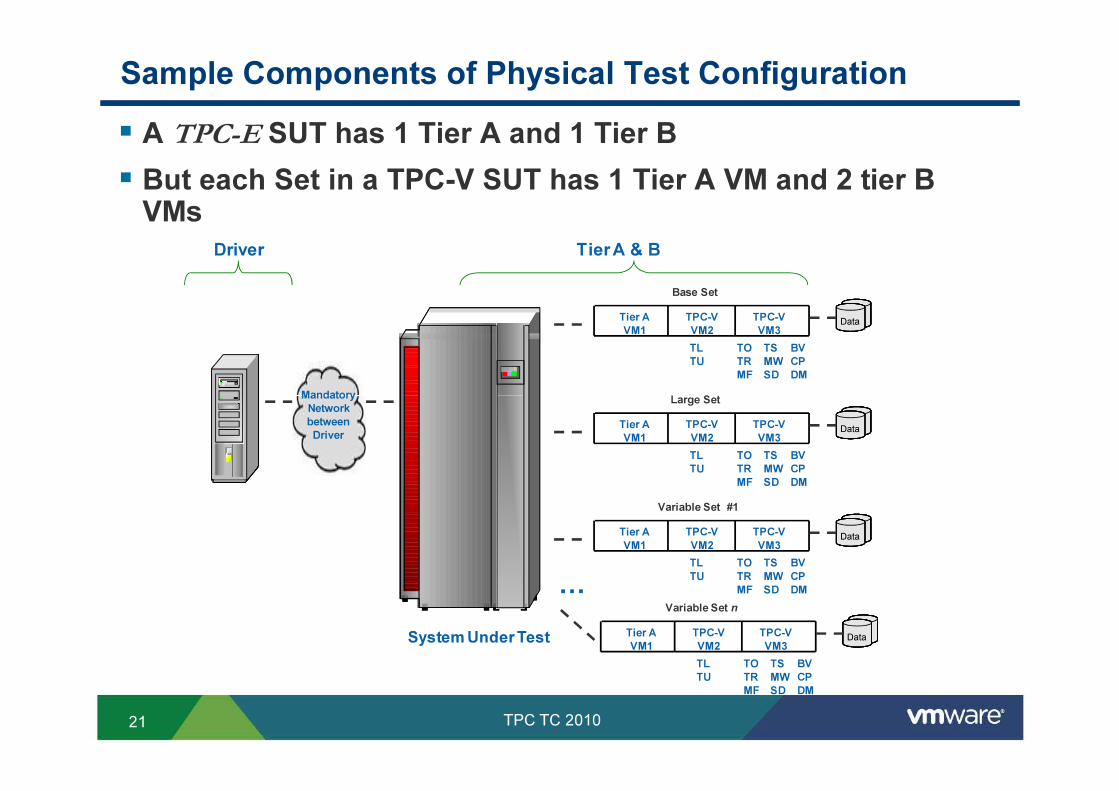
Sample Components of Physical Test Configuration� A TPC-E SUT has 1 Tier A and 1 Tier B� But each Set in a TPC-V SUT has 1 Tier A VM and 2 tier B VMs
Driver
Mandatory
Tier A & B
Base Set Tier A VM1
TPC-V VM2
TPC-V VM3 DataData
TL TU
TOTRMF
TS MWSD
BVCPDM
Large Set
21 TPC TC 2010
System Under Test
Mandatory Network between Driver
…
Large Set Tier A VM1
TPC-V VM2
TPC-V VM3 DataData
TL TU
TOTRMF
TS MWSD
BVCPDM
Variable Set #1Tier A VM1
TPC-V VM2
TPC-V VM3 DataData
TL TU
TOTRMF
TS MWSD
BVCPDM
Variable Set nTier A VM1
TPC-V VM2
TPC-V VM3 DataData
TL TU
TOTRMF
TS MWSD
BVCPDM

Set Architecture� More and larger VMs on more powerful servers• A Base Set; a Large Set; N Variable Sets• The number of sets increases sub-linearly with the server’s performance• Throughput of Sets increases sub-linearly with the server’s performance• f(tpsV) = max(1, SQRT(45% * tpsV) / M + C)
where M=SQRT(40) and C=-2• Exact details after prototyping• Some examples based on current formulas
22 TPC TC 2010
• Some examples based on current formulas• 5 Sets, 133 to 900 tpsV on a 2000-tpsV SUT• 19 Sets, 84 to 14,400 tpsV on an 32000-tpsV SUT

Functional Components of TPC-V Test Configuration
Commercial ProductTPC Provided
Sponsor Provided
TPC DefinedInterface
Legend
EGenDriverCE
Driving and Reporting
Mandatory NetworkBetween Driver and Tier A VMs
EGenDriver Connector
EGenDriverCE EGenDriverMEE EGenDriverDM
…CE …MEE …DM
CE… MEE… DM…Sponsor Provided
EGenDriver
Commercial
Sponsor Provided
23 TPC TC 2010
Virtual Machine Management SoftwareCommercial Product
Frame Implementation
EGenTxnHarness Connector
TPC-V Logic and Frame Calls
Database Interface
Tier A VM
EGenTxnHarness
Sponsor Provided
Sponsor Provided
Commercial Product
Database Logic
Tier B VM #1
Sponsor Provided
Commercial Product DBMS
Database Logic
Tier B VM #2
Sponsor Provided
Commercial Product DBMS

TPC-V SET/VM/VP Sizing WorksheetSUT Target tpsV=> 1,000 2,000 4,000 8,000 16,000 32,000min Variable Sets - 2.0 4.0 6.0 10.0 16.0max Variable Sets 1.0 3.0 5.0 7.0 11.0 17.0Base Set tpsV 150 300 600 1,200 2,400 4,800Large Set tpsV 450 900 1,800 3,600 7,200 14,400Variable Set tpsV 400 800 1,600 3,200 6,400 12,800Total Sets (S+L+M) 3 5 7 9 13 19Base Set VMs 3 3 3 3 3 3Large Set VMs 3 3 3 3 3 3Medium Set VMs 3 9 15 21 33 51Max Total VMs 9 15 21 27 39 57
24 TPC TC 2010
Max Total VMs 9 15 21 27 39 57Variable Set 1 tpsV 400 133 107 114 97 84Variable Set 2 tpsV - 267 213 229 194 167Variable Set 3 tpsV - 400 320 343 291 251Variable Set 4 tpsV - - 427 457 388 335Variable Set 5 tpsV - - 533 571 485 418Variable Set 6 tpsV - - - 686 582 502Variable Set 7 tpsV - - - 800 679 586
.
.
.
.
.
.
.
.
.
.
.
.
.
.
.
.
.
.
.
.
.
Variable Set 17 tpsV - - - - - 1,422Total Variable Set tpsV 400 800 1,600 3,200 6,400 12,800

Elasticity� Performance benchmarks are typically measured in “steady state” with a constant throughput• OK for a single application, but not for a virtualized server.
� The load placed on a Set will vary during the benchmark run, simulating elasticity• exercise the resource allocation properties of the VMMS based on workload demands
• One of the major properties that draws customers to virtualized servers
25 TPC TC 2010
• One of the major properties that draws customers to virtualized servers� It’s all about the cloud!

Elasticity
� Load of VMs varies by 2X to 4X during Measurement Interval• Elasticity• Oversubscription
26 TPC TC 2010

Benchmark Development Status� Working Group has evolved into a Development Subcommittee• 11-13 member companies• Actively meeting on weekly conf calls
� Submitted a draft spec in June� Worked through a lot of thorny issues� It looks like the benchmark will be a winner if code
27 TPC TC 2010
� It looks like the benchmark will be a winner if code developers can come up with a driver (RTE) than can:• Drive multiple Sets with a deck of cards method• Vary the load to each Set dynamically
� Have started prototyping• A lot of numerical values might change

Why not simply a virtual TPC-E?� The council asked us specifically for a non-comparable-results benchmark
� Regardless, we’d need a whole new benchmark to incorporate:• Multiple VMs in a single SUT, single FDR• The number of VMs has to be decided by the spec to make all results comparable
• A business model based on a variety of applications rather than a
28 TPC TC 2010
• A business model based on a variety of applications rather than a single application
• Measure important attributes of virtualization• Multiple VMs• VMs of different sizes• Elasticity• Oversubscription

Why not a generic framework for all TPC benchmarks?� A generic framework development process will be much longer than the 1-2 years the council has asked for
� TPC-V can be the starting point for a generic framework that can be applied to other TPC benchmarks
29 TPC TC 2010

What about blades/scale out/clusters?� The spec needs to allow growth in technology� Avoid an “embarrassingly parallelizable” workload• Elasticity + large Set size• Properties inherited from TPC-E schema
� Blades or clusters not prohibited or discouraged
30 TPC TC 2010

Challenges� Schedule� Dependence on member companies committing development resources
� Throwing problems over the wall at the driver/RTE� Usual committee issues
31 TPC TC 2010

Acknowledgements� The TPC-V benchmark is being developed through the efforts of contributors from more than a dozen companies. Much of the material reported here is the result of the work of the committee members as a whole, rather than the authors.
� We would in particular like to acknowledge the contributions of John Fowler, Karl Huppler, Doug Johnson, Matthew Lanken, Jody McCoy, Arno Mihm, Pete Peterson, Francois Raab, Cecil Reames, Jamie Reding, and Wayne Smith.
32 TPC TC 2010
Raab, Cecil Reames, Jamie Reding, and Wayne Smith.