trace element distribution among rock-forming minerals in...
TRANSCRIPT

American Mineralogist, Volume 84, pages 1256–1269, 1999
0003-004X/99/0009–1256$05.00 1256
Trace element distribution among rock-forming minerals in Black Hills migmatites,South Dakota: A case for solid-state equilibrium
PETER I. NABELEK
Department of Geological Sciences, University of Missouri-Columbia, Columbia, Missouri 65211, U.S.A.
INTRODUCTION
Migmatites are of interest to petrologists because many arethought to represent source regions for granitic melts. Carefulanalyses of migmatites potentially can yield important informa-tion about melt-forming reactions, melt-extraction processes, andscales of chemical equilibrium in granite source regions. Thisstudy was undertaken to evaluate whether distributions of traceelements controlled by rock-forming minerals in melanosomesand leucosomes of migmatites can be used as an analogue forequilibrium between residue and melt in granite source regions.Residue-melt equilibrium is a fundamental assumption in traceelement models for granite petrogenesis (Hanson 1978). Previ-ous studies of peraluminous migmatites have demonstrated thathigh field-strength elements, such as Zr, Th, and trivalent rare-earth elements (REE), may not reach equilibrium concentrationsin partial melts because their concentrations are controlled byaccessory minerals that may be refractory or remain as inclu-sions in residual major minerals during melting (Bea 1996;Johannes et al. 1995; Nabelek and Glascock 1995; Sawyer 1991;Watt and Harley 1993; Watt et al. 1996). Observations of deple-tions in high field-strength elements have led to inferences ofrapid melt extraction or rapid cooling of granite source regions(e.g., Sawyer 1991; Watt et al. 1996).
In contrast to high field-strength elements, in many casesthe behavior of Eu2+, Rb, Cs, Sr, and Ba in migmatites is dif-ferent. Although in some leucosomes Sr and Ba occur in rela-tively low concentrations and REE patterns have negative Euanomalies, in many other leucosomes these elements are highly
ABSTRACT
Proterozoic migmatites in the Black Hills, South Dakota, were examined to determine if parti-tioning of trace elements hosted by rock-forming minerals between melanosomes and leucosomespreserves residue-melt equilibrium that was presumably established during partial melting of peliticlithologies. Granitic leucosomes in the Black Hills, as is often the case elsewhere, have positive Euanomalies, are highly enriched in Sr and Ba, and are depleted in Rb and Cs relative to granitesderived by partial melting of metapelites. Distributions of these trace elements between melano-somes and leucosomes cannot be simulated using mineral-melt distribution coefficients. A metamor-phic reaction-progress method is used to demonstrate that the distributions approach mineral-mineralequilibrium rather than mineral-melt equilibrium. Application of published diffusion data for therelevant elements in feldspars shows that solid-state equilibrium is unlikely to have been establishedduring subsolidus cooling. Instead, it is suggested that partial melts maintained chemical equilibriumwith melanosomes during crystallization that lead to the migmatites.
enriched in comparison to spatially related leucogranites (e.g.,Brown and D’Lemos 1991; Power 1993). Such enrichments inthe divalent cations previously have been attributed to processessuch as fractional crystallization of feldspars in leucosomes orpreferential melting of feldspar-containing layers (Cuney andBarbey 1982; Sawyer 1987; Johannes et al. 1995). However,Fourcade et al. (1992) argued that trace element distributionsbetween melanosomes and leucosomes in St. Malo, France,migmatites approach mineral-mineral equilibrium rather thanresidue-melt equilibrium. They ascribed this to reequilibrationof trace elements among melanosome and leucosome miner-als by diffusion during cooling of the migmatite terrane. Us-ing published diffusion rates of trace elements in relevantminerals, Fourcade et al. (1992) inferred the cooling rate ofthe St. Malo migmatite terrane. In contrast, Bea et al. (1994)assumed that the distribution of alkali, alkali earth, transitionmetals, and some other non-high field-strength elements be-tween melanosome minerals and leucosomes in Peña Negra,Spain, migmatites represents mineral-melt equilibrium. Oneresult of this assumption is that many of their inferred mineral/melt distribution coefficients are drastically different from thosepredicted by experimental studies and observed in rhyolite sys-tems (cf. Icenhower and London 1995, 1996; Mahood andHildreth 1983; Nash and Crecraft 1985). This raises the ques-tion of whether the distribution coefficients of Bea et al. (1994)in fact reflect frozen residue-melt equilibrium rather thanmineral-mineral equilibrium.
The purpose of this paper is to evaluate the distributions ofperiod-four transition metals, Eu, Rb, Cs, Sr, and Ba in BlackHills, South Dakota, migmatites because these elements arecritical to petrogenetic models for magma-forming processesin the crust. The commonly made assumption that trace ele-*E-mail: [email protected]

NABELEK: TRACE ELEMENT DISTRIBUTION IN MIGMATITES 1257
ment distribution between melanosomes and leucosomes inanatectic migmatites represents residue-melt equilibrium isexamined critically from the viewpoint of mineral-melt equi-librium and by a mineral reaction-progress approach, whichassumes mineral-mineral equilibrium. This work builds on pre-vious studies of the Black Hills migmatites that addressed theoccurrence of partial melting (Shearer et al. 1987), the role ofaccessory minerals in controlling the distribution of REE inleucogranites (Nabelek and Glascock 1995), and the origin ofquartz-sillimanite leucosomes in the migmatites (Nabelek1997). The migmatites are particularly well suited for exami-nation of trace-element distributions because the mineralogyand geochemistry of equivalent schists at lower grades areknown and compositions of leucosomes can be compared withthe neighboring Harney Peak leucogranite, which was derivedby partial melting of rocks equivalent to the migmatiteprotoliths. Thus, the geologic context of the migmatites placesimportant constraints on interpretation of their chemistry.
GEOLOGY AND METAMORPHISM OF SOUTHERNBLACK HILLS
Migmatites in the southern Black Hills are a by-product ofa complex Precambrian tectonic, metamorphic, and plutonichistory of rocks that became exposed during the Laramide orog-eny (Redden et al. 1990). The Precambrian terrain is domi-nated by Late-Archean to Middle-Proterozoic quartzites and
schists, including metapelites and metagraywackes, which wereintruded by the Harney Peak leucogranite (HPG) and associ-ated pegmatites (Fig. 1). In the portion of the Black Hills shown,metamorphic grade increases from garnet + chlorite to secondsillimanite west of the main HPG pluton. Assemblages in theschists above the staurolite isograd include staurolite, garnet,biotite, muscovite, quartz, plagioclase, and accessory miner-als, including monazite, zircon, apatite, xenotime, and graph-ite. The first sillimanite isograd appears to be related to thebreakdown of staurolite. The second sillimanite isograd to thewest and within the main HPG pluton corresponds to extensivemigmatization of the schists (Shearer et al. 1987; Nabelek1997). The migmatites are subject of this paper.
The dominant structural feature of schists in the southernBlack Hills is a north-northwest-trending, steeply dipping fo-liation. However, closer to the main body of the HPG, the fo-liation changes from steeply dipping to flat lying and the contactbetween the schist and granite is mostly concordant to folia-tion. Within the second sillimanite zone, boudinage structuresare common (Fig. 2), which implies probable intrusion of gran-ite below the schist outcrops.
The HPG, its satellite plutons, and pegmatites wereemplaced as thousands of dikes and sills. Their dominant min-erals are albitic plagioclase, microcline, quartz, muscovite, andtourmaline or biotite. The granites comprise two suites withdistinct δ18O values and initial ratios of 143Nd/144Nd and 207Pb/204Pb. Whole-rock δ18O values of granites from central parts ofthe main pluton are 10.8–12.8‰ with an average of 12.0‰(low-δ18O suite), whereas values of samples from the flanks ofthe main pluton and satellite intrusions are 12.3–13.6‰ withan average of 13.1‰ (high-δ18O suite; Nabelek et al. 1992b).The average of the latter values is virtually the same as theaverage for the country rock schists (Nabelek and Bartlett 1998).Similarly, potassium feldspars from samples of the high- andlow-δ18O suites define distinct 207Pb/204Pb-206Pb/204Pb arrays,with values for the high-δ18O granites similar to the schists atthe time of granite generation (Krogstad et al. 1993). Krogstadand Walker (1996) obtained a range of εNd(1715 Ma) from –6.4to –9.9 for the low-δ18O suite and –2.0 to –7.4 for the high-δ18Osuite. Again, the high end of the range for the high-δ18O suiteoverlaps that of the Proterozoic country rocks. Thus, the threeisotopic systems suggest that the metasedimentary rocks areequivalent to sources of the high-δ18O granite suite. Further-more, petrogenetic models for the HPG indicate that the suitewas generated mostly by muscovite dehydration-melting(Nabelek et al. 1992a; Nabelek and Bartlett 1998) as have themigmatites (see below). Because muscovite dehydration-melt-ing is essentially a discontinuous reaction (Patiño-Douce andHarris 1998), composition of the high-δ18O HPG suite servesas a useful indicator of the expected composition of leucosomesderived by partial melting of metapelitic rocks.
Ages of garnets from the metamorphic rocks range from1760–1720 Ma, reflecting the duration of regional metamor-phism (Dahl and Frei 1998; Dahl et al. 1998). Redden et al.(1990) obtained a discordant U-Pb zircon age of 1728 Ma anda concordant 1715 Ma monazite age for the HPG. The meta-morphism, deformation, and granite generation are related tothe Trans-Hudson orogeny (Nabelek et al. 1999).
quar tz i te
amphibolite
ironformation
Archean
S t
S
SK
schis ts
H a r n e y P e a kG r a n i t e
tuffaceous unit
44°
43°45’
103°45’ 103°30’
3 km
N
migmatites
K
Pa
leo
zoic
Zone of Pegmatites
Zone of Pegm
atites
FIGURE 1. Geologic map of the Proterozoic terrane in the southernBlack Hills (after Dewitt et al. 1989). Thin lines, including dashedlines, are faults; heavy lines are isograds. Other abbreviations: St =staurolite, S = first sillimanite, SK = second sillimanite, K = kyanite.A tuffaceous shale unit (now schist) is highlighted to show the majorfold structures. Black dots show locations of chemically analyzed schistsamples. Migmatites occur above second sillimanite isograd.

NABELEK: TRACE ELEMENT DISTRIBUTION IN MIGMATITES1258
ANALYTICAL TECHNIQUES AND MINERAL MODES
Thirty samples of schists, seven sets of leucosome, mel-anosome, and mesosome, eight additional leucosomes, twomelanosomes, and thirteen mesosomes were analyzed for ma-jor and trace elements (Tables 1 and 21). Major elements andSr, Ba, Pb, Ni, V, Nb, Zr, Y, and Ga were determined by X-rayfluorescence methods at Washington University, St. Louis. Rb,Cs, Th, U, Sc, Co, Cr, Zn, Ta, Hf, and REE were determined byinstrumental neutron activation analysis at the University ofMissouri Research Reactor. Mineral analyses were obtainedon a JEOL 733 Superprobe at Washington University.
For purposes of models that are described below, it was use-ful to determine mineral modes in the analyzed rocks. Themodes were determined by least-squares fit of mineral compo-sitions to major element whole-rock compositions. It was as-sumed that
B A Xi jj
k
i j==
∑1
,(1)
where Bi is the weight percent of ith oxide in a rock consistingof k minerals, Xi,j is the weight percent of each oxide i in eachmineral j, and Aj is the modal abundance of each mineral. Equa-tion 1 was then solved by the method of least squares for Aj
values in each sample. Average biotite, muscovite, and garnetcompositions (Table 3) and separate albite and anorthite com-ponents were used. Because the main concern for the migmatitesis the mineralogy they would have had just prior to melting,only quartz, biotite, muscovite, garnet, and plagioclase werecalculated for the schists (Appendix Table 1). Sillimanite isminor and therefore was not included. For the migmatites, po-tassium feldspar was used instead of muscovite, stoichiomet-ric sillimanite was included, and garnet was excluded becauseit is lacking in most migmatites (Appendix Table 1). All calcu-lations were done on an anhydrous basis.
MIGMATITES
Morphology and mineralogy
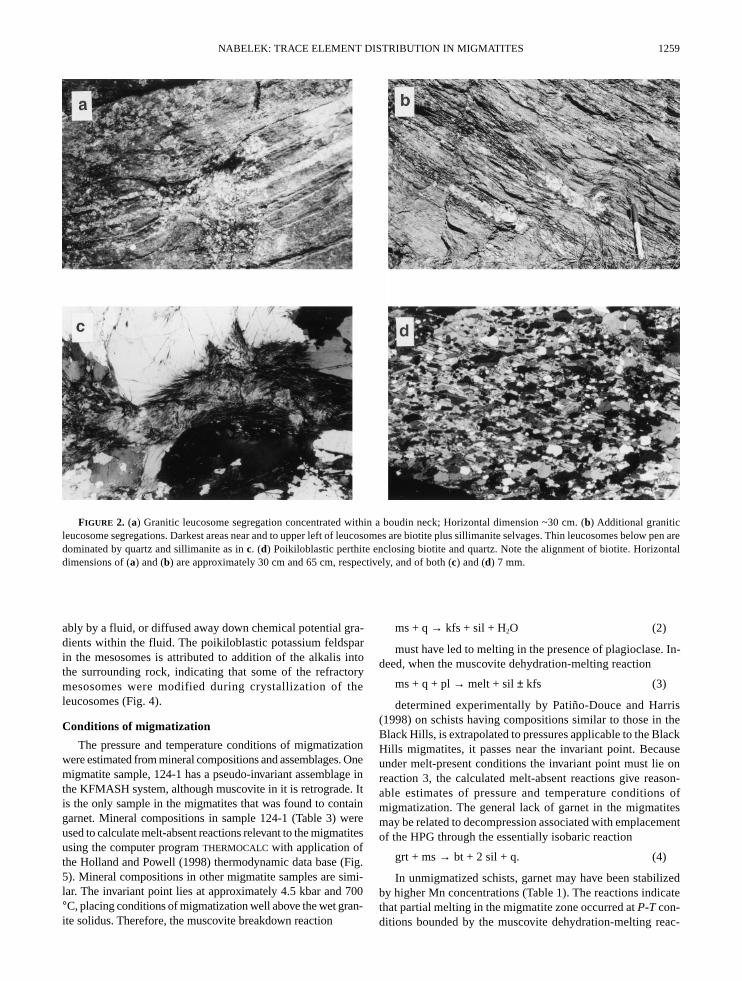
The stromatic migmatites above the second sillimaniteisograd were first described by Shearer et al. (1987) who mod-eled the generation of granitic leucosomes assuming partialmelting. Nabelek (1997) discussed the origin ofquartz-sillimanite leucosomes that occur in addition to normalgranitic leucosomes. In addition to leucosomes, the migmatitesinclude well-developed dark selvages (melanosomes), and ap-parently non-migmatized portions (mesosomes; Fig. 2). Manyleucosomes are dominated by large quartz crystals with fibroliticsillimanite concentrated in centers of leucosomes (Fig. 2c).Tourmaline and fluorapatite are also present in some cases.Other leucosomes have normal granitic mineralogy in that theycontain microcline and albite instead of sillimanite. However,
all leucosomes have virtually the same SiO2/Al 2O3 ratios as theHPG (Fig. 3). The relative proportion of feldspar to sillimaniteis related only to the concentration of Na2O + K2O. Leucosomesthat contain feldspar are dominant in boudin necks or fracturesconnecting boudin necks, whereas sillimanite-containingleucosomes tend to occur in thick portions of boudins wherethey can be continuous for several decimeters to meters (Figs.2a and 2b). Both feldspar-rich and sillimanite-rich leucosomesin the boudins range from about a centimeter to decimeter,whereas those in boudin necks can be decimeters across. Simi-lar leucosome-filled boudin necks are relatively common else-where in anatectic migmatites (Brown 1994). They occur dueto movement of melt into low pressure zones. The melanosomesare dominated by biotite and sillimanite (Fig. 2b and Fig. 4),but minor quartz also occurs in some. Biotite is generally coarserin melanosomes than in mesosomes or schists at lower grades.It also includes monazite grains that contain the majority of Thand REE in the rocks (Nabelek and Glascock 1995). Mesos-omes contain various proportions of quartz, biotite, silliman-ite, and plagioclase. Some mesosomes also containpoikiloblastic potassium feldspar that includes the other meso-some minerals (Fig. 2d). Included biotite in many cases pre-serves the dominant foliation direction of the mesosome. Asexpected for conditions above the second-sillimanite isograd,muscovite is lacking in the migmatites except for retrogradegrains after sillimanite. The muscovite is clearly late as it hasgrown randomly, commonly across foliation. Similarly,anhedral tourmaline replacements of sillimanite can be found.
Based on mass-balance relationships among the leucosomes,melanosomes, mesosomes, and schists, and considerations ofmorphology of both leucosome types, Nabelek (1997) arguedthat both leucosome types were originally granitic melts thatformed by partial melting of the metapelites. In addition tomass-balance arguments and occurrence of leucosomes inboudin necks, the narrow range of SiO2/Al 2O3 ratios supportspartial melting rather than solid-state segregation or metaso-matic processes as these would likely lead to variable ratios.Crystallization of sillimanite instead of feldspar in the partialmelts is ascribed to high H+/(K++Na+) conditions resulting fromthe high concentration of F that is indicated by the presence offluorapatite. K and Na were carried from the partial melts, prob-
1For a copy of Tables 1 and 2, document item AM-99-021, con-tact the Business Office of the Mineralogical Society of America(see inside front cover of recent issue) for price information.Deposit items may also be available on the American Miner-alogist web site (http://www.minsocam.org or current web ad-dress).
TABLE 3. Mineral compositions* used in calculation of petrogeneticgrid and mineral modes
Migmatite 124-1† Average metasedimentary rocks‡Biotite Muscovite Garnet Biotite Muscovite Apatite
SiO2 34.2 44.3 36.6 34.2 44.9 0.0TiO2 1.91 0.52 0.03 1.91 0.48 0.0Al2O3 20.9 35.8 22.5 20.9 38.0 0.0FeO 21.0 1.16 30.4 21.0 0.9 0.45MnO 0.11 0.02 5.98 0.11 0.0 1.03MgO 7.9 0.52 2.12 7.9 0.48 0.0CaO 0.0 0.01 1.55 0.0 0.0 53.6Na2O 0.17 0.58 0.0 0.17 1.18 0.0K2O 8.84 10.4 0.0 8.84 9.16 0.0P2O5 0.0 0.0 0.0 0.0 0.0 41.7* End-members of quartz, anorthite, albite, potassium feldspar, and silli-manite were assumed as phases, except for calculation of petrogeneticgrid where Or90Ab10 was assumed for potassium feldspar.† Compositions used in calculation of petrogenetic grid.‡ Compositions used in calculation of mineral modes.
NABELEK: TRACE ELEMENT DISTRIBUTION IN MIGMATITES 1259
ably by a fluid, or diffused away down chemical potential gra-dients within the fluid. The poikiloblastic potassium feldsparin the mesosomes is attributed to addition of the alkalis intothe surrounding rock, indicating that some of the refractorymesosomes were modified during crystallization of theleucosomes (Fig. 4).
Conditions of migmatization
The pressure and temperature conditions of migmatizationwere estimated from mineral compositions and assemblages. Onemigmatite sample, 124-1 has a pseudo-invariant assemblage inthe KFMASH system, although muscovite in it is retrograde. Itis the only sample in the migmatites that was found to containgarnet. Mineral compositions in sample 124-1 (Table 3) wereused to calculate melt-absent reactions relevant to the migmatitesusing the computer program THERMOCALC with application ofthe Holland and Powell (1998) thermodynamic data base (Fig.5). Mineral compositions in other migmatite samples are simi-lar. The invariant point lies at approximately 4.5 kbar and 700°C, placing conditions of migmatization well above the wet gran-ite solidus. Therefore, the muscovite breakdown reaction
ms + q → kfs + sil + H2O (2)
must have led to melting in the presence of plagioclase. In-deed, when the muscovite dehydration-melting reaction
ms + q + pl → melt + sil ± kfs (3)
determined experimentally by Patiño-Douce and Harris(1998) on schists having compositions similar to those in theBlack Hills, is extrapolated to pressures applicable to the BlackHills migmatites, it passes near the invariant point. Becauseunder melt-present conditions the invariant point must lie onreaction 3, the calculated melt-absent reactions give reason-able estimates of pressure and temperature conditions ofmigmatization. The general lack of garnet in the migmatitesmay be related to decompression associated with emplacementof the HPG through the essentially isobaric reaction
grt + ms → bt + 2 sil + q. (4)
In unmigmatized schists, garnet may have been stabilizedby higher Mn concentrations (Table 1). The reactions indicatethat partial melting in the migmatite zone occurred at P-T con-ditions bounded by the muscovite dehydration-melting reac-
FIGURE 2. (a) Granitic leucosome segregation concentrated within a boudin neck; Horizontal dimension ~30 cm. (b) Additional graniticleucosome segregations. Darkest areas near and to upper left of leucosomes are biotite plus sillimanite selvages. Thin leucosomes below pen aredominated by quartz and sillimanite as in c. (d) Poikiloblastic perthite enclosing biotite and quartz. Note the alignment of biotite. Horizontaldimensions of (a) and (b) are approximately 30 cm and 65 cm, respectively, and of both (c) and (d) 7 mm.

NABELEK: TRACE ELEMENT DISTRIBUTION IN MIGMATITES1260
tion, reaction 4, and a melt-present reaction analogous to thefollowing one:
sil + bt + 2q → grt + kfs + H2O. (5)
During cooling, however, crystallization of leucosomeslikely proceeded toward the wet granite solidus. The estimatedpressure and temperature conditions for migmatization are con-sistent with thermobarometry on rocks below the second silli-manite isograd (Helms and Labotka 1991; Friberg et al. 1996).
0
5
1 0
15
20
25
40 50 60 70 80 90 1 0 0
leucosomesmelanosomesmesosomes
Al 2
O3
S iO2
quartz
sillimaniteavg.H P G
FIGURE 3. Covariation of Al2O3 and SiO2 in Black Hills migmatites.Mesosome compositions are dominantly controlled by mixtures ofquartz with micas and melanosome compositions by mixtures of biotiteand sillimanite with some quartz. Removal of alkalis (mass loss) fromgranitic leucosomes moves composition toward quartz + sillimanitemixing line. Average composition of the Harney Peak Granite (Nabeleket al. 1992a) is shown for reference.
avg.HPG
L-A/AKF
M-A/AKF
P-A/AKF
sil
K
A
F
ms
grt
bt
Kfs
leucosomes
melanosomes
mesosomes
schists
FIGURE 4. AKF diagram showing compositions of Black Hillsmigmatites. Compositions of relevant migmatite minerals (Table 3)and average Harney Peak Granite (Nabelek et al. 1992a) are shownfor reference. Note that position of melanosomes relative tomesosomes requires formation of granite leucosomes. Formation ofsillimanite-dominated leucosomes without previous loss of potassiumcannot explain relative positions of melanosomes and mesosomes.Also note some mesosomes are anomalously enriched in K.
grt + kfs + H2 O
2
3
4
5
6
7
8
600 650 700 750
Reactions in migmatites
temperature ( °C)
pres
sure
(kb
ar)
granite solidus
grt + ms
sil + bt + q
Isil + bt + q
800
bt +
ms
+ q
grt +
kfs
+ H
2O
P&
H98
ms + q
kfs +
sil +
H 2O
FIGURE 5. Petrogenetic grid relevant to Black Hills migmatites.Melt-absent reactions were calculated using mineral compositions insample 124-1 (Table 3). Experimentally determined dehydration-meltingsolidus of a schist, similar in composition to Black Hills schists, byPatiño-Douce and Harris (1998) is also shown. The reaction is ms + pl +q → melt + sil + bt + kfs. The dashed part of the reaction is extrapolated.The patterned field indicates bounding pressure and temperatureconditions in the migmatites, from melting at the muscovite breakdownreaction to cooling toward the wet granite solidus. Mineral abbreviationsare: bt = biotite, grt = garnet, kfs = potassium feldspar, ms = muscovite,pl = plagioclase, q = quartz, sil = sillimanite.
Trace-element systematics
The distribution of each examined trace element in themigmatites is considered in terms of the major oxide withwhich it is highly correlated in the schists (Appendix Table2). Co, Zn, and Cr correlate well with MgO; Rb and Ba corre-late well with K2O; and Sr correlates well with Na2O (Figs.6–8). In schists just below the second sillimanite isograd, MgOindicates the proportion of biotite, K2O the proportion of mus-covite plus biotite, and Na2O the proportion of feldspar. Incontrast, Cs correlates poorly with all major oxides in theschists (Appendix Table 2; Fig. 7). Nevertheless, Cs probablyresides primarily in micas as there are no other minerals withsites large enough to accommodate it.
In the different migmatite parts, correlations are good, ex-cept for few samples. However, the slopes of the correlationsare variable because the trace elements reside in different min-erals. For example, the concentration of Ba in most leucosomesis related to amount of feldspar, whereas in the melanosomesit is related to the amount of biotite. In contrast to themigmatites and schists, in the HPG the correlations are poor(Figs. 7 and 8). This suggests trace element concentrations inthe HPG were controlled by residue-melt equilibrium duringpartial melting coupled with fractional crystallization insteadof mineral proportions (see below).
REE patterns of the leucosomes are flat at lowchondrite-normalized concentrations (Fig. 9) except for onesample, 118-1-L, which has high REE (~100× chondrite) andan unusually high modal proportion of apatite (9.1%). Somepatterns have large positive Eu anomalies. The leucosome REE

NABELEK: TRACE ELEMENT DISTRIBUTION IN MIGMATITES 1261
patterns are similar to patterns of the high-δ18O granites, ex-cept that the granites never have positive Eu anomalies (Nabelekand Glascock 1995). The melanosomes, overall, have the high-est REE concentrations because the bulk of monazite remainedin residual biotite; melanosome and their REE patterns havelarge negative Eu anomalies. The mesosomes have intermedi-ate REE patterns that are similar to those of the schists (Nabelekand Glascock 1995).
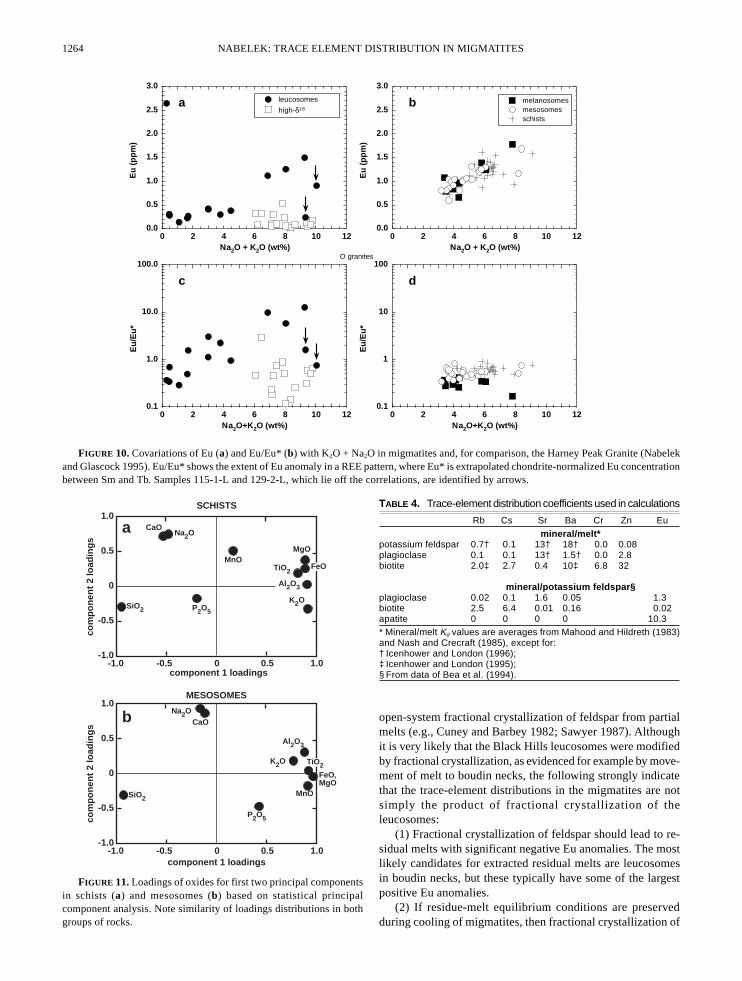
In the schists and melanosomes, Eu correlates fairly wellwith both TiO2 and Al2O3 (Appendix Table 2). This is an indi-rect correlation because much of the Eu, especially Eu3+, is inmonazite inclusions in biotite. In contrast, in leucosomes mostof the Eu2+ is probably in feldspars. Therefore, the distributionof Eu is plotted against Na2O + K2O (Fig. 10). The ratio ofEu2+/Eu3+ in the migmatites is probably high because of reduc-ing conditions that are suggested by the presence of graphite.Note that most samples show a correlation between the magni-tude of the positive Eu anomaly with the amount of feldspar,but the two most feldspar-rich samples have almost no anomaly(Fig. 10c).
CHEMICAL RELATIONSHIP OF MIGMATITES TOLOWER GRADE ROCKS
For the purposes of modeling trace-element behavior in themigmatites, it is better to use average trace-element concentra-tions of the schists than of the mesosomes because some of thelatter were compositionally modified as evidenced by poikilo-blastic potassium feldspar. Therefore, it must be establishedthat protoliths of the migmatites were chemically equivalent tothe schists. Because of the original sedimentary nature of therocks, the equivalence was tested by principal component analy-sis of major elements in the schists and mesosomes. The samefour principal components describe most of the variance in bothgroups of rocks. The first prominent component correspondsto anticorrelation of SiO2 (quartz) with oxides that make upmicas, the second component to CaO and Na2O (plagioclase),the third component to MnO (mostly garnet), and the fourthcomponent to P2O5 (phosphates). The four components describe53.5, 17.5, 11.8, and 10.2% of the variance, respectively, in theschists and 60.5, 21.2, 10.1, and 5.8% in the mesosomes. Theloadings of all oxides in the principal components are similarin both groups of rocks, except for MnO, which probably re-sides mostly in biotite instead of garnet above the second silli-manite isograd (Fig. 11). The similarity of loadings stronglysuggests that, although the chemical variation is large in boththe migmatites and schists, the average compositions of theirprotoliths were similar. Indeed, similar ranges of trace elementconcentrations in the mesosomes and schists (Figs. 6–8, 10)indicate that this was the case. Therefore, it is reasonable touse compositions of the schists as proxies for migmatiteprotoliths.
EVALUATION OF RESIDUE-MELT EQUILIBRIUM
To demonstrate that trace-element distributions among theBlack Hills melanosomes and leucosomes are not consistentwith residue-melt equilibrium, it is useful to evaluate the dis-tributions using mineral-melt distribution coefficients. Concen-tration of a trace element in a partial melt, Cl, is given by the
1
10
100
1000
0.01 0.1 1 10
Zn
(p
pm
)
MgO (wt%)
a
0.1
1
10
100
0.01 0.1 1 10
Co
(p
pm
)
MgO (wt%)
b
10
100
1000
0.01 0.1 1 10
Cr
(pp
m)
MgO (wt%)
c
melanosomesmesosomesschists
high-δ18O granites
leucosomes
model meltmodel residue
FIGURE 6. Covariations of period-four transition metal traceelements with MgO. Note the logarithmic scales. Model Zn (a) and Cr(c) concentrations in a model partial melt and residue are also shown.Lack of distribution coefficient data for Co (b) prevents calculation ofmodel compositions.
equilibrium mass-balance relationship between residue andmelt, Cl = Co/[D(1–F) + F] (Hanson 1978), where Co is con-centration of the trace element in the parent rock, F is fractionof melting, and D = ΣYjKj, where Yj is proportion of mineral j inthe residue and Kj is the distribution coefficient of the trace

NABELEK: TRACE ELEMENT DISTRIBUTION IN MIGMATITES1262
0
100
200
300
400
500
600
700
0 2 4 6 8 10
high-δ18O granites
leucosomes
model melt
Rb
(p
pm
)
K2O (wt%)
a0
100
200
300
400
500
600
700
0 2 4 6 8 10
melanosomesmesosomesschistsmodel residue
Rb
(p
pm
)
K2O (wt%)
b
1
10
100
0 2 4 6 8 10
Cs
(pp
m)
K2O (wt%)
c1
10
100
0 2 4 6 8 10
Cs
(pp
m)
K2O (wt%)
d
FIGURE 7. Covariations of Rb (a, b) and Cs (b, c) with K2O in migmatites and, for comparison, the Harney Peak Granite, model partial melt,and model residue. Concentrations of Rb and Cs are lower in leucosomes relative to the high-δ18O granites and the model melt. There are goodcorrelations of the trace elements with K2O in leucosomes. Arrows identify two samples, 115-1-L and 129-2-L, that fall off correlations inFigures 8 and 10.
0
50
100
150
200
250
300
350
400
0 1 2 3 4 5 6 7 8
high-δ18O granites
leucosomes
model melt
Sr
(pp
m)
Na2O (wt%)
a
0
50
100
150
200
250
300
350
400
0 1 2 3 4 5 6 7 8
mesosomesmelanosomes
schistsmodel residue
Sr
(pp
m)
Na2O (wt%)
b
0
500
1000
1500
2000
2500
0 2 4 6 8 10
Ba
(pp
m)
K2O (wt%)
c
0
500
1000
1500
2000
2500
0 2 4 6 8 10
Ba
(pp
m)
K2O (wt%)
d
FIGURE 8. Covariations of Sr (a, b) and Ba (b, c) with K2O and Na2O in migmatites and, for comparison, the Harney Peak Granite, modelpartial melt, and model residue. Concentrations of Sr and Ba are higher in leucosomes relative to the high-δ18O granites and the model melt.There are good correlations of the trace elements with the major oxides in leucosomes except for two samples, 115-1-L and 129-2-L (identifiedby arrows), that fall off the correlations.

NABELEK: TRACE ELEMENT DISTRIBUTION IN MIGMATITES 1263
element between mineral j and melt (Table 4). Here, the valuesof Yj correspond to average mineral proportions in the melano-somes (43% biotite, 2% plagioclase, 4% orthoclase, 12% silli-manite, and 39% quartz) and the values of Co are averageelement concentrations in the schists. F is assumed to be 0.25based on the average potential fertility of the schists assumingonly muscovite dehydration-melting reaction (Nabelek andBartlett 1998). The equilibrium concentration of the trace ele-ment in the model residue, Cs, is given by Cl⋅D. For elementscompatible with respect to residue, results are relatively insen-sitive to a reasonable range in F values.
The calculated concentrations of Cr, Co, and Zn in the modelmelt and residue match well those in the leucosomes and mel-anosomes (Fig. 6). Indeed, the good match could be interpretedto indicate that the melanosome and leucosome compositionsare the result of residue-melt equilibrium, where the large dif-ferences in the relative concentrations are due to the large val-ues of Kbt for the transition metals (Table 4). On the other hand,there are no minerals in the leucosomes that can take up largeamounts of transition metals, although sillimanite can poten-tially contain appreciable concentrations of Cr. The transitionmetals occur mostly in biotite, which is concentrated in themelanosomes. Because the transition metals also reside withinbiotite in rocks that have not undergone melting, the distribu-tion of the transition metals among the melanosomes andleucosomes can also be interpreted as simply reflecting the pro-portion of biotite.
In contrast to the transition metals, concentrations of Rb,Cs, Ba, Sr, and Eu in the leucosomes are quite different fromthose in the model melt and the HPG. Except for two samples,115-1-L and 129-2-L, which fall off correlation trends for thedivalent cations (Figs. 8 and 10), the concentrations of Rb andCs are substantially lower and those of Sr, Ba, and Eu are higherin the leucosomes than in the granite or the model melt for agiven K2O or Na2O concentration. Similarly, the model residuecompositions do not match compositions of the melanosomes.The Rb and Cs concentrations in the model residue are signifi-cantly lower and those of Sr and Ba are higher than in the mel-anosomes. These discrepancies indicate that residue-meltequilibrium was not preserved in the migmatites.
Another indication that residue-melt equilibrium was notpreserved in the migmatites is in the contrasting behavior ofthe trace elements in the migmatites and the HPG. As shown inFigures 6–8 and 10, concentrations of the examined trace ele-ments in the HPG do not correlate with the proportion of anymineral. The lack of correlation is consistent with partial melt-ing of heterogeneous source rocks with variable residue min-eralogy leading to small batches of melt (Nabelek and Bartlett1998). If the composition of the leucosomes was controlled byresidue-melt equilibrium, then their trace element concentra-tions should show similar lack of correlations with major ele-ment oxides as the HPG. Instead, the good correlations indicatea mineralogical control on the trace element distributions.
FRACTIONAL CRYSTALLIZATION
Several investigators ascribed leucosomes with high con-centrations of Sr, Ba, and REE patterns with positive Eu anoma-lies (as observed in some Black Hills leucosomes) to
1
10
100
1000sa
mp
le/c
ho
nd
rite
leucosomesa
La Ce Nd Sm Eu Tb Yb Lu
1
10
100
1000
sam
ple
/ch
on
dri
te
melanosomes
b
La Ce Nd Sm Eu Tb Yb Lu
1
10
100
1000
sam
ple
/ch
on
dri
te
mesosomesc
La Ce Nd Sm Eu Tb Yb Lu
FIGURE 9. Chondrite-normalized rare earth element patterns inBlack Hills migmatites. (a) Patterns of leucosomes are flat and low,except for one sample with 9.1% apatite. Most, but not all leucosomesthat contain feldspar have positive Eu anomalies (Fig. 10). Apparentnegative Nd anomalies are likely due to fractionation by the accessoryminerals in melanosomes. (b) REE concentrations in melanosomesare the highest in the migmatites. (c) REE patterns of mesosomes aretypical for pelitic rocks. Values for chondites were taken from Haskinet al. 1966).
NABELEK: TRACE ELEMENT DISTRIBUTION IN MIGMATITES1264
0.0
0.5
1.0
1.5
2.0
2.5
3.0
0 2 4 6 8 10 12
high-δ18
O granites
leucosomes
Eu
(p
pm
)
Na2O + K2O (wt%)
a
0.0
0.5
1.0
1.5
2.0
2.5
3.0
0 2 4 6 8 10 12
schists
melanosomesmesosomes
Eu
(p
pm
)
Na2O + K2O (wt%)
b
0.1
1.0
10.0
100.0
0 2 4 6 8 10 12
Eu
/Eu
*
Na2O+K2O (wt%)
c
0.1
1
10
100
0 2 4 6 8 10 12
Eu
/Eu
*
Na2O+K2O (wt%)
d
FIGURE 10. Covariations of Eu (a) and Eu/Eu* (b) with K2O + Na2O in migmatites and, for comparison, the Harney Peak Granite (Nabelekand Glascock 1995). Eu/Eu* shows the extent of Eu anomaly in a REE pattern, where Eu* is extrapolated chondrite-normalized Eu concentrationbetween Sm and Tb. Samples 115-1-L and 129-2-L, which lie off the correlations, are identified by arrows.
FeO,MgO
0 0.5-0.5 1.0-1.0
1.0
0.5
0
-0.5
-1.0
CaO
K2O
Al2O3
P2O5
MnOTiO2
FeO
MgO
SiO2
Na2O
SCHISTS
a
component 1 loadings
0 0.5-0.5 1.0-1.0
1.0
0.5
0
-0.5
-1.0
Na2OCaO
K2O
Al2O3
P2O5
MnO
TiO2
MESOSOMES
SiO2
b
component 1 loadings
com
po
nen
t 2
load
ing
sco
mp
on
ent
2 lo
adin
gs
FIGURE 11. Loadings of oxides for first two principal componentsin schists (a) and mesosomes (b) based on statistical principalcomponent analysis. Note similarity of loadings distributions in bothgroups of rocks.
TABLE 4. Trace-element distribution coefficients used in calculations
Rb Cs Sr Ba Cr Zn Eumineral/melt*
potassium feldspar 0.7† 0.1 13† 18† 0.0 0.08plagioclase 0.1 0.1 13† 1.5† 0.0 2.8biotite 2.0‡ 2.7 0.4 10‡ 6.8 32
mineral/potassium feldspar§plagioclase 0.02 0.1 1.6 0.05 1.3biotite 2.5 6.4 0.01 0.16 0.02apatite 0 0 0 0 10.3* Mineral/melt Kd values are averages from Mahood and Hildreth (1983)and Nash and Crecraft (1985), except for:† Icenhower and London (1996);‡ Icenhower and London (1995);§ From data of Bea et al. (1994).
open-system fractional crystallization of feldspar from partialmelts (e.g., Cuney and Barbey 1982; Sawyer 1987). Althoughit is very likely that the Black Hills leucosomes were modifiedby fractional crystallization, as evidenced for example by move-ment of melt to boudin necks, the following strongly indicatethat the trace-element distributions in the migmatites are notsimply the product of fractional crystallization of theleucosomes:
(1) Fractional crystallization of feldspar should lead to re-sidual melts with significant negative Eu anomalies. The mostlikely candidates for extracted residual melts are leucosomesin boudin necks, but these typically have some of the largestpositive Eu anomalies.
(2) If residue-melt equilibrium conditions are preservedduring cooling of migmatites, then fractional crystallization of

NABELEK: TRACE ELEMENT DISTRIBUTION IN MIGMATITES 1265
leucosomes should have no effect on the composition of mel-anosomes. However, the calculated Rb, Cs, Sr, and Ba concen-trations in the model residue do not match those inmelanosomes, even though the melanosome mineralogy wasused in determining mineral-melt distribution coefficients. Aswill be demonstrated below, the melanosomes did not remainchemically isolated from processes in the crystallizingleucosomes.
EVALUATION OF SOLID-STATE EQUILIBRIUM
There are two ways by which mineral-mineral equilibriumcould have been established between leucosomes and melano-somes. In the first way, equilibrium was established by diffu-sion during protracted cooling of a migmatite terrane only afterpartial melts crystallized without chemical interaction withmelanosomes. This is essentially the model that was proposedby Fourcade et al. (1992) for equilibration in the St. Malomigmatites. In the second, the preferred way, mineral-mineralequilibrium was established during crystallization ofleucosomes.
Post-crystallization equilibration
For the achievement of trace-element equilibrium betweenminerals through volume diffusion, the minerals must be forsufficient time above the blocking temperatures for diffusion.To estimate the period of time the Black Hills migmatites wereabove the blocking temperatures of the considered elements, atemperature-time path was calculated for rocks above thesecond-sillimanite isograd at a distance of 500 m from contactwith HPG (Fig. 12a). The values of input parameters are alsoshown in Figure 12a. It was assumed that the schists were at500 °C at the time of HPG emplacement, which is the maxi-mum temperature estimated by Holm et al. (1997) from 40Ar/39Ar data. Selecting a lower temperature would lead to fastercooling and therefore a smaller diffusion distance. The tem-perature of intrusion was assumed to be 850 °C, consistent withtemperatures of dehydration-melting reactions at high pressuresand the liquidus of the HPG (Nabelek and Ternes 1997). Thecalculated path shows that the rocks would have been above600 °C for ~4 Ma, followed by cooling to 570 °C at an averagerate of ~6.7 °C and then at a rate of 4.5 °C. These results can beused to estimate the extent of equilibration of trace elementsamong minerals in the migmatites.
The diffusion of Sr into orthoclase is used here as an example.There are two sets of experimental results for diffusion of Sr inorthoclase. The results of Giletti (1991; Do = 5.97 × 10⁻⁷ m2 /s,Ea = 167.360 kJ/mol) are for self-diffusion, which involves theexchange of Sr from an external source for Sr already in thecrystal structure. The results of Cherniak and Watson (1992;Do = 2.5 × 10⁻⁶ m2 /s, Ea = 284.083 kJ/mol) are for chemicaldiffusion, which involves the net addition of Sr into the crystalstructure. Chemical diffusion is rate-limited by the movementof network-forming Al and Si to preserve charge balance andis therefore much slower than self-diffusion. Equilibration offeldspars in migmatites that is modeled here would more likelyhave involved chemical diffusion, as there would have beennet addition of Sr into the feldspars that initially crystallizedfrom a low-Sr melt indicated by composition of the HPG and
the model partial melt (Fig. 8). On the other hand, the experi-ments of Giletti (1991) were done under hydrothermal condi-tions, analogous to likely subsolidus conditions in themigmatites.
For a grain 0.25 cm in diameter and cooling rate of 6.7 °C/Ma, application of the equation of Dodson (1973) yields block-ing temperature of 726 °C using values of diffusion parametersof Cherniak and Watson (1992) and 586 °C using the values ofGiletti (1991). The former result implies that Sr concentrationsacquired by orthoclase during its crystallization from melt shouldbe preserved through cooling of migmatites, whereas the latterresult implies that diffusion of Sr into the orthoclase structureduring subsolidus cooling could occur. For the latter result, theextent of plausible Sr diffusion into orthoclase was calculatedassuming tracer diffusion into a sphere (Crank 1975, p. 91). Thecalculated profile for 630 ̊ C and 5 Ma, the approximate averagetemperature and time that the Black Hills migmatites spent abovethe 586 °C blocking temperature (Fig. 12a), shows that Sr inorthoclase should be strongly zoned (Fig. 12b). Similar profiles
1 My 2 My 3 My 4 My0t i m e
tem
pe
ratu
re (
°C)
700
650
600
550
500
0
0.2
0.4
0.6
0.8
1.0
-0.05
distance from crystal edge (cm)
Sr
sou
rce
(C -
C1)
/ C
0 -
C1)
0 0.05 0.10 0.15 0.20 0.25
Ti of country rocks = 500°CT of intrusion = 850°Cradius of intrusion = 5 kmcrystallization interval = 200°Cheat of crystallization = 1x10⁵ J/kgthermal conductivity = 2.75 W/(m.K)heat capacity = 1x10³ J/(kg.K)density of rock = 2750 kg/m3
t = 5 MaT = 630° CD = 2.66x10⁻²¹ m2/s
C = concentrationC1 = initial concentrationC0 = surface concentration
b
a
5 My
FIGURE 12. (a) Theoretical temperature-time path for country rocks500 m from Harney Peak Granite contact following granite intrusion.(b) Theoretical Sr concentration profile in potassium feldspar that wouldresult from Sr equilibration among migmatite minerals while rockswere above the blocking temperature for diffusion.

NABELEK: TRACE ELEMENT DISTRIBUTION IN MIGMATITES1266
are obtained for Sr diffusion in albite and Ba diffusion in ortho-clase. They suggest that equilibration of the Black Hillsleucosomes with melanosomes during subsolidus cooling aloneat best would have led to poor correlations of Sr and Ba withNa2O and K2O, respectively. It is concluded, therefore, that equili-bration during subsolidus cooling was not the principal cause ofthe very good correlations and the enhanced Sr, Ba, and Eu con-centrations in the leucosomes above those in the HPG and modelmelt (Figs. 8 and 10).
Syn-crystallization equilibration
Solid-state equilibrium in migmatites also can be establishedduring crystallization of leucosomes if they maintain equilib-rium with surrounding melanosomes. As discussed above, par-tial melting by reaction 3 occurs above the temperature of thewater-saturated granite solidus at 3.5 kbar. Therefore, crystal-lization of the partial melts will proceed to lower temperaturesthan the solidus of a metapelite. The crystallization will lead topotassium feldspar instead of muscovite as the major K-bear-ing phase in leucosomes. The resulting assemblage in a mel-anosome-leucosome pair will be the same as would result fromprograde reaction 2. With the exception of few samples withretrograde muscovite, this is the case in the Black Hillsmigmatites. Thus, for the purposes of modeling the Black Hillsmigmatites, it can be assumed that their mineralogy is the prod-uct of reaction 2. Plagioclase and biotite can be considered tohave been passive participants during migmatite formation, theformer being distributed among corresponding leucosomes andmelanosomes and the latter becoming concentrated in the mel-anosomes.
A reaction-progress approach that was developed originallyby Chamberlain et al. (1990) for oxygen isotope fractionationduring net-transfer reactions is modified here for trace elementsto determine if the distribution of Rb, Cs, Sr, Ba, and Eu in themigmatites represents mineral-mineral equilibrium. The methodcombines mineral reaction-progress with trace-elementmass-balance constrained by mineral/mineral distribution co-efficients. The proportion of a mineral i during a net-transferreaction is given by
Xa a n
a n a nii i i i
i i j jj
= ++ ∑
ν ζ(6)
where v is the stoichiometric coefficient of i in the reaction, ais molecular weight of a mineral, n is number of moles of themineral before the reaction, ζ is the reaction progress variable,here assumed to be equal to 1 (i.e., reaction 1 went to comple-tion), and j refers to all minerals other than i. The concentra-tion of a trace element in the mineral i, assumed to be potassiumfeldspar in the calculations, is given by:
CC
X D Xio
j j jjj
=− + ∑∑1
(7)
where Dj is the distribution coefficient between a mineral j andthe mineral i. The concentration in another mineral is given byCj = Ci ⋅ Dj. Mineral/Kfp distribution coefficients (Table 4) wereextracted from the data of Bea et al. (1994) assuming Dj = Cj/Clc
⋅ Clc/ Ckfs, where Clc is concentration in leucosome. The numberof moles of each mineral before reaction was calculated fromthe average mode of the schists (35% quartz, 14% muscovite,20% plagioclase, 29% biotite, and 0.25% apatite). The reactioncoefficients were those of reaction 2 with coefficients for miner-als not partaking in the reaction, biotite and plagioclase, set tozero. The initial values of the Co terms were set equal to theaverage trace element concentrations of schists from the BlackHills: (i.e., Rb = 190 ppm, Cs = 15.8 ppm, Sr = 126 ppm, Ba =699 ppm, and Eu = 1.22 ppm). The logic behind using the aver-age mode and trace element concentrations of the schists is basedon the strong correlations of the considered elements with K2Oor Na2O. Therefore, for example, a rock that initially had moremuscovite than the average schist also had proportionately moreBa than the average schist. Following reaction at the second sil-limanite isograd, the initially higher amount of muscovite musthave translated into an equivalent amount of potassium feldspar.These assumptions are not entirely appropriate for Eu, because aportion of it resides in monazite, which was unreactive duringpartial melting (Nabelek and Glascock 1995). The assumptionsmay hold, however, for Eu2+.
The model was tested (see Fig. 13) by comparing the ob-served trace element concentrations with model concentrationsof Rb, Cs, Ba, Sr, and Eu in the bulk leucosomes and melano-somes, calculated from the values of Ci and modal mineral pro-portions (Appendix Table 1). With the exception of samples115-1-L and 129-2-L, the correspondence is good to excellentfor the five elements tested. There is very little difference be-tween model and observed concentrations of Sr and Ba. Al-though the correspondence trends for Rb are very linear, themodel concentrations somewhat underestimate the observedconcentrations of both leucosomes and melanosomes. This maybe because the assumed Co(Rb) was too low. Assumption of220 ppm for Co(Rb) would have yielded an excellent corre-spondence. The model Eu concentrations of leucosomes arehigher and of the melanosomes lower than the observed con-centrations, although the leucosome trend is fairly linear. Thediscrepancy is attributed to a significant proportion of Eu be-ing in monazite, which was not accounted for in the calcula-tion, within the melanosomes. The use of average schist modesand the implicit assumption of closed-system behavior also mayhave contributed to some discrepancies for all the examinedelements. However, the reaction-progress method minimizesdiscrepancies due to open-system behavior, such as fractionalcrystallization of leucosomes, because only mineral modes ofthe migmatites, not their compositions, are used in calculatingthe model concentrations.
The overall correspondence between model and observed con-centrations of the five trace elements in the leucosomes and mel-anosomes implies that equilibrium was maintained betweencrystallizing partial melts and melanosomes. Equilibration waslikely enhanced by the presence of fluids, either melt or vaporphase that was exsolving from the crystallizing melts. Evidentcoarsening of melanosome biotite indicates such equilibration.Only samples 115-1-L and 129-2-L fall significantly off the cor-relations for most of the five modeled elements. Their observedtrace element compositions correspond more to compositions ofthe model melt and the HPG (Figs. 8 and 10). These leucosomes

NABELEK: TRACE ELEMENT DISTRIBUTION IN MIGMATITES 1267
FIGURE 13. Model concentrations of Rb (a), Cs (b), Sr (c), Ba (d), and Eu (e) in leucosomes and melanosomes, calculated assuming solidstate equilibrium, are compared to observed concentrations. There is good correspondence between model and observed concentrations of thealkali and alkali earth elements for most samples. Samples 115-1-L and 129-2-L that plot near compositions of the HPG in Figures 8 and 10 areidentified by arrows. Compositions of these two samples suggests that they are either partial melts that did not achieve solid state equilibriumduring crystallization or are intruded granites. Model Eu concentrations for leucosomes are consistently higher than observed concentrationsand the converse is true for melanosomes. This is because monazite and other REE rich accessory minerals that are concentrated in melanosomeswere not accounted for in the model.
0
100
200
300
400
500
600
700
0 100 200 300 400 500 600 700
Rubidium
leucosomes
melanosomes
Mod
el R
b (p
pm)
Observed Rb (ppm)
a
0.1
1
10
100
0.1 1 10 100
Cesium
Mod
el C
s (p
pm)
Observed Cs (ppm)
b
1
10
100
1000
1 10 100 1000
Strontium
Mod
el S
r (p
pm)
Observed Sr (ppm)
c
10
100
1000
10000
10 100 1000 10000
BariumM
odel
Ba
(ppm
)
Observed Ba (ppm)
d
0.0
0.5
1.0
1.5
2.0
2.5
3.0
3.5
0.0 0.5 1.0 1.5 2.0 2.5 3.0 3.5
Europium
Mod
el E
u (p
pm)
Observed Eu (ppm)
e

NABELEK: TRACE ELEMENT DISTRIBUTION IN MIGMATITES1268
could not have equilibrated with melanosomes. However, it ismore likely that they are intruded HPG melts because they do nothave obvious melanosome selvages, even though they are con-cordant to foliation. Thus, the reaction-progress method providesa means for determining if intruded or locally generated meltsequilibrated with the surrounding rock during crystallization.
CONCLUDING REMARKS
Results of this study indicate that the distributions of Rb,Cs, Ba, Sr, Eu2+, and period-four transition metals betweenmelanosomes and leucosomes in migmatites can approachsolid-state equilibrium. The equilibrium is more likely achievedduring crystallization of partial melts leading to leucosomesthan by subsolidus eradication of residue-melt equilibrium thatis established during partial melting (cf. Fourcade et al. 1992).If solid-state equilibrium is common in migmatites, as suggestedfor example by the occurrences of positive Eu anomalies inREE patterns of leucosomes in many terranes (Sawyer 1987;Johannes et al. 1995; Watt and Harley 1993; Watt et al. 1996;Carrington and Watt 1995), then inferences from trace elementdistributions in migmatites about melt-forming processes in thecrust, such as identification of melt-forming reactions or kinet-ics or melting and melt extraction, may be difficult. In addi-tion, the behavior of trace elements hosted dominantly by majorrock-forming minerals may be quite different from those hostedmainly by accessory minerals such as monazite. Whereas theequilibrium of the former may adjust to new conditions through-out the migmatization process, as this study suggests, the lattermay not participate to an appreciable extent even during thefirst stage of migmatite formation, partial melting (Nabelek andGlascock 1996; Bea 1996).
ACKNOWLEDGMENTS
Cindy Bartlett and Michael Glascock, University of Missouri, conductedINAA analyses and Rex Couture, Washington University, did the XRF analy-ses. Dan Kremser, Washington University, helped with electron microprobeanalysis. Mona Sirbescu commented on the manuscript. The paper was signifi-cantly improved by careful and constructive comments of two anonymous re-viewers. This study was supported by NSF grant EAR-9417979.
REFERENCES CITED
Bea, F. (1996) Residence of REE, Y, Th and U in granites and crustal protoliths;Implications for the chemistry of crustal melts. Journal of Petrology, 37, 521–552.
Bea, F., Pereira, M.D., and Stroh, A. (1994) Mineral/leucosome trace-element parti-tioning in a peraluminous migmatite (a laser ablation-ICP-MS study). Chemi-cal Geology, 117, 291–312.
Brown, M. (1994) The generation, segregation, ascent and emplacement of granitemagma: the migmatite-to-crustally-derived granite connection in thickenedorogens. Earth Science Reviews, 36, 83–130.
Brown, M. and D’Lemos, R.S. (1991) The Caledonian granites of Mancellia, north-east Armorican Massif of France: relationship to the St. Malo migmatite belt,petrogenesis and tectonic setting. Precambrian Research, 51, 393–427.
Carrington, D.P. and Watt, G.R. (1995) A geochemical and experimental study ofthe role of K-feldspar during water-undersaturated melting of metapelites.Chemical Geology, 122, 59–76.
Chamberlain, C.P., Ferry, J.M., Rumble, D., III. (1990) The effect of net-transferreactions on the isotopic compositions of minerals. Contributions to Mineral-ogy and Petrology, 105, 322–336.
Cherniak, D.J. and Watson, E.B. (1992) A study of strontium diffusion in K-feld-spar, Na-K feldspar and anorthite using Rutherford backscattering spectros-copy. Earth and Planetary Science Letters, 113, 411–425.
Crank, J. (1975) The Mathematics of Diffusion (2nd edition), 414 p. Oxford Univ.Press, Oxford, U.K.
Cuney, M. and Barbey, P. (1982) Mise en evidence de phenomenes de cristallisationfractionnee dans les migmatites. Comptes-Rendus des Seances de l’Academie
des Sciences, Serie 2, 295, 37–42.Dahl, P.S. and Frei, R. (1998) Step-leach Pb-Pb dating of inclusion-bearing garnet
and staurolite, with implications for Early Proterozoic tectonism in the BlackHills collisional orogen, South Dakota, United States. Geology, 26, 111–114.
Dahl, P.S., Frei, R., and Dorais, M.J. (1998) When did the Wyoming Province col-lide with Laurentia?: New clues from step-leach Pb-Pb dating of garnet inde-pendent of its inclusions. Geological Society of America Abstracts with Pro-grams, 30, 109.
DeWitt, E., Redden, J.A., Buscher, D., and Burack-Wilson, A. (1989) Geologic mapof the Black Hills area, South Dakota and Wyoming. U.S. Geological Survey.Map I-1910.
Dodson, M.H. (1973) Closure temperature in cooling geochronological and petro-logical systems. Contributions to Mineralogy and Petrology, 40, 259–274.
Fourcade, S., Martin, H., and de Brémond d’Ars, J. (1992) Chemical exchange inmigmatites during cooling. Lithos, 28, 43–53.
Friberg, L.M., Dahl, P.S., and Terry, M.P. (1996) Thermometric evolution of earlyProterozoic metamorphic rocks from the southern Black Hills, South Dakota.In C.J. Paterson, and J.G. Kirchner, Eds., Guidebook to the Geology of theBlack Hills, South Dakota, p. 191–199. S.D. School of Mines and TechnologyBulletin, Rapid City, South Dakota.
Giletti, B.J. (1991) Rb and Sr diffusion in alkali feldspars, with implications forcooling histories of rocks. Geochimica et Cosmochimica Acta, 55, 1331–1343.
Hanson, G.H. (1978) The application of trace elements to the petrogenesis of igne-ous rock of granitic composition. Earth and Planetary Science Letters, 38, 26–43.
Haskin, L.A., Frey, F.A., Schmitt, R.A., and Smith, R.H. (1966) Meteoritic, solarand terrestrial rare earth distributions. Physics and Chemisty of the Earth, 7,167–321.
Helms, T.S. and Labotka, T.C. (1991) Petrogenesis of Early Proterozoic pelitic schistsof the southern Black Hills, South Dakota: Constraints on regional low-pres-sure metamorphism. Geological Society of America Bulletin, 103, 1324–1334.
Holland, T.J.B. and Powell R. (1998) An internally-consistent thermodynamic datasetfor phases of petrological interest. Journal of Metamorphic Geology, 16, 309–343.
Holm, D.K., Dahl, P.S., and Lux, D.R. (1997) 40Ar/39Ar evidence for Middle Prot-erozoic (1300–1500 Ma) slow cooling of the southern Black Hills, South Da-kota, midcontinent, North America: Implications for Early Proterozoic P-T evo-lution and posttectonic magmatism. Tectonics, 16, 609–622.
Icenhower, J. and London, D. (1995) An experimental study of element partitioningamong biotite, muscovite, and coexisting peraluminous silicic melt at 200 MPa(H2O). American Mineralogist, 80, 1229–1251.
———(1996) Experimental partitioning of Rb, Cs, Sr, and Ba between alkali feld-spar and peraluminous melt. American Mineralogist, 81, 719–734.
Johannes, W., Holtz, F., and Möller, P. (1995) REE distribution in some layeredmigmatites: constraints on their petrogenesis. Lithos, 35, 139–152.
Krogstad, E.J., and Walker, R.J. (1996) Evidence of heterogeneous crustal sources:the Harney Peak Granite, South Dakota, U.S.A. Transactions of the Royal So-ciety of Edinburgh: Earth Sciences, 87, 331–337.
Krogstad, E.J., and Walker, R.J., Nabelek, P.I., and Russ-Nabelek, C. (1993) Leadisotopic evidence for mixed sources of Proterozoic granites and pegmatites,Black Hills, South Dakota, USA. Geochimica et Cosmochica Acta, 57, 4667–4685.
Mahood, G. and Hildreth, W. (1983) Large partition coefficients for elements inhigh-silica rhyolites. Geochimica et Cosmochimica Acta, 47, 11–30.
Nabelek, P.I. (1997) Quartz-sillimanite leucosomes in high-grade schists, Black Hills,South Dakota: A perspective on the mobility of Al in high-grade metamorphicrocks. Geology, 25, 995–998.
Nabelek, P.I. and Bartlett, C.D. (1998) Petrologic and geochemical links betweenthe post-collisional Proterozoic Harney Peak leucogranite, South Dakota, USA,and its source rocks. Lithos, 45, 71–85.
Nabelek, P.I. and Glascock, M.D. (1995) REE-depleted leucogranites, Black Hills,South Dakota: a consequence of disequilibrium melting of monazite-bearingschists. Journal of Petrology, 36, 1055–1071.
Nabelek, P.I. and Ternes, K. (1997) Fluid inclusions in the Harney Peak Granite,Black Hills, South Dakota, USA: Implications for solubility and evolution ofmagmatic volatiles and crystallization of leucogranite magmas. Geochimica etCosmochimica Acta, 61, 1447–1465.
Nabelek, P.I., Russ-Nabelek, C., and Denison, J.R. (1992a) The generation and crys-tallization conditions of the Proterozoic Harney Peak leucogranite, Black Hills,South Dakota, USA: Petrologic and geochemical constraints. Contributions toMineralogy and Petrology, 110, 173–191.
Nabelek, P.I., Russ-Nabelek, C., and Haeussler, G.T. (1992b) Stable isotope evi-dence for the petrogenesis and fluid evolution in the Proterozoic Harney Peakleucogranite, Black Hills, South Dakota. Geochimica et Cosmochimica Acta,56, 403–417.
Nabelek, P.I., Sirbescu, M., and Liu, M. (1999) Petrogenesis and tectonic context ofthe Harney Peak Granite, Black Hills, South Dakota. Rocky Mountain Geol-ogy, in press.
Nash, W.P. and Crecraft, H.R. (1985) Partition coefficients for trace elements insilicic magmas. Geochimica et Cosmochimica Acta, 49, 2309–2322.

NABELEK: TRACE ELEMENT DISTRIBUTION IN MIGMATITES 1269
Patiño-Douce, A.E., and Harris, N. (1998) Experimental Constraints on HimalayanAnatexis. Journal of Petrology, 39, 689–710.
Power, G.M. (1993) Geochemical differences between the Cadomian granites ofMancellia and the St. Malo migmatites, Armorican Massif, France. Journal ofthe Geological Society, London, 150, 465–468.
Redden, J.A., Peterman, Z.E., Zartman, R.E., and DeWitt, E. (1990) U-Th-Pb zir-con and monazite ages and preliminary interpretation of the tectonic develop-ment of Precambrian rocks in the Black Hills. In J.F. Lewry and M.R. Stauffer,Eds., The Early Proterozoic Trans-Hudson Orogen, Geological Association ofCanada Special Paper, 37, 229–251.
Sawyer, E.W. (1987) The role of partial melting and fractional crystallization indetermining discordant migmatite leucosome compositions. Journal of Petrol-ogy, 28, 445–473.
———(1991) Disequilibrium melting and the rate of melt-residuum separation dur-ing migmatization of mafic rocks from the Grenville Front, Quebec. Journal ofPetrology, 32, 701–738.
Shearer, C.K., Papike, J.J., Redden, J.A., Simon, S., Walker, R.J., and Laul, J.C.(1987) Origin of pegmatitic granite segregations, Willow Creek, Black Hills,South Dakota. Canadian Mineralogist, 25, 159–171.
Watt, G.R., Burns, I.M., and Graham, G.A. (1996) Chemical characteristics ofmigmatites: accessory phase distribution and chemical evidence for fast meltsegregation rates. Contributions to Mineralogy and Petrology, 125, 100–111.
Watt, G.R. and Harley, S.L. (1993) Accessory phase controls on the geochemistryof crustal melts and restites produced during water-undersaturated partial melt-ing. Contributions to Mineralogy and Petrology, 11, 550–566.
MANUSCRIPT RECEIVED JUNE 22, 1998MANUSCRIPT ACCEPTED APRIL 30, 1999PAPER HANDLED BY GRAY E. BEBOUT
APPENDIX TABLE 1. Calculated modes in leucosomes and melano- somes
Sample Qtz Ab An Or Bt Sil Apleucosomes
115-1 0.29 0.14 0.00 0.48 0.03 0.05 0.01118-1 0.66 0.01 0.00 0.01 0.02 0.23 0.09121-1 0.66 0.01 0.00 0.00 0.04 0.28 0.01121-2 0.58 0.10 0.01 0.09 0.03 0.19 0.01124-1 0.52 0.19 0.01 0.06 0.07 0.15 0.00125-1A 0.34 0.26 0.02 0.28 0.03 0.06 0.01127-1 0.64 0.04 0.00 0.03 0.02 0.27 0.00129-1B 0.59 0.06 0.01 0.12 0.03 0.20 0.00131-1B 0.40 0.31 0.04 0.18 0.03 0.04 0.00132-1A 0.32 0.20 0.02 0.40 0.02 0.03 0.00133-1A 0.66 0.04 0.00 0.05 0.04 0.21 0.01118-2 0.67 0.00 0.00 0.00 0.04 0.28 0.01129-2 0.23 0.41 0.02 0.25 0.02 0.05 0.01133-2 0.52 0.09 0.00 0.18 0.04 0.16 0.01133-3 0.60 0.06 0.01 0.04 0.02 0.27 0.00
melanosomes115-1 0.38 0.01 0.00 0.06 0.36 0.19 0.00118-1 0.37 0.00 0.00 0.03 0.59 0.02 0.01121-1 0.57 0.00 0.00 0.03 0.31 0.08 0.00126-5 0.39 0.03 0.00 0.04 0.35 0.20 0.00127-1 0.18 0.00 0.00 0.04 0.79 0.00 0.00128-1 0.43 0.01 0.00 0.06 0.32 0.18 0.00129-1A 0.26 0.07 0.01 0.07 0.46 0.13 0.00131-1B 0.38 0.02 0.00 0.03 0.39 0.17 0.00132-1A 0.52 0.01 0.00 0.02 0.33 0.12 0.00
APPENDIX TABLE 2: Correlation coefficients of oxides and trace elements in schists
SiO2 TiO2 Al2O3 FeO MnO MgO CaO Na2O K2O P2O5 LOITiO2 –0.82Al2O3 –0.93 0.82FeO –0.87 0.63 0.68MnO –0.21 –0.03 –0.01 0.46MgO –0.90 0.71 0.72 0.91 0.32CaO 0.30 –0.28 –0.40 –0.37 0.13 –0.20Na2O 0.26 –0.13 –0.32 –0.37 –0.03 –0.23 0.82K2O –0.79 0.66 0.80 0.68 –0.06 0.67 –0.64 –0.69P2O5 0.16 –0.12 –0.09 –0.27 0.05 –0.25 0.14 –0.08 –0.06LOI –0.64 0.52 0.72 0.48 –0.17 0.47 –0.65 –0.61 0.79 0.02Rb –0.76 0.60 0.78 0.66 –0.09 0.64 –0.65 –0.70 0.97 –0.08 0.77Cs –0.13 –0.01 0.09 0.17 –0.12 0.11 –0.29 –0.34 0.37 –0.13 0.26Sr 0.16 –0.09 –0.30 –0.22 0.04 –0.05 0.88 0.80 –0.51 –0.03 –0.60Ba –0.63 0.53 0.58 0.67 0.12 0.58 –0.48 –0.50 0.67 –0.07 0.57Th 0.12 –0.23 0.01 –0.11 –0.16 –0.28 –0.33 –0.37 0.18 0.01 0.12U –0.15 0.29 0.20 0.10 –0.16 0.10 0.01 –0.09 0.12 –0.16 0.02Sc –0.91 0.88 0.85 0.77 0.13 0.85 –0.20 –0.13 0.65 –0.23 0.52Co –0.64 0.47 0.53 0.71 0.52 0.66 –0.28 –0.21 0.41 –0.12 0.28Cr –0.82 0.91 0.82 0.59 –0.02 0.72 –0.12 0.02 0.53 –0.21 0.45Pb –0.07 –0.06 –0.13 0.20 0.39 0.23 0.42 0.50 –0.34 –0.26 –0.28Zn –0.65 0.49 0.68 0.51 0.11 0.56 –0.23 –0.26 0.50 –0.12 0.54Ni –0.76 0.80 0.72 0.62 0.10 0.72 –0.29 –0.03 0.51 –0.21 0.46V –0.78 0.84 0.71 0.69 0.07 0.78 –0.25 –0.22 0.63 –0.28 0.44Nb –0.68 0.75 0.70 0.56 –0.16 0.58 –0.54 –0.48 0.80 –0.10 0.67Ta –0.50 0.55 0.56 0.37 –0.03 0.36 –0.42 –0.53 0.70 0.17 0.53Hf 0.80 –0.53 –0.66 –0.79 –0.34 –0.84 0.27 0.27 –0.63 0.29 –0.47Zr 0.75 –0.48 –0.64 –0.76 –0.36 –0.78 0.34 0.27 –0.61 0.27 –0.50Y –0.48 0.27 0.51 0.37 0.23 0.31 –0.10 –0.38 0.51 0.36 0.44Ga –0.92 0.80 0.96 0.75 0.02 0.78 –0.52 –0.46 0.88 –0.17 0.75La –0.31 0.19 0.48 0.22 –0.20 0.06 –0.54 –0.45 0.43 –0.07 0.47Ce –0.35 0.24 0.46 0.33 –0.08 0.15 –0.51 –0.42 0.41 –0.05 0.41Nd –0.13 0.13 0.33 –0.02 –0.25 –0.11 –0.34 –0.21 0.19 –0.12 0.34Sm –0.50 0.46 0.67 0.35 –0.15 0.23 –0.47 –0.42 0.52 0.06 0.57Eu –0.61 0.68 0.66 0.44 –0.12 0.47 –0.08 0.08 0.32 –0.15 0.33Tb –0.71 0.52 0.69 0.62 0.25 0.58 –0.22 –0.30 0.61 0.12 0.54Yb –0.53 0.40 0.50 0.50 0.33 0.44 –0.03 –0.19 0.34 0.28 0.24Lu –0.61 0.52 0.57 0.59 0.32 0.57 –0.07 –0.25 0.44 0.09 0.29