tracer study of c-certificate program graduatespdf.usaid.gov/pdf_docs/pa00kxt2.pdftracer study of...
TRANSCRIPT

i
Liberia Teacher Training Program
Tracer Study of C-Certificate Program Graduates
October 01– December 31 2011
(DRAFT)
Emmanuel Morris, Oscar N. Goyee, Rachel Hatch, Delwlebo Tuowal, & Mark
Ginsburg
LTTP Monitoring, Evaluation, and Research Team
February 25, 2014
This publication is produced for review by the United States Agency for International
Development. It was prepared by FHI 360.
This Report was made possible by the generous support of the American people through the
United States Agency for International Development (USAID). The contents are the responsibility of the
Liberia Teacher Training Program II and do not necessarily reflect the views of USAID or the United States
Government.

i
Table of Contents Table of Contents ..................................................................................................................................... i
Acronyms: .............................................................................................................................................. iii
Executive Summary ................................................................................................................................. 1
Background to the Study ........................................................................................................................ 3
Objectives of the Study ........................................................................................................................... 4
Methodology ........................................................................................................................................... 5
Findings ................................................................................................................................................... 6
C-Certificate Graduates NOT in the 2013 EMIS Database .................................................................. 6
Table 1: Percentage of C-Certificate Program Graduates NOT in 2013 EMIS Database ..................... 8
Chart 1: Percentage of Graduates of Various C-Certificate Programs NOT in the 2013 EMIS
Database ............................................................................................................................................. 9
Table 2: Number of Individuals with C-Certificates NOT in 2013 EMIS Database ............................ 10
Table 3: C-Certificates Graduates in and not in the database (LTTP-supported and Other
Programs) .......................................................................................................................................... 10
Employment of LTTP-Supported Pre-service C-Certificate Graduates ............................................. 10
Table 4: Employment Status of ALL Cohorts of LTTP-Supported Pre-service C-Certificate Program
Graduates .......................................................................................................................................... 11
Table 5: Employment Status of Cohort 1 of LTTP-Supported Pre-service C-Certificate Program
Graduates .......................................................................................................................................... 12
Table 6: Employment Status of Cohort 2 of LTTP-Supported Pre-service C-Certificate Program
Graduates .......................................................................................................................................... 13
Table 7: Employment Status of Cohort 3 of LTTP-Supported Pre-service C-Certificate Program
Graduates .......................................................................................................................................... 14
Table 8: Employment Status of Cohort 4 of LTTP-Supported Pre-service C-Certificate Program
Graduates .......................................................................................................................................... 14
Table 9: Employment Status of Cohort 5 of LTTP-Supported Pre-service C-Certificate Program
Graduates .......................................................................................................................................... 15
Employment of LTTP-Organized In-service C-Certificate Graduates ................................................ 15
Table 10: Employment Status of ALL Cohorts of LTTP-Organized In-service C-Certificate Program
Graduates .......................................................................................................................................... 16
Table 11: Employment Status of Cohort 1 of LTTP-Organized In-service C-Certificate Program
Graduates .......................................................................................................................................... 17
Table 12: Employment Status of Cohort 2 of LTTP-Organized In-service C-Certificate Program
Graduates .......................................................................................................................................... 18

Tracer Study of C-Certificate Program Graduates
ii
Table 13: Employment Status of Cohort 3 of LTTP-Organized In-service C-Certificate Program
Graduates .......................................................................................................................................... 19
Table 14: Employment Status of Cohort 4 of LTTP-Organized In-service C-Certificate Program
Graduates .......................................................................................................................................... 20
Table 15: Employment Status of Cohort 5 of LTTP-Organized In-service C-Certificate Program
Graduates .......................................................................................................................................... 21
Employment of CFL-Organized In-service C-Certificate Graduates .................................................. 21
Table 16: Employment Status of CFL-Organized C-Certificate Program Graduates ......................... 22
Employment of ECSEL-Organized In-service C-Certificate Graduates .............................................. 22
Table 17: Employment Status of ECSEL-Organized C-Certificate Program Graduates ..................... 23
Employment of NTAL-Organized In-service C-Certificate Graduates ............................................... 24
Table 18: Employment Status of NTAL-Organized C-Certificate Program Graduates ...................... 25
Employment of UNICEF-Organized In-service C-Certificate Graduates ............................................ 25
Table 19: Employment Status of UNICEF-Organized C-Certificate Program Graduates ................... 26
Conclusion ............................................................................................................................................ 26
References ............................................................................................................................................ 30

Tracer Study of C-Certificate Program Graduates
iii
Acronyms:
ALU Association of Liberian Universities CFL Christian Foundation for Liberia ECSEL European Commission Support for Education in Liberia EMIS Education Management Information System FHI Family Health International LTTP Liberia Teacher Training Program MER Monitoring, Evaluation, & Research MoE Ministry of Education NTAL National Teacher Association of Liberia UNICEF United Nations Children Fund USAID United States Agency for International Development

Tracer Study of C-Certificate Program Graduates
1
Executive Summary This report presents results from a study conducted by the LTTP Monitoring, Evaluation, and
Research team. The purpose of the study was to assess the extent to which graduates of
USAID/LTTP supported pre-service and in-service C-Certificate programs as well as other C-
Certificate programs are employed as teachers or administrators in government or non-
government primary or secondary schools. The study analyzed the Ministry of Education’s
2013 EMIS database, augmented by inserting information from lists of graduates from the
five cohorts of USAID/LTTP-supported pre-service program, the five cohorts of the
USAID/LTTP-organized in-service C-Certificate program as well as from in-service C-
Certificate programs organized by other organizations (Christian Foundation for Liberia
(CFL), European Commission Support for Education in Liberia (ECSEL), the National
Teachers Association of Liberia (NTAL), and UNICEF).
The study provides information on the percentages of male and female graduates who are in
various employment categories within the education sector. More specifically, the study
reports on the percentages of graduates who are employed as teachers and administrators
(principals, vice principals, and registrars) in government primary schools, those employed
in such positions in non-government primary school, those employed as teachers and
administrators in government secondary schools, and those employed in such positions in
non-government secondary schools.
The study also presents the percentages of graduates of the various C-Certificate programs
who were not found in the 2013 Education Management Information System (EMIS)
database. Indeed, of the 6,710 individuals who earned a C-Certificate from one of these
programs during the 2000 to 2013 period, 3,967 (58.7%) of them were not found in the 2013
EMIS database. Undoubtedly, because of the limitations of this study, some of these
graduates are in fact employed in the education sector. That is, some of the graduates may
be working in the 202 schools (i.e., 6.6%) whose principals participated in the EMIS trainings
but did not return the annual school census questionnaires. Furthermore, some of the
graduates may be working in the education sector but under a different name than they used
when participating in the C-Certificate program. However, it is very likely that many of the
3,967 graduates who were not found in the 2013 EMIS database either had never been
employed in the education sector (e.g., graduates of cohort 4 and 5 of the LTTP-supported
pre-service program) or left the profession after completing the C-Certificate program. This
likely constitutes a sizeable group of professionally “qualified” individuals who could be
employed or re-employed as teachers or administrators in government or non-government
primary or secondary schools.

Tracer Study of C-Certificate Program Graduates
2
Depending on the size of this group of professionally qualified individuals who are not
currently employed in the education sector, the Ministry of Education may be in a position
to increase the proportion of primary school teachers who have at least the minimum
qualification (i.e., a C-Certificate). Although a number of interventions have been made by
partners in helping to strengthen Liberia’s teaching force, the government must take
concrete action to hire and retain “qualified” teachers. However, this may require that the
Ministry establish special packages of financial incentives, organize better living conditions,
and/or improve working conditions to attract and retain “qualified” teachers in some
settings.
With respect to the employment categories of graduates who were found in the EMIS
database, there are some interesting differences across the C-Certificate programs
supported or organized by different partners. For the USAID/LTTP-supported pre-service
program and the USAID/LTTP-organized in-service program the vast majority of graduates
were found to be working in government primary schools, as teachers or administrators.
Relatively smaller percentages of these programs’ graduates were seen to be employed in
government secondary schools (as teachers or administrators), and very small percentages
of these programs’ graduates were working in non-government schools. In contrast, the
percentages of graduates of the other organizations’ C-Certificate programs were almost as
likely to be employed in primary schools as they were to be working in secondary schools.
Moreover, especially for the programs organized by European Commission Support for
Education in Liberia (ECSEL) and National Teachers Association of Liberia (NTAL), there
were noticeably higher percentages of graduates serving as teachers or administrators in
non-government primary and non-government secondary than was the case for
USAID/LTTP-supported or organized programs.
One issue that needs to be discussed relates to whether having educators with C-Certificates
working in government secondary schools is a positive or negative development. On one
hand, these are individuals who could instead be hired to increase the percentage of qualified
primary school teachers and administrators. On the other hand, while their credentials are
below that which government policy stipulates as the minimum qualification for secondary
school teachers (i.e., a B-Certificate for lower secondary and a university degree for upper
secondary), these individuals have credentials equal to or higher than many of their
secondary school colleagues. According to the Education Statistics (MoE 2013, National
Statistics Booklet), 27.2% of all government and non-government secondary school teachers
are “untrained,” that is, possessing less than a C-Certificate, and only 13.8% have a university
degree. Thus, there is a need to upgrade the qualifications of many secondary school
teachers, but having secondary school teachers and administrators who are graduates of the
C-Certificate programs may in the current situation contribute to improving the quality of
education at the lower and upper secondary levels.

Tracer Study of C-Certificate Program Graduates
3
Another issue which would benefit from policy dialogue concerns the number of graduates
of C-Certificate programs, particularly those organized by ECSEL and NTAL, who are
currently working as teachers or administrators in non-government primary or secondary
schools. On the one hand, one may view this as a leakage of qualified primary school teachers
from the government to the non-government subsector of education – representing a loss of
investment designed to improve the quality of education at the primary level. On the other
hand, given that the pupils attending non-government schools are for the most part Liberian
citizens, this could be seen as a valuable, if unintended, contribution to improving the
country’s education system. Moreover, since some children and youth likely move back and
forth between government and non-government schools, having teachers and
administrators with C-Certificate qualifications working in non-government school teachers
may in fact contribute to improving learning outcomes for at least some pupils in
government schools.
While discussions regarding the policy and practice implications of this study should be
undertaken, there is also a need for further research to clarify some of the issues. First, this
study should be replicated once the 2014 EMIS database is ready. Hopefully, the 2014 annual
school census will include an even higher percentage of government and non-government
schools than was the case in 2013. It may also be that, with on-going work on cleaning up the
employment and payroll records, there were be fewer C-Certificate program graduates
whose names do not match how their names are recorded in the annual school census and
EMIS database from 2013.
Second, a follow-up study should be conducted with a sample of those C-Certificate program graduates who were not found in the 2013 EMIS database (or who are not found in the 2014 EMIS database). This study should focus particularly on pre-service graduates who either never were employed in the education sector or in-service graduates who left the profession. Understanding better why they did not gain employment or why they discontinued their work as a teacher or administrator would certainly inform discussions leading to possible reforms in policies, procedures, or practices.
Background to the Study Over the last several years a significant amount of money and human resources have been invested by the Ministry of Education, Rural Teacher Training Institutes, USAID and other cooperating partners in preparing or upgrading primary school teachers so that they possess the minimum qualification (i.e., a C-Certificate) as stipulated in the 2011 Education Reform Act (Republic of Liberia, 2011) and the Liberia Education Regulations (Ministry of Education, 2011). There is evidence that the proportion of primary school teachers possessing a C-Certificate has increased since 2010, when the Education Sector Survey conducted by the Association of Liberian Universities (ALU, 2012) found that 40% of government primary schools had at least this level of qualifications. According to the 2013 annual school census

Tracer Study of C-Certificate Program Graduates
4
data presented in the Education Statistics publication, approximately 63% of teachers in government primary schools are “trained,” with this percentage varying across counties with a low of approximately 30% in Sinoe and a high of approximately 89% in the Monrovia Consolidated School System (MoE, 2013, p. 56). A telephone-implemented tracer study of 2011 pre-service program graduates was conducted last year (Tuowal, 2013). However, what is not known is the extent to which various cohorts of participants in USAID/LTTP-supported pre-service and in-service C-Certificate programs have been hired and have remained in teaching positions in government (or non-government) primary schools. Moreover, given that other organizations (Christian Foundation for Liberia, the European Commission Support for Education in Liberia, the National Teacher Association of Liberia, and UNICEF) have assisted in efforts to upgrade primary school teachers in Liberia, it is also important to know the employment status of the graduates of those in-service C-Certificate programs. Such information is critical to planning for future pre-service and in-service programs as well as for Ministry of Education discussions about recruitment, training, and deployment of primary school teachers. See also the report on the Study of Primary School Teacher Supply and Demand (Goyee et al, 2014).
Objectives of the Study The main purpose of this study is to assess the extent to which graduates of USAID/LTTP-supported and other C-Certificate programs are employed as teachers in government (or non-government) primary and secondary schools. More specifically, the study is designed to answer the following research questions:
1. For the five LTTP-supported pre-service C-Certificate program cohorts, what are percentages of male and female graduates who are:
a. Employed as teachers in government primary schools? b. Employed as teachers in non-government primary schools? c. Employed as teachers in government secondary schools? d. Employed as teachers in non-government secondary schools? e. Employed as administrators (registrar, vice principal, or principal) in
government primary schools? f. Employed as administrators (registrar, vice principal, or principal) in non-
government primary schools? g. Employed as administrators (registrar, vice principal, or principal) in
government secondary schools? h. Employed as administrators (registrar, vice principal, or principal) in non-
government secondary schools? i. Not employed by the MoE (at least not in schools included in the 2013 EMIS
dataset)? 2. For the five LTTP-organized in-service C-Certificate program cohorts as well as the
graduates of in-service C-Certificate programs organized by the Christian Foundation for Liberia (CFL), the European Commission Support for Education in Liberia (ECSEL), the National Teacher Association of Liberia (NTAL), and UNICEF, what are percentages of male and female graduates who are:

Tracer Study of C-Certificate Program Graduates
5
a. Employed as teachers in government primary schools? b. Employed as teachers in non-government primary schools? c. Employed as teachers in government secondary schools? d. Employed as teachers in non-government secondary schools? e. Employed as administrators (registrar, vice principal, or principal) in
government primary schools? f. Employed as administrators (registrar, vice principal, or principal) in non-
government primary schools? g. Employed as administrators (registrar, vice principal, or principal) in
government secondary schools? h. Employed as administrators (registrar, vice principal, or principal) in non-
government secondary schools? i. Not employed by the MoE (at least not in schools included in the 2013 EMIS
dataset)?
Methodology Because of the urgent need for this information and given the investment of the Ministry of Education and USAID, the study relies on data recently collected as part of the 2013 Annual School Census. The additional advantage of employing this approach is that it will be relatively easy to replicate the current study in the future using EMIS data collected in subsequent annual school censuses. The existing 2013 EMIS database was augmented by inserting information on which individuals previously participated in one of the cohorts of either the USAID/LTTP-supported pre-service or in-service C-Certificate programs or other in-service c-certificates program implemented by different organizations. The lists of graduates were obtained from LTTP files and from the records archived in the Ministry’s Bureau of Teacher Education regarding other in-service program graduates. In collaboration with the Ministry’s EMIS and Monitoring and Evaluation (M&E) divisions and LTTP’s EMIS staff, the LTTP Monitoring, Evaluation and Research Team analyzed the augmented EMIS database to answer the above-noted questions. The team calculated the percentages of (male and female) C-Certificate program graduates who were not found in the database as well as the percentages of (male and female) C-Certificate program graduates who had various categories of employment within the education sector. It is important to keep in mind two limitations of this study, even though the findings are robust enough to facilitate dialogue about current policies, procedures, and practices. First, according to the 2013 Education Statistics Bulletin (MoE, 2013, p. 142), principals from all but 202 (i.e. 6.6%) of the 3,051 schools who participated in the EMIS training returned questionnaires. While the missing data represent a limitation to this study, one should note that the database provides an almost complete portrait of the teaching force in Liberia. However, it is possible that some of the C-Certificate program graduates who were not found in the 2013 EMIS database are currently working in one of the schools not included in the annual school census. Second, it is also likely that some individual graduates were not found in the database because their names in the database were different than their names on the graduate lists. For example, if a female got married after graduating, she may be using a

Tracer Study of C-Certificate Program Graduates
6
different name. There are also other reasons that teachers may use different names in different contexts. In addition to developing this written report, the LTTP Monitoring, Evaluation, and Research Team plans to present the findings to various stakeholders of the education sector (e.g., key personnel within the central Ministry of Education’s Departments of Planning and Instruction, county education offices, district education offices, and rural teacher training institutes as well as USAID and other cooperating partners). By promoting dialogue about the findings, the team hopes to encourage consideration of possible changes in policies, procedures, and practices that may enhance the quality of primary education in Liberia.
Findings In this section we present the results of analyses of the data designed to answer the research
questions. First, we present information on the percentage of graduates from the various C-
Certificate programs that were not found in the 2013 EMIS database and thus may not have
been employed in the education sector at that point in time. Then we discuss the categories
of employment of graduates of each of the C-Certificate programs whose employment
categories were identified in the EMIS’s 2013 database.
C-Certificate Graduates NOT in the 2013 EMIS Database Table 1 and Chart 1 show the percentage of graduates of the various C-Certificate programs
whose names we were not able to match with names in the 2013 EMIS database. As
mentioned above, it is likely that some of these graduates are in fact employed in government
or non-government schools, but not included in the EMIS database. This may be because
their schools were not included in the 2013 Annual School Census, since the questionnaires
were not received from 202 (6.6%) of the schools (MoE, 2013, p. 139).1 It is also possible
that some graduates’ names were not found in the EMIS database because their names had
changed (e.g. because of marriage) or because they used different names for different
purposes.
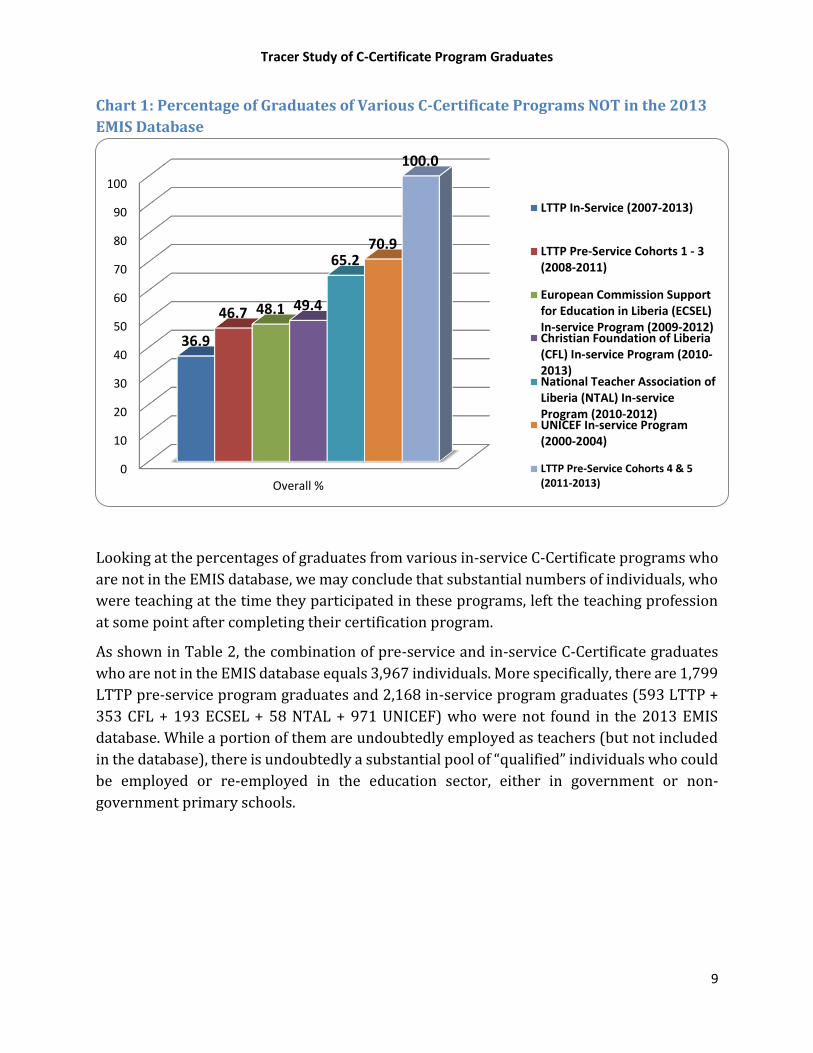
As can be observed in Table 1, 70.4% of all USAID/LTTP-supported pre-service program
graduates, 36.9% of the all LTTP-organized in-service program graduates, 49.4% of CFL-
organized in-service graduates, 48.1% of ECSEL-organized in-service program graduates,
65.2% of NTAL-organized in-service programs graduates, and 70.9% of UNICEF-organized
in-service graduates are not found in the 2013 EMIS database.2
1 According to the Education Statistics Bulletin (MoE, 2013, p. 139), three counties had more than 10% of their schools not reporting: Grand Bassa (10.4%), Montserrado (14.9%), and Sinoe (20.3%). 2 Note that the percentages for male and female graduates are similar for most program groups, the percentages of graduates not in the EMIS database are somewhat higher for males for both cohort 1 of the

Tracer Study of C-Certificate Program Graduates
7
The high percentage of USAID/LTTP-supported pre-service program overall results from the
fact that all (i.e., 100%) of the cohort 4 and cohort 5 graduates were not in the 2013
database.3 For this reason, Chart 1 presents separately the percentage for graduates of
cohorts 1-3 (46.7%) and the percentage of cohorts 4-5 (100%) of the USAID/LTTP-
supported pre-service programs. That the percentages of the other USAID/LTTP-supported
pre-service cohorts that are not in the 2013 database are relatively high (i.e., 40.9% for
cohort 1, 41.7% for cohort 2, and 56.5% for cohort 3), however, indicates that there likely
are substantial numbers of USAID/LTTP-supported pre-service C-Certificate graduates who
either never gained employment or who left the teaching profession after completing their
certification program.
The relatively large percentage of UNICEF-organized in-service program graduates who are
not in the EMIS database is at least in part a consequence of these programs having operated
almost a decade or more ago (i.e., 2000-2004). Thus, many of the graduates of this program
may have moved on from teaching posts they obtained during or immediately after the
Second Liberia Civil War (1999-2003).
LTTP-supported pre-service program and the NTAL-organized in-service program and somewhat higher for females for the CFL-organized in-service program. 3 Note that cohort 5 had not completed the program when the 2013 annual school census was conducted, and thus would not be expected to be included in the EMIS database. It also seems that none of the cohort 4 graduates had yet been employed as teachers, almost one year after they completed their program.

Tracer Study of C-Certificate Program Graduates
8
Table 1: Percentage of C-Certificate Program Graduates NOT in 2013 EMIS Database
C-Certificate Program (years implemented) % Female % Male % Total
All LTTP Pre-service Program Cohorts (2008-2013) 76.9 69.4 70.4
LTTP Pre-service Cohort 1 (2008-2009) 34.4 41.4 40.9
LTTP Pre-service Cohort 2 (2009-2010) 42.6 41.6 41.7
LTTP Pre-service Cohort 3 (2010-2011) 58.3 56.2 56.5
LTTP Pre-service Cohort 4 (2011-2012) 100 100 100
LTTP Pre-service Cohort 5 (2012-2013) 100 100 100
All LTTP In-service Program Cohorts (2007-2013) 34.3 37.4 36.9
LTTP In-service Cohort 1 (2007-2008) 29.5 45.1 42.5
LTTP In-service Cohort 2 (2008-2009) 37.1 36.6 36.6
LTTP In-service Cohort 3 (2009-2010) 29.3 38.0 36.8
LTTP In-service Cohort 4 (2010-2011) 39.3 44.2 43.1
LTTP In-service Cohort 5 (2012-2013) 34.7 29.6 30.4
Christian Foundation of Liberia (CFL) In-service Program (2010-2013)
62.2 44.9 49.4
European Commission Support for Education in Liberia (ECSEL) In-service Program (2009-2012)
56.3 47.4 48.1
National Teacher Association of Liberia (NTAL) In-service Program (2010-2012)
56.0 68.8 65.2
UNICEF In-service Program (2000-2004) 64.8 72.3 70.9
Tracer Study of C-Certificate Program Graduates
9
Chart 1: Percentage of Graduates of Various C-Certificate Programs NOT in the 2013
EMIS Database
Looking at the percentages of graduates from various in-service C-Certificate programs who
are not in the EMIS database, we may conclude that substantial numbers of individuals, who
were teaching at the time they participated in these programs, left the teaching profession
at some point after completing their certification program.
As shown in Table 2, the combination of pre-service and in-service C-Certificate graduates
who are not in the EMIS database equals 3,967 individuals. More specifically, there are 1,799
LTTP pre-service program graduates and 2,168 in-service program graduates (593 LTTP +
353 CFL + 193 ECSEL + 58 NTAL + 971 UNICEF) who were not found in the 2013 EMIS
database. While a portion of them are undoubtedly employed as teachers (but not included
in the database), there is undoubtedly a substantial pool of “qualified” individuals who could
be employed or re-employed in the education sector, either in government or non-
government primary schools.
0
10
20
30
40
50
60
70
80
90
100
Overall %
36.9
46.7 48.1 49.4
65.270.9
100.0
LTTP In-Service (2007-2013)
LTTP Pre-Service Cohorts 1 - 3(2008-2011)
European Commission Supportfor Education in Liberia (ECSEL)In-service Program (2009-2012)Christian Foundation of Liberia(CFL) In-service Program (2010-2013)National Teacher Association ofLiberia (NTAL) In-serviceProgram (2010-2012)UNICEF In-service Program(2000-2004)
LTTP Pre-Service Cohorts 4 & 5(2011-2013)

Tracer Study of C-Certificate Program Graduates
10
Table 2: Number of Individuals with C-Certificates NOT in 2013 EMIS Database
Program Females Males Both Genders
LTTP Pre-service 270 1529 1,799
LTTP In-service 85 508 593
CFL In-service 115 238 353
ECSEL In-service 18 175 193
NTAL In-service 14 44 58
UNICEF In-service 173 798 971
TOTAL 675 3292 3967
This conclusion is reinforced by the findings presented in Table 3. According to this table,
58.7% of all C-Certificate program graduates were not found in the EMIS 2013 database.
Thus, unless these graduates were employed in one of the schools (202) not covered during
the 2013 annual school census or they used a different name than was included on the list of
graduates, either they were never employed in the education sector or they left the sector
for some reasons before the 2013 EMIS data were collected. Thus, the additional analyses
presented below focus mainly on the 41.3% of the graduates who were found in the
database, enabling us to identify the categories of their employment in the education sector
(as teachers or administrators in government or non-government schools).
Table 3: C-Certificates Graduates in and not in the database (LTTP-supported and
Other Programs)
Teachers Category %Females %Males %Both Genders
Teachers in the EMIS’ database
40.7% 41.4% 41.3%
Teachers Not in the EMIS’ database
59.3% 58.6% 58.7
Total Percentage Total Teachers
100% 1134
100% 5576
100% 6710
Employment of LTTP-Supported Pre-service C-Certificate Graduates Looking at Table 4, which presents data on graduates of all cohorts of the USAID/LTTP-
supported pre-service C-Certificate program, we note that the vast majority of those in the
Education Management Information System (EMIS) database are working in government
primary schools. That is, one sixth (17.5%) are government primary school teachers and
approximately one-twelfth (8.1%) are government primary school administrators
(principals, vice principals, or registrars). While the percentages of females and males who
are government primary school teachers are almost equal, males are somewhat more likely
to be government primary administrators than females (8.9% versus 2.8%). The
percentages of USAID/LTTP-supported pre-service program graduates who are working in

Tracer Study of C-Certificate Program Graduates
11
government secondary schools and in non-government primary or secondary schools are
quite small (2.3% or less).
Table 4: Employment Status of ALL Cohorts of LTTP-Supported Pre-service C-
Certificate Program Graduates Category of Employment % Female % Male % Total
Government Primary School Teacher 17.1 17.6 17.5
Government Primary School Administrator 2.8 8.9 8.1
Government Secondary School Teacher 0.6 2.3 2.1
Government Secondary School Administrator 0 0.1 0.1
Non-government Primary School Teacher 0.3 0.8 0.7
Non-government Primary School Administrator 0.6 0.3 0.3
Non-government Secondary School Teacher 1.1 0.5 0.6
Non-government Secondary School Administrator 0.6 0.2 0.2
NOT Included in 2013 EMIS Database 76.9 69.4 70.4
Graduates (Total %)
TOTAL Number of Graduates
100%
351
100%
2203
100%
2554
We now turn to an examination of the employment categories of each of the five cohorts of
USAID/LTTP-supported pre-service C-Certificate programs. This is important because, as
noted above, none of the graduates of cohort 4 or cohort 5 were included in the 2013 EMIS
database. Thus, there is a need to examine separately the employment status of graduates of
cohorts 1-3.
As shown in Table 5, cohort 1 graduates are mainly employed in government primary
schools. We observe that just under one third (30.5%) are government primary school
teachers and slightly less than one quarter (23.3%) are government primary school
administrators. Note that male cohort 1 graduates are almost equally likely to be teachers as
they are administrators (29.4% versus 24.2%), but female cohort 1 graduates are much
more likely to be working as teachers than as administrators (43.8% versus 12.5%).
Furthermore, as we noted for all cohorts (see Table 4), only relatively small percentages of
cohort 1 pre-service graduates have taken employment in government secondary schools or
non-government primary or secondary schools, either as teachers or administrators.

Tracer Study of C-Certificate Program Graduates
12
Table 5: Employment Status of Cohort 1 of LTTP-Supported Pre-service C-
Certificate Program Graduates Category of Employment % Female % Male % Total
Government Primary School Teacher 43.8 29.4 30.5
Government Primary School Administrator 12.5 24.2 23.3
Government Secondary School Teacher 0 0.2 0.2
Government Secondary School Administrator 0 0.2 0.2
Non-government Primary School Teacher 3.1 1.5 1.6
Non-government Primary School Administrator 3.1 0.7 0.9
Non-government Secondary School Teacher 3.1 1.5 1.6
Non-government Secondary School Administrator 0 0.7 0.7
NOT Included in 2013 EMIS Database 34.4 41.4 40.9
Graduates (Total %)
TOTAL Number of Graduates
100%
32
100%
401
100%
433
As shown in Table 6, cohort 2 graduates of USAID/LTTP-supported pre-service program are
mainly employed in government primary schools. We observe that just under one third
(32.9%) are government primary school teachers and slightly less than one quarter (21.2%)
are government primary school administrators. Note that male cohort 2 graduates are
somewhat more likely to be teachers than administrators (32.2% versus 22.8%), while
female cohort 2 graduates are much more likely to be working as teachers than as
administrators (37.7% versus 9.8%).
Additionally, as we noted for all cohorts (see Table 4), only relatively small percentages of
cohort 2 pre-service graduates have taken employment in government secondary schools or
non-government primary or secondary schools, either as teachers or administrators.

Tracer Study of C-Certificate Program Graduates
13
Table 6: Employment Status of Cohort 2 of LTTP-Supported Pre-service C-
Certificate Program Graduates Category of Employment % Female % Male % Total
Government Primary School Teacher 37.7 32.2 32.9
Government Primary School Administrator 9.8 22.8 21.2
Government Secondary School Teacher 0 0.5 0.4
Government Secondary School Administrator 0 0.2 0.2
Non-government Primary School Teacher 0 0.9 0.8
Non-government Primary School Administrator 1.6 0.7 0.8
Non-government Secondary School Teacher 4.9 0.9 1.4
Non-government Secondary School Administrator 3.3 0.2 0.6
NOT Included in 2013 EMIS Database 42.6 41.6 41.7
Graduates (Total %)
TOTAL Number of Graduates
100%
61
100%
435
100%
496
Looking now at Table 7, one sees that the cohort 3 graduates of USAID/LTTP-supported pre-
service program are mainly employed in government primary school teachers (31.3%),
though 10.3% are working as teachers in government secondary schools. Note that female
cohort 3 graduates are somewhat more likely than their male colleagues to be primary
school teachers (38.3% versus 30.4%) and somewhat less likely than their male colleagues
to be secondary school teachers (3.3% versus 11.3%). It is also noteworthy that none of the
cohort 3 graduates are employed as school administrators, either in primary or secondary
schools operated by the government or non-governmental organizations. Perhaps they have
not been employed in the education sector long enough to apply and be considered for
administrative posts.
Additionally, as we discussed for all cohorts (see Table 4), only relatively small percentages
of cohort 3 pre-service graduates (and only males) have taken employment in non-
government primary or secondary schools, and in the few cases these graduates are males
working as teachers.

Tracer Study of C-Certificate Program Graduates
14
Table 7: Employment Status of Cohort 3 of LTTP-Supported Pre-service C-
Certificate Program Graduates Category of Employment % Female % Male % Total
Government Primary School Teacher 38.3 30.4 31.3
Government Primary School Administrator 0.0 0.0 0.0
Government Secondary School Teacher 3.3 11.3 10.3
Government Secondary School Administrator 0.0 0.0 0.0
Non-government Primary School Teacher 0.0 1.9 1.6
Non-government Primary School Administrator 0.0 0.0 0.0
Non-government Secondary School Teacher 0.0 0.2 0.2
Non-government Secondary School Administrator 0.0 0.0 0.0
NOT Included in 2013 EMIS Database 58.3 56.2 56.5
Graduates (Total %)
TOTAL Number of Graduates
100%
60
100%
485
100%
485
Tables 8 and 9, respectively, present the findings for cohorts 4 and 5 of the USAID/LTTP-
supported pre-service C-Certificate program. Given that none of the graduates from these
two cohorts are in the 2013 EMIS database (i.e.100% were not found in the EMIS
database), there is not much more that can be said of their employment.
Table 8: Employment Status of Cohort 4 of LTTP-Supported Pre-service C-
Certificate Program Graduates
Category of Employment % Female % Male % Total
Government Primary School Teacher 0 0 0
Government Primary School Administrator 0 0 0
Government Secondary School Teacher 0 0 0
Government Secondary School Administrator 0 0 0
Non-government Primary School Teacher 0 0 0
Non-government Primary School Administrator 0 0 0
Non-government Secondary School Teacher 0 0 0
Non-government Secondary School Administrator 0 0 0
NOT Included in 2013 EMIS Database 100% 100% 100%
Graduates (Total %)
TOTAL Number of Graduates
100%
75
100%
428
100%
503

Tracer Study of C-Certificate Program Graduates
15
Table 9: Employment Status of Cohort 5 of LTTP-Supported Pre-service C-
Certificate Program Graduates Category of Employment % Female % Male % Total
Government Primary School Teacher 0 0 0
Government Primary School Administrator 0 0 0
Government Secondary School Teacher 0 0 0
Government Secondary School Administrator 0 0 0
Non-government Primary School Teacher 0 0 0
Non-government Primary School Administrator 0 0 0
Non-government Secondary School Teacher 0 0 0
Non-government Secondary School Administrator 0 0 0
NOT Included in 2013 EMIS Database 100% 100% 100%
Graduates (Total %)
TOTAL Number of Graduates
100%
123
100%
514
100%
637
Employment of LTTP-Organized In-service C-Certificate Graduates Looking now at Table 10, which presents data on graduates of all cohorts of the
USAID/LTTP-organized in-service C-Certificate program, we note that the vast majority of
those in the EMIS database are working in government schools. However, unlike what we
discussed above for the pre-service program graduates, while more graduates are working
in primary schools, we also observe a sizeable proportion working in secondary schools.
Specifically, more than one fourth (28.4%) of USAID/LTTP-organized in-service program
graduates are employed as government primary school teachers and approximately one
seventh (14.1%) are working as government primary school administrators (principals, vice
principals, or registrars). With respect to gender differences, we note that female graduates
are much more likely to be teachers than administrators (40.7% versus 8.1%), though male
graduates are only somewhat more likely to be teachers than administrators (26.2% versus
15.2%).
Additionally, among the graduates of all cohorts of the USAID/LTTP-organized in-service
program, 11.3% are teachers and 6.1% are administrators in government secondary schools.
Moreover, there are only small differences between male and female graduates in these
categories of employment.
It is also worth noting that only a small percentage of USAID/LTTP-organized in-service
program graduates are working in non-governmental schools, either as teachers or
administrators at the primary or secondary level. Thus, it does not appear that many

Tracer Study of C-Certificate Program Graduates
16
graduates of this program have used their credentials to obtain employment in non-
government schools.
Table 10: Employment Status of ALL Cohorts of LTTP-Organized In-service C-
Certificate Program Graduates Category of Employment % Female % Male % Total
Government Primary School Teacher 40.7 26.2 28.4
Government Primary School Administrator 8.1 15.2 14.1
Government Secondary School Teacher 10.1 11.6 11.3
Government Secondary School Administrator 4.8 6.3 6.1
Non-government Primary School Teacher 1.2 2.2 2.1
Non-government Primary School Administrator 0 0.5 0.4
Non-government Secondary School Teacher 0.8 0.6 0.6
Non-government Secondary School Administrator 0 0.1 0.1
NOT Included in 2013 EMIS Database 34.3 37.4 36.9
Graduates (Total %)
TOTAL Number of Graduates
100%
248
100%
1359
100%
1607
We now examine the categories of employment of the various cohorts of the LTTP-organized
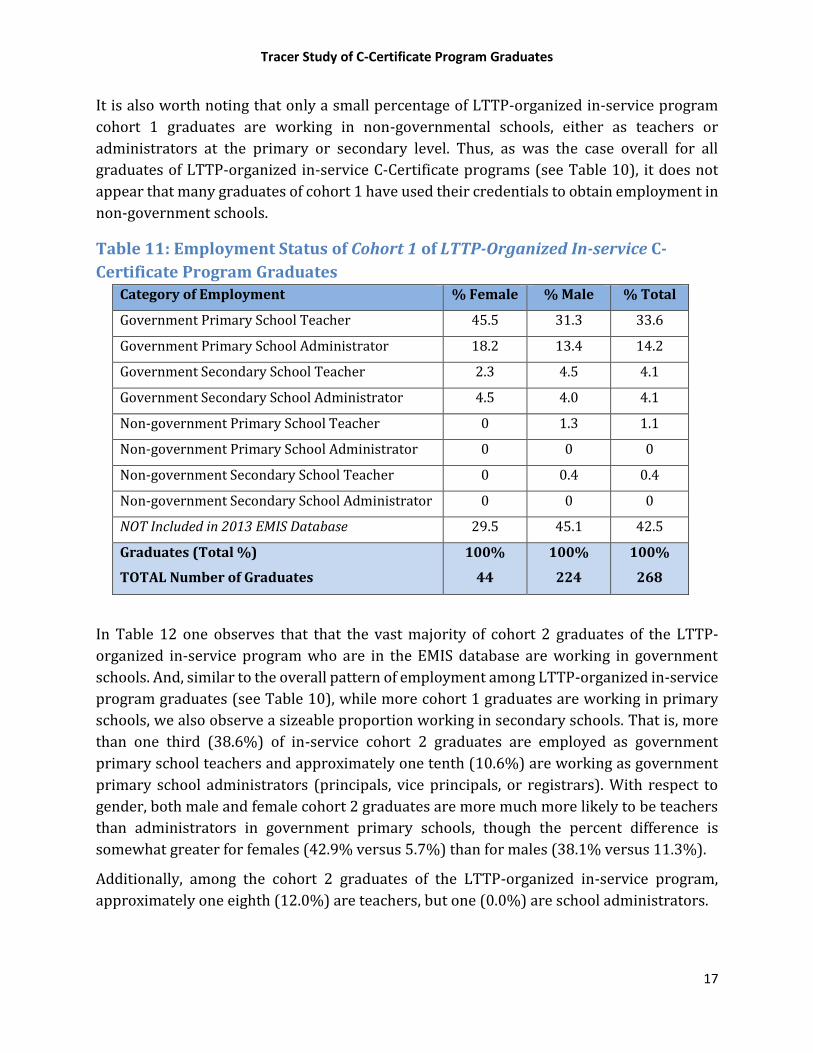
in-service program. Table 11 presents the findings for the analysis of cohort 1. In Table 11
one observes that that the vast majority of those in the EMIS database are working in
government schools. And, similar to the overall pattern of employment among LTTP-
organized in-service program graduates (see Table 10), while more cohort 1 graduates are
working in primary schools, we also observe a sizeable proportion working in secondary
schools. More specifically, about one third (33.6%) of in-service cohort 1 graduates are
employed as government primary school teachers and approximately one seventh (14.2%)
are working as government primary school administrators (principals, vice principals, or
registrars). With respect to gender, both male and female cohort 1 graduates are more much
more likely to be teachers than administrators in government primary schools, though the
percent difference is somewhat greater for females (45.5% versus 18.2%) than for males
(31.3% versus 13.4%).
Furthermore, among the cohort 1 graduates of the LTTP-organized in-service program, 4.1%
are teachers and 4.1% are administrators in government secondary schools. And there are
only small differences between male and female cohort 1 graduates in these categories of
employment.
Tracer Study of C-Certificate Program Graduates
17
It is also worth noting that only a small percentage of LTTP-organized in-service program
cohort 1 graduates are working in non-governmental schools, either as teachers or
administrators at the primary or secondary level. Thus, as was the case overall for all
graduates of LTTP-organized in-service C-Certificate programs (see Table 10), it does not
appear that many graduates of cohort 1 have used their credentials to obtain employment in
non-government schools.
Table 11: Employment Status of Cohort 1 of LTTP-Organized In-service C-
Certificate Program Graduates
Category of Employment % Female % Male % Total
Government Primary School Teacher 45.5 31.3 33.6
Government Primary School Administrator 18.2 13.4 14.2
Government Secondary School Teacher 2.3 4.5 4.1
Government Secondary School Administrator 4.5 4.0 4.1
Non-government Primary School Teacher 0 1.3 1.1
Non-government Primary School Administrator 0 0 0
Non-government Secondary School Teacher 0 0.4 0.4
Non-government Secondary School Administrator 0 0 0
NOT Included in 2013 EMIS Database 29.5 45.1 42.5
Graduates (Total %)
TOTAL Number of Graduates
100%
44
100%
224
100%
268
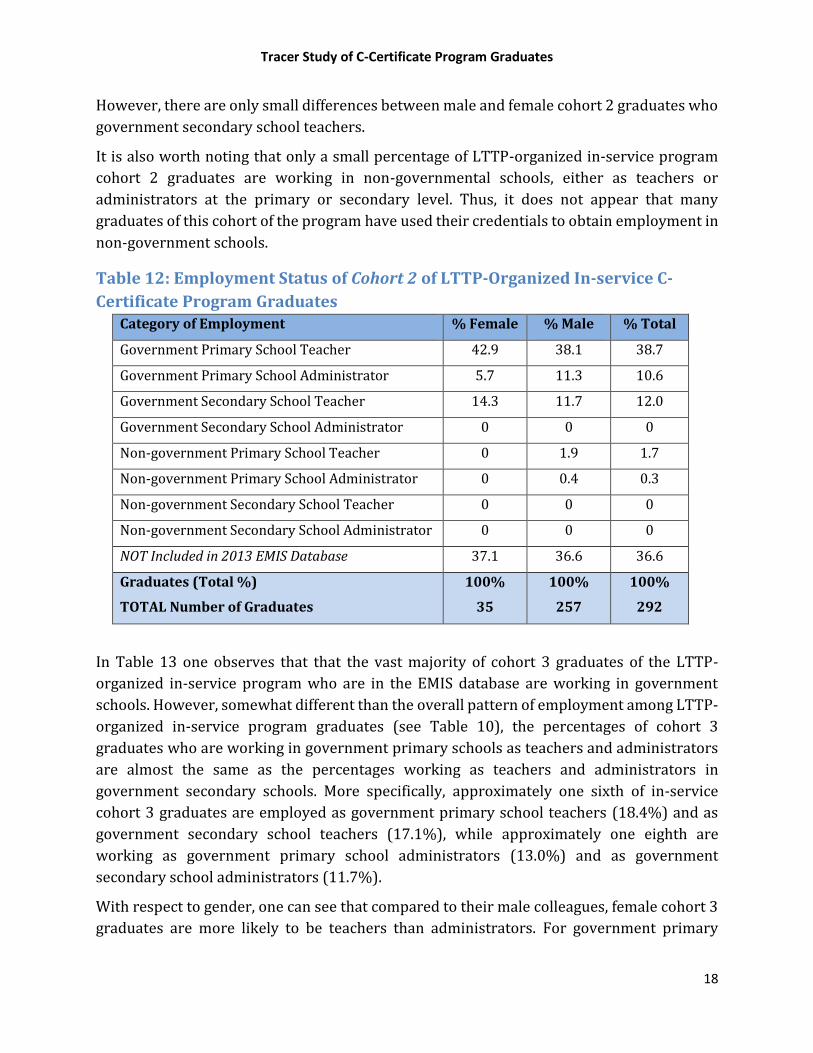
In Table 12 one observes that that the vast majority of cohort 2 graduates of the LTTP-
organized in-service program who are in the EMIS database are working in government
schools. And, similar to the overall pattern of employment among LTTP-organized in-service
program graduates (see Table 10), while more cohort 1 graduates are working in primary
schools, we also observe a sizeable proportion working in secondary schools. That is, more
than one third (38.6%) of in-service cohort 2 graduates are employed as government
primary school teachers and approximately one tenth (10.6%) are working as government
primary school administrators (principals, vice principals, or registrars). With respect to
gender, both male and female cohort 2 graduates are more much more likely to be teachers
than administrators in government primary schools, though the percent difference is
somewhat greater for females (42.9% versus 5.7%) than for males (38.1% versus 11.3%).
Additionally, among the cohort 2 graduates of the LTTP-organized in-service program,
approximately one eighth (12.0%) are teachers, but one (0.0%) are school administrators.
Tracer Study of C-Certificate Program Graduates
18
However, there are only small differences between male and female cohort 2 graduates who
government secondary school teachers.
It is also worth noting that only a small percentage of LTTP-organized in-service program
cohort 2 graduates are working in non-governmental schools, either as teachers or
administrators at the primary or secondary level. Thus, it does not appear that many
graduates of this cohort of the program have used their credentials to obtain employment in
non-government schools.
Table 12: Employment Status of Cohort 2 of LTTP-Organized In-service C-
Certificate Program Graduates Category of Employment % Female % Male % Total
Government Primary School Teacher 42.9 38.1 38.7
Government Primary School Administrator 5.7 11.3 10.6
Government Secondary School Teacher 14.3 11.7 12.0
Government Secondary School Administrator 0 0 0
Non-government Primary School Teacher 0 1.9 1.7
Non-government Primary School Administrator 0 0.4 0.3
Non-government Secondary School Teacher 0 0 0
Non-government Secondary School Administrator 0 0 0
NOT Included in 2013 EMIS Database 37.1 36.6 36.6
Graduates (Total %)
TOTAL Number of Graduates
100%
35
100%
257
100%
292
In Table 13 one observes that that the vast majority of cohort 3 graduates of the LTTP-
organized in-service program who are in the EMIS database are working in government
schools. However, somewhat different than the overall pattern of employment among LTTP-
organized in-service program graduates (see Table 10), the percentages of cohort 3
graduates who are working in government primary schools as teachers and administrators
are almost the same as the percentages working as teachers and administrators in
government secondary schools. More specifically, approximately one sixth of in-service
cohort 3 graduates are employed as government primary school teachers (18.4%) and as
government secondary school teachers (17.1%), while approximately one eighth are
working as government primary school administrators (13.0%) and as government
secondary school administrators (11.7%).
With respect to gender, one can see that compared to their male colleagues, female cohort 3
graduates are more likely to be teachers than administrators. For government primary

Tracer Study of C-Certificate Program Graduates
19
schools the teacher-to-administrator ratio is 24.4%/4.9% for females, while for males it is
17.5%/14.2%. For government secondary schools the teacher-to-administrator ratio is
24.4%/12.2% for females, while for males it is 16.1%/11.7%.
Again, it is worthwhile to state that only a small percentage of LTTP-organized in-service
program cohort 3 graduates are working in non-governmental schools, either as teachers or
administrators at the primary or secondary level. Thus, it does not appear that many
graduates of this cohort have used their credentials to obtain employment in non-
government schools.
Table 13: Employment Status of Cohort 3 of LTTP-Organized In-service C-
Certificate Program Graduates Category of Employment % Female % Male % Total
Government Primary School Teacher 24.4 17.5 18.4
Government Primary School Administrator 4.9 14.2 13.0
Government Secondary School Teacher 24.4 16.1 17.1
Government Secondary School Administrator 12.2 11.7 11.7
Non-government Primary School Teacher 2.4 1.5 1.6
Non-government Primary School Administrator 0 0.4 0.3
Non-government Secondary School Teacher 2.4 0.7 1.0
Non-government Secondary School Administrator 0 0 0
NOT Included in 2013 EMIS Database 29.3 38.0 36.8
Graduates (Total %)
TOTAL Number of Graduates
100%
41
100%
274
100%
315
Table 14 indicates that that the vast majority of cohort 4 graduates of the LTTP-organized
in-service program who are in the EMIS database are working in government schools.
Somewhat different than the overall pattern of employment among LTTP-organized in-
service program graduates (see Table 10), however, almost all of these graduates are
working in primary schools. More specifically, about one third (32.8%) of in-service cohort
2 graduates are employed as government primary school teachers and approximately one
sixth (16.4%) are working as government primary school administrators (principals, vice
principals, or registrars). With respect to gender, female cohort 4 graduates are much more
likely to be teachers than administrators in government primary schools (48.2% versus
8.9%, while male cohort 4 graduates are only somewhat more likely to be working as
teachers than as administrators (28.6% versus 18.4%).

Tracer Study of C-Certificate Program Graduates
20
Note that a somewhat higher percentage of LTTP-organized in-service program cohort 4
graduates are working in non-government schools than we have observed for other cohorts.
As shown in Table 14, 4.2% of cohort 4 graduates are employed as non-government primary
school teachers, with the percentage being greater for males (4.9%) than for females (1.4%).
Table 14: Employment Status of Cohort 4 of LTTP-Organized In-service C-
Certificate Program Graduates Category of Employment % Female % Male % Total
Government Primary School Teacher 48.2 28.6 32.8
Government Primary School Administrator 8.9 18.4 16.4
Government Secondary School Teacher 0 1.5 1.1
Government Secondary School Administrator 0 0 0
Non-government Primary School Teacher 1.8 4.9 4.2
Non-government Primary School Administrator 0 1.5 1.1
Non-government Secondary School Teacher 1.8 1.0 1.1
Non-government Secondary School Administrator 0 0 0
NOT Included in 2013 EMIS Database 39.3 44.2 43.1
Graduates (Total %)
TOTAL Number of Graduates
100%
56
100%
206
100%
262
In Table 15 one sees that that the vast majority of cohort 5 graduates of the LTTP-organized
in-service program who are in the EMIS database are working in government schools.
However somewhat different than the overall pattern of employment among LTTP-
organized in-service program graduates (see Table 10), the percentages of cohort 5
graduates who are working in government primary schools as teachers and administrators
are almost the same as the percentages working as teachers and administrators in
government secondary schools. More specifically, approximately one fifth of in-service
cohort 5 graduates are employed as government primary school teachers (23.4%) and as
government secondary school teachers (16.8%), while somewhat more than one tenth are
working as government primary school administrators (15.5%) and as government
secondary school administrators (10.6%).
With respect to gender, one notes that compared to their male colleagues, female cohort 5
graduates are much more likely to be teachers than administrators in primary schools. For
government primary schools the teacher-to-administrator ratio is 40.3%/4.2% for females,
while for males it is 20.4%/14.2%. For government secondary schools the teacher-to-
administrator ratios are fairly similar for females (12.5%/6.9%) and for males
17.6%/11.3%).

Tracer Study of C-Certificate Program Graduates
21
Again, it is worth mentioning that only a small percentage of LTTP-organized in-service
program cohort 5 graduates are working in non-governmental schools, either as teachers or
administrators at the primary or secondary level. Thus, it does not appear that many
graduates of this cohort have used their credentials to obtain employment in non-
government schools.
Table 15: Employment Status of Cohort 5 of LTTP-Organized In-service C-
Certificate Program Graduates Category of Employment % Female % Male % Total
Government Primary School Teacher 40.3 20.4 23.4
Government Primary School Administrator 4.2 17.6 15.5
Government Secondary School Teacher 12.5 17.6 16.8
Government Secondary School Administrator 6.9 11.3 10.6
Non-government Primary School Teacher 1.4 2.0 1.9
Non-government Primary School Administrator 0 0.5 0.4
Non-government Secondary School Teacher 0 0.8 0.6
Non-government Secondary School Administrator 0 0.3 0.2
NOT Included in 2013 EMIS Database 34.7 29.6 30.4
Graduates (Total %)
TOTAL Number of Graduates
100%
72
100%
398
100%
470
Employment of CFL-Organized In-service C-Certificate Graduates We move now to examining the employment categories for in-service C-Certificate programs
organized by groups other than the USAID-funded Liberia Teacher Training Program (LTTP).
To begin this discussion, Table 16 presents findings on graduates of the in-service program
organized by the Christian Foundation for Liberia (CFL). We observe that the majority of the
graduates of the CFL-organized in-service program who are in the EMIS database are
working in government schools. However somewhat different than the overall pattern of
employment among LTTP-organized in-service program graduates (see Table 10), the
percentages of CFL-organized program graduates who are working in government primary
schools as teachers and administrators are almost the same as the percentages working in
government secondary schools as teachers and administrators. More specifically, just over
one tenth of CFL-organized program graduates are employed as government primary school
teachers (14.0%) and as government secondary school teachers (10.1%), while
approximately one tenth are working as government primary school administrators (11.6%)
and as government secondary school administrators (6.7%).

Tracer Study of C-Certificate Program Graduates
22
With respect to gender, one can see that compared to their male colleagues, female CFL-
organized program graduates are somewhat more likely to be teachers than administrators,
in both primary and secondary schools. For government primary schools the teacher-to-
administrator ratio is 11.9%/2.2% for females, while for males it is 14.7%/14.9%. For
government secondary schools the teacher-to-administrator ratio for females is
11.9%/2.2%, while for males it is 9.4%/8.3%.
Note that a somewhat higher percentage of CFL-organized in-service program graduates are
working in non-government schools than we have observed overall for the LTTP-organized
in-service program graduates (see Table 10). As shown in Table 16, 3.8% and 2.8% of CFL-
organized program graduates are employed as non-government primary school teachers
and non-government secondary school teachers, respectively, with the percentages being
very similar for males than for females.
Table 16: Employment Status of CFL-Organized C-Certificate Program
Graduates Category of Employment % Female % Male % Total
Government Primary School Teacher 11.9 14.7 14.0
Government Primary School Administrator 2.2 14.9 11.6
Government Secondary School Teacher 11.9 9.4 10.1
Government Secondary School Administrator 2.2 8.3 6.7
Non-government Primary School Teacher 5.4 3.2 3.8
Non-government Primary School Administrator 1.1 0.6 0.7
Non-government Secondary School Teacher 2.7 2.8 2.8
Non-government Secondary School Administrator 0.5 1.1 1.0
NOT Included in 2013 EMIS Database 62.2 44.9 49.4
Graduates (Total %)
TOTAL Number of Graduates
100%
185
100%
530
100%
715
Employment of ECSEL-Organized In-service C-Certificate Graduates Turning now to Table 17, which presents findings on graduates of the in-service program
organized by the European Commission Support to Education in Liberia (ECSEL), we note
that the majority of the graduates who are in the EMIS database are working in government
schools. However, somewhat different than the overall pattern of employment among LTTP-
organized in-service program graduates (see Table 10), the percentages of ECSEL-organized
in-service program graduates who are working in government primary schools as teachers
and administrators are almost the same as the percentages working in government

Tracer Study of C-Certificate Program Graduates
23
secondary schools as teachers and administrators. More specifically, just over one tenth of
ECSEL-organized program graduates are employed as government primary school teachers
(11.0%) and as government secondary school teachers (11.2%), while just under one tenth
are working as government primary school administrators (9.7%) and as government
secondary school administrators (7.2%).
With respect to gender, one can see that compared to their male colleagues, female ECSEL-
organized program graduates are somewhat more likely to be teachers than administrators,
in both primary and secondary schools. For government primary schools the teacher-to-
administrator ratio is 9.4%/3.1% for females, while for males it is 11.1%/10.3%. For
government secondary schools the teacher-to-administrator ratio for females is
12.5%/3.1%, while for males it is 11.1/7.6%.
Note that a somewhat higher percentage of ECSEL-organized in-service program graduates
are working in non-government schools than we have observed overall for the LTTP-
organized in-service program graduates (see Table 10). As shown in Table 17, the same
percentage of ECSEL-organized program graduates are employed as non-government
primary school teachers and as non-government secondary school teachers (4.2%), while
3.2% are working as non-government primary school administrators. Interestingly,
however, all of the ECSEL-organized program graduates working in non-government schools
are male.
Table 17: Employment Status of ECSEL-Organized C-Certificate Program
Graduates Category of Employment % Female % Male % Total
Government Primary School Teacher 9.4 11.1 11.0
Government Primary School Administrator 3.1 10.3 9.7
Government Secondary School Teacher 12.5 11.1 11.2
Government Secondary School Administrator 3.1 7.6 7.2
Non-government Primary School Teacher 0.0 4.3 4.2
Non-government Primary School Administrator 0.0 3.5 3.2
Non-government Secondary School Teacher 0.0 3.8 4.2
Non-government Secondary School Administrator 0.0 0.0 0.0
NOT Included in 2013 EMIS Database 56.3 47.4 48.1
Graduates (Total %)
TOTAL Number of Graduates
100%
32
100%
369
100%
401

Tracer Study of C-Certificate Program Graduates
24
Employment of NTAL-Organized In-service C-Certificate Graduates Looking now at Table 18, which presents findings for the in-service program organized by
the National Teachers Association of Liberia (NTAL), we observe that the majority of
graduates who are in the EMIS database are working in government schools. However
somewhat different than the overall pattern of employment among LTTP-organized in-
service program graduates (see Table 10), the percentages of NTAL-organized in-service
program graduates who are working in government primary schools as teachers and
administrators are almost the same as the percentages working as in government secondary
schools as teachers and administrators. More specifically, just under one tenth of NTAL-
organized program graduates are employed as government primary school teachers (7.9%)
and as government secondary school teachers (9.0%), while just under one twentieth are
working as government primary school administrators (4.5%) and as government
secondary school administrators (3.4%).
With respect to gender, one can see that for government primary schools the teacher-to-
administrator ratio among NTAL-organized program graduates is very similar for females
(8.0%/4.0%) and for males (7.8%/4.7%). For government secondary schools the teacher-
to-administrator ratio is slightly larger for females (12.0%/4.0%) than for males
(7.8%/3.1%).
Note that a somewhat higher percentage of NTAL-organized in-service program graduates
are working in non-government schools than we have observed overall for the LTTP-
organized in-service program graduates (see Table 10). As shown in Table 18, 4.5% and
2.2% of NTAL-organized program graduates are employed as non-government primary
school teachers and as non-government secondary school teachers, respectively, while 2.2%
are working as non-government primary school administrators. It is also worth noting that
in contrast to EXCEL-organized program graduates, it is the female NTAL-organized program
graduates who (percentage-wise) are more likely to be employed in non-government
schools.

Tracer Study of C-Certificate Program Graduates
25
Table 18: Employment Status of NTAL-Organized C-Certificate Program
Graduates Category of Employment % Female % Male % Total
Government Primary School Teacher 8.0 7.8 7.9
Government Primary School Administrator 4.0 4.7 4.5
Government Secondary School Teacher 12.0 7.8 9.0
Government Secondary School Administrator 4.0 3.1 3.4
Non-government Primary School Teacher 8.0 3.1 4.5
Non-government Primary School Administrator 4.0 1.6 2.2
Non-government Secondary School Teacher 4.0 1.6 2.2
Non-government Secondary School Administrator 0 1.6 1.1
NOT Included in 2013 EMIS Database 56.0 68.8 65.2
Graduates (Total %)
TOTAL Number of Graduates
100%
25
100%
64
100%
89
Employment of UNICEF-Organized In-service C-Certificate Graduates Finally, Table 19 presents findings for the UNICEF-organized in-service program. We
observe that the majority of the relatively few graduates who are in the EMIS database are
working in government schools. However, somewhat different than the overall pattern of
employment among LTTP-organized in-service program graduates (see Table 10), the
percentages of UNICEF-organized in-service program graduates who are working in
government primary schools as teachers and administrators are similar to the percentages
working in government secondary schools as teachers and administrators. More specifically,
approximately one twentieth of UNICEF-organized program graduates are employed as
government primary school teachers (8.0%) and as government secondary school teachers
(3.8%), while about one twentieth are working as government primary school
administrators (6.1%) and as government secondary school administrators (5.0%).
With respect to gender, one can see that compared to their male colleagues, female UNICEF-
organized program graduates are somewhat more likely to be teachers than administrators,
in both primary and secondary schools. For government primary schools the teacher-to-
administrator ratio is 10.9%/3.7% for females, while for males it is 7.3%/6.6%. For
government secondary schools the teacher-to-administrator ratio for females is 6.4%/2.6%,
while for males it is 3.2%/5.5%.
Note also that relatively few UNICEF-organized in-service program graduates are working
in non-government schools (i.e., 2.7% or less), which is similar to what we have observed
overall for the LTTP-organized in-service program graduates (see Table 10). However,

Tracer Study of C-Certificate Program Graduates
26
similar to what was discussed for NTAL-organized program graduates, the percentages of
UNICEF-organized program graduates working in non-government schools tends to be
higher for females than for males.
Table 19: Employment Status of UNICEF-Organized C-Certificate Program
Graduates Category of Employment % Female % Male % Total
Government Primary School Teacher 10.9 7.3 8.0
Government Primary School Administrator 3.7 6.6 6.1
Government Secondary School Teacher 6.4 3.2 3.8
Government Secondary School Administrator 2.6 5.5 5.0
Non-government Primary School Teacher 5.6 2.0 2.7
Non-government Primary School Administrator 2.2 1.1 1.3
Non-government Secondary School Teacher 2.6 1.4 1.6
Non-government Secondary School Administrator
1.1 0.5 0.7
NOT Included in 2013 EMIS Database 64.8 72.3 70.9
Graduates (Total %)
TOTAL Number of Graduates
100%
267
100%
1103
100%
1370
Conclusion
This report presented results from a study conducted by the LTTP Monitoring, Evaluation,
and Research team. The purpose of the study was to assess the extent to which graduates of
LTTP/USAID supported pre-service and in-service C-Certificate programs as well as other C-
Certificate programs are employed as teachers or administrators in government or non-
government primary or secondary schools. The study analyzed the Ministry of Education’s
2013 EMIS database, augmented by inserting information from lists of graduates from the
five cohorts of LTTP-supported pre-service program, the five cohorts of the LTTP-organized
in-service C-Certificate program as well as from in-service C-Certificate programs organized
by other organizations (Christian Foundation for Liberia, European Commission Support for
Education in Liberia, the National Teachers Association of Liberia, and UNICEF).
The study provides information on the percentages of male and female graduates who are
various employment categories within the education sector. More specifically, the study

Tracer Study of C-Certificate Program Graduates
27
reports the percentages of graduates who are employed as teachers and administrators
(principals, vice principals, and registrars) in government primary schools, those employed
in such positions in non-government primary school, those in employed as teachers and
administrators in government secondary schools, and those employed in such positions in
non-government secondary schools.
The study also presents the percentages of graduates of the various C-Certificate programs
who were not found in the 2013 EMIS database. Indeed, of the 6,710 individuals who earned
a C-Certificate from one of these programs during the 2000 to 2013 period, 3,967 (58.7%)
of them were not found in the 2013 EMIS database. Undoubtedly, because of the limitations
of this study, some of these graduates are in fact employed in the education sector.4 That is,
some of the graduates may be working in the 202 schools (i.e., 6.6%) whose principals
participated in the EMIS trainings but did not return the annual school census
questionnaires. Furthermore, some of the graduates may be working in the education sector
but under different names than they used when participating in the C-Certificate program.
However, it is very likely that many of the 3,967 graduates who were not found in the 2013
EMIS database either had never been employed in the education sector (e.g., graduates of
cohort 4 and 5 of the LTTP-supported pre-service program) or left the profession after
completing the C-Certificate program. This likely constitutes a sizeable group of
professionally “qualified” individuals who could be employed or re-employed as teachers or
administrators in government or non-government primary or secondary schools.
Depending on the size of this group of professionally qualified individuals who are not
currently employed in the education sector, the Ministry of Education may be in a position
to increase the proportion of primary school teachers who have at least the minimum
qualification (i.e., a C-Certificate). Although, a number of interventions have been made by
partners in helping to strengthen Liberia’s teaching force, the government must take
concrete actions to hire and retain “qualified” teachers. However, this may require that the
Ministry establish special packages of financial incentives, organize better living conditions,
and/or improve working conditions to attract and hold “qualified” teachers in some settings
(see also Goyee et al., 2014).
With respect to the employment categories of graduates who were found in the EMIS
database, there are some interesting differences across the C-Certificate programs
supported or organized by different partners. For the USAID/LTTP-supported pre-service
4 That at least some of the C-Certificate program graduates not in the 2013 EMIS data base may be employed in the education sector is signaled by the results from another, more limited tracer study previously conducted. Based on direct telephone contact with 76 of 509 graduates of cohort 3 of the LTTP-supported pre-service program and information they reported about their colleagues, Tuowal (2012) indicates that 404 (i.e., 79.4%) were working – and on the payroll – in schools. This compares with 43.5% of the graduates of cohort 3 of the LTTP-supported pre-service program which were found to be in the 2013 database.

Tracer Study of C-Certificate Program Graduates
28
program and the USAID/LTTP-organized in-service program the vast majority of graduates
were found to be working in government primary schools, as teachers or administrators.
Relatively smaller percentages of these programs’ graduates were seen to be employed in
government secondary schools (as teachers or administrators), and very small percentages
of these programs’ graduates were working in non-government schools. In contrast, the
percentages of graduates of the other organization’s C-Certificate programs were almost as
likely to be employed in primary schools as they were to be working in secondary schools.
Moreover, especially for the programs organized by ECSEL and NTAL, there were noticeably
higher percentages of graduates serving as teachers or administrators in non-government
primary and non-government secondary than was the case for LTTP-supported or organized
programs.
One issue that needs to be discussed concerns whether having educators with C-Certificates
working in government secondary schools is a positive or negative development. Certainly,
these are individuals who could instead be hired to increase the percentage of qualified
primary school teachers and administrators. However, while their credentials are below that
which government policy stipulates as the minimum qualification for secondary school
teachers (i.e., a B-Certificate for lower secondary and a university degree for upper
secondary), these individuals have credentials equal to or higher than many of their
secondary school colleagues. According to the Education Statistics publication (MoE, 2013,
p. 77), 27.2% of all government and non-government secondary school teachers are
“untrained,” that is, possessing less than a C-Certificate, and only 13.8% have a university
degree. Thus, there is a need to upgrade the qualifications of many secondary school
teachers, but having secondary school teachers and administrators who are graduates of the
C-Certificate programs may in the current situation contribute to improving the quality of
education at the lower and upper secondary levels.
Another issue which would benefit from policy dialogue relates to the number of graduates
of C-Certificate programs, particularly those organized by ECSEL and NTAL, who are
currently working as teachers or administrators in non-government primary or secondary
schools. On the one hand, one may view this as a leakage of qualified primary school teachers
from the government to the non-government subsector of education – representing a loss of
investment designed to improve the quality of education at the primary level. On the other
hand, given that the pupils attending non-government schools are for the most part Liberian
citizens, this could be seen as a valuable, if unintended, contribution to improving the
country’s education system. Moreover, since some children and youth likely move back and
forth between government and non-government schools, having teachers and
administrators with C-Certificate qualifications working in non-government school teachers
may in fact contribute to improve learning outcomes for at least some pupils in government
schools.

Tracer Study of C-Certificate Program Graduates
29
While discussions regarding the policy and practice implications of this study should be
undertaken, there is a need for further research to clarify some of the issues. First, this study
should be replicated once the 2014 EMIS database is ready. Hopefully, the 2014 annual
school census will include an even higher percentage of government and non-government
schools than was the case for the 2013 EMIS database. It may also be that with on-going work
on cleaning up the employment and payroll records there were be fewer C-Certificate
program graduates whose names do not match how their names are recorded in the annual
school census and EMIS database.
Second, a follow-up study should be conducted with a sample of those C-Certificate program
graduates who were not found in the 2013 EMIS database (or who are not found in the 2014
EMIS database). This study should focus particularly on pre-service graduates who either
never were employed in the education sector or on in-service graduates who left the
profession. Understanding better why they did not gain employment or they discontinued
their work as a teacher or administrator would certainly inform discussions leading to
possible reforms in policies, procedures, or practices.

Tracer Study of C-Certificate Program Graduates
30
References Association of Liberian Universities (ALU) (2012). 2010 Education Sector Survey. Monrovia:
Association of Liberian Universities, Ministry of Education, and USAID.
Goyee, Oscar; Tuowal, Delwlebo; Morris, Emmanuel; Hatch, Rachel; and Ginsburg, Mark (2014).
Study of Primary School Teachers Supply and Demand. Monrovia: Liberia Teacher Training
Program.
Ministry of Education (MoE) (2013). Liberia Education Regulations. Monrovia: Ministry of
Education, Republic of Liberia.
Ministry of Education (MoE) (2013). Education Statistics for the Republic of Liberia. Monrovia:
Ministry of Education, Republic of Liberia.
Republic of Liberia (2011). The Education Reform Act of 2011. Monrovia: Ministry of Education,
Republic of Liberia.
Tuowal, Delwlebo (2012). Pre-Service C-Certificate Cohort 3 Graduate Tracer Study. Monrovia:
Liberian Teacher Training Program.