tracer study on breaking poverty ... - save the … · addis ababa ethiopia tracer study on...
TRANSCRIPT

Addis Ababa
Ethiopia
TRACER STUDY ON BREAKING POVERTY
THROUGH PROTECTION AND INVESTING IN
DECENT EMPLOYEMNET OPPORTUNITIES
FOR VULNERABLE CHILDREN AND YOUTH
Submitted to Save the Children International By
Nucleus Health and Social Affairs Consultancy
4/11/2013

2
TABLE OF CONTENTS
ACKNOWLEDGEMENTS ........................................................................................................................................ i
LIST OF FIGURES .................................................................................................................................................. ii
ACRONYMS ............................................................................................................................................................ iv
EXECUTIVE SUMMARY ........................................................................................................................................1
1.1 INTRODUCTION ....................................................................................................................................................7
1.1 Background of the study ................................................................................................ 7
1.2 Purpose of the study ....................................................................................................... 9
1.3 Scope of study................................................................................................................. 9
1.4. Structure of the tracer Study ....................................................................................... 10
2.0 LITERATURE REVIEW .......................................................................................................................................... 11
2.1 Conceptual framework of Technical and Vocational Education ................................ 11
3.0 RESEARCH METHODOLOGY ............................................................................................................................... 13
3.1 Sampling Methods and Procedures ............................................................................. 13
3.2 Data Collection Instruments ......................................................................................... 14
3.3 Field work organization ................................................................................................ 15
3.4 Limitations of the study ................................................................................................ 16
4.0 DATA ANALYSIS ........................................................................................................................................... 17
4.1 Demographic and Social Profile of Respondents ....................................................... 17
4.2 Training provided to beneficiaries ............................................................................... 22
4.3. Perceptions of beneficiaries ........................................................................................ 29
4.4 Apprenticeship Training ............................................................................................... 34
4.5 Employment Status of Respondents ................................................................................... 36
4.6. Job searching ................................................................................................................... 50
4.7 Income changes of graduates ............................................................................................. 53
4.8 Perception of respondents on the relevance and effectiveness of the skills training ............... 60
4.9 Basic Business Skill (BBS) ................................................................................................. 64
5 Supports of CHADET and FSCE ........................................................................................................................ 66
5.1 Supports of CHADET and FSCE to create market linkage ................................................. 66
5.2 Different supports provided by the project implementers (CHADET and FSCE) ................ 67
5.3. Contribution of the project support in improving Living Condition of beneficiaries ........... 71
6. Conclusion and Recommendation ....................................................................................................................... 77

3
6.1 Conclusion........................................................................................................................ 77
6.2 Recommendations ............................................................................................................. 78
REFERENCES ...................................................................................................................................................... 79
APPENDICES ....................................................................................................................................................... 81

i
ACKNOWLEDGEMENTS
Various individuals and institutions have made significant contributions for the successful achievements
of this tracer study. We would like to appreciate Save the Children staff under EYE Program in Addis
Ababa for their unreserved support during the study without their efforts this tracer study would have
not been successful. We would like to express our gratitude to all key informants who undoubtedly spent
their precious time to offer valuable information pertaining to this project. Moreover, our many thanks
go to CHADET Amhara field office for their genuine and earnest contribution. We are also indebted to
the target groups of the study for their expertise information. Above all, finally, we would like to extend
our thanks to all regional coordinators, supervisors and data collectors for their vital contribution during
the data collection and supervision process of this tracer study.
ii
LIST OF FIGURES
Figure 1: Simplified conceptual framework ............................................................................................. 12
Figure 2:: Percentage distribution of respondents by age and sex ............................................................ 17
Figure 3: Percentage of beneficiaries by educational level and sex ......................................................... 18
Figure 4:Family background of beneficiaries ........................................................................................... 19
Figure 5: Distribution of beneficiaries by family background and educational status ............................. 20
Figure 6:Percentage of beneficiaries by type of training .......................................................................... 22
Figure 7: Percentage of beneficiaries by training type and woreda......................................................... 23
Figure 8: Percentage distribution of respondents by types of vocational training and woreda.............. 24
Figure 9: Distribution of trained beneficiaries by year of graduation and woreda ................................... 27
Figure 10: Training durations for TVET, FTC and BBS .......................................................................... 28
Figure 11: Perception of beneficiaries on the duration of TVET and FTC trainings ............................... 29
Figure 12:Perception of beneficiaries on the importance of TVET and FTC trainings............................ 30
Figure 13:Perception of beneficiaries regarding the importance of the training ...................................... 31
Figure 14: Responses of beneficiaries who said the TVET and FTC trainings were not important
Percentage of beneficiaries ....................................................................................................................... 32
Figure 15: Extent of the TVET and FTC to develop skills ....................................................................... 33
Figure 16: Perception of beneficiaries regarding the extent the trainings to develop skills ..................... 34
Figure 17: Distribution of beneficiaries by employment status ................................................................ 36
Figure 18: Type of employment by employers ......................................................................................... 37
Figure 19: Salaried employees by age and sex ......................................................................................... 40
Figure 20: Self employed beneficiaries by sex, age and type of self employment ................................... 41
Figure 21: Employment status by training type ........................................................................................ 42
Figure 22: Employment status by field specialization .............................................................................. 44
Figure 23: Percentage of beneficiaries by sex, field of specialization and employment status ................ 46
Figure 24: Employment status by geographical location .......................................................................... 47
Figure 25: The length of time for searching of job ................................................................................... 51
Figure 26: Income changes of beneficiaries before and after project ....................................................... 54
Figure 27: Monthly income of beneficiaries by woreda ........................................................................... 57

iii
Figure 28: Perception of beneficiaries regarding their income change Percentage of beneficiaries ........ 58
Figure 29: Changes observed due to income change ................................................................................ 59
Figure 30: Changes observed due to income change ................................................................................ 62
Figure 31: Percentage of beneficiaries who obtained financial and materials support by woreda ........... 70
Figure 32: Satisfaction levels of beneficiaries for the support of CHADET/FSCE ................................. 71
Figure 33: Occupational status of respondents before project intervention ............................................. 72
Figure 34: Percentage of beneficiaries who are and are not satisfied with their current job .................... 74

iii
List of Tables
Table 1: Total Number of Respondents Selected and interviewed .......................................................... 14
Table 2: Fields of specialization ............................................................................................................... 25
Table 3: Graduated trainees by year ......................................................................................................... 26
Table 4: Apprenticeship attended by skill of training ............................................................................... 35
Table 5: Salary employed by type of skill, employers and employments ................................................ 38
Table 6: Type of training, employment status and geographical location of beneficiaries ...................... 43
Table 7: Percentage distribution of respondents by year of graduation and employment status .............. 48
Table 8: The major difficulties encountered in looking for jobs or doing of own business as reported by
unemployed respondents ........................................................................................................................... 52
Table 9: Income level of beneficiaries before and after the project ......................................................... 56
Table 10: The relevancy and effectiveness of the training by type of skill and Woreda .......................... 61
Table 11: The relevancy of the trainings to increase competitiveness of beneficiaries in the job market 63
Table 12: BBS training and its relevance as perceived by graduates ....................................................... 65
Table 13: Entrepreneurship and other business awareness raising activities and their relevance as
perceived by the respondents .................................................................................................................... 66
Table 14: Supports provided to beneficiaries ........................................................................................... 68
Table 15: Supports provided by woreda ................................................................................................... 69
Table 16: The safeness of current jobs ..................................................................................................... 73
Table 17: Responses for question whether current job is safer or not .................................................... 73
Table 18: Percentage of beneficiaries who are and are not satisfied with their current job .................. 75

iv
ACRONYMS
CHADET Organization for Child Development and Transformation
EU European Union
EYE Education for Youth Empowerment
FGD Focus Group Discussion
FSCE Forum on Sustainable Child Empowerment
FTC Farmer Training Center
MoE Minster of Education

1
EXECUTIVE SUMMARY Tracer study is an important tool to obtain valuable information regarding the graduates’ livelihood after
they completed their training and join the labor market. This information will be used for minimizing
any possible deficits in the program and improve it for the future in terms of content, quality and
delivery of the training and creating employment opportunities.
With regard to methodology, the number of sampled beneficiaries were scientifically determines and
both quantitative and qualitative data collection tools were prepared. Using the tools, data were
collected from 353 respondents, these data entered to computers and analyzed. The qualitative
approach, on the other hand consisted of focus group discussion and key informant interview.
The overall objectives of this tracer study was to generate information on the employment status and
conditions of youth/children trained and supported financially under the economic empowerment
component) under the project. It also aimed at generating information on the competitiveness of TVET
graduates, their income level and common employment destinations.
Eighty five percent of beneficiaries were youth whose age was between the age of 18 and 25, and gender
equality was observed. With regard to educational status the 54 percent of beneficiaries attained primary
education first and second cycle level and 16 percent of beneficiaries attained TVET.
With regard to family back ground, 40 percent of beneficiaries lived with their both parents while 17
percent of them lived with one of their parents and 42 percent of them lost one or both of their parents
due to different cases.
Among the beneficiaries, 45 percent and 59 percent of them are single and double orphans respectively
and attained primary education in both cycle and general secondary education prior to joining the
project. Among those beneficiaries who attained TVET before they join the project, 24 percent of them
were single and double orphan. This shows that the beneficiaries were vulnerable to different social,
economic and health problems and as a result they were engaged in hazardous business activities and
jobs in order to get their daily bread.
Among beneficiaries 54 percent and 34 percent of them were trained in TVET and BBS. Though all
trainings were provided in all targeted woredas, 72 percent of beneficiaries from Este woreda, 79
percent of beneficiaries from Tis Abay Woreda and 26 percent of beneficiaries from Dera woreda were
trained in TVET, BBS and FTC respectively.

2
With regard to sex composition, 52 percent of males and 48 percent females were trained in TVET.
Moreover, 39 percent of males and 61 percent females were trained in FTC while 59 percent of males
and 41 percent of females were trained in BBS.
Among those beneficiaries who were trained in TVET, 31 percent of them were specialized in
construction and cobblestone, where 19 percent of them were specialized in beauty salon and wood and
metal work respectively. On the other hand, among beneficiaries who were trained in FTC, 82 percent
of them were specialized in animal farm. Cleaning and waste disposal management was chosen by 48
percent of those beneficiaries who were trained in BBS.
The majority of (65 percent) beneficiaries were graduated in 2012 and most of them were from Bahir
Dar town followed from Dera woreda. Most of the trainings were provided for 5-10 days.
Most of (58 percent) beneficiaries attended apprenticeship and of these, 57 percent of them were TVET
trainees followed by BBS trainees that account 29 percent.
Among the trained beneficiaries 68 percent of them were self employed while 19 percent and 13 percent
of them were employed as salary employees and unemployed respectively. Very few beneficiaries (63)
were employed as permanent (59 percent), temporary (29 percent) and fixed term (13 percent)
employees. The majority of permanent, temporary and fixed term employees were employed by
cooperatives and private organizations. The numbers of beneficiaries employed in government
organizations are few.
Among those beneficiaries who were trained in TVET, most of (69 percent) them were employed in
private institution as temporary employees, a person trained in FTC was employed in private institution
as permanent employee and 75 percent of BBS trainees were employed in private institution as
temporary employee.
In all types of salaried employment, males whose age was between 21 and 25 took the higher proportion
but females whose age was between 26 and 30 obtained employment opportunity as compared to
females who were below the aforementioned age. Those youth whose age was between 16 and20
obtained little employment opportunities as compared to other youth whose age was above this age.
Among those beneficiaries who were self employed, 28 percent of them were self employed individually
and 72 percent of them were self employed in cooperatives. In both types of self employment, those

3
youth whose age was between 20-24 exceed other youth whose ages were below and above their ages.
But the proportion of males and females was almost equal.
The type of employment and trainings were analyzed in terms of woredas and the finding is that among
TVET graduates and became self employed, most of them were in Dera (64 percent) and Este (52
percent) woredas and 21 percent from Merawi and 25 percent from Woreta were unemployed thought
they trained in TVET. From the FTC graduates, none of them self employed but 27 percent from Dera
and 17 percent were salary employed. Those BBS trained beneficiaries were self employed among these
63 percents were in Tis Abay followed by 26 percent in Bahir Dar town.
Employment status by field of specialization were analyzed and it is found that among those
beneficiaries who were self employed, 35 percent of them were trained in agriculture, among salary
employed 61 percent of them were trained in cleaning and waste disposal management, and among
unemployed 17 percent of them were trained in construction and cobblestone.
Among beneficiaries who were graduated in 2011 and 2012, 83 percent and 78 percent of them have got
employment opportunities respectively. This finding implies that more should be done in creating
employment opportunities to beneficiaries after they graduate. .
In general, the above mentioned findings indicate that beneficiaries could not get employment
opportunities in different organizations. This could be due to low quality of the training and poor
lobbying and communication of the two project implementers regarding the objective of the project as
well as about beneficiaries’ competency. Thus, the project funder and implementing partners should
work hard on improving the quality of the trainings in order to make the beneficiaries competitive in the
labor market and business, conduct labor market study prior to sending beneficiaries to training,
promotion and business awareness should be made not only to the trainees but to institutions that are
potential recruiter of the trainees in order to create employment opportunity to the beneficiaries
otherwise these people will back to their former hazardous work.. Thus, the project implementers and
funder should work hard on this for the future.
In searching job after graduation, those beneficiaries who were trained in TVET did not spent that much
time where as those beneficiaries who did not take training could not get job in any form. This shows
that in order to get job or start own business, training is vital.

4
Though beneficiaries faced different types of problems while they search for job, the major problems,
among others, were limited employment opportunities and absence of job. These problems were
mentioned by 58 percent of beneficiaries. Seventy seven percent of beneficiaries mentioned that they
made effort to start their own business but 77 percent of them mentioned that their problem was lack of
financial capital and tools. These unemployed beneficiaries were asked regarding the support provided
to them by the two implementing partners. Little above half percent said that they obtained but not
others. These findings indicate that the two project implementing partners should help beneficiaries in
searching job using different mechanism and the current status of supporting level should be improved.
The study revealed that the project had brought significant income change among beneficiaries. Prior to
the project implementation, 84 percent and 81 percent of males and females had no income respectively.
But after the project implementation, these figures dramatically go down to 21 percent males and 13
percent females. Moreover, the income of other beneficiaries was increased though it was not as much
as expected.
The income change in terms of the type of employment was seen and it was found that those percentage
of self employed whose monthly income was less than Birr 200 was increased to 34 percent from 25
percent and those employees whose salary was between birr 501-600 was increased from 6 percent to 13
percent. With regard to unemployed beneficiaries, 96 percent of them did not have income prior to
project implementation but after project implementation this figure goes down to 77 percent. This is
obvious that s because some these people had got employment opportunity.
Among those beneficiaries, 48 percent said that somehow improved while 24 percent of them said it was
greatly improved. Only 9 percent of them said their income declined.
Beneficiaries expressed their perception regarding the relevancy and effectiveness of the training they
took and the result obtained shows that 87 percent of them said the trainings they took were relevant to
their current job.
Among trainees who took TVET, FTC and BBS, 82 percent, 97 percent and 82 percent of them were
engaged in the field they were trained.
Moreover, 84 percent of trainees (81 percent of TVET trainees, 97 percent of FTC trainees and 83
percent BBS trainees said that the trainings they took increased their competitiveness in the labor
market and the business environment in which they are participating.

5
These findings indicate that the trainings provided to beneficiaries were relevant and effective in
enabling them to get job or start business in the field of their training and increasing their
competitiveness in the labor market and business in which they are engaged.
In this regard, it is possible to say that the two project implementing partners were effective in achieving
the project objective. Thus, these partners should take further ideas from beneficiaries in order to
improve the trainings for the future and build the capacity of beneficiaries in selecting the field they will
be successful.
The study results show that the majority (71 percent) of beneficiaries took BBS training, and among
these beneficiaries 67 percent of them said the training was important. Moreover, 94 percent (199) of
beneficiaries said that BBS training was relevant for the activity they are engaged in and 94 percent
(198) of beneficiaries said that the BBS contributed for their business activities. From this one can
conclude that the BBS training was very useful to beneficiaries to change their livelihood.
Among the total beneficiaries 94 percent of them participated in business awareness raising activities
and among these 92 percent of them were participated in experience sharing with best practice and other
types of business awareness raising activities. It is found that the support of CHADET and FSCE was
appreciated by 73 percent of beneficiaries. Moreover, the support of the two implementing partners
should be strengthened because significant number of beneficiaries had complain on the support of
CHADET and FSCE.
Prior to joining the project about 71 percent of beneficiaries were engaged in hazardous job such as
commercial sex work, daily labor, no job and dancing. But after the implementation of the project, most
of them transferred to decent jobs as mentioned earlier. Among those beneficiaries who are engaged in
decent jobs, 80 percent of them said that their current job is safe for their health and 44 percent of them
said their current working condition is favorable. In addition to this, 62 percent of beneficiaries said
they are satisfied with their current job.
In conclusion, the project was successful in most of the activities performed even though there are issues
both the funder and implementing partners work together in order to make the project achievement
better and to make the livelihood change of beneficiaries sustainable.
However, the following recommendations need the attention of the funder and the two implementing
partners:

6
The training quality should be improved in order to make beneficiaries competitive in the labour
market.
Beneficiaries should be get utmost assistance when they strived to be employed or start their
own business.
The project objective and the situation of beneficiaries should be promoted to the concerned
stake holder.

7
1.1 INTRODUCTION
1.1 Background of the study
Ethiopia’s efforts to fight poverty were supported by international agencies and these efforts have
brought accelerated economic growth. Accordingly, the country has registered 11 percent economic
growth from 2004/05 to 2010/2011 and 8.6 percent in 2011/12 (EEA, 2011 and 2012, AfDBG et al,
2013, UN ECA, 2013). GDP Per Capita was increased from USD 135 in 2004 to USD 461 in 2012
respectively (AfDBG et al, 2013). The rate of poverty was also decreased from 45.5 percent in 1995/96
to 29.6 percent (25.7percent for urban and 30.4percent for rural) in 2010/11 (MOFED, 2012).
In spite of such achievements, the fast growing economy could not create decent employment
opportunity for large number of the people. 75 percent of the workforce is still concentrated in low skill
employment sectors such as commerce, services and elementary occupations. Less than half of the urban
workforce is engaged in wage employment. A significant portion of the urban workforce works for
unpaid family business. More than 40 percent of the labor forces are self-employed in the informal
economy, most of which live on the edge of poverty. In rural areas, underemployment is widespread. In
urban areas, about 26 percent of the workforce is officially unemployed. Low skills development and
very low average educational attainment have contributed a lot for the involvement of large number of
labor force in the informal sector and high rate of unemployment.
Building the motivated and competent workforce through the expansion of education is one of the most
important issues that government has paid great attention to address this problem. TVET is one of the
country’s education systems that play a key role in building motivated and competent workforce. The
overall objective of promotion of TVET in Ethiopia is to create a competent, motivated, adaptable and
innovative workforce that will contribute to poverty reduction as well as social and economic
development through facilitating demand-driven, high quality technical and vocational education and
training, relevant to all sectors of the economy, at all levels and to all people. Thus, non-governmental
organizations (NGOs), multilateral and bilateral organizations are the key stakeholders in the promotion
of TVET. They have played a great role in TVET system by involving in policy development, providing
technical and financial supports to the TVET system, involving actively in the setting of occupational
standards and conducting occupational assessment, providing training and offering internships to
trainees and providing apprenticeship training. Save the Children is among NGOs that are involved in
8
the efforts of realizing the building of motivated and skilled man power in the country. Save the
Children has designed and implemented Education for Youth Empowerment (EYE) subtheme under the
main theme of Education. The focus of EYE is to realize full potential of youth by empowering them
both socially and economically. Accordingly, it has provided financial, technical and other kinds of
supports to young people and children who were selected to be trained in TVET institutions based on
their vulnerability to different social, health and other problems through the project which is entitled
“Breaking Poverty through Protection and Investing in Decent Employment for Vulnerable Children
and Youth” is implemented in Amhara Region, specifically in Woreta, Dera and East Estie woredas of
South Gondar zone and in Bahir Dar and the transit town of Tis Abay, Adet and Merawi of West Gojjam
zone in partnership with local NGOs namely CHADET and FSCE. The project is a three year project
(December 2010-December 2013) which is financially supported by EU.
The general objective of the project is to improve employment opportunities and social inclusion of the
marginalized and vulnerable children and youth who are involved in hazardous informal works in the
Amhara Region. Specifically the project aimed to create safe employment opportunities to youths and
children who are involved in hazardous works in the informal sector in Bahir Dar and the surrounding
transit towns and in South Gondar Zone. The project is targeting 500 children aged 8-14 and 2500 youth
aged 14-25.
The self-employment promotion is the dominant approach that is used to empower youths economically
in order to improve their livelihood. It is expected that this type of support has three major benefits (1) it
will make the project beneficiaries self reliant, confident, innovative, entrepreneur, (2) it will enable
them to have vision and (3) it will make them job creator in lieu of job hunter.
Conducting a study on the impact of project intervention is fundamental in order to provide information
on how the activities were implemented by the project have contributed in achieving the intended
objectives. In the light of these issues/concerns, Save the Children as part of its quality assurance policy
decided to conduct ‘Tracer Study’. Save the Children, therefore, has decided to hire consultancy firm
that conduct tracer study independently and provide the aforementioned information. Nucleus Health &
Social Affairs Consultancy Firm was, therefore, selected to conduct this study and this report is prepared
in accordance to the ToR issued.

9
1.2 Purpose of the study This tracer study is intended to generate information on the employment status and conditions of youth
who were financially supported to be trained in TVET, FTC and BBS under the economic empowerment
component of the project. It also aimed at generating information on the competitiveness of TVET
graduates, their income level and employment destinations.
The Tracer Study was expected to answer the following key questions:
What percentage of TVET graduates became salary employed, self employed, or engaged in
other forms of income generating activity?
What is the average level of income for beneficiaries after joining the project, and have they
improved their income compared? If yes, in what percent? If not, why?
To what extent beneficiaries in the economic component of the project became competitive
in the laobr market?
How well the trainings and other supports given by the project helped the beneficiaries to
transit from hazardous work, to decent employment?
To what extent the training was relevant and effective to youth to be employed/self
employed?
What employment destinations have the training graduates found?
To what extent were beneficiaries being satisfied with the skills training?
This report will also be used to inform the final project evaluation and TVET programming
as whole.
1.3 Scope of study The overall focus of the tracer study was to assess the role of the trainings and employment supports (wage and
self) provided to graduates’ through the project in respect of their employability and , competitiveness in the labor
and product market , income change and ability to move from hazardous jobs to decent jobs and gainful
employment. The target population of the study was the youth who have been benefitted from training and or
employment/self employment support during 2011 and 2012. Geographically, the study had covered Woreta, East
Estie and Dera Woredas from south Gonder zone, and Bahir Dar town and the transit towns (namely Tis Abay,
Adet, Woreta and Merawi).
Specifically the study aimed to;
Identify employment destinations/career paths of the project beneficiaries, factors
determining their careers and performance in their different career destinations.

10
Analyze employment rate and types (Self and wage employment (formal & informal),
unemployment/idleness, apprenticeships, training or educations,
Determine average incomes, links between training and support received and increase in
income, and effects on their general life situation including the ability to move away from
hazardous work to decent employment
The duration of getting a job after training, job retention rates, career differences by gender,
match between training and jobs taken up as well as overall economic and social
empowerment of the graduates.
Analyze factors affecting efficiency and relevance of training and employment support
provided by the Technical and Vocational Education Training, Farmers Training Centers,
apprenticeships, and partners’ employment support and determine factors inhibiting
unemployed graduates.
Review and evaluate the effectiveness and relevance of the training and employment support
from both the graduates and employers’ perspectives to assess whether trainees get the
quality of training that matches job situations and standards
Make recommendations for improving employment opportunities and competitiveness of
TVET graduate as well as effectiveness and relevance of the training
1.4. Structure of the tracer Study The rest of the study report is structured as follows. The next section, section two, reviews the literature
and presents the conceptual frameworks that guided this study. Section three presents the research
methodology of the study. The results and discussion of the study is presented in section four. The last
section, section five, contains concluding remarks and recommendations for improving employment
opportunities and competitiveness of TVET graduate as well as effectiveness and relevance of the
training.

11
2.0 LITERATURE REVIEW
2.1 Conceptual framework of Technical and Vocational Education
There are different perspective with regard to Technical and Vocational Education and Training
(TVET). Because of this, it is defined in different ways like TVET is theoretical or non-theoretical
vocational preparation of students for jobs involving applied science and modem technology as well as
manual or practical activities.
TVET can be classified as formal and non-formal. The former consists of academic technical education
and provided in regular and accredited schools while the latter consists work-based training and on job
trainings. The non-formal TVET is different from the formal TVET because it accepts trainees who
have different educational background, the curriculum is not standardized, duration of the training is
short, cost is lower and it is provided by teachers usually not certified.
Both types of TVET are have paramount contribution for the success of individuals in that it equip them
with relevant skills and knowledge so that they will have better chance to be either self employed or
salary employed there by their earning power will increase and access to a quality life.
In developing country like Ethiopia, the non-formal TVET is plays crucial role in reducing
unemployment especially when the training focused on creating ‘job-creator’-self employed rather than
‘job seekers’.
This tracer study is conducted based on the conceptual framework developed by ILO. As clearly ILO
indicated in its tracer study manual, Tracer study is an
empirical study that evaluates the results of the education and
training provided by an institution. Governments and their
development partners conduct tracer study because it
provides them basic types of information concerning the level
of employment, unemployment and underemployment among
the graduates, the first and current work position of graduates and the correspondence between
educational qualifications and required work skills. Such studies can often demonstrate the success of
education and training in relation to the graduates, labor market and employers. The information
Tracer studies take a retrospective look at
the evolution of the situation of a sample of
children already provided with or exposed
to a specific intervention. It is an enquiry
approach at a single point in time that
generates data on already achieved impact
(ILO, 2011).

12
acquired by means of tracer surveys can also indicate possible deficiencies in a given educational
program and serve as a basis for future planning activities, at both the institutional and national levels.
While conducting tracer study, it is recommended that the analysis of tracer study should comprise
profile of TVET graduates, the employability of TVET graduates in that the profile of TVET graduates
indicates the reasons for taking up the TVET program and TVET qualification taken in addition to the
age, sex and highest grade completed of the trainees, assessing the employability of TVET graduates
helps to identify the length of job search on finding first job and details on the employment of TVET
graduates at time of survey, i.e, occupation, industry, nature and class of employment, income level shall
be analyzed. Yeknoamlak (2001), also said that the tracer studies should focus on the linkage between
TVET and labor market since TVET and labor market are complimenting and non separable function.
Since such tracer study should be conducted based on scientific method and takes in to account the
aforementioned and other factors, this study adopts the premises of ILO and other authors. Simplified
conceptual framework is developed as can be seen in the figure 1 below.
Figure 1: Simplified conceptual framework
Education Economic well-being Changes in KABS Health
Other factors external to the intervention
Dependent Independent variables: services of the intervention in
Employment status of Former beneficiaries

13
3.0 RESEARCH METHODOLOGY
3.1 Sampling Methods and Procedures Purposive sampling method was adopted in this tracer study to draw the primary sampling unit (the
Woredas). The following steps were followed to draw sample respondents. The woredas and town were
selected purposefully to incorporate as much project intervention area as possible. Accordingly, the
study sites were Woreta, Dera and East Estie woredas from South Gondar zone, and Bahir Dar and the
transit town of Tis Abay, Adet and Merawi from West Gojjam. The second step was selection of sample
respondents. The researchers received list of project beneficiaries from CHADET and FSCE. The
beneficiaries’ lists were used to identify the respondents for the interview. Systematic random sampling
technique was applied to select respondents. The first number of the sample was selected randomly
from the population and the rest respondents were chosen by adding the sampling interval on the first
sample and so on.
A total of 420 sample population was selected from all project intervention woredas and towns by using
the following formula (Magnani, 1999):
n= t² x p(1-p)
d²
Where:
n = required sample size
t = confidence level at 95% (standard value of 1.96)
p = The approximate proportion of trained beneficiaries that are expected to be find in the project areas
during the survey ( in this case 50%)
d = margin of error at 5% (standard value of 0.05)
Considering the non-response rate, 10 percent of sample population for possible non-respondents was
added. In order to derive the required sample for each geographical location (woreda) the total sample
size was proportionally divided to each woreda/town. All of the sampled population, however, did not
participate in the survey. Only 84 percent of them were accessed.
The total number of sample population who were selected and interviewed per woreda and town is
presented in Table 1 below:

14
Table 1: Total Number of Respondents Selected and interviewed
3.2 Data Collection Instruments
Both quantitative and qualitative data collection questionnaires were applied to come up with reliable
information that was helpful to measure the achievements in the process of project implementation.
3.2.1 Quantitative Data Collection Method
Quantitative data were collected from beneficiaries using standard questionnaire prepared for this
purpose. The questionnaires comprised both closed and open ended questions. As indicated in the
questionnaire attached as annex all key issues were included in the questionnaire. The questionnaire was
prepared in English and translated into the local language of the study area which is Amharic. Prior to
actual data collection, the developed questionnaire was pre-tested and following pre-test, amendments
were made and the Amharic versions of questionnaire was used to collect data.
A total of 11 (8 males and 3 females) enumerators and five supervisors, who were familiar with the
environmental situation of project intervention woredas, were recruited and trained to collect the data
using the prepared questionnaire.
During data collection and entering to computer data quality control activities were made at all levels in
order to gather reliable information.
Zone Survey
Area/Woreda Selected Interviewed Non-respondent
W/Gojam
Tis- Abay 20 20 -
Adet 30 30 -
Bahirdar 180 120 60
Merawi 31 29 2
Total 261 199 62
South Gondar
Woreta 39 38 1
Dera 60 56 4
East Este 60 60 -
Total 159 154 5
Grand Total 420 353 67

15
3.2.2 Qualitative Data Collection Methods
Focus group discussion and key informant interview guides were used to gather qualitative data in order
to substantiate the information obtained from the quantitative data collected.
i. Focus Group Discussion (FGD)
Focus group discussion guides were used as a tool for collecting primary data regarding the general
nature of the project as well as the perceptions of beneficiaries and stakeholders towards the project
performance by making thorough discussion with selected target groups. A total of 100 individuals
attended the focus group discussions.
ii. Key Informant Interview (KII)
Key informant interview guides were used to gather information on the contribution of the training and
support given to children and youth in transferring them from hazardous work to decent employment;
the relevance and effectiveness of the training for youth who were self employed; the challenges that
constraint the project in offering training and providing other supports, etc. A total of twenty key
informant interviews were held with woreda/town Micro and Small Scale Enterprise Promotion Office,
Woreda finance and economic Offices, training centers and the Officers of NGOs from project
implementing partners as well as SCI program manager at Head Office level.
3.2.3 Secondary Data
To substantiate the reliability of the primary data collected, secondary data were collected from relevant
secondary sources like annual reports of the project implementing partners, midterm review report and
market and economic survey and mapping of training providers.
3.3 Field work organization The data collection teams have made all the necessary preparations every day before they left for the
field. Discussions between the data collectors and supervisors were made every evening on the
challenges they faced each day and mutual understandings were made. Each team checked whether it
held items every day before he/she leaves for the field.
Enough copies of the survey materials copied or prepared
Enough copies of household registration forms
Work plan for each enumerator and supervisor
16
3.4 Limitations of the study Tracer study requires careful preparation, sufficient resources and full participation of all key
stakeholders. During the data collection process, all possible steps were taken to ensure that the results
obtained accurately represented the study outcomes. However, the field data collection faced a number
of limitations in Bahir Dar town. The data collectors’ team in Bahir Dar town was unable to get both
sufficient supports from the staff and actual list of graduates from FSCE office. As a result of this about
60 respondents in Bahir Dar town were unable to reach and get their response, which ultimately may
lead to wrong conclusion of the study as the scientifically calculated and required sample size was not
fulfilled. The document given for the data collector’s team as a list of graduates, which was actually a
payment sheet, was very cumbersome and misleading. When respondents were systematically selected
based on the document given, there was a phenomenon that one graduate was be able to systematically
selected three times, which ultimately distracts the process of the whole data collection in Bahir Dar
town. To overcome this gap, created by FSCE Office from Bahir Dar, the tracer study team extends the
data collection days and deployed more data collectors in Bahir Dar. As a result of this, seven (7) data
collectors were forced to spend one solid day without any work mainly due to poor support and
information given by the FSCE Office from Bahir Dar.

17
4.0 DATA ANALYSIS
4.1 Demographic and Social Profile of Respondents 4.1.1. Age and Sex of Respondents
Age of an individual is an important variable for determining and targeting the appropriate beneficiaries.
The study indicates that the mean age of the respondents was 22 year while the minimum age was 13
years and the maximum was 30 years. Figure 2 shows the distribution of respondents by age and sex. As
the depicted in figure 1, among the total beneficiaries, 90 percent and 79 percent of beneficiaries were
males and females respectively. In total, the majority of (85 percent) respondents were between the ages
of 18 and 25 followed by 12percent of respondents who were aged above 25 years. Small proportions of
respondents (4 percent) were between the age of 13 and 17.. The age distribution of respondents clearly
shows that the project addressed those youth who were within the age group as specified in the project
document..
With respect to gender distribution, the percentage of male and female included in the project areas is
almost similar (50.4percent males and 49.6percent females This finding has implications on the project
targeting efficiency in ensuring the participation women’s in project interventions. From these result, it
is possible to conclude that the project was effective in addressing the targeted beneficiaries.
Figure 2: Percentage distribution of respondents by age and sex
4%
90%
6% 4%
79%
17%
4%
85%
12%
13-17 18-25 Above 25
Male Female Total

18
4.1.2 Educational Status
The respondents were asked their educational level that they had prior to joining the project.
Accordingly, 35 percent and 19 percent of the respondents said that they had attended general secondary
education (Grade 9-10) and second cycle primary education (Grade 5-8) respectively. Besides, about 3
percent of the total beneficiaries had completed preparatory school and 7 percent had exposure in higher
education. About 9 percent of the respondents were illiterate. Figure 3 below shows the education
attainment of the respondents by gender. The level of education of female respondents is relatively
lower than as compared to male respondents. About 14 percent of female respondents were illiterate
before they join the project, while 3 percent of males did not have any exposure to either adult education
or universal primary education. The education attainment for general secondary education is relatively
more for the female beneficiaries (37 percent) than for the male beneficiaries (33 percent). The higher
the education attainment, the less likely that one would find more females as compared to males. This
illustrates that most females are lag behind in terms of education almost all levels and certainly this will
have compounding effects as regards to employment.
Figure 3: Percentage of beneficiaries by educational level and sex
0% 5%
10% 15% 20% 25% 30% 35% 40%
3% 1%
8%
20%
33%
20%
5% 10%
14%
3% 9%
18%
37%
13%
2% 5%
9%
2% 8%
19%
35%
16%
3% 7%
Male Female Total

19
4.1.3. Family Background The target populations of the project are children and youth who come from poor families. The family
background of the respondents is an important indicator that whether the project is targeted the neediest
group or not.
The family background of the respondents was gathered during the study. As clearly shown in Figure 4
about 40 percent of respondents reported that both of their parents are alive. On the other hand, 17
percent of the respondents said that they are living with one of their parents due to separation. Similarly,
26percent of the respondents reported that they are single orphans and they are living with one of their
parents who is currently alive. Lastly 16 percent of the beneficiaries were found double orphan during
the survey and they struggle to get subsistence income to stay alive. It is observed that those children
and youth who are from poor family as well as orphans (single or both) are, most of the time, vulnerable
for social, health and economic problems and would be engaged in hazardous jobs in order to lead their
live.
Figure 4: Family background of beneficiaries
4.1.4 Educational status and employment
The above two variables that is educational attainment and family background of beneficiaries should be
seen together in order to know the performance of the project. Thus, these two variables are jointly
analyzed as follows.
17%
26%
40%
16% Separated parents
Single orphan
Couple parent
Double Orphan

20
Figure 5: Distribution of beneficiaries by family background and educational status
As indicated in figure 5 above, among beneficiaries who attained primary education first and second
cycle 30 percent of them were from separated parents family, 28 percent of them were single orphans,
23 percent of them have couple parents and 24 percent of them were double orphans.
On the other hand, among beneficiaries who came from separated parents family 51 percent of them
completed general secondary education and TVET. Likewise, 40 percent of single orphan, 58 percent of
beneficiaries who have couple parents and 36 percent of double orphans attained general secondary
education and TVET.
These data indicate that the beneficiaries were children and youth, attained some level of education and
have different family background though commonly they came from poor family. Thus, these
beneficiaries are vulnerable to different types of social, health and economic problems due to their age
and living with poor family. Both these factors will push them to be engaged in hazardous business
activities or jobs such as commercial sex work, construction, house maid, etc.
0%
20%
40%
60%
80%
100%
8% 2% 5% 25%
36% 15%
3% 7%
12%
2% 10% 18%
37% 13%
3% 4%
5%
1% 6% 17% 38%
20%
3% 10%
14% 5% 14%
20% 25% 11%
5% 5%
Pe
rce
nta
ge o
f b
en
efi
ciar
ies
Educational attainment
Separated parents Single orphan Couple parent Double orphan

21
The educational attainments of beneficiaries were analyzed in terms of urban and rural areas. It is
apparent that except Bahir Dar town city the other visited project areas were semi-urban areas. Contrary
to Bahir Dar town and Woreta, the majority of beneficiaries of other woredas i.e. Adet (52percent),
Merawi (52percent), Este (49percent), Bahir Dar Zuria (47percent) and Dera (39percent) attained their
general secondary education (Grade 9-10). Among the total beneficiaries in Bahir Dar town 28percent
of them completed their primary education second cycle (Grade 5-8) where as out of the total
beneficiaries is Woreta city 53percent of them attained TVET. This indicates that the beneficiaries
selected from semi-urban areas were attained the highest educational level as compared to those
beneficiaries who were selected from urban area.
From this analysis it is possible to observe that those beneficiaries who attained from primary education
to TVET are highly vulnerable for different socio-economic and health problems because they do not
have supporter or do not get sufficient support from their family due to poverty and they are at their fire
age. Thus, they can be exposed for different harmful practices such as chewing khat, engaged in CSW
and the like. On the other hand, these beneficiaries have the capacity to work whatever type of job they
get because have full labor power. Moreover, these beneficiaries can catch every type of training they
are provided and can be engaged in different job either by themselves or be employed. So, from this
perspective it is possible to say that the implementers could address those youth who are vulnerable for
the aforementioned problems and have the capacity to change their livelihood easily using short term
training provided even if there are some outliers like those youth who graduate from college or
university who were included as beneficiaries in the project. As can be seen in this report, those
beneficiaries who completed their TVET took BBS only for few days and some of them became
entrepreneurs as well as employee of different organizations.
Most of the respondents of key informant interview & FGD discussants stated that the beneficiaries
were economically very poor because they do not have sufficient and sustainable income, unemployed
and had no any kind of participation in every social life and they were in serious economic problem and
being seen as hopeless before they became beneficiaries of the project.
Summary
Eighty five percent of beneficiaries were youth whose age was between the age of 18 and 25, and gender
equality was observed. With regard to educational status the 54 percent of beneficiaries attained primary
education first and second cycle level and 16 percent of beneficiaries attained TVET.

22
With regard to family back ground, 40 percent of beneficiaries lived with while 17 percent of them lived
with one of their parents and 42 percent of them lost one or both of their parents due to different cases.
Among the beneficiaries, 45 percent and 59 percent of them are single and double orphans respectively
and attained primary education in both cycle and general secondary education prior to joining the
project. Among those beneficiaries who attained TVET before they join the project, 24 percent of them
were single and double orphan.
This shows that the beneficiaries were vulnerable to different social, economic and health problems and
as a result they were engaged in hazardous business activities and jobs in order to get their daily bread.
The study reveals that the two project implementing partners were successful in recruiting the right
beneficiaries as per the project objective.
4.2 Training provided to beneficiaries
4.2.1 Types of Training
The types of trainings provided to the respondents are shown in Figure 6. The figure shows that the
majority of respondents 54 percent attended the TVET1, 34 percent took BBS
2, and 10 percent of the
respondents attended the FTC. The percentage of the respondents who did not attend either of the two
types of skill training was 2 percent. This indicates that beneficiaries preferred TVET and then BBS to
other types of trainings..
Figure 6: Percentage of beneficiaries by type of training
1 TVET in this study is defined as technical and vocational trainings provided for a short period of time by private and
government training institutions in order to empower those individuals who were unemployed to be employed or have their own business in the field they are trained. The training does not necessarily pursue the curriculum developed by bureau of education or ministry of education. 2 Basic Business Skill is the type of training that will enable the trainees to be entrepreneurs and be engaged in self business
or employed in other business organizations.
54%
10%
34%
2%
TVET
FTC
BBS
Did not any training

23
4.2.2 Types of training provided by woreda
In fact, the relationship between the attainment of type of training and woreda is also important in
depicting the project performance in administrative perspective. This relationship is shown in the figure
7. The figure shows that in Este (72 percent), Dera (65 percent), Merawi (55 percent) Adet (52 percent)
and in Wereta (50 percent) of the beneficiaries attended TVET. In Bahir Dar town and Tis Abay only
49 percent and 21 percent of the beneficiaries were trained in TVET. The majority of trainees (79
percent) in Tis Abay were trained in BBS where as in other woredas the percentage of beneficiaries who
were trained in BBS were less than fifty percent. With regard to FTC, the highest percentage of
beneficiaries were in Dera (26 percent) followed by, Este (19 percent). Out of the total beneficiaries
only 6 (2 percent) of the beneficiaries did not take any type of training but the reason was not identified.
Figure 7: Percentage of beneficiaries by training type and woreda
4.2.3 Types of training provided by sex and woreda
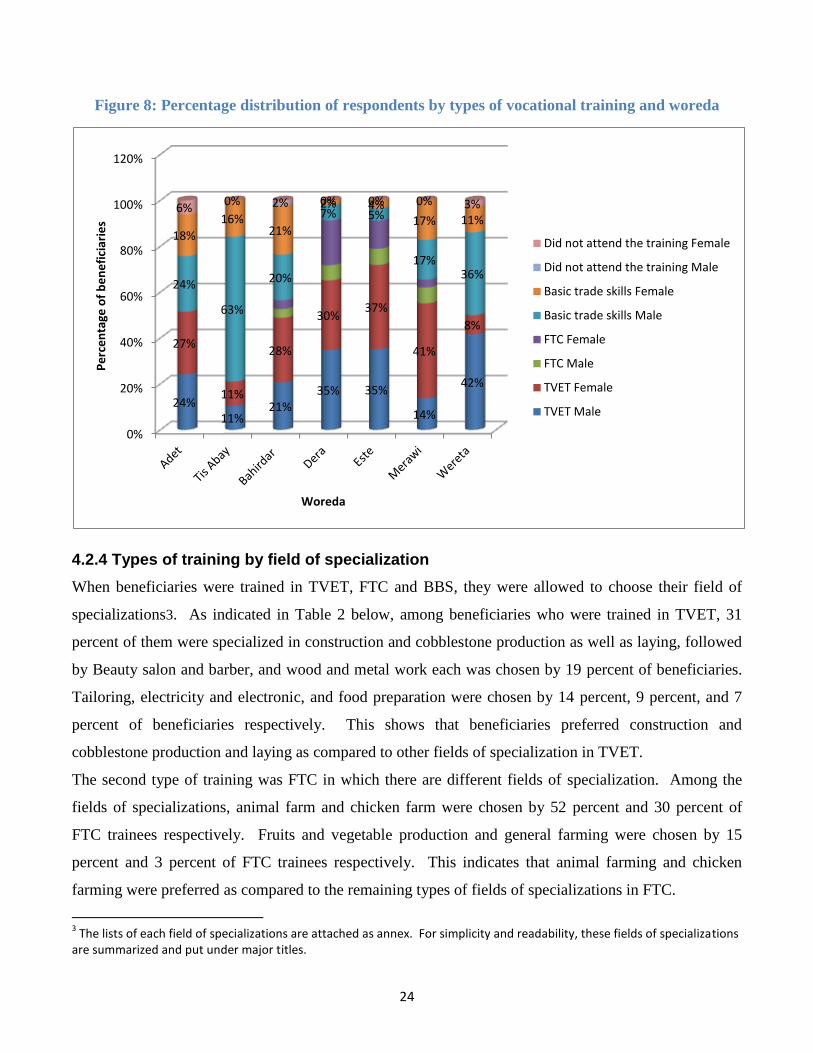
In terms of gender (see figure 8), 26 percent males and 28 percent females took the TVET training
where as 4 percent of male and 6 percent females took the FTC training and 20 percent males and 14
percent females took the BBS.. Very few numbers of both sexes had not received any type of training. It
is also noted that females had got equal opportunities of vocational trainings with their male
counterparts. In project intervention areas perspective, more females were graduated from Adet (27
percent), Bahir Dar (28 percent), Este 57 percent) and Merawi (41 percent) trained in TVET.
0%
20%
40%
60%
80%
100%
120%
Adet Bahirdar Tis Abay Dera Este Merawi Wereta
52% 49%
21%
65% 72%
55% 50%
0% 8%
0%
26% 19%
10%
0%
42% 41%
79%
9% 9%
34%
47%
6% 2% 0% 0% 0% 0% 3%
Pe
rce
nta
ge o
f b
en
efi
ciar
ies
Woredas
Did not attend the training
Basic Business skill
FTC
TVET
24
Figure 8: Percentage distribution of respondents by types of vocational training and woreda
4.2.4 Types of training by field of specialization
When beneficiaries were trained in TVET, FTC and BBS, they were allowed to choose their field of
specializations3. As indicated in Table 2 below, among beneficiaries who were trained in TVET, 31
percent of them were specialized in construction and cobblestone production as well as laying, followed
by Beauty salon and barber, and wood and metal work each was chosen by 19 percent of beneficiaries.
Tailoring, electricity and electronic, and food preparation were chosen by 14 percent, 9 percent, and 7
percent of beneficiaries respectively. This shows that beneficiaries preferred construction and
cobblestone production and laying as compared to other fields of specialization in TVET.
The second type of training was FTC in which there are different fields of specialization. Among the
fields of specializations, animal farm and chicken farm were chosen by 52 percent and 30 percent of
FTC trainees respectively. Fruits and vegetable production and general farming were chosen by 15
percent and 3 percent of FTC trainees respectively. This indicates that animal farming and chicken
farming were preferred as compared to the remaining types of fields of specializations in FTC.
3 The lists of each field of specializations are attached as annex. For simplicity and readability, these fields of specializations
are summarized and put under major titles.
0%
20%
40%
60%
80%
100%
120%
24% 11%
21% 35% 35%
14%
42%
27%
11%
28%
30% 37%
41%
8%
24%
63%
20%
7% 5%
17% 36%
18%
16% 21%
2% 4% 17% 11%
6% 0% 2% 0% 0% 0% 3%
Pe
rce
nta
ge o
f b
en
efi
ciar
ies
Woreda
Did not attend the training Female
Did not attend the training Male
Basic trade skills Female
Basic trade skills Male
FTC Female
FTC Male
TVET Female
TVET Male

25
Basic Business Skill (BBS) was the type of training which was given to all beneficiaries whether they
participated in TVET and FTC training or not. However, those beneficiaries who took BBS training
only were encouraged to know and express the work type that they want to be engaged like the field of
specialization. Among these beneficiaries, 48percent of them were interested to be engaged in cleaning
and waste disposal management followed by those beneficiaries (11percent) who said they were
interested to be engaged in café and restaurant. Of course, 35percent of beneficiaries who took BBS
training only had chosen various types of works which cannot be mentioned here. Only 7percent of
beneficiaries among those who took BBS training only expressed their interest to be engaged in trade.
This analysis shows that the beneficiaries attitudes towards work is changed because cleaning and waste
disposal management jobs were the most despised jobs by the public.
Table 2: Fields of specialization
Field of specialization Percent of
beneficiaries
TVET Trainees
Food preparation 7%
Beauty Salon and Barber 19%
Construction and cobblestone 31%
Electricity and Electronic 9%
Tailoring 14%
Wood and metal work 19%
Total 100%
FTC Trainees
Animal farm 82%
Farm 3%
Fruit and Vegetable 15%
Total 100%
Basic Business Skill
Café and restaurant 11%
Cleaning and Waste disposal
management 48%
Trade 7%
Others 35%
Total 100%

26
4.2.5 Types of training by year of graduation
TVET and Farmers training have been offered in the past two years i.e 2011 to 2012 (see Table 3).
Among the total beneficiaries who were trained in the two years, 35 percent and 65 percent of them
were graduated in 2011 and 2012 respectively in TVET, FTC and BBS. In terms of training field, 34
percent and 66 percent of trainees were graduated in TVET in 2011 and 2012 respectively while 30
percent and 70 percent of beneficiaries were graduated in FTC in the aforementioned two consecutive
years. Moreover, 40 percent and 60 percent of beneficiaries were trained in BBS in 201 and 2012
respectively.
Table 3: Graduated trainees by year
Year of
Graduation TVET FTC
Basic Business
skills
Did not attend
the training Total
2011 34 percent 30 percent 40 percent 1 percent 35percent
2012 66 percent 70 percent 60 percent 1 percent 65percent
Total 100 percent 100 percent 100 percent percent 85percent
4.2.6. Types of training by year gf graduation and woreda
In terms of woreda, (see figure 9) during the aforementioned two years 35 percent of graduates were
from Bahir Dar followed by Dera ( 22 percent) and Este (18 percent )., However, Adet woreda did not
have graduated trainee in 2012. In respect to this, information cannot be obtained. The lowest
percentage of graduated trainees was registered in Tis Abay i.e it could graduate 2 percent, and 1 percent
in 2011,and 2012 respectively. Contrary to these, Bahir Dar , Dera and Este woreda could graduate
large proportion of trainees in the last two consecutive years. As it can be seen in figure 9, the numbers
of graduated trainees were lower than those beneficiaries who were trained and interviewed. The basic
reason for this difference is that those beneficiaries who were trained and completed BBS were not
considered as graduated students.

27
Figure 9: Distribution of trained beneficiaries by year of graduation and woreda
4.2.7 Types of training by duration of training
The duration of training for each type of training is illustrated in figure 10. Among the TVET trainees,
41percent, 17percent, 12percent and 17percent of them were trained for 5-10 days, 10-20 days, 30 days
and 90 days respectively. With regard to FTC trainees the majority of them (91percent) were trained for
5-10 days and only 9percent of them were trained for 10-20 days. Similarly, BBS training was given for
66percent of the beneficiaries for 5-10 days while the remaining 34percent of the beneficiaries
mentioned that they took BBS training for more than 10 days. Three months were allocated for the
TVET trainings such as hair cutting (beautification), tailoring, weaving, metal and wood work,
electronic maintenance and food processing. 70 percent of vocational and technical graduates attended
their training for less than or equal to a month while 30percent of the trainees attended their training
from 45 days to above 3 months. The training of cobble stone making has offered from 25 to 45 days.
In Bahir Dar town, the training of cobble stone making had given for 25 days, whereas 45 days in
Woreta Woreda. The farmers training courses were very short (less than 29 days). The training
concentrated only on one type of farming activity for each beneficiary.
9% 2%
31%
10% 17%
3%
28%
100%
0% 1%
37%
29%
19%
4% 10%
100%
3% 1%
35%
22% 18%
4%
16%
100%
0%
10%
20%
30%
40%
50%
60%
70%
80%
90%
100%
Adet Tis Abay Bahirdar Zuria
Dera Estie Merawi Woreta Total
pe
rce
nta
ge o
f b
en
efi
ciai
res
Woredas
2011
2012
Total

28
Figure 10: Training durations for TVET, FTC and BBS
Summary
Among beneficiaries 54 percent and 34 percent of them were trained in TVET and BBS. Though all
trainings were provided in all targeted woredas, 72 percent of beneficiaries from Este woreda, 79
percent of beneficiaries from Tis Abay Woreda and 26 percent of beneficiaries from Dera woreda were
trained in TVET, BBS and FTC respectively.
With regard to sex composition, 52 percent of males and 48 percent females were trained in TVET.
Moreover, 39 percent of males and 61 percent females were trained in FTC while 59 percent of males
and 41 percent of females were trained in BBS.
Among those beneficiaries who were trained in TVET, 31 percent of them were specialized in
construction and cobblestone, where 19 percent of them were specialized in beauty salon and wood and
metal work respectively. On the other hand, among beneficiaries who were trained in FTC, 82 percent
of them were specialized in animal farm. Cleaning and waste disposal management was chosen by 48
percent of those beneficiaries who were trained in BBS.
The majority of (65 percent) beneficiaries were graduated in 2012 and most of them were from Bahir
Dar town followed from Dera woreda. Most of the trainings were provided for 5-10 days.
41%
17% 12%
5%
17%
9%
91%
9%
0% 0% 0% 0%
66%
9% 5% 3% 6%
9%
0%
10%
20%
30%
40%
50%
60%
70%
80%
90%
100%
5-10 days 10-20 days 30 days 45 days 90 days 91 days and above
Pe
rce
nta
ge o
f b
en
efi
ciar
ies
Training duration
TVET
FTC
BBS

29
The study indicates that the trainings were provided in all woredas though there was variation among
woredas and both males and females were equally participated in all trainings. Among the field of
specializations, construction, beauty salon, animal farming and cleaning and waste disposal management
were the most chosen field of specialization. It was also observed that the trainings were given for short
times.
In providing training, the two project implementing partners were successful even if there are few
individuals who did not take training prior to getting support.
4.3. Perceptions of beneficiaries 4.3.1. Perceptions of beneficiaries for each type of training
Beneficiaries were asked to express their perception regarding the TVET and FTC training they took.
As clearly shown in figure 11 below, 67 percent of the respondents said that the training duration was
enough while 11 percent of beneficiaries said the training duration was more than enough. However, 22
percent of beneficiaries complained that the time duration allocated for TVET and FTC trainings was
not enough.
Figure 11: Perception of beneficiaries on the duration of TVET and FTC trainings
4.3.2. Perception of beneficiaries on the importance of TVET and FTC trainings
In addition to the duration of the trainings, beneficiaries were asked whether the TVET and FTC
trainings they took were important or not. The perception results of beneficiaries are shown in figure 12
below. As indicated in the figure 12, the majority (81 percent) of beneficiaries confirmed that the
22%
67%
11%
Not enough
Enough
More than enough

30
trainings they took were important. When 17 percent of beneficiaries said the trainings were somewhat
important, only 2 percent of beneficiaries complained that the trainings were not important.
Figure 12: Perception of beneficiaries on the importance of TVET and FTC trainings
4.3.3. Perception of beneficiaries by type of skills
The above data were disaggregated in terms of the types of skills. As indicated in figure 13 below,
above half percent of the TVET trainees said that the TVET was important to them. Following this, 35
percent of TVET trainees mentioned that the training was very important. Only 12 percent and 3
percent of TVET trainees said that the TVET training they took was somewhat important and not
important respectively.
With regard to FTC trainees 46 percent of them said the FTC training was some what important while
34 percent of the FTC trainees said the training was important and only 20 percent of the trainees said
that the FTC training was very important.
Among those trainees who took BBS, 82 percent of the trainees said that the BBS training was important
and very important.
2%
17%
45%
36%
81%
Not important
Somewhat important
Important
Very important

31
Figure 13: Perception of beneficiaries regarding the importance of the training
4.3.4. Reasons of beneficiaries who said the TVET and FTC trainings were not important
Those beneficiaries who said the TVET and FTC trainings were somewhat important or not important
were asked further to mention their reasons why they respond like this.
As indicated in figure 14, 45 percent of them said that the trainings were not important because the
training time duration was too short while 32 percent of beneficiaries mentioned that the trainings were
not important because the trainings more focused on theories rather than focusing on practice. Fourteen
percent of beneficiaries also said that the reason why they said the trainings were not important was the
trainings did not include practices sufficiently.
When these data are disaggregated in to the types of skills, 52 percent of the TVET trainees said that the
trainings were too short while 70 percent of FTC trainees said that the trainings were focused on theory
instead of practice and 51 percent of BBS trainees said that the trainings were too short.
3% 2%
12%
46%
16%
51%
34%
41%
35%
20%
41%
0%
10%
20%
30%
40%
50%
60%
TVET FTC BasicBusiness skills
Pe
rce
nta
ge o
f b
en
efi
ciar
ies
Types of training
Not important
Somewhat important
Important
Very important

32
Figure 14: Responses of beneficiaries who said the TVET and FTC trainings were not important
Percentage of beneficiaries
4.3.5 Perception of beneficiaries regarding the extent of TVET and FTC in developing skill
Those beneficiaries who said the TVET and FTC training were important were further asked regarding
the extent of these trainings in developing their skills. As clearly shown in figure 15 below, 45 percent
of beneficiaries said that the trainings develop their vocational and technical skills to high extent. But
54 percent of beneficiaries said that the trainings develop their vocational and technical skills to some
what extent and sufficiently extent. Only 2 percent of the beneficiaries said that the trainings did not
develop their technical and vocational skill at all.
21% 18%
52%
8%
70%
20%
10%
0%
27%
5%
51%
16%
0%
20%
40%
60%
80%
100%
120%
140%
The trainings were focus on the
theories
The trainings did not include enough
practices
They were too short Others
Pe
rce
nta
ge o
f b
en
efi
ciar
ies
Perception of beneficiaries
BasicBusiness skills
FTC
TVET

33
Figure 15: Extent of the TVET and FTC to develop skills
4.3.6 Perception of beneficiaries by type of training
The above perception was further analyzed in terms of types of training and the result is shown below.
As indicated in figure 14, among the TVET trainees, 66 percent of them said the TVET training
sufficiently and to high extent the training developed their skills. However, 34 percent of them said that
the training develop their skill to some extent and not at all.
Among the FTC trainees, 87 percent of them said that the training sufficiently ad to high extent
developed their skills. Only 13 percent of the trainees said that the training develop their skill to some
extent.
From BSS trainees, 77 percent of them said that the training sufficiently and to high extent develops
their skill while 23 percent of the trainees said that the training they took develop their skill to some
extent and not at all.
2%
27%
27%
45%
Not all
To some extent
Sufficiently
To high extent

34
Figure 16: Perception of beneficiaries regarding the extent the trainings to develop skills
Summary
Most of (67 percent) beneficiaries stated that the duration of the training was more than enough and 81
percent of the beneficiaries expressed their feeling regarding the importance of the training by saying the
training was very important and important. Their feeling was asked based on the types of the training
they took and 86 percent, 54 percent and 82 percent of TVET, FTC and BBS trainers said that the
training they took was important respectively. However, these trainees explained their complaint in
accordance to their training type. Accordingly, 70 percent of FTC trainees said the training focused on
theories only and 52 percent of TVET and 51 percent of BBS trainees said that the training was too
short.
Even if trainees believed the trainings were important and useful, in terms of quality, due to time
shortage and focused on theories only, it is possible to say that the training was not as such effective as
expected and the two implementing partners should take into account this situation.
4.4 Apprenticeship Training
Apprenticeship is a training and employment program involving a contract between an apprentice and an
employer on an approved apprentice able occupation. Generally, it aims to provide a mechanism that
will ensure availability of qualified skilled workers based on industry requirements. The period of
apprenticeship covers a minimum of four months and a maximum of six months.
2% 2%
32%
13%
21%
27%
31%
26%
39%
56%
51%
0%
10%
20%
30%
40%
50%
60%
TVET FTC Basic Business skills
Pe
rce
nta
ge o
f b
en
efi
ciar
ies
Types of skills
Not all
To some extent
Sufficiently
To high extent

35
Based on this concept, apprenticeship was provided to beneficiaries in collaboration with project
implementers and different organizations.
Apprenticeship training was provided by the project in order to enable the trainees to grasp job skills at
the work places. As indicated in Table 4, Out of 342 beneficiaries who were asked whether they took
apprenticeship, about 58 percent of them responded that they took apprenticeship where as 42 percent of
the interviewed beneficiaries did not take apprenticeship. Among the beneficiaries who took
apprenticeship, 48 percent of them were males while 52 percent of them were females. In skills training
perspective, about 57 percent of the beneficiaries who took apprenticeship were TVET graduates where
as about 13 percent and 29 percent of the beneficiaries were trained in FTC and BBSs respectively. The
apprenticeship was attended in public/government and private organizations. About 58 percent of
beneficiaries responded that they attended their apprenticeship in government organization while the
remains attended their apprenticeship in private organization. The duration of the apprenticeship ranges
from a few number of days to 3 months. More than 3/4th of apprenticeship attendants attended from a
few numbers of days to a month. Those who attended their apprenticeship above a month were 25
percent. Allowing apprenticeship in government, and private organizations implies that, since these
organizations are potential employers of these youth, these organization gave recognition to the
beneficiary as well as to the project.,
Table 4: Apprenticeship attended by skill of training
Type of skill
training
Attended apprenticeship
Yes No
Male Female Total Male Female Total
TVET 54 59 113 38 37 75
FTC 8 18 26 5 4 9
BBSs 33 25 58 37 24 61
Total 95 102 197 80 65 145
Summary
Most of (58 percent) beneficiaries attended apprenticeship and of these, 57 percent of them were TVET
trainees followed by BBS trainees that account 29 percent. It is known that apprenticeship is one way of
creating communication forum with government and non-government organization and promoting these
beneficiaries to get job opportunity after they graduate. In this regard though the two project
implementing partners were somewhat successful in creating opportunity for apprenticeship, they have
to work hard for the future.

36
4.5 Employment Status of Respondents
For this study, self employment is defined as working in own business, salaried employment is defined
as being employee of any government or non-government organization and get salary for work
performed as per the agreement entered between the employee and employer and unemployment is
defined as not being engaged in own business or salary employed.
4.5.1 Types of employments
Based on the above mentioned definitions, respondents were asked to indicate whether they are
currently self-employed, salary employed or unemployed and looking for employment. The general
employment status of respondents is shown in Figure 17 This figure shows that 68 percent of the
respondents were self employed while 13 percent of the respondents were salary employed. The rest of
respondents were unemployed and looking for a job.
`
Figure 17: Distribution of beneficiaries by employment status
4.5.2 Salary employed by type of employers and employments
As indicated in figure 18 government institutions, private institutions, NGOs and cooperative provided
employment opportunities for 14 percents, 32percent, 3percent and 51percent of beneficiaries who were
trained in TVET, FTC and BSS. Among those beneficiaries who could be hired in fixed term4
employment, 73 percent of them were hired by cooperatives followed by government and private
institutions each could hire 14 percent of beneficiaries. With regard to temporary employment5, the
4 Fixed term refers to a job offered to perform a specific job
5 Temporary employment refers to a job offered for limited time
68%
13%
19%
Self employed Salary employed Unemployed

37
private institutions took the lead by hiring 67 percent of beneficiaries among those beneficiaries who
were employed as temporary employees. Government, NGOs and cooperative institutions each could
hire 11percent percent of beneficiaries. Private institutions and cooperatives each could hire 38 percent
of beneficiaries while government institutions could hire 25 percent of beneficiaries among those
beneficiaries who were offered permanent employment6.
Figure 18: Type of employment by employers
4.5.3 Salary employed by type of skill, employer and employment
The above explained salaried employees were seen in terms of the type of skills they obtained in
addition to the type of their employers and type of employment. As indicated in Table 5 below, out of
the total TVET graduates only 36 percent of them obtained permanent employment opportunities while
52 percent and 12 percent of them obtained temporary and fixed term employment opportunities
respectively. The TVET graduates have got permanent employment opportunities from government and
cooperative institutions that each of them employed 44 percent of TVET graduates. The private
institutions provided permanent employment opportunities for only 11 percent of TVET graduates. On
the other hand, the private institutions took the lion share by providing temporary and fixed term
employment opportunities for 69 and 67 percent of TVET graduates respectively.
6 Permanent job is a job offered for unlimited time
0%
10%
20%
30%
40%
50%
60%
70%
80%
90%
100%
Government institution
Private institution
NGO Cooperatives
14%
14%
0%
73%
11% 67% 11% 11%
25% 38%
0%
38%
14% 32% 3% 51%
Pe
rce
nta
ge o
f b
en
efi
ciar
ies
em
plo
yed
Employers
Total
Fixed term
Temporary employee
Permanent employee

38
The FTC graduates were hired as permanent and fixed term employee. The private institutions and
cooperatives each hired 100 percent of FTC graduates as permanent employee and in fixed term
respectively (Refer Table 5).
As indicated in table 5, 76 percent of BSS trainees were hired as permanent employee followed by
temporary employment and fixed term employment each accounted 12 percent. In terms of employer,
cooperatives hired the majority (92percent) of BSS trainees as permanent employee while private
institutions could hire 75 percent and 50 percent of BSS trainees as temporary and fixed term employee
respectively( Refer Table 5).
This analysis clearly shows us that the type of employment is determined by the type of employment
offered to beneficiaries and the type of employer as well as the skill who is trained
Table 5: Salary employed by type of skill, employers and employments
Type of skill Type of employer
Type of employment
Permanent
employee
Temporary
employee
Fixed term Total
TVET
Government
institution
4
(44percent) 1 (8percent) 1(33percent)
6
(24percent)
Private institution
1
(11percent)
9
(69percent)
2
(67percent)
12
(48percent)
NGO 0 1 (8percent) 0 1 (4percent)
Cooperatives
4
(44percent) 2(15percent) 0
6
(24percent)
Total
9
(36percent)
13
(52percent)
3
(12percent)
25
(100percent)
FTC
Private institution
1
(100percent)
0 1
(50percent)
Cooperatives 0
1
(100percent)
1
(50percent)
Total
1
(50percent) 0
1
(50percent)
2
(100percent)
Basic Business
Skill
Government
institution 0 1(25percent)
1
(25percent) 2 (6percent)
Private institution 2 (8percent)
3
(75percent)
1
(25percent)
6
(18percent)
Cooperatives
23
(92percent) 0
2
(50percent)
25
(76percent)
Total
25
(76percent)
4
(12percent)
4
(12percent)
33
(100percent)

39
Type of skill Type of employer
Type of employment
Permanent
employee
Temporary
employee
Fixed term Total
G. Total
35
(58percent)
17
(28percent)
8
(13percent)
60
(100percent)
4.5.4. Salaried employees by sex, and sage
Employment status of graduates is disaggregated by age and sex to investigate the differences in the
employment opportunity between the two sexes among their ages. Out of the interviewed beneficiaries,
it was found that 62 (48 percent males and 52 percent females) of them were salary employed. As shown
in Figure 19, among salaried employed 26 percent (30percent males and 22 females) of them were
between 16-20 ages, 39 percent (53 percent males and 25 percent females) of them were between 21-25
ages, and 31 percent (17 percent males and 44 percent females) of them were between 26-30 age. Out
of the total salaried employees, 58 percent (33 percent males and 81percent females) were employed as
permanent employees, 29 percent (43 males and 16 females) of them obtained temporary employment,
while 13 percent of (23 percent males and 3 percent females) them provided fixed term employment.
Among permanent employees who obtained permanent employment, 17 percent (10percent male and
19percent females) were between 16-20 age, 39 percent (80percent males and 23percent females) were
found between 21-25 age and other 39 percent (10percent male and 50 females) of them were between
26-30 age.
Out of those beneficiaries who were provided temporary employment, 50 percent (54percent males and
40percent females), 28 percent (23percent male and 40percent female) and 17 percent (23percent male)
were between the age of 16-20, 21-25 and 26-30 respectively.
With regard to fixed term employment, 13percent (14percent male), 63 percent (71percent male) and 25
percent (14percent male and 100percent females) of them were between 16-20, 21-25, and 26-30 years
old respectively.
These data show that among youths whose age is between 16-20, most of them were employed in
temporary job where as most males whose age is between 21-25 were employed as permanent and fixed
term employees and it is observed that no female whose age is between 26-30 was not employed as
temporary employee. Contrary to this, most females whose age is between 26-30 were employed in
permanent and fixed term employment.

40
Figure 19: Salaried employees by age and sex
4.5.5 Self employment by sex and age
Out of 237 beneficiaries who were engaged in self employment arrangement, 28percent of them were
engaged in individual business while 72 percent respondents were engaged in group business. As
illustrates in Figure 20, 41 percents females were engaged in group business more than their male
counterparts which was 30 percent. On the contrary, 16 percent of males were engaged in individual
businesses while females who were engaged in similar type of self employment was only 13 percent..
With respect to age wise, only among youths whose age was between 15 and 19, only 23 percent of
them were self employed of these 36 percent were engaged in self-employment individually where as 64
percent were engaged in self employment in group business. Of those youths whose age was between
20-24, 59 percent of them were engaged in self employed. This comprises 29 percent youths who were
individually self employed and 71 percent were self employed in group business. Only fourteen percent
youths whose age ranges 25 to 29 were self employed and out of these 18 percent of youths were self
employed individually and 82 percent of youth were self employed in group business.
Figure 20 further indicates self employments in terms of sex. Accordingly, the proportion of male and
female among youths whose age is between 15 and 19 and engaged in individual self employment was
10%
19%
54%
40%
14%
30%
22% 26%
80%
23% 23%
40%
71%
53%
25%
39%
10%
50%
23%
14%
100%
17%
44%
31%
0%
20%
40%
60%
80%
100%
120%
Male Female Male Female Male Female Male Female Total
Permanent employee
Temporary employee
Fixed Term Total
Pe
rce
nta
ge o
f re
spo
nd
en
ts
sex and type of employment
16-20
21-25
26-30
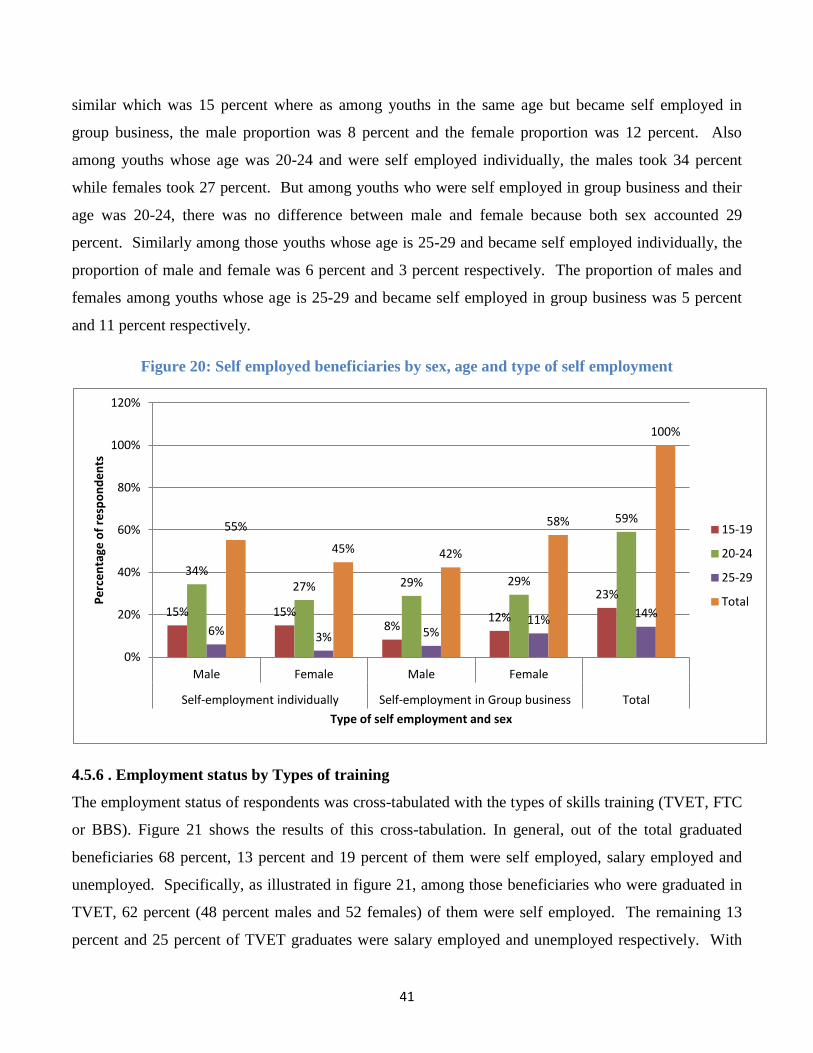
41
similar which was 15 percent where as among youths in the same age but became self employed in
group business, the male proportion was 8 percent and the female proportion was 12 percent. Also
among youths whose age was 20-24 and were self employed individually, the males took 34 percent
while females took 27 percent. But among youths who were self employed in group business and their
age was 20-24, there was no difference between male and female because both sex accounted 29
percent. Similarly among those youths whose age is 25-29 and became self employed individually, the
proportion of male and female was 6 percent and 3 percent respectively. The proportion of males and
females among youths whose age is 25-29 and became self employed in group business was 5 percent
and 11 percent respectively.
Figure 20: Self employed beneficiaries by sex, age and type of self employment
4.5.6 . Employment status by Types of training
The employment status of respondents was cross-tabulated with the types of skills training (TVET, FTC
or BBS). Figure 21 shows the results of this cross-tabulation. In general, out of the total graduated
beneficiaries 68 percent, 13 percent and 19 percent of them were self employed, salary employed and
unemployed. Specifically, as illustrated in figure 21, among those beneficiaries who were graduated in
TVET, 62 percent (48 percent males and 52 females) of them were self employed. The remaining 13
percent and 25 percent of TVET graduates were salary employed and unemployed respectively. With
15% 15% 8%
12%
23%
34% 27% 29% 29%
59%
6% 3% 5% 11%
14%
55%
45% 42%
58%
100%
0%
20%
40%
60%
80%
100%
120%
Male Female Male Female
Self-employment individually Self-employment in Group business Total
Pe
rce
nta
ge o
f re
spo
nd
en
ts
Type of self employment and sex
15-19
20-24
25-29
Total

42
respect to FTC graduates, 97 percent of them were self employed. Those beneficiaries who were trained
in BSS, 69 percent of them became self employed, 16 percent and 15 percent of them were salary
employed and unemployed respectively. Very few (6) beneficiaries did not attended any training for
unknown reasons but 67 percent of them were able to get job.
Figure 21: Employment status by training type
The above data were further disaggregated to woredas where beneficiaries live in order to see the
difference between urban and rural, if any. As clearly indicated in Table 6 above, in Bahir Dar self
employment is dominant. Particularly those beneficiaries who were trained in TVET and BSS could be
engaged in their own business. Similarly, in Bahir dar many beneficiaries could be employed by others
especially those beneficiaries who were trained in TVET were employed by other business
organizations. On the other hand, unemployment in Bahir dar is higher as compared to other woreda.
Those beneficiaries who were living Dera and Este woredas and trained in TVET could be self
employed but FTC graduates were hired by other organizations. This shows that there is no significant
difference between rural and urban cities in terms of the beneficiaries engagement.
0%
20%
40%
60%
80%
100%
120%
TVET FTC
Basic Business
Skills
Did not attend the
training
Total
62%
97%
69% 67% 68%
13%
0%
16% 17%
13%
25% 3%
15% 17% 19%
Pe
rce
nta
ge o
f re
spo
nd
en
ts
Type of employment and sex
Unemployed Total
Salary employed Total
Self employed Total
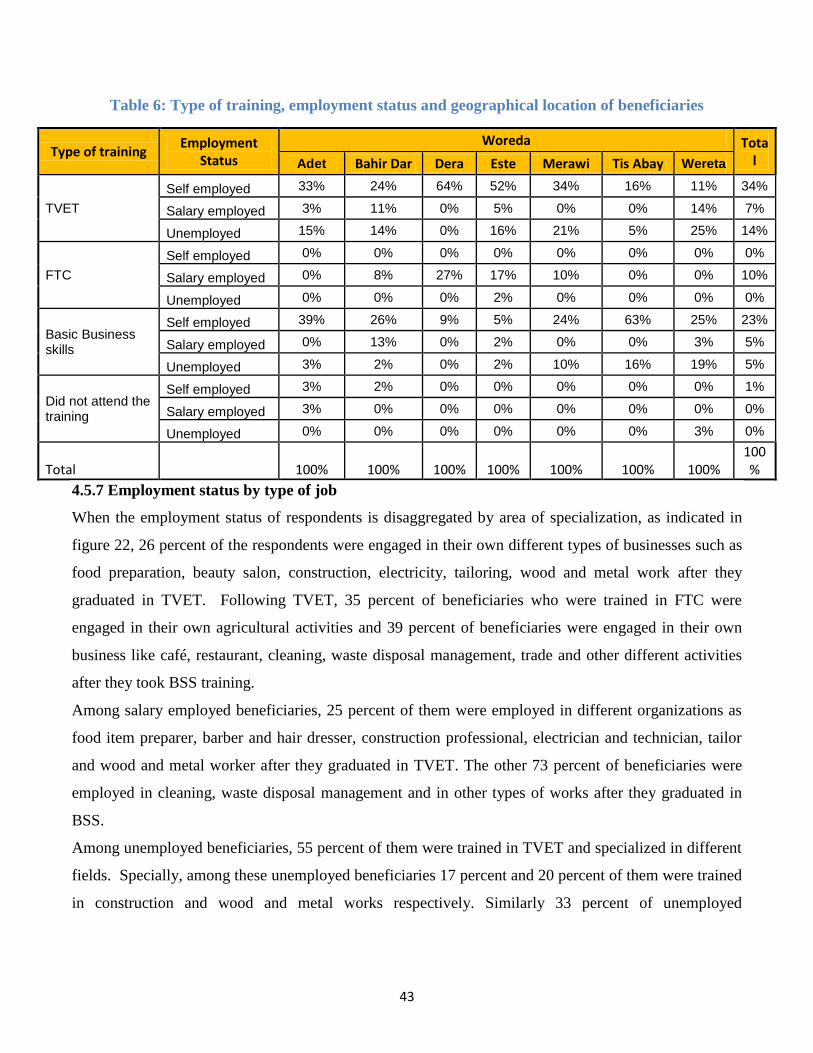
43
Table 6: Type of training, employment status and geographical location of beneficiaries
Type of training Employment
Status
Woreda Total Adet Bahir Dar Dera Este Merawi Tis Abay Wereta
TVET
Self employed 33% 24% 64% 52% 34% 16% 11% 34%
Salary employed 3% 11% 0% 5% 0% 0% 14% 7%
Unemployed 15% 14% 0% 16% 21% 5% 25% 14%
FTC
Self employed 0% 0% 0% 0% 0% 0% 0% 0%
Salary employed 0% 8% 27% 17% 10% 0% 0% 10%
Unemployed 0% 0% 0% 2% 0% 0% 0% 0%
Basic Business skills
Self employed 39% 26% 9% 5% 24% 63% 25% 23%
Salary employed 0% 13% 0% 2% 0% 0% 3% 5%
Unemployed 3% 2% 0% 2% 10% 16% 19% 5%
Did not attend the training
Self employed 3% 2% 0% 0% 0% 0% 0% 1%
Salary employed 3% 0% 0% 0% 0% 0% 0% 0%
Unemployed 0% 0% 0% 0% 0% 0% 3% 0%
Total 100% 100% 100% 100% 100% 100% 100% 100%
4.5.7 Employment status by type of job
When the employment status of respondents is disaggregated by area of specialization, as indicated in
figure 22, 26 percent of the respondents were engaged in their own different types of businesses such as
food preparation, beauty salon, construction, electricity, tailoring, wood and metal work after they
graduated in TVET. Following TVET, 35 percent of beneficiaries who were trained in FTC were
engaged in their own agricultural activities and 39 percent of beneficiaries were engaged in their own
business like café, restaurant, cleaning, waste disposal management, trade and other different activities
after they took BSS training.
Among salary employed beneficiaries, 25 percent of them were employed in different organizations as
food item preparer, barber and hair dresser, construction professional, electrician and technician, tailor
and wood and metal worker after they graduated in TVET. The other 73 percent of beneficiaries were
employed in cleaning, waste disposal management and in other types of works after they graduated in
BSS.
Among unemployed beneficiaries, 55 percent of them were trained in TVET and specialized in different
fields. Specially, among these unemployed beneficiaries 17 percent and 20 percent of them were trained
in construction and wood and metal works respectively. Similarly 33 percent of unemployed

44
beneficiaries were trained in BSS that includes 11 percent of the beneficiaries were trained in cleaning
and waste disposal management, and 17 percent were trained in different activities.
These imply that some training were saturated in the market and some of the fields require huge start up
capital to establish business.
Figure 22: Employment status by field specialization
Figure 23 shows the disaggregation of area of specialization by sex and employment status. The figure
shows that among the total respondents 38 percent of males and 29 percent of females were self
employee and 4 percent of males and 9 percent females were salaried employees. The unemployed
beneficiaries were 7 percent males and 13 percent females.
Among the self employed beneficiaries, 35 percent of males and 26 percent of females were engaged in
different businesses based on the TVET training they took. In addition to this, 32 percent of males and
34 percent of females took BSS training and became self employees in their own businesses based on
their area of interest. Furthermore, 33 percent of males and 39 percent of females were trained in FTC
and they became self employees in the field they graduated.
Those beneficiaries who were trained in TVET, FTC and TVET were salaried employees of different
organizations. Accordingly, 73 percent of males and 16 percent of females were trained in TVET and
they were hired in different organizations. Among different fields of specialization they were engaged
particularly for male graduates electric and electronic, and wood and metal work took the lion shares.
3% 8%
1% 4% 6%
4%
3%
10% 3%
35% 23%
2% 10%
2%
7% 2%
2%
0%
61%
0%
0% 12%
2% 8%
17%
2%
6% 20%
0%
11%
5% 13% 17%
3% 8% 4% 4% 6% 7% 2%
16% 3% 26% 21%
0% 10% 20% 30% 40% 50% 60% 70% 80% 90%
100%
Pe
rce
nta
ge o
f re
spo
nd
en
ts
Field of specialization
Total
Unemployed
Salary employed
Self employed

45
Twenty seven percent of males and 84 percent of females who were trained in BSS were employed in
different business organizations.
Contrary to the above facts, 30 percent of males and 71 percent of females who were trained in different
fields of specialization of TVET became unemployed. Among different fields of specialization for
which job was not obtained, wood and metal work took the lion share. Similarly, 56 percent of males
and 17 percent of females who were trained in BSS and had idea in different business did not get job in
the field they were interested.
Among the fields of specialization in which male beneficiaries did not get job were cleaning, laundry
and waste disposal management (30percent) followed by wood and metal work (22percent). This is
probably due to the fact that there were no employment opportunities to be employed and may ask large
amount of money for startup capital. On the other hand there are fields of specializations in which
female beneficiaries could not get job. These filed of specializations were wood and metal work
(27percent) and construction and cobblestone (22percent). The reasons for not getting job could be the
same as mentioned above.

46
Figure 23: Percentage of beneficiaries by sex, field of specialization and employment status
4.5.8 Employment status by geographical location
The relationship between employment status and geographical location is important in establishing the
spatial location of jobs. As indicated in Figure 24, self employment is the dominant employment status
as compared to salary employed in all woredas. However, the highest self employment is observed in
Tis Abay (79percent), Adet (76percent), and Dera (73percent). On the other hand, the highest numbers
of salary employed respondents were found in Bahir Dar town (32percent) and Este (24percent), (See
Figure 24). The highest number of unemployed respondents was found in Woreta (47percent) and
Merawi (31percent).
The type of field of specializations in which beneficiaries could not get job were identified by location.
Accordingly, in Adet woreda, one female who was trained in tailor, three males who were trained in
wood and metal work and other one male and one female beneficiary who took BBS could not get job.
In Bahir Dar town also four females beneficiaries who were trained barber and hair dressing, nine
females who were trained in cobblestone, one female who was trained in garment, one male who was
trained in wood and metal work as well as two females and 4 males who took BBS training, totally 18
0%
10%
20%
30%
40%
50%
60%
70%
80%
90%
100%
Male Female Male Female Male Female
Self employed Salary employed
Unemployed
2% 6% 7% 4% 8%
7% 7% 9%
9%
16% 2%
3%
4%
22% 3%
3%
33%
0%
4%
2%
9%
3%
9%
5%
27%
22%
27%
10%
12%
78%
30% 2%
6%
4%
33% 39% 13%
11%
17% 13%
20%
6%
26%
13%
Pe
rce
nta
ge o
f re
spo
nd
en
ts
Sex and employment status
Others (Bicycle rent, pool house, dstv, acadmic training, etc) Agriculture
Trade
Cleaning, Laundry, waste disposal mgt and shoe shine Café, Restaurant and selling of bread and tea Wood and metal work
Tailoring,garment, embriodary
Electricity and Electronic
Construction and cobbllestone
Beauty Salon and Barber
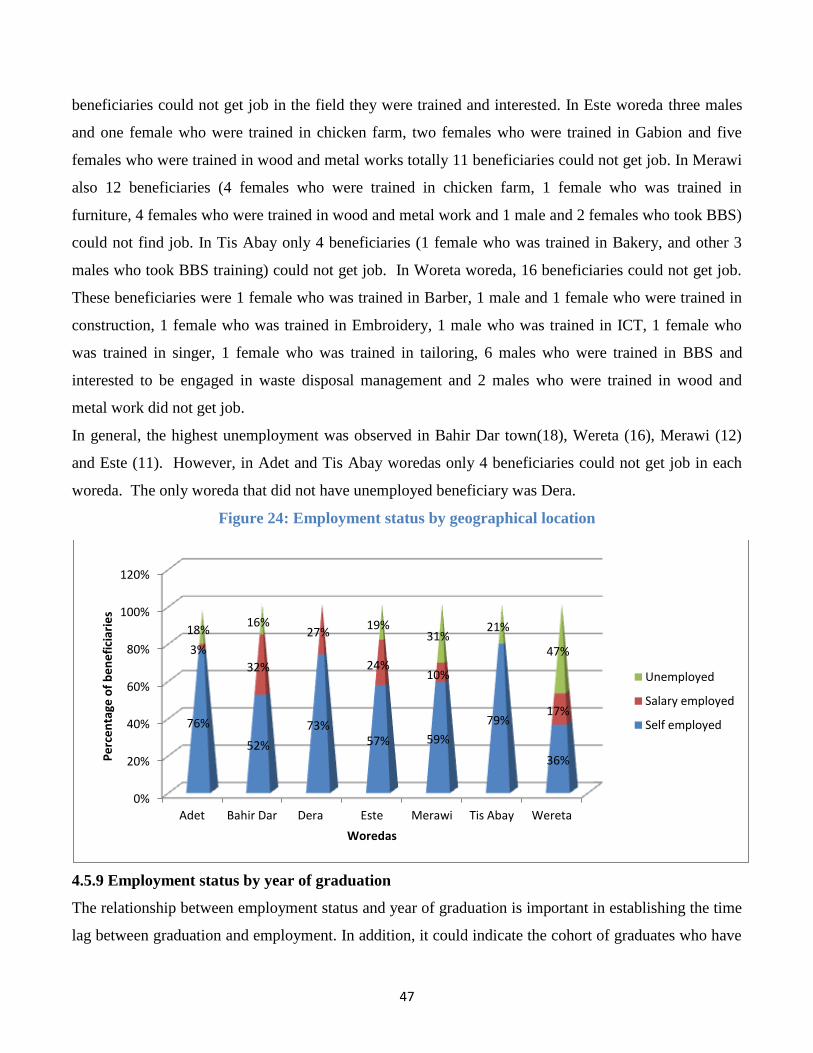
47
beneficiaries could not get job in the field they were trained and interested. In Este woreda three males
and one female who were trained in chicken farm, two females who were trained in Gabion and five
females who were trained in wood and metal works totally 11 beneficiaries could not get job. In Merawi
also 12 beneficiaries (4 females who were trained in chicken farm, 1 female who was trained in
furniture, 4 females who were trained in wood and metal work and 1 male and 2 females who took BBS)
could not find job. In Tis Abay only 4 beneficiaries (1 female who was trained in Bakery, and other 3
males who took BBS training) could not get job. In Woreta woreda, 16 beneficiaries could not get job.
These beneficiaries were 1 female who was trained in Barber, 1 male and 1 female who were trained in
construction, 1 female who was trained in Embroidery, 1 male who was trained in ICT, 1 female who
was trained in singer, 1 female who was trained in tailoring, 6 males who were trained in BBS and
interested to be engaged in waste disposal management and 2 males who were trained in wood and
metal work did not get job.
In general, the highest unemployment was observed in Bahir Dar town(18), Wereta (16), Merawi (12)
and Este (11). However, in Adet and Tis Abay woredas only 4 beneficiaries could not get job in each
woreda. The only woreda that did not have unemployed beneficiary was Dera.
Figure 24: Employment status by geographical location
4.5.9 Employment status by year of graduation
The relationship between employment status and year of graduation is important in establishing the time
lag between graduation and employment. In addition, it could indicate the cohort of graduates who have
0%
20%
40%
60%
80%
100%
120%
Adet Bahir Dar Dera Este Merawi Tis Abay Wereta
76%
52%
73% 57% 59%
79%
36%
3%
32%
27%
24% 10%
17%
18% 16% 19%
31% 21%
47%
Pe
rce
nta
ge o
f b
en
efi
ciar
ies
Woredas
Unemployed
Salary employed
Self employed

48
stayed longer on the employment queue. Table 7 shows employment status of graduates by year of
graduation. As indicated in the table below, among those trainees who graduated in 2011 & 2012
76percent and 72 percent of them were self employed while 7 percent and 8 percent of them were salary
employed. Moreover, among these trainees, 17 percent and 22 percent of them were unemployed.
Table 7: Percentage distribution of respondents by year of graduation and employment status
Types of
employment
Year of graduation Total
2011 2012
No Percent No Percent No Percent
Self employed 44 76 75 70 119 72
Salary employed 4 7 8 8 12 7
Unemployed 10 17 24 22 34 21
Total 58 100 107 100 165 100percent
Summary
Among the trained beneficiaries 68 percent of them were self employed while 19 percent and 13 percent
of them were employed as salary employees and unemployed respectively. Very few beneficiaries (63)
were employed as permanent (59 percent), temporary (29 percent) and fixed term (13 percent)
employees. The majority of permanent, temporary and fixed term employees were employed by
cooperatives and private organizations. The numbers of beneficiaries employed in government
organizations are few.
The salaried employment was analyzed in terms of training type and it is found that among those
beneficiaries who were trained in TVET, most of (69 percent) them were employed in private
institution as temporary employees, a person trained in FTC was employed in private institution as
permanent employee and 75 percent of BBS trainees were employed in private institution as temporary
employee.
In all types of salaried employment, males whose age was between 21 and 25 took the higher proportion
in the three employment types but females whose age was between 26 and 30 obtained employment
opportunity as compared to females who were below the aforementioned age. Those youth whose age
was between 16 and20 obtained little employment opportunities as compared to other youth whose age
was above this age.

49
Among those beneficiaries who were self employed, 28 percent of them were self employed individually
and 72 percent of them were self employed in cooperatives. In both types of self employment, those
youth whose age was between 20-24 exceed other youth whose ages were below and above their ages.
But the proportion of males and females was almost equal.
The employment status in terms of the types of training was analyzed and the finding is that 62 percent,
97 percent, 69 percent and 67 percent of beneficiaries who were trained in TVET, FTC, BBS and did not
attend training were became self employed respectively. This indicates that the trainings made
beneficiaries self employed but it is impossible to say that they became self employed because either
they did not have other employment opportunity or they were ‘job creator’ or entrepreneurs.
The type of employment and trainings were analyzed in terms of woredas and the finding is that among
TVET graduates and became self employed, most of them were in Dera (64 percent) and Este (52
percent) woredas and 21 percent from Merawi and 25 percent from Woreta were unemployed thought
they trained in TVET. From the FTC graduates, none of them self employed but 27 percent from Dera
and 17 percent were salary employed. Those BBS trained beneficiaries were self employed among these
63 percents were in Tis Abay followed by 26 percent in Bahir Dar town.
Employment status by field of specialization were analyzed and it is found that among those
beneficiaries who were self employed, 35 percent of them were trained in agriculture, among salary
employed 61 percent of them were trained in cleaning and waste disposal management, and among
unemployed 17 percent of them were trained in construction and cobblestone.
The analysis made on the type of employment with sex and field of specialization indicates that more
females were engaged in tailoring, cleaning and waste disposal management, and agriculture as self
employees. Similarly, females were highly engaged in cleaning and were disposal management as
salaried employees as compared to males. Also more females who were trained in construction, tailoring
and wood and metal work were unemployed as compared to males who trained in similar field of
specialization. This shows that the project funder and implementing partners should work hard in
creating employment opportunities to females.
The employment status analyzed in terms of woredas showed that 78 percent and 79 percent of trained
beneficiaries who were living in Adet and Tis Abay became self employed while 32 percent and 24

50
percent of beneficiaries who were living in Bahir Dar Este woreda became salary employed. The funder
and implementing partners should conduct further study why this happen and take action.
Among beneficiaries who were graduated in 2011 and 2012, 83 percent and 78 percent of them have got
employment opportunities respectively. This finding implies that more should be done in creating
employment opportunities to beneficiaries after they graduate. .
In general, the above mentioned findings indicate that beneficiaries could not get employment
opportunities in different organizations. This could be due to low quality of the training and poor
lobbying and communication of the two project implementers regarding the objective of the project as
well as about beneficiaries’ competency. Thus, the project funder and implementing partners should
work hard on improving the quality of the trainings in order to make the beneficiaries competitive in the
labor market and business, conduct labor market study prior to sending beneficiaries to training,
promotion and business awareness should be made not only to the trainees but to institutions that are
potential recruiter of the trainees in order to create employment opportunity to the beneficiaries
otherwise these people will back to their former hazardous work.. Thus, the project implementers and
funder should work hard on this for the future.
4.6. Job searching
4.6.1 Length of Job Search of Employed Graduates
Respondents were asked to state the length of time they spent to look for jobs after their graduation. The
results are summarized in figure 25 below. As indicated in the figure, among those beneficiaries who
were trained and graduated in TVET, 46 percent of them obtained their first job with in less than a
month after their graduate followed by 17 percent TVET graduates who get job within three months
after their graduation. Fifty three percent and 28 percent of FTC graduates obtained job within a month
and within three months after their graduation respectively. Those beneficiaries who were trained in
BBS were more lucky in getting job as compared to other graduates. Accordingly, 55 percent of and 18
percent of BBS trainees were able to get job within a month and within three months respectively. In
general, less than half percent of the total graduates obtained job within a month followed by 19 percent
of graduates obtained within a month.

51
Figure 25: The length of time for searching of job
4.6.2 Unemployment Rate and Challenges of searching for Jobs
The rate of unemployment as mentioned earlier was significant. Out of the total respondents, 24percent
of them reported that they were unemployed. Among graduates who reported they were unemployed,
about 67 percent of them were TVET graduates and 28percent of them were trained in BBSs. These
unemployed youths are divided in to two: youths who want to be employed but do not get job and
youths who want to start their own business but cannot do it for various reasons.
Those youths who wanted employment but did not achieve this mentioned different reasons for being
unemployed. About 58percent respondents said that they became unemployed because of limited
employment opportunities and lack of jobs. For the remaining 42 percent of unemployed youths the
reasons for being unemployed were lack of employers interest on the field of specialization they were
trained and level of qualification of TVET graduates, lack of social network and work experiences.
Those youths who had interest to start their own business but could not start their business were asked
whether they made effort to start their own business. Among these youths, majority (77percent) of them
responded that they had exerted efforts to start their own business. However, about 77.3 percent of them
had faced financial constraint to start their own business. Lack of skills and confidences, absence of
working place and household care engagement were also the challenges of the rest respondents for
creating one’s own business.
0%
10%
20%
30%
40%
50%
60%
70%
80%
90%
100%
46% 17%
5%
3%
3%
8% 18%
53% 28% 3% 17%
55% 18% 2%
3%
2%
3% 17%
17% 17%
17% 17%
33%
49% 19% 3%
3%
2% 6% 18%
Pe
rce
nta
ge o
f b
en
efi
ciar
ies
Length of time spent to get job
Total
Did not attend the training
Basic trade skills
FTC
TVET

52
Both types of unemployed respondents were asked whether the project (CHADET/FSCE) provided
support in searching of jobs or creating the business or not. About 56.2percent of them reported that
these NGOs had provided support in their searching of jobs despite limited efforts while the rest report
no support had provided by these NGOs. The data gathered through focus group discussion and key
informant interview coincides with the results of the survey. The effort made by CHADET/FSCE in
connecting unemployed graduates with the employers is limited though they provided on materials and
financial support than searching for job and creating market linkage.
Table 8: The major difficulties encountered in looking for jobs or doing of own business as
reported by unemployed respondents
Items No Percent
Youths who wanted to be employed but did not get job
If you are currently unemployed, what are the difficulties
you encountered in looking for after training?
Employers not interested in my level of qualification 7 8.2
Employers not interested in my area of specialization 5 5.9
Lack of work experience 2 2.4
Limited employment opportunities7 25 29.4
Absence of Jobs8 25 29.4
Lack of connectedness/social network 3 3.5
Other9 19 21.2
Total 86 100.0
Youths who wanted to start their own business
Have you ever made effort to start your own business?
Yes 66 77
No 20 23
Total 86 100.0
What were the problems that you faced to start your own
business
Lack of financial capital and tools 51 77.3
Lack of skills and experiences 7 10.6
Lack of confidence 3 4.5
7 Limited employment opportunity means there is employment opportunity but due to time or financial problem employers
temporarily hire limited number of workers and when their problem is solved they will hire them. 8 Absence of job means there is no employer at all for that type of field of specialization not because lack of money or other
things rather there is no demand for that field of specialization in the labor market 9 This includes financial problem, no market linkage and being student

53
Items No Percent
Engaged in household care 3 4.5
Social pressure and traditional customs 1 1.5
Absence of working place 1 1.5
Total 66 100.0
Has CHADET/ FSCE assisted you in searching for job?
Yes 47 56.2
No 37 43.8
Total 84 100.0
Summary
In searching job after graduation, those beneficiaries who were trained in TVET did not spent that much
time where as those beneficiaries who did not take training could not get job in any form. This shows
that in order to get job or start own business, training is vital.
Though beneficiaries faced different types of problems while they search for job, the major problems,
among others, were limited employment opportunities and absence of job. These problems were
mentioned by 58 percent of beneficiaries. Seventy seven percent of beneficiaries mentioned that they
made effort to start their own business but 77 percent of them mentioned that their problem was lack of
financial capital and tools. These unemployed beneficiaries were asked regarding the support provided
to them by the two implementing partners. Little above half percent said that they obtained but not
others.
These findings indicate that the two project implementing partners should help beneficiaries in searching
job using different mechanism and the current status of supporting level should be improved.
4.7 Income changes of graduates
4.7.1 Respondents income before and after the support by sex
Increasing the income generating opportunities and improving the living condition of the neediest
youths is one of the major purposes of the project. In this regard, respondents were asked to estimate the
amount of income that they earn per month. Among asked beneficiaries 95 percent of them responded
for the question raised regarding their income change. Figure 26 shows the percentage of beneficiaries’
monthly income before and after employment. As summarized in Figure 26, 83percent (84 percent male
and 81 percent female) of the respondents did not have income at all. But after the support of the project
this percentage was reduced to 17 percent (21 percent and 13 percent female). The percentage of
beneficiaries whose income less than Birr 200 per month was increased from 3 percent to 25 percent. In
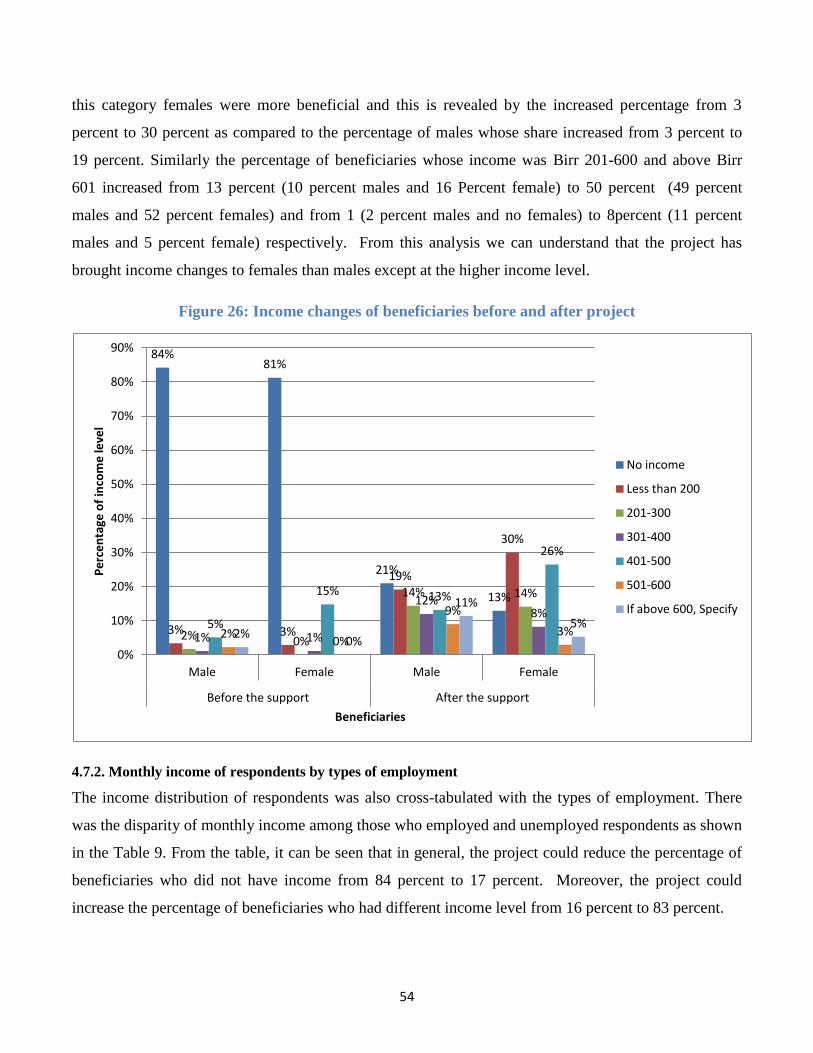
54
this category females were more beneficial and this is revealed by the increased percentage from 3
percent to 30 percent as compared to the percentage of males whose share increased from 3 percent to
19 percent. Similarly the percentage of beneficiaries whose income was Birr 201-600 and above Birr
601 increased from 13 percent (10 percent males and 16 Percent female) to 50 percent (49 percent
males and 52 percent females) and from 1 (2 percent males and no females) to 8percent (11 percent
males and 5 percent female) respectively. From this analysis we can understand that the project has
brought income changes to females than males except at the higher income level.
Figure 26: Income changes of beneficiaries before and after project
4.7.2. Monthly income of respondents by types of employment
The income distribution of respondents was also cross-tabulated with the types of employment. There
was the disparity of monthly income among those who employed and unemployed respondents as shown
in the Table 9. From the table, it can be seen that in general, the project could reduce the percentage of
beneficiaries who did not have income from 84 percent to 17 percent. Moreover, the project could
increase the percentage of beneficiaries who had different income level from 16 percent to 83 percent.
84% 81%
21%
13%
3% 3%
19%
30%
2% 0%
14% 14%
1% 1%
12% 8%
5%
15% 13%
26%
2% 0%
9%
3% 2% 0%
11%
5%
0%
10%
20%
30%
40%
50%
60%
70%
80%
90%
Male Female Male Female
Before the support After the support
Pe
rce
nta
ge o
f in
com
e le
vel
Beneficiaries
No income
Less than 200
201-300
301-400
401-500
501-600
If above 600, Specify

55
When these data disaggregated to different employment status the result is explained as follow. The
percentage of beneficiaries who were unemployed and did not have income at all was reduced from 96
percent to 77 percent. Among self employed beneficiaries 5 percent of them reported that they did not
have income. In fact, this will not be true because as self employees they have income but some
individuals have a habit of hiding their income for various personal reasons. So the 5 percentage can be
taken as increased income. Here, we put the figure as it is for ethical and transparency.
Prior to the joining the project 25 percent of beneficiaries were self employed and had monthly income
less than Birr 200, but this figure increased to 34 percent after they join the project. However, the
percentage of salary employed beneficiaries whose monthly income was less than birr 200 was reduced
from 13 percent to 7 percent because they moved to the higher income level though if is difficult to
show who went to what income level. Those beneficiaries who were unemployed and had income less
than birr 200 were 1 percent prior to the implementation of the project. But after the implementation of
the project this figure increased. This might be these beneficiaries get irregular income from casual
work because they already trained by the project and have the capacity to work in the field of
specialization they trained. In total the project could increase the percentage of beneficiaries whose
income was less than birr 200 from 3 percent to 25 percent.
Prior to the project implementation, there was no self employed beneficiary whose income was between
birr 201 and 300, but due to the project implementation, the percentage increased to 18 percent.
Similarly the percentage of salary employed beneficiaries whose income was between 201 and 300
increased from 3 percent to 7 percent. The percentage of unemployed beneficiaries who had the above
mentioned income increased from nil to 3 percent. The percentage of beneficiaries, whose income level
was between 201 and 300, was increased from 1 percent to 14 percent. Those self employed
beneficiaries whose income ranges from birr 301-400 declined from 17 percent to 13 percent after the
implementation of the project. This might be due to the fact that these people may shift from self
employment to salary employment to increase their income because the project develops their skill and
make them competitive to the labor market. The percentage of salary employed beneficiaries was 3
percent prior to the implementation of the project and this percentage increased to 9 percent. This means
that those beneficiaries whose income was less than this income level and due to the project support
their income level increased and joined this income level group. Similarly for the reason mentioned
previously, the income of unemployed beneficiaries increased and as a result to the percentage of

56
unemployed beneficiaries whose income was between birr 301-400 increased from 1 percent to 2
percent. In general, the percentage of this income level increased from 1 percent to 10 percent.
Contrary to the above facts, at income level 401-500, the percentage of self employed and salary
employed beneficiaries declined from 58 percent to 15 percent and 69 percent to 59 percent respectively.
But the percentage of unemployed beneficiaries whose income was birr 401-500 increased from 1
percent to 8 percent and the overall percentage of beneficiaries at this income level could increase from
9 percent to 20 percent. This might be the income of level of the beneficiaries increased to the highest
income level.
At income level 501-600, the percentage of self employed beneficiaries increased to 5 percent from nil,
for salary employed the percentage increased from 6 percent to 13 and, for unemployed beneficiaries the
percentage increase from nit to 3 percent. for such result, some are at this income level get skill training.
of beneficiaries whose income was between In general at this income level, the percentage was
increased from 1 percent to 6 percent.
With regard to beneficiaries whose monthly income was above birr 600, the percentage of self employed
beneficiaries, salary employed and unemployed beneficiaries increased from nil to 10 percent, 6 percent
to 7 percent and from 1 percent to 5 percent respectively. In total, the percentage income increased from
1 percent to 8 percent.
Table 9: Income level of beneficiaries before and after the project
Level of Income
Self employed Salary employed Unemployed Total
Before
the
After
the
Before
the
After
the
Before
the
After
the
Before
the
After
the
project (Percent) project (Percent) project (Percent) project (Percent
No income 0 5 0 0 96 77 84 17
Less than 200 25 34 13 t 7 1 2 3 25
201-300 0 18 3 7 0t 3 1 14t
301-400 17 13 3 9 1 2 1 10
401-500 58 15 69 59 1 8 9 20t
501-600 0 5 6 13 0 3 1 6t
If above 600, Specify 0 10 6 7 1 5 1 8
Total 100 100 100 100 100 100 100 100
4.7.3. The Income of the respondents by woreda
The disparity of monthly income was also seen when the income of respondents analyzed in terms of
woreda. As summarized in the figure 19, the project beneficiaries of Bar Dar town had earned highest

57
income as compared to other project intervention town or woredas. For instance, 13 percent of
beneficiaries whose income was above Birr 600 were found in Bahir Dar town. The next higher income
was observed in Woreta. In this woreda among the beneficiaries who were supported by the project, 14
percent of them had income between Birr 501-600. In Bahir Dar town, in addition to the highest income
observed, 41 percent of beneficiaries monthly income was between Birr 401-500. In Dera Woreda,
among the beneficiaries 17 percent of them had monthly income Birr 301-400.
In Tis Abay woreda also, 37 percent of the beneficiaries had monthly income Birr 201-300. In Dera
woreda in addition to the above mentioned income range, 44 percent of the beneficiaries monthly
income was less than Birr 200. In Woreta woreda also above half percent of the beneficiaries had no
income even if they were supported by the project in different ways.
From this analysis one can understand that those beneficiaries who are living in Bahir Dar town could
improve their monthly income significantly with the support of the project followed by Dera, Adet,
Estie, Merawi, Tis Abay and Woreta woredas.
Figure 27: Monthly income of beneficiaries by woreda
4.7.4. Perceptions of beneficiaries regarding their income change
The respondents were also asked whether their monthly income was changed in the past three years or
not. As shown in the Figure 28, about 72 percent of the respondents confirmed that their monthly
13% 6%
23% 31% 32%
53%
40%
16%
44%
42% 23%
11%
3%
20%
8%
22%
11%
19% 37% 14%
10%
7%
17%
12% 8%
16%
8%
3%
41%
7%
9%
8%
5%
6%
3%
9%
2%
2%
14% 10% 13%
7% 2%
12% 3%
0%
10%
20%
30%
40%
50%
60%
70%
80%
90%
100%
Adet Bahirdar Dera Este Merawi Tis Abay Wereta
Pe
rce
nta
ge o
f re
spo
nd
en
ts
Woreda
Above 600
501-600
401-500
301-400
201-300
Less than 200
No income

58
income was improved in the last three years. However, the rate of improvement was different. 24
percent of beneficiaries said that their income was greatly improved slightly while 48 percent of the
respondents confirmed that their monthly income was somehow improved. The remaining 19 percent
and 9 percent of beneficiaries said that their income was not changed and declined respectively though
they obtain support from the project. The beneficiaries did not mention any reason why their income is
not changed or declined despite the support they get from the project.
Figure 28: Perception of beneficiaries regarding their income change Percentage of beneficiaries
4.7.6 Changes occurred in the life of beneficiaries due to income change
Those beneficiaries who said their income is changed also were asked to indicate the type of change that
they observe in their life. Accordingly as clearly shown in figure 29 below 20 percent of the population
said that they started saving due to the income change followed by those beneficiaries (15 percent) who
said they full fill their basic needs which they could not do prior to the project support. Though they
have change in their life, 27 percent of beneficiaries were not willing to mention the type of change that
they have in their life. Eight and seven percent of beneficiaries said that they could have permanent and
increased income and purchase different materials to run their business respectively. About 7 percent of
the beneficiaries said that there is no change in their life thought they were supported by the project.
24%
48%
19%
9%
Greatly improved
Somehow improved
Has stayed the same
declined

59
Figure 29: Changes observed due to income change
Summary
The study revealed that the project had brought significant income change among beneficiaries. Prior to
the project implementation, 84 percent and 81 percent of males and females had no income respectively.
But after the project implementation, these figures dramatically go down to 21 percent males and 13
percent females. Moreover, the income of other beneficiaries was increased though it was not as much
as expected.
The income change in terms of the type of employment was seen and it was found that those percentage
of self employed whose monthly income was less than Birr 200 was increased to 34 percent from 25
percent and those employees whose salary was between birr 501-600 was increased from 6 percent to 13
percent. With regard to unemployed beneficiaries, 96 percent of them did not have income prior to
project implementation but after project implementation this figure goes down to 77 percent. This is
obvious that s because some these people had got employment opportunity.
Not mentioned
Purchase asset to generate income
Build house
Fullfill needs
Support family
No change/improvement
0% 5% 10% 15% 20% 25% 30%
27%
20%
7%
8%
1%
6%
15%
1%
3%
5%
7%
Typ
e o
f ch
ange
s
Percentage of beneficiaries
Not mentioned Started Saving
Purchase asset to generate income Permanent/increased Income
Build house Bought household furniture
Fullfill needs Purchase educational materials
Support family Better life, job, attitude about job etc
No change/improvement
60
The income level change was analyzed in term of woredas and the result is that 53 percent of
beneficiaries who did not have income were found in Wereta, 40 percent, 44 percent, and 42 percent of
beneficiaries whose monthly income was less than Birr 200, was found in Adet, Dera and Dera ad Este
respectively. In Tis Abay, Dera, and Adet Dera woredas. 37 percent, 22 percent, and 20 percent of
beneficiaries obtained monthly income birr 201-300 respectively.,
Regarding the income change, participant s forwarded their perception. Among those beneficiaries, 48
percent said that somehow improved while 24 percent of them said it was greatly improved. Only 9
percent of them said their income declined.
Though 27 percent of beneficiaries were not willing to express the observed change occurred due to
their income change, 27 percent of them started saving, while 15 percent of them were able to fulfill
their needs.
4.8 Perception of respondents on the relevance and effectiveness of the skills
training
4.8.1 The relevancy and effectiveness of the skills training for their current jobs
When the relevance of training is disaggregated by the types of skills training, higher percentage of
farmers training graduates believed that the training they received increased their ability to perform tasks
in their current job than the TVET graduates. As depicted in Table 10 below, the training offered by
support of the project was highly relevant for more than 90 percent of FTC, 84 percent of TVET and 89
percent of BBS graduates in performing their farming practices, technical and vocational activities and
other business respectively.
The beneficiaries’ perceptions were disaggregated in terms of woreda in which beneficiaries belong to
and the results exhibited in Table 10 below indicate that among beneficiaries who are living in Adet
woreda 93 percent (88 percent TVET graduates and 100 percent BBS trainees) of them said that the
trainings they took were relevant for the current job they are engaged in. Similarly 89 percent (100
percent of TVET graduates and 86 percent of BBS trainees) mentioned that the trainings were relevant
to their current job. In terms of FTC graduates 100 percent of beneficiaries who are living in Dera and
Merawi woreda confirmed that the training they took was relevant for the job they are currently engaged
in. However, 25 percent of TVET graduates and 22 percent of BBS graduates who are living in Merawi
woreda complained that the TVET and BBS trainings they took are not relevant to the job they are

61
currently engaged in. In fact, these are the highest complaints forwarded by beneficiaries on the
relevancy of TVET and BSS trainings to their current job.
The data collected from key informant interview and focus group discussion in Dera and East Este
woredas is consistent with the results of the survey. The key informants and group discussants reported
that agricultural training provided by the support of CHADET is highly relevant in empowering the
participants’ skills about farming.
Table 10: The relevancy and effectiveness of the training by type of skill and Woreda
Woreda
TVET FTC BBS Total
Yes
(Percent)
No
(Percent)
Yes
(Percent)
No
(Percent)
Yes
(Percent)
No
(Percent)
Yes
(Percent)
No
(Percent)
Total
(Percent)
Adet 88 t 13 0 0 100 0 93 7 100
Bahirdar 87 13 89 11 90 t 10 88 12 100
Dera 80 20 100t 0 100 0 87 13 100
Este 82 18 90 10 80 20 83 17 100
Merawi 75 25p 100t 0 78 22 79 21 100
Tis Abay 100 0 0 0 86 14 89 11 100
Wereta 90t 10 0 0t 86 14 88 13 100
Total 84 16 94 6 89t 11 87 13 100
Beneficiaries were asked whether they are engaged in an activity in which they are trained. As shown in
the figure 30below, among the TVET trainees 82 percent, among FTC 97 percent and among BBS 82
percent of beneficiaries were engaged in activity in which they were trained.

62
Figure 30: Changes observed due to income change
Out of the total interviewed beneficiaries 32 beneficiaries could not be engaged in activity in which they
were trained. For this though many reasons were mentioned by the beneficiaries, they are summarized
and the results are as follow. As the data analysis indicated that 12 percent, 3 percent and 8 percent of
TVET, FTC ad BBS trainees could not be engaged in activity in which they were trained because being
engaged in another job out of the trainings they were provided and absence of job.
4.8.2 The relevancy and effectiveness of the skill trainings to increase competencies.
The relevancy of the three trainings in increasing the competence of the graduates in the labor market
and jobs in which they are engaged in was confirmed by 84 percent of the trainees. According to the
responses of the beneficiaries, 81 percent of TVET, 97 percent of FTC, and 83 percent of BBS graduates
said that the trainings they took made them competitive in the jobs they are engaged in as indicated in
Table 11. But, 19 percent TVET graduates and 17 percent BBS trainees had reservation on the provided
training in increasing their competitiveness. For FTC graduates, the training they took increased their
competence in the crop market.
These survey results were analyzed in terms of woreda and the results indicate that 88 percent ( 92
percent of TVET graduates and 86 percent of BBS trainees) of the respondents who are living in Adet
woreda confirmed that the trainings they were provided increased their competitiveness in the job
market. Moreover, 83 percent of respondents who took BBS skill confirmed that the training Similarly,
87 percent of Bahirdar town beneficiaries, 89 percent of Este woreda beneficiaries, 82 percent of Dera
82% 97%
82%
18% 3%
18%
0%
10%
20%
30%
40%
50%
60%
70%
80%
90%
100%
TVET FTC Basic Business skills
Pe
rce
nta
ge o
f b
en
efi
ciar
ies
types of training
No
Yes

63
woreda and 80 percent of Merawi woreda beneficiaries confirmed that the trainings given to them
increased their competitiveness in the job market. On the other hand, only 21 percent and 31 percent of
Tis Abay woreda and Woreta woreda beneficiaries complained that the trainings provided to them did
not help them to be competitive in the job market.
Key informants and group discussants agreed on the findings of the survey. The TVET graduates as
viewed by some key informants and focus group discussants did not perform tasks in their current job
Table 11: The relevancy of the trainings to increase competitiveness of beneficiaries in the job
market
Woreda
TVET FTC BBS Total
Yes
(percent)
No
(Percent)
Yes
(Percent)
No
(Percent)
Yes
(Percent)
No
(Percent)
Yes
Percent)
No
(Percent)
Total
(Percent)
Adet 92 8 0 0 86 14 88 12 100
Bahirdar 88 12 88 13 86 14 87 13 100
Dera 71 29 100 0 100 0 82 18 100
Este 88 13 100 0 75 25 89 11 100
Merawi 69 31 100 0 89 11 80 20 100
Tis Abay 75 25 0 0 80 20 79 21 100
Wereta 67 33 0 0 71 29 69 31 100
Total 81 19 t 97 3 83 17 84 16 100
Summary
Beneficiaries expressed their perception regarding the relevancy and effectiveness of the training they
took and the result obtained shows that 87 percent of them said the trainings they took were relevant to
their current job. This perception was analyzed in terms of the types of trainings and woreda. It is
found that 84 percent of TVET, 94 percent of FTC trainees, and 89 percent of BBS trainees said that the
trainings they took were relevant and effective.
Among trainees who took TVET, FTC and BBS, 82 percent, 97 percent and 82 percent of them were
engaged in the field they were trained.
Moreover, 84 percent of trainees (81 percent of TVET trainees, 97 percent of FTC trainees and 83
percent BBS trainees0 said that the trainings they took increased their competitiveness in the labor
market and the business environment in which they are participating.

64
These findings indicate that the trainings provided to beneficiaries were relevant and effective in
enabling them to get job or start business in the field of their training and increasing their
competitiveness in the labor market and business in which they are engaged.
In this regard, it is possible to say that the two project implementing partners were effective in achieving
the project objective. Thus, these partners should take further ideas from beneficiaries in order to
improve the trainings for the future and build the capacity of beneficiaries in selecting the field they will
be successful.
4.9 Basic Business Skill (BBS)
4.9.1 The perception of beneficiaries on relevance of BBS training
Basic Business Skill training was also offered by both CHADETS and FSCE in addition to TVET and
farmers trainings. The survey results reveal that about 71 percent of respondents had received
entrepreneurship training. Both the TVET and FTC graduates were participated in this training. Among
the woredas where beneficiaries took BBS training, the largest number of beneficiaries were from Bahir
dar town (86 participants or 68 percent of beneficiaries that should take the training ) and the lowest
number of participants were from Tis Abay woreda (16 participants or 94 percent of beneficiaries that
should take the training). According to different sources (survey, secondary data and key informant
interview), the training was given for 5 days.
Receiving the BBS training was important as perceived by 67 percent of the total respondents who
attended the course though the extent of its importance varies. As indicated in Table xx, the largest
number ( 53 beneficiaries or 62 percent of the total beneficiaries of Bahir Dar) of beneficiaries who said
the BBS training was important were from Bahir Dar while the lowest number of (12 beneficiaries or 58
percent of beneficiaries) be beneficiaries who said the BBS training was important were from Merawi.
The project beneficiaries were also asked a question on the relevance of training for activity they were
engaged in. As indicated in Table 12, 94 percent of them believed that the BBS course was relevant for
their business activities they were engaged in during the survey. It was also found that the course had
contributed for starting of the business activities for 94 percent of the respondents. In terms of woredas,
above 95 percent of beneficiaries from Adet, Dera, Bahir dar town and Woreta woreda said that the BBS
training was relevant and effective for their business or job they are engaged in currently.
Despite the relevance of the training, the time allocated for course was too short. The graduates strongly
indicate the need for a longer course, for self employed beneficiaries, with a more practical and business

65
oriented approach, relating directly to their practical problems as newly started entrepreneurs. Besides,
the course has given for those did not attend vocational training.
Except beneficiaries who are living Merawi woreda, above 90 percent of beneficiaries in other woredas
mentioned that they are currently working directly related with BBS training they received.
Beneficiaries were asked whether the BBS training they received made them competitive in the job
market in which they are engaged in. As shown in Table 12 below, 84 percent of beneficiaries said that
the BBS training made them competitive in the job market in which they are engaged in. When this
result is disaggregated in term of woredas, 89 percent of beneficiaries from Adet and Este, 87 percent
from Bahir Dar town said that the BBS training made them competitive in the job market in which they
are engaged in. The lowest response that is 70 percent is obtained from Woreta woreda beneficiaries.
Table 12: BBS training and its relevance as perceived by graduates
Summary
The study results show that the majority (71 percent) of beneficiaries took BBS training, and among
these beneficiaries 67 percent of them said the training was important. Moreover , 94 percent (199) of
beneficiaries said that BBS training was relevant for the activity they are engaged in and 94 percent
Items No Percent
Have you ever received BBS trainings?
Yes 236 71
No 96 29
Total 332 100
If yes, how important was the training you received?
Not important 22 9
Somewhat important 56 24
Important 100 42
Very important 59 25
Total 237 100
Was the BBS training relevant for the activity you are engaged in?
Yes 199 94
No 12 6
Total 211 100.0
Has BBS contributed for your business activities?
Yes 198 94
No 13 6
Total 211 100.0

66
(198) of beneficiaries said that the BBS contributed for their business activities. From this one can
conclude that the BBS training was very useful to beneficiaries to change their livelihood.
5. Supports of CHADET and FSCE
5.1 Supports of CHADET and FSCE to create market linkage
The project (both CHADET and FSCE) had made efforts to create the market linkages especially for self
employed project beneficiaries who were doing their business individually or in groups. Among the
participants, about 94 percent of them participated in business awareness raising activities with the
support of the two NGOs in addition to entrepreneurship training (Table 13). The major business
awareness raising activities that were done by the project were experience sharing with best practitioners
in which 44 percent of beneficiaries participated followed by business exhibition and promotion faire in
which 4 percent of the beneficiaries participated in each of these types of business awareness activities.
However, 48 percent of the participants were participated in various types of business awareness
activities or create their own market linkage by their own ways other than the support of the project
implementers. Their participation in these business awareness raising activities was increased as
reported for most of the participants. CHADETS/FSCE’s contribution in facilitating these business
awareness activities was high for 37percent, medium for 36 percent and low for 9 percent (see Table
13).
Table 13: Entrepreneurship and other business awareness raising activities and their relevance as
perceived by the respondents
Items No Percent
Have you participated in business awareness raising activities other than
BBS training?
Yes 331 94
No 23 6
Total 354 100.0
In which Business awareness raising activities have you ever been
participated
Business Promotion Faire 12 4
Business Exhibition 11 4
Experience Sharing with best practitioners 119 44
Others10
129 48
Total 271 100.0
10
Others include market linkage methods exercised by the beneficiaries themselves without the support of CHADET/FSCE

67
Items No Percent
How would you rate the contribution of CHADETS/FSCE in facilitating
these business awareness raising activities
High 68 37
Medium 67 36
Low 17 9
Not at all 32 17
Total 184 100.0
5.2 Different supports provided by the project implementers (CHADET and FSCE)
Creating safe employment opportunities for those who are involved hazardous informal sector and
empowering youths economically in order to improve their livelihood are the major purposes of the
project. In order to put the project objectives into practices, CHADETS/FSCE has been provided
different supports in addition to trainings. Table 14 summarizes different supports provided and the
contribution of the project in providing the support. As reported in the table, 76 percent of respondents
confirmed that they obtained different types of supports from the two implementers. The types of
supports provided to project beneficiaries were finance, tools/materials and animals. Fifty five percent of
beneficiaries were provided financial and material supports. Training and material supports were
provided to 28 percent of beneficiaries. For the remaining 17 percent of beneficiaries were supported to
get job and provided other types of supports. However, 24 percent of beneficiaries did get none of the
above mentioned support provided to their colleagues.
Beneficiaries were requested to express their satisfaction levels with regard to the supports provided to
them by the two project implementers. As indicated in Table 14 below, 68 percent of beneficiaries said
the supports provided to them were very good and good. The other 15 percent and 17 percent of
beneficiaries said the supports provided to them were satisfactory and not satisfactory respectively.
These beneficiaries were asked to give their reasons why they say this and according to their responses
for 75 percent of them the major reason were related to financial, income and market linkage followed
by 11 percent of beneficiaries who said they did not have job opportunity while 7 percent of them said
they did not get the necessary support as they expect after they took training. Finally, 4 percent and 3
percent of beneficiaries said that they were not satisfied with the support provided to them because of
absence of working place and their personal behavior respectively.
In addition to the above supports, the beneficiaries were asked regarding their access to credit. The
majority (88 percent) of beneficiaries confirmed that they had credit access. Based on this response they
were asked further regarding the amount of money they borrowed. The majority (74 percent) of them
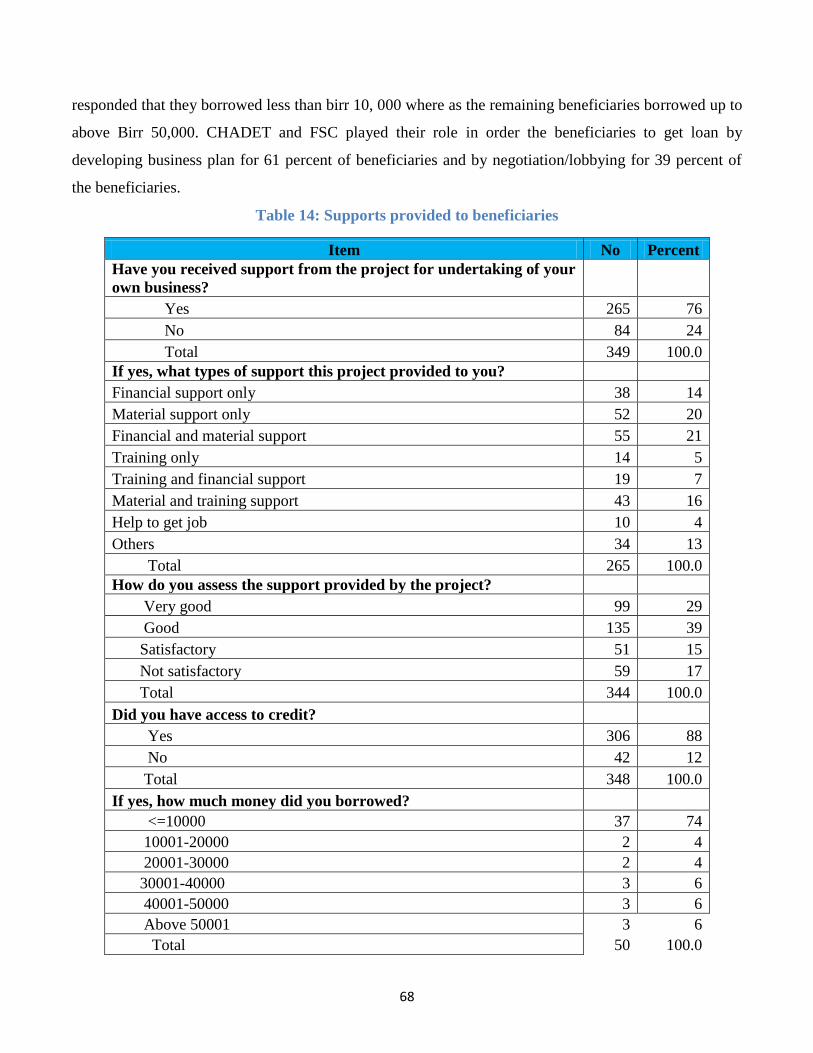
68
responded that they borrowed less than birr 10, 000 where as the remaining beneficiaries borrowed up to
above Birr 50,000. CHADET and FSC played their role in order the beneficiaries to get loan by
developing business plan for 61 percent of beneficiaries and by negotiation/lobbying for 39 percent of
the beneficiaries.
Table 14: Supports provided to beneficiaries
Item No Percent
Have you received support from the project for undertaking of your
own business?
Yes 265 76
No 84 24
Total 349 100.0
If yes, what types of support this project provided to you?
Financial support only 38 14
Material support only 52 20
Financial and material support 55 21
Training only 14 5
Training and financial support 19 7
Material and training support 43 16
Help to get job 10 4
Others 34 13
Total 265 100.0
How do you assess the support provided by the project?
Very good 99 29
Good 135 39
Satisfactory 51 15
Not satisfactory 59 17
Total 344 100.0
Did you have access to credit?
Yes 306 88
No 42 12
Total 348 100.0
If yes, how much money did you borrowed?
<=10000 37 74
10001-20000 2 4
20001-30000 2 4
30001-40000 3 6
40001-50000 3 6
Above 50001 3 6
Total 50 100.0
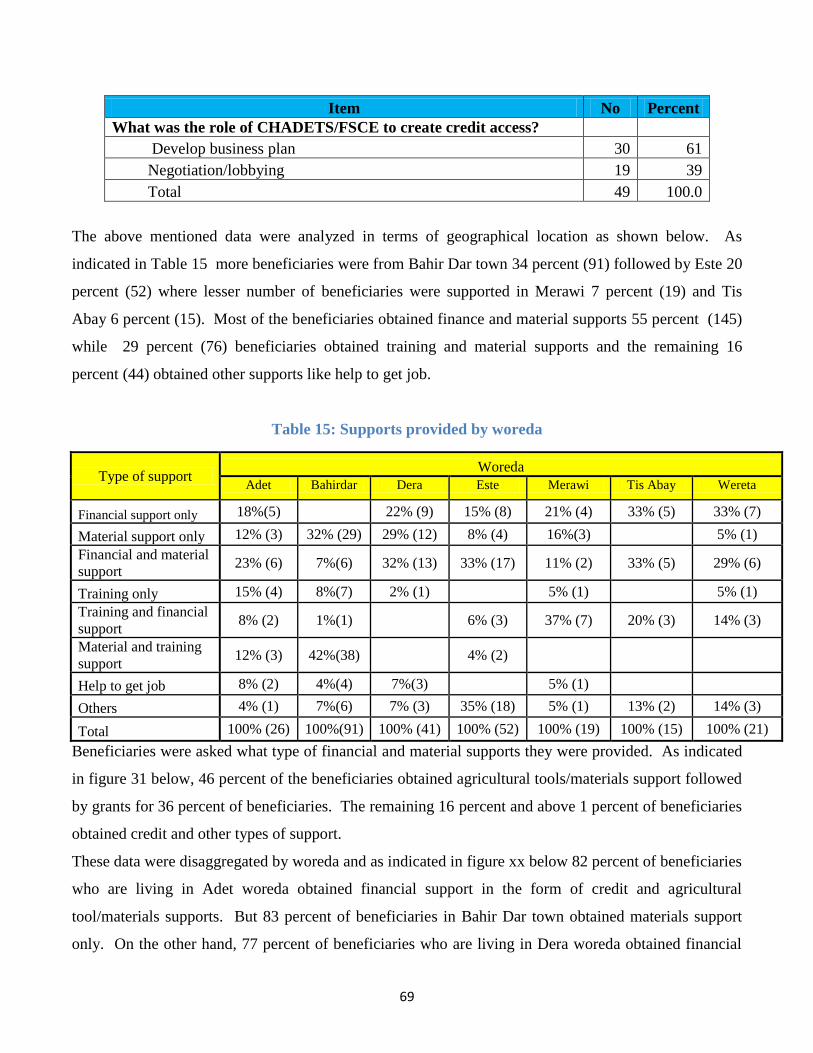
69
Item No Percent
What was the role of CHADETS/FSCE to create credit access?
Develop business plan 30 61
Negotiation/lobbying 19 39
Total 49 100.0
The above mentioned data were analyzed in terms of geographical location as shown below. As
indicated in Table 15 more beneficiaries were from Bahir Dar town 34 percent (91) followed by Este 20
percent (52) where lesser number of beneficiaries were supported in Merawi 7 percent (19) and Tis
Abay 6 percent (15). Most of the beneficiaries obtained finance and material supports 55 percent (145)
while 29 percent (76) beneficiaries obtained training and material supports and the remaining 16
percent (44) obtained other supports like help to get job.
Table 15: Supports provided by woreda
Type of support Woreda
Adet Bahirdar Dera Este Merawi Tis Abay Wereta
Financial support only 18%(5) 22% (9) 15% (8) 21% (4) 33% (5) 33% (7)
Material support only 12% (3) 32% (29) 29% (12) 8% (4) 16%(3) 5% (1)
Financial and material
support 23% (6) 7%(6) 32% (13) 33% (17) 11% (2) 33% (5) 29% (6)
Training only 15% (4) 8%(7) 2% (1) 5% (1) 5% (1)
Training and financial
support 8% (2) 1%(1) 6% (3) 37% (7) 20% (3) 14% (3)
Material and training
support 12% (3) 42%(38) 4% (2)
Help to get job 8% (2) 4%(4) 7%(3) 5% (1)
Others 4% (1) 7%(6) 7% (3) 35% (18) 5% (1) 13% (2) 14% (3)
Total 100% (26) 100%(91) 100% (41) 100% (52) 100% (19) 100% (15) 100% (21)
Beneficiaries were asked what type of financial and material supports they were provided. As indicated
in figure 31 below, 46 percent of the beneficiaries obtained agricultural tools/materials support followed
by grants for 36 percent of beneficiaries. The remaining 16 percent and above 1 percent of beneficiaries
obtained credit and other types of support.
These data were disaggregated by woreda and as indicated in figure xx below 82 percent of beneficiaries
who are living in Adet woreda obtained financial support in the form of credit and agricultural
tool/materials supports. But 83 percent of beneficiaries in Bahir Dar town obtained materials support
only. On the other hand, 77 percent of beneficiaries who are living in Dera woreda obtained financial

70
support in the form of grant. Most of the beneficiaries from Tis Abay (82 percent) and Merawi ( 64
percent) woredas obtained financial support in the form of credit.
Those beneficiaries who obtained credit was asked how much money they borrowed. Fifty beneficiaries
from the target woredas borrowed money. Out of these, 18 percent of them were from Adet and Este
respectively and 50 percent were from Merawi and 10 percent were from Tis Abay. Bahir dar and
Woreta each accounted 2 percent. Among beneficiaries who borrowed money, 78, 88 and 80 percent of
them were from Adet, Merawi and Tis Abay respectively and borrowed less than or equal to Birr
10,000.00. In Adet and Este woredas 11 percent of beneficiaries borrowed between Birr 10000 and
20000. Among borrowers who borrowed Birr 20000-30000, 20 percent of them were from Tis Abay
woreda. In Este woreda 55 percent of borrowers borrowed above Birr 40,000.00
Figure 31: Percentage of beneficiaries who obtained financial and materials support by woreda
With regard to satisfaction level, beneficiaries from each woreda were asked and their response was as
follows. Figure 32 shows that those except beneficiaries from Merawi and Woreta, others from the
remaining woredas reported almost similar level of satisfaction that ranges from 60 percent to 78
41%
2%
15%
64%
82%
16%
14%
14%
77% 60%
16%
0%
73% 36%
41%
83%
23% 25% 16% 12% 27%
46%
5% 1% 4% 6% 1%
0%
20%
40%
60%
80%
100%
120%
Pe
rce
nta
ge o
f b
en
efi
ciar
ies
Woreda
Other
Agricultural tools /materials in kind
Grant
Credit
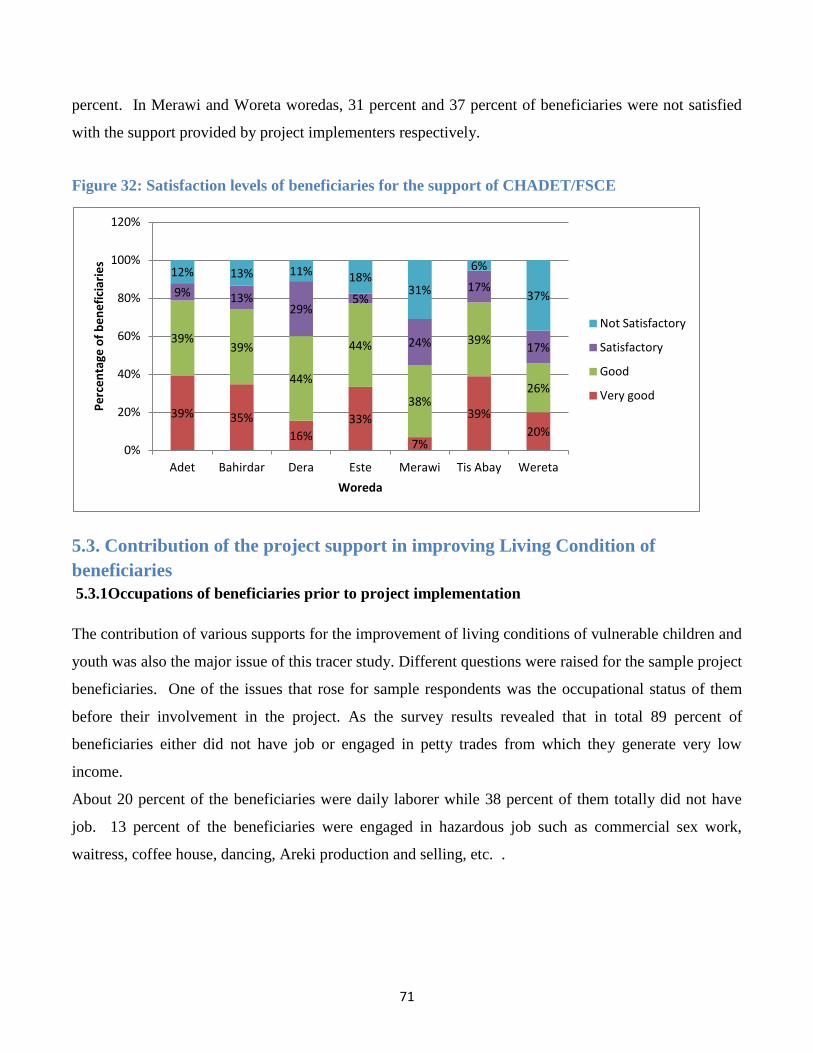
71
percent. In Merawi and Woreta woredas, 31 percent and 37 percent of beneficiaries were not satisfied
with the support provided by project implementers respectively.
Figure 32: Satisfaction levels of beneficiaries for the support of CHADET/FSCE
5.3. Contribution of the project support in improving Living Condition of
beneficiaries
5.3.1Occupations of beneficiaries prior to project implementation
The contribution of various supports for the improvement of living conditions of vulnerable children and
youth was also the major issue of this tracer study. Different questions were raised for the sample project
beneficiaries. One of the issues that rose for sample respondents was the occupational status of them
before their involvement in the project. As the survey results revealed that in total 89 percent of
beneficiaries either did not have job or engaged in petty trades from which they generate very low
income.
About 20 percent of the beneficiaries were daily laborer while 38 percent of them totally did not have
job. 13 percent of the beneficiaries were engaged in hazardous job such as commercial sex work,
waitress, coffee house, dancing, Areki production and selling, etc. .
39% 35%
16%
33%
7%
39%
20%
39% 39%
44%
44%
38%
39%
26%
9% 13% 29%
5%
24%
17%
17%
12% 13% 11% 18% 31%
6%
37%
0%
20%
40%
60%
80%
100%
120%
Adet Bahirdar Dera Este Merawi Tis Abay Wereta
Pe
rce
nta
ge o
f b
en
efi
ciar
ies
Woreda
Not Satisfactory
Satisfactory
Good
Very good

72
Figure 33: Occupational status of respondents before project intervention
5.3.2 Current situation of beneficiaries after getting support of the project
Beneficiaries were asked if they feel that their current job is safer for their health as compared to their
previous occupation. Amongst the requested beneficiaries 80 percent of them confirmed that the
supports provided to them enable them to quit from hazardous work and to be engaged in jobs which are
safer for their health.
Furthermore, the respondents were asked to rate their current working condition and as indicated in Table 16
below, 44 percent of them responded that their current working condition is favorable while 56 percent of them
responded that their current working condition are either somewhat unfavorable or unfavorable. These
beneficiaries were asked to mention reasons why they say their job is unfavorable or some what favorable. Most
of them responded that the jobs they are engaged in brought them different diseases, and not comfortable, among
others.
5% 3%
20%
5%
38%
6% 3% 10%
89%
0%
10%
20%
30%
40%
50%
60%
70%
80%
90%
100%
Animal Farming, farming
Commercial sex work, waitress
Daily laborer
Housemaide/wife
No Job
Shoe shine, shoe maintenance
Student

73
Table 16: The safeness of current jobs
The above data were disaggregated in terms of woreda and sex and the results obtained are shown in
Table 17 below. As indicated in the table, among the total beneficiaries 80 percent of males and 81
percent of females said that they feel that their current job is safer for their health as compared to their
job they had prior to the project support they were provided.
When these data are analyzed in terms of woreda, more than 90 percent of beneficiaries who are living
in Adet,, Este and Tis Abay woredas responded that their current job is safer for their health. Contrary to
this, 31 percent and 30 percent of beneficiaries who are living in Merawi and Wereta Woreda
respectively said that their current job is not safer for their health as compared to their previous job for
various reasons that they mentioned. Among the reasons they mentioned the major one is the type of
job they are currently working in such as waste material disposal, barber including hair dressing, café
and restaurant, cleaning, cobblestone and selling tella and tea.
Table 17: Responses for question whether current job is safer or not
Woreda Yes No Total
Male Female Male Female Yes No
Adet 91 percent 94 percent 9 percent 6 percent 93 percent 7 percent
Bahirdar 66 percent 78 percent 34 percent 22 percent 73 percent 27 percent
Dera 94 percent 86 percent 6 percent 14 percent 89 percent 11 percent
Este 95 percent 88 percent 5 percent 12 percent 91 percent 9 percent
Merawi 80 percent 63 percent 20 percent 38 percent 69 percent 31 percent
Tis Abay 92 percent 100 percent 8 percent 0 percent 94 percent 6 percent
Wereta 72 percent 60 percent 28 percent 40 percent 70 percent 30 percent
Total 80 percent 81 percent 20 percent 19 percent 80 percent 20 percent
Items No Percent
As compared with you previous work do you feel that your current job
is safer for your health
Yes 237 80
No 58 20
Total 295 100.0
How would you rate your current working condition
Unfavorable 59 19
Somewhat favorable 112 37
Favorable 134 44
Total 305 100.0
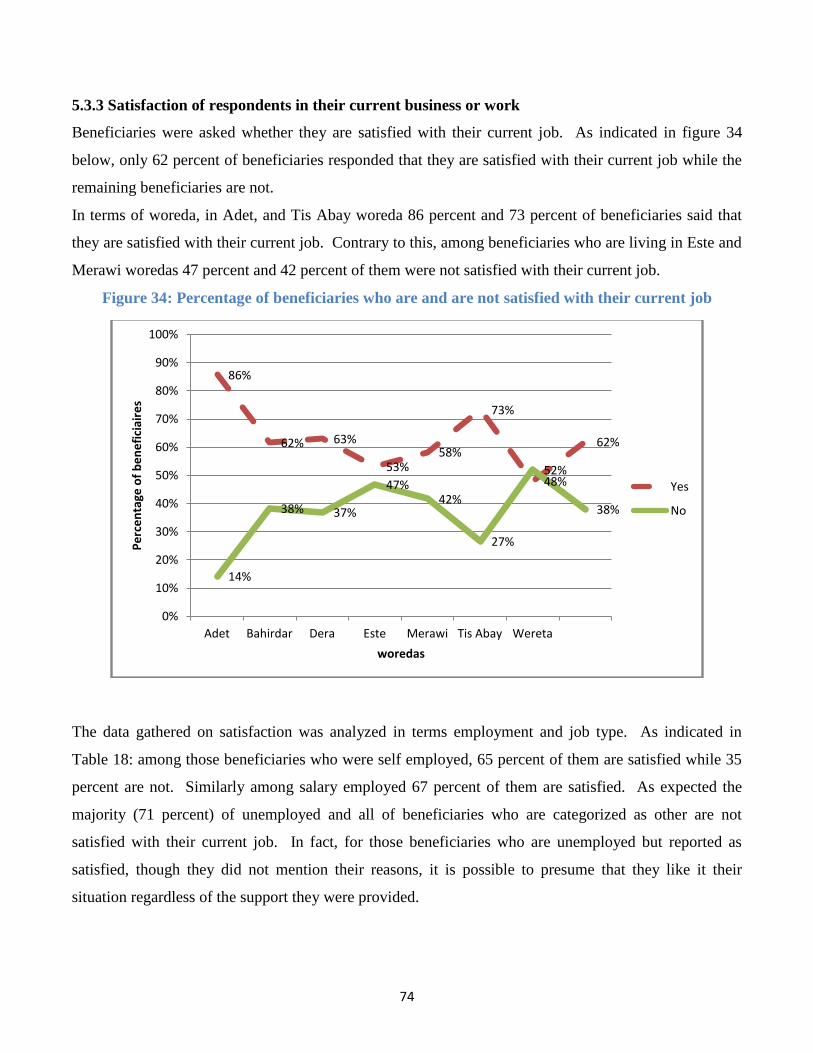
74
5.3.3 Satisfaction of respondents in their current business or work
Beneficiaries were asked whether they are satisfied with their current job. As indicated in figure 34
below, only 62 percent of beneficiaries responded that they are satisfied with their current job while the
remaining beneficiaries are not.
In terms of woreda, in Adet, and Tis Abay woreda 86 percent and 73 percent of beneficiaries said that
they are satisfied with their current job. Contrary to this, among beneficiaries who are living in Este and
Merawi woredas 47 percent and 42 percent of them were not satisfied with their current job.
Figure 34: Percentage of beneficiaries who are and are not satisfied with their current job
The data gathered on satisfaction was analyzed in terms employment and job type. As indicated in
Table 18: among those beneficiaries who were self employed, 65 percent of them are satisfied while 35
percent are not. Similarly among salary employed 67 percent of them are satisfied. As expected the
majority (71 percent) of unemployed and all of beneficiaries who are categorized as other are not
satisfied with their current job. In fact, for those beneficiaries who are unemployed but reported as
satisfied, though they did not mention their reasons, it is possible to presume that they like it their
situation regardless of the support they were provided.
86%
62% 63%
53% 58%
73%
48%
62%
14%
38% 37%
47% 42%
27%
52%
38%
0%
10%
20%
30%
40%
50%
60%
70%
80%
90%
100%
Adet Bahirdar Dera Este Merawi Tis Abay Wereta
Pe
rce
nta
ge o
f b
en
efi
ciai
res
woredas
Yes
No

75
Table 18: Percentage of beneficiaries who are and are not satisfied with their current job
Satisfied with
current job
Self
employed
Salary
employed Unemployed Other Total
Yes 65percent 67percent 29percent 0percent 62percent
No 35percent 33percent 71percent 100percent 38percent
Total 100percent 100percent 100percent 100percent 100percent
Further those salary employed were disaggregated by the type of their employment and the result
indicates that 89 percent of permanent employees are satisfied with their current job where as 61 percent
and 63 percent of temporary and fixed term employees were not satisfied with their current job though
they did not mention their reasons. The responses of self employed beneficiaries were also analyzed in
terms of the type of their work. The analysis indicates that amongst unsatisfied beneficiaries 27 percent,
26 percent and 19 percent of them were engaged in agricultural, petty trades and cobblestone activities.
The other 28 percent of beneficiaries were engaged in barber and hair dressing (2 percent), café and
restaurant (8percent), cleaning (8 percent), waste disposal and weaver each 5 percent.
Summary
Among the total beneficiaries 94 percent of them participated in business awareness raising activities
and among these 92 percent of them were participated in experience sharing with best practice and other
types of business awareness raising activities. It is found that the support of CHADET and FSCE was
appreciated by 73 percent of beneficiaries. This indicates that the business awareness exercise needs
new strategy to increase the employment opportunities of beneficiaries’ because nearly half percentage
of participants were involved in different types of business awareness by their own initiation not by the
support of the two implementing partners. Moreover, the support of the two implementing partners
should be strengthened because significant number of beneficiaries had complained on the support of
CHADET and FSCE.
The financial supports provided to beneficiaries significantly vary from woreda to woreda. For instance,
77 percent and 73 percent of beneficiaries from Dera and Woreta woreda respectively obtained grant
while 64 percent and 82 percent of beneficiaries from Merawi and Tis Abay woreda obtained financial
support in terms of credit. But no reason was mentioned for such variation. So, for the future such
support should be provided equitably in order to avoid unnecessary despite or complaints among
beneficiaries and on the project.

76
Prior to joining the project about 71 percent of beneficiaries were engaged in hazardous job such as
commercial sex work, daily labor, no job and dancing. But after the implementation of the project, most
of them transferred to decent jobs as mentioned earlier. Among those beneficiaries who are engaged in
decent jobs, 80 percent of them said that their current job is safe for their health and 44 percent of them
said their current working condition is favorable. In addition to this, 62 percent of beneficiaries said
they are satisfied with their current job.

77
6. Conclusion and Recommendation
6.1 Conclusion
As indicated in the project document the overall objective of the project is to create improved
employment opportunities and social inclusion of the marginalized and vulnerable children and youth
involved in hazardous informal work in the Amhara Region, Northern Ethiopia.
From the findings of the study, in general, it can be concluded that, the project achieved the
aforementioned objective. More specifically, the profile of the graduates shows that the project could
address those vulnerable children and youths in accordance to the project criteria. In addition to this, the
project was somewhat successful in keeping gender balance, age, family background, level of education
as per the project requirement. However, the project benefited some beneficiaries who have opportunity
to be engaged in either income generating activities that they choose or be employed as compared to
beneficiaries who did not have opportunity to be trained in TVET or FTC and be engaged in their own
business or be employed
Moreover, those beneficiaries who graduated in either of field of specializations confirmed that the
trainings they were provided were relevant, important and make them competent in the labor market.
Because of this, the graduates are highly involved in the labor market as self employees and salaried
employees. In addition to this, significant numbers of beneficiaries were engaged in farming and waste
disposal management. It is apparent that these two types of jobs are not as such accepted by many
youths but these graduates show every job is respected. This shows that the project is working in
accordance to the government strategy and contributes to the government’s effort to reduce
unemployment. However, for self employees, lack of capital is the main factor that affected them to
start their own business. In this regard, the project was effective in empowering females to be engaged
their own business. This shows that lack of integrated efforts between the project implementers and
government pertinent bodies to provide seed money or initial capital either in the form of grant or loan
to graduates. On the other hand, some graduates became unemployed mainly due to limited job
opportunity, absence of job, lack of information regarding the type of business or job in which graduates
would be engaged and some of graduates were trained in the field in which they are not interested. As a
result of this, though graduates have interest and vision to be self employed, they could not achieve their
dream because they are not interested to be engaged in the field they were trained, lack the necessary
skills and self-confidence to involve in risk bearing businesses. In this regard, the project implementers

78
could not go further in providing information and build the capacity of their beneficiaries apart from
conducting some business promotion events. Finally, but importantly, it can be concluded that the
project was successful in not only enabling beneficiaries to be away from hazardous work but also in
improving their income.
Thus, in order to strengthen the good side of the project and to take corrective measures for some
observed gaps the following recommendations are forwarded.
6.2 Recommendations
The project funder-Save the Children and the two project implementers (FSCE &CHADET)
should take care of while recruiting beneficiaries by taking in to consideration their age and
vulnerabilities in order to use the meager resource to address the real needy people.
The project funder and the two implementers should work with the region’s MSE and MFIs to
alleviate working space and financial access problems.
Since beneficiaries do not have sufficient information regarding the business they want to be
engaged or the sector they want to be employed, the project implementers should have up to date
labor market information and provide the necessary counseling until they get job.
Some of the activities that beneficiaries are engaged are not sustainable and do not lead to further
growth. So, the funder and implementing partners along with pertinent stakeholder should
design a way to create job to beneficiaries that will lead them to further growth otherwise the
beneficiaries may back to their former hazardous job.
The two implementing partners should promote about the project objective and beneficiaries to
employers so that beneficiaries will get employment opportunities.
Many of beneficiaries became self employed not because they became entrepreneurs but they did
not get employment opportunities in the field they graduated because they might not be
competitive in the labor market. Thus, the funder and implementing partners should focus on the
quality of the training in order to change the life of beneficiaries.
Even if many of the respondents said that they are working in group, the qualitative data indicate
that such cooperatives do not exist. Thus, the donor and implementers should work on the
benefits of working in group.
79
REFERENCES
Amahra National Regional State (n.d). አብክመ የቴ/ሙ/ት/ሥ የሥራ ገበያ ፍላጎት ጥናት (2003-2004). Bahir Dar,
Amhara National Regional State, Ethiopia.
African Development Bank Group, African Union, and UN-Economic Commission for Africa (2013).
African Statistical Yearbook. Tunis and Addis Ababa, Ethiopia.
African Development Bank Group, African Union, UN-Economic Commission for Africa and UNDP
(2013). Assessing Progress in Africa toward the Millennium Development Goals, Food security in
Africa: Issues, challenges and lessons. MDG Report of 2013. Addis Ababa, Ethiopia.
Ministry of Finance and Economic Development (2012). Ethiopia’s Progress Towards Eradicating
Poverty: An Interim Report on Poverty Analysis Study (2010/11). Addis Ababa, Ethiopia.
International Monetary Fund (2012). The Federal Democratic Republic of Ethiopia: 2012 Article IV
Consultation—Staff Report; Public Information Notice on the Executive Board Discussion; Staff
Statement; and Statement by the Executive Director for Ethiopia. Washington D.C. USA.
UN Economic Commission for Africa (2013). Making the Most of Africa’s Commodities:
Industrializing for Growth, Jobs and Economic Transformation, ECONOMIC REPORT ON AFRICA
2013. Addis Ababa, Ethiopia.
WUSC SRILANKA (2012).Tracer Hand Book, A methodology for determining employment and income
results stemming from Vocational Training courses. SRILANKA
ILO International Programme on the Elimination of Child Labour (IPEC) (2011). Tracer study – Book 1
Methodology manual. Geneva, Switzerland
Edukans Foundation (2009). Technical Vocational Education and Training in Ethiopia, Mapping.
Learn4Work, Schokland Programme on TVET.Addis Ababa, Ethiopia.
L. Guarcello, S. Lyon, and F. Rosati (2006). The twin challenges of child labor and youth employment
in Ethiopia. Understanding Children’s Work (UCW) Project. University of Rome “Tor Vergata” Faculty
of Economics. Rome
Ethiopian Economics Association (2011). Report on the Ethiopian Economy. Addis Ababa, Ethiopia.
Ethiopian Economics Association (2012). Report on the Ethiopian Economy. Addis Ababa, Ethiopia.
Ethiopian Economics Association (2013). Report on the Ethiopian Economy. Addis Ababa, Ethiopia.
Ministry of Finance and Economic Development (2010). Growth and Transformation Plan. Addis
Ababa, Ethiopia.

80
Office of the Deputy Director General for Sectoral TVET Planning Office (2011). ‘Impact Evaluation
Study of TVET programs.’ Technical Education and Skills Development Authority (TSEDA). Taguig
City, Metro manila.
Kahase Gebremedhin Gebregziabher (2011) A survey study on the link between automotive technology
training program and the labor market demand in Tigray Region: The cases of four selected Technical
and Vocational Education and Training Institutions. Thesis submitted for partial fulfillment of the
requirements of degree of master of arts in management of vocational education. Addis Ababa
University. Addis Ababa, Ethiopia.
Ermias Tizazu, Netsanet Demsis, Meaza kefeni, and Ehitnesh Kelem (2012). TVET Graduates Tracer
study from 2008/9 to 2011. Admass University College, Faculty of business, Department of
management. Addis Ababa. Ethiopia.
Central Statistics Agency (n.d). Estimated Population of Ethiopia for 2012. Addis Ababa, Ethiopia.
Magnani, Robert. Sampling Guide. Arlington, Va.: Food Security and Nutrition Monitoring
(IMPACT) Project, ISTI, Inc., for the U.S. Agency for International Development. January,
1999
NICHE, (2010). NICHE strategy on Technical and Vocational Education and Training (TVET).
Netherlands organization for International Cooperation in Higher Education. Netherlands.
Bernd Sandhaas and Helmut Winkler (2011). An Analysis of Needs and Experiences of Employers with
Technical Personnel in Ethiopia with Special Emphasis on Technicians (Level 5 NTQF), Final Report .
Commissioned by Ministry of Education (MoE) and KfW German Development Bank. Addis Ababa /
Rosdorf / Vellmar / Kassel
Pramila Krishnana and Irina Shaorshadze (2012). Technical and Vocational Education and Training in
Ethiopia. Paper for the International Growth Centre – Ethiopia Country Programme

81
APPENDICES
Questionnaire for TVET& Farmer Training Center Graduates
Informed Consent Form
My name is ………………………………………….……. I am from Nucleus Health & Social Affairs
Consultancy which is delegated by Save the Children International. Save the Children International has
planned to conduct a Tracer Study on Education for Youth Employment (EYE) - BREAKING
POVERTY THROUGH PROTECTION AND INVESTING IN DECENT EMPLOYEMNET FOR
VULNERABLE CHILDREN AND YOUTH project that has been implemented for the last three years
in Amhara Region. The aim of this study is to assess the employment status and conditions of youth
who were trained with financial support of the project. It also aimed at generating information on the
competitiveness of TVET/ FTC graduates, their income level and common employment destinations.
We are kindly requesting your permission for participation in this study. The information you provide us
is really useful for the project implementers, donors, stakeholders, and to the beneficiary in particular as
it will be used for understanding of the existing employment status and conditions of youth related
problems and for further planning and intervention activities.
The interview will take around 40 minutes, and if you are willing to participate, I can assure you that no
harm is going to happen upon you or any of your family members directly or indirectly. The information
will also remain confidential and will not be used for any other purposes other than this one.
Participation is voluntary and you can withdraw from this interview or you can ask whatever questions
you may have at any time between the discussions.
Would you be willing to participate?
Yes: ……………………….1 (Please, continue the interview)
No: ………………………..2 (Thank the respondent and STOP)
Interview Information
Date of interview: (dd/mm/yyyy) ____/_____/______
Interviewer's name__________________________Signature__________________
Name of supervisor__________________________Signature__________________
Instruction

82
This tracer study is sponsored by Save the Children. You are chosen randomly among youth, who were
beneficiary of the project through CHADET or FSCE project. I will ask you some questions regarding
your daily activities and the changes in your livelihood as compared to your previous live. I am kindly
requesting you to answer each question with the best of your knowledge. Your kind cooperation is vital
for the success of this study and will be therefore highly appreciated. Your responses will be restricted to
this research use only. Your name will not appear in any public documents. Thank you very much for
your cooperation.
No. Questions Coding Categories Skip To
Section 1: Area Identification
1.1. Zone
1.2. Woreda
1.3. City/town
1.4. Kebele/ PA
2. Personal Details
2.1. Sex of the respondent Male
Female
1
2
2.2. Age of the respondent in years
2.3. Marital status Married 1
Single 2
Divorced 3
Widow/widowed 4
2.4. Family size Male _____Female
_____ Total__
2.5. What was your family background? Separated parents
Poor family
Single parent
Couple parent
No parent at all
Others
(specify)_____________
_
1
2
3
4
5
6
2.6. What is your educational attainment? Illiterate
Can read and write
Primary education (1st
cycle: 1-4)
Primary education (2nd
cycle:5-8)
General secondary
education(9-10) TVET
Preparatory education
College /university
education
1
2
3
4
5
6
7
8

83
No. Questions Coding Categories Skip To
2.7. In which year did you graduate from the
TVET/FTC Programmes?
2010 1
2011 2
2012 3
2013 4
3. Occupational Status of the Respondent
3.1. Which skills training did you attend under
the project?
TVET 1
FTC 2
Did not
attend any
training 3
3.2. What is your field of specialization?
3.3. What is your current employment status?
Self employed
Salary employed
Unemployed
Others
(specify)____________
_
1
2
3
3.4. If you are salary employed, which one is
your employer?
Government institution
Private institution
NGO
Cooperatives
Others
(specify)____________
1
2
3
4
3.5. If you are employed, what is your
employment status?
Permanent employee
Temporary employee
Fixed term
1
2
3
3.6. If you are self employed, what is the type of
business you are engaged in?
3.7. If you are self employed, please specify the
arrangement.
Individual
Group business
1
2
3.8. If you have group business, how many
graduates are in your group?
3.9. When did you start your current job?
3.10. If salary employed how much do you earn
per month?
3.11. What was your previous job before joining
the project?
4. Technical Support
4.1. How long was the duration of the
TVET/FTC trainings?
5-10 days
10-20 days
A month
Forty five days
Three months
More than three months
1
2
3
4
5

84
No. Questions Coding Categories Skip To
4.2. In your opinion, how was the duration of
the training?
Not enough
Enough
More than enough
1
2
3
4.3. How important was the trainings you
received?
Not important
Somewhat important
Important
Very important
1
2
3
4
4.4. If the trainings are important/very
important, to what extent do they develop
your vocational and technical skills?
Not all
To some extent
Sufficiently
To high extent
1
2
3
4
5
4.5. If they are not important/somewhat
important, what is the reason? Because
The trainings were
focus on the theories
The trainings did not
include enough practices
They were too short
Others______________
_______
1
2
3
4.6. Was the skills training relevant and
effective for the activity you are currently
engaged in?
Yes
No
1
2
If No Skip to
4.8
4.7. Are you currently working directly related
with your skills training you received?
Yes
No
1
2
4.8. If no why?
4.9. Have you ever received BBS trainings other
than vocational skills trainings?
Yes
No
1
2
If No Skip to
4.11
4.10. If yes, how important was the training you
received?
Not important
Somewhat important
Important
Very important
1
2
3
4
4.11. If no, why?
4.12. Was the BBS training relevant and effective
for the activity you are currently engaged
in?
Yes
No
1
2
If No Skip to
4.14
4.13. Are you currently working directly related
with your BBS training you received?
Yes
No
1
2
4.14. If no why?
4.15. Does the training you took make you
competitive or better in the business
endeavor you are engaged in?
Yes
No
1
2

85
No. Questions Coding Categories Skip To
4.16. If no competitive why?
4.17. Did you attend apprenticeship? Yes
No
1
2
4.18. If no why?
4.19. Where are you doing your apprenticeship? Private Institutions
Government
Organizations
Others, Please
specify-----
1
2
3
4.20. How long is your apprenticeship for? 1 Month
Up to 3 months
Up to 6
months
Up to a year
4
More than a
year
1
2
3 5
4.21. Is your apprenticeship in the same field as
you were trained in?
Yes
No
1
2
4.22. What are you going to do after this
apprenticeship?
Look for a job with an
NGO or Gov
Look for a job with in
this business
Look for a job with in a
different business
Start my own business
Go home
Pursue further
vocational training
Go back to school
Others
(specify)____________
1
2
3
4
5
6
7
8
4.23. What is your actual earning per month?
Less than 200
201-300
301-400
401-500
501-600
If above 600,
Specify _____
1
2
3
4
5

86
No. Questions Coding Categories Skip To
4.24. In which market linkage do you
participated?
Business promotion fair
Business exhibition
Experience sharing with
best practitioners
Other (specify)-----------
------------
1
2
3
4.25. Did either of the above mentioned business
awareness activities contributed for your
business success?
Yes
No
1
2
4.26. If no, why?
4.27. How would you rate the contribution of
CHADET/FSCE in facilitating/supporting
these business awareness raising activities?
High
Medium
Low
No role at all
1
2
3
4
4.28. As compared with your previous work do
you feel that your current job is safer for
your health?
Yes
No
1
2
4.29. If no, why?
4.30. If you started your current job in the past
three years, were you doing another work
before?
Yes
No
1
2
If No Skip to
4.28
4.31. If Yes, where did you carry out your work? Family dwelling
Employers house
Government office
Construction cite
Street
Shop/market
Farm
Hotels and restaurant
Others
(specify)____________
1
2
3
4
5
6
7
8
9
4.32. How would you rate your current working
condition?
Unfavorable
Somewhat
favorable
Favorable
1
2
3

87
No. Questions Coding Categories Skip To
4.33. Are you satisfied with your current business
or job?
Yes
No
1
2
4.34. If no why?
4.35. How long did it take you to get a job after
completing your training?
4.36. If you are currently unemployed, what are
the difficulties you encountered in looking
for a job after training?
Employers not
interested in my level of
qualification
Employers not
interested in my area of
specialization
Lack of work
experience
Limited employment
opportunities
Absence of Jobs
Illness to work
Do not try to find
employment
Lack of
connectedness/social
network
Others
(specify)____________
___________
1
2
3
4
5
6
7
8
9
4.37. Have you ever made effort to start your
own business?
Yes
No
1
2
4.38. What were the problems that you faced to
start your own business?
Lack of financial capital
and tools
Lack of skills and
experiences
Lack of confidence
Engaged in child rearing
or household care
Social pressure and
traditional customs
Absence of working
place
Others
(specify)____________
________
1
2
3
4
5
6
7
4.39. Has CHADET/ FSCE assisted you in
searching for job?
Yes
No
1
2
If No Skip to
4.37

88
No. Questions Coding Categories Skip To
4.40. If yes, what type of support this project
provided to you?
4.41. If no, what was the reason?
4.42. How do you assess the support provided by
CHADET/FSCE?
Very good
Good
Satisfactory
Not satisfactory
1
2
3
4
5. Economic Support
5.1. Have you ever received any
financial/material supports from the project?
Yes
No
1
2
If No Skip to
6.1
5.2. If yes, what type of support have you
received?
Credit
Grant
Agricultural tools /materials
in kind
Others
(specify)_______________
_
1
2
3
4
5.3. If credit, how much money you borrowed?
5.4. What was the role of CHADET/FSCE to
create access to finance?
Develop business plan
Negotiation/Lobbying
Other(specify)___________
________
1
2
6 Cash income and wealth status
6.1.
How is the current situation with respect to
cash income you earn as compared to what
you earn before joining this project?
Greatly improved
Somehow improved
Has stayed the same
declined
1
2
3
4
6.2. If your cash income is greatly/somehow
improved in the last three years, what kind
of assets have you acquired?
Thank you very much for your cooperation

89
“Breaking Poverty through Protection and Investing in Decent Employment for Vulnerable Children
and Youth”
Terms of Reference for the 2013 Tracer Study
Background
Save the Children is the world's leading independent organization for children. In Ethiopia, it operates
across all regions with a vision of creating a world in which every child attains the right to survival,
protection, development and participation. Its mission is to inspire breakthroughs in the way the world
treats children, and to achieve immediate and lasting change in their lives.
Save the Children is currently implementing seven thematic programs operating in all regions of the
country through its 39 field offices. Education is one of the seven thematic areas whereby Save the
Children is working to address the educational needs of children.
Education for Youth Employment (EYE) is a subtheme in education that focused on realizing the full
potential of youth by empowering them both socially and economically.
Project Description
Under the EYE subtheme, Save the Children has been implementing a project entitled “Breaking
Poverty through Protection and Investing in Decent Employment for Vulnerable Children and Youth”
in Amhara Region in partnership with local NGOs namely CHADET and FSCE.This is a three year
project (December 2010-December 2013) implemented in Woreta, Dera and East Estie woredas of
South Gondar zone and in Bahir Dar and the transit town of Tis Abay, Adet and Merawi of West Gojjam
zone through a fund obtained from EU.
The general objective of the project is to improve employment opportunities and social inclusion of the
marginalized and vulnerable children and youth involved in hazardous informal work in the Amhara
Region. While the specific objectives are:
Marginalized children and youth involved in the hazardous informal sector have increased access
to decent employment opportunities in Bahir Dar and the surrounding transit towns and South
Gondar Zone

90
Social protection Merawinisms are introduced in communities to create safe employment
opportunities for marginalized children in Bahir Dar and the surrounding transit towns and in
South Gondar Zone.
The project has five expected results:
Result 1: The micro business and employment opportunities are analyzed; the target group’s skills,
needs and capacity are mapped; training providers and their capacities assessed and education or
employment support structures identified
Result 2: 3000 marginalized children and youth have skills, knowledge and ability to access and retain
decent employment
Result 3: Communities, employers and government support marginalized children and youth in
accessing and retaining decent employment
Result 4:Children and youth are functioning as change agents and are influencing key stakeholders on
the potentials and capacities of marginalized children and youth, their employment needs and safe
working environments and social inclusion.
Result 5: Social protection structures for marginalized children and youth strengthened and established
Purpose of the study
This tracer study is intended to generate information on the employment status and conditions of
youth/children trained and supported financially (all beneficiaries) under the economic empowerment
component) under the project. It also aimed at generating information on the competitiveness of TVET
graduates, their income level and common employment destinations. This report will also be used to
inform the final project evaluation and TVET programming as whole.
The Tracer Study is expected to answer the following key questions:
What percentage of TVET graduates has become employed, self employed, or are in other forms
of income generating activity?
What is the average level of income for beneficiaries, and has they improved their income
compared to before their enrolment in income generation? If yes, in what percent? If not, why?
91
To what extent are beneficiaries in the economic component of the project competitive on the job
market?
How well have the training and support given by the project helped the transition from hazardous
work, to decent employment?
To what extent the training is relevant and effective to youth to be employed/self employed?
What employment destinations have the training graduates found?
To what extent are beneficiaries being satisfied with the skills training?
Scope of study
The overall focus of the analysis will be the trainings and employment support (wage and self) provided
under the project with respect to graduates’ employment, competitiveness, income and ability to move
from hazardous jobs to decent and gainful employment. Specifically the study will;
Identify employment destinations/career paths of the project beneficiaries, factors determining
their careers and performance in their different career destinations.
Analyze employment rate and types (Self and wage employment (formal & informal),
unemployment/idleness, apprenticeships, training or educations,
Determine average incomes, links between training and support received and increase in income,
and effects on their general life situation including the ability to move away from hazardous
work to decent employment
The duration of finding a job after training, job retention rates, career differences by gender,
match between training and jobs taken up as well as overall economic and social empowerment
of the graduates.
Analyze factors affecting efficiency and relevance of training and employment support provided
by the TVET, Farmers Training Centers, apprenticeships, and partners’ employment support and
determine factors inhibiting unemployed graduates.
Review and evaluate the effectiveness and relevance of the training and employment support
from both the graduates and employers’ perspectives to assess whether trainees get the quality of
training that matches job situations and standards
Make recommendations for improving employment opportunities and competitiveness of TVET
graduate as well as effectiveness and relevance of the training

92
The target population of the study will be youth who have benefitted from training and or
employment/self employment support during 2011, 2012 and 2013 . Geographically, the study will
cover East Estie and Dera, Woredas, Bahir Dar town and the transit towns (namely Tis Abay, Adet,
Woreta and Merawi). The study will target on 2011 and 2012 graduates.
Methodology
The study will have a cross-sectional study design with mixed research methods.
Literature review: The consultant is required to review literature, including project reports and analysis
reviews, as well as relevant secondary from partners and external sources.
Data Collection instruments: The consultant shall design standard data gathering instruments and
submit to SC for review, among others a detailed quantifiable questionnaires and structures and semi
structured interview guides. The instruments shall include both qualitative and quantitative data
collection tools. The instrument could be either adopted or self developed.
Field work: The consultant is expected to conduct filed work for collection of data covering all
geographical project sites during the field work, and must ensure a satisfactory number of enumerators,
to ensure a thorough and detailed data collection.
Data Analysis: Quantitative data will be analyzed using SSPS and qualitative analysis will be analyzed
through thematic approach.
Data samples and respondents: The study will have representative sample size of youth from the
different sub target groups who have received skills training from the TVET and Farmers Training
Centers (FTC). It is important that the sample is representative in terms of youth having:
finalized TVET and received financial support, and the ones who have not
apprenticeships after TVET and not received this
wage or and self employment
farmers’ training
The sample must likewise ensure a sample that include a representative number of beneficiaries from the
different types of TVET and farmers training, as well as geographical locations.
Likewise the consultant must include employers from a representative number of sectors
93
Expected outputs
The consultant is required to deliver the following as per the deadlines:
A detailed proposal for how to carry out the Tracer Study, including sampling frame before
commencement of the task, to be validated by a Save the Children Reference Group
Inception report within ten days of the advertisement
Training guidelines for enumerator and team leader training if applicable
Enumerator and team leader training
Data collection tools
Raw data entered into SPSS soft ware
Submission of first Draft Final Report containing all written deliverables to the TVET Project
Manager, delivered in 3 printed copies
Revised first Draft Final Report, incorporating suggestions and recommendations from the
Reference Group. A second round of revision may be required before the final version of the
Final Report can be produced. (5 printed copies)
Final Report (5 printed copies, one electronic copy in PDF Format and one in DOC format)
Submission of all data files to the Save the Children Reference Group in printed as well as in
electronic format
Preparation of presentations for reference groups meetings
Schedule/Time frame
The maximum time frame given to conduct the study, finalize the task and submit the final report is 45
days after the agreement is signed with the consultant. The major timelines for taking the study shall be;
Activity Timeframe
Compile and submit inception report: May 27, 2013
Development and approval of data collection tools and field work plan May 30,2013
Data collection in the field: June 3-17, 2013
Data cleaning and data entry June 18-24, 2013
Produce and submit the draft report for review and comment: July 3, 2013
Incorporate comments and submit final report: July 10, 2013

94
Study team
This study is open for all legally registered consultant firms. The firm shall consist of professionals of
various professional and relevant backgrounds.
Qualifications and expertise required
Qualified candidates for the assignment must have:
A team of post-graduate degree in Education, Economics and Social work / Sociology /
psychology
Minimum of 5 years relevant professional experience in research
Good understanding and experience in vocational skills training programs,
Strong experience in research that links TVET with youth wage and self employment
Understanding of the Ethiopian education system particularly the TVET
Excellent communication and report writing skills in English
Knowledge of Amharic
Terms and Conditions
Code of conduct: Because Save the Children's work is based on deeply held values and principles, it is
essential that our commitment to children's rights and humanitarian principles is supported and
demonstrated by all members of staff. Save the Children's Code of Conduct (COC) sets out the standards
which all staff members must adhere to. The consultant will be expected to adhere to the COC.
Additional terms and conditions of service shall be spelt out in the contract.
Mode of Application
Applications with non returnable copies of CVs, testimonials and sample of previous work should be
submitted on or before 10 May 2013 and via email to [email protected] or
through P.O.Box 387, Addis Ababa, Ethiopia.
The application should include the following;
Cover letter
Company profile(s) and documentation of legal status , and registration as a company

95
Technical proposal : The technical proposal should include (i) explanation about the Consultant
with particular emphasis on previous experience in this kind of work; as well as individual
CVs(ii) profile of the Consultants to be involved in undertaking the evaluation, (iii)
Understanding of the TOR and the task to be accomplished, (iv) draft evaluation frame work and
plan, including Suggested methodologies and outlines for Tracer Study, timeline and activity
plan, an indicative time-table for executing the project as per the format below presented in table
Financial Proposal: The financial proposal should provide cost estimates for services rendered
including daily consultancy fees. The consultant has to cover all field related costs
(accommodation, air tickets, food and other related costs).
Accurate bank details and currency of the account