tracking climate aid in malawi: results from pilot program on geomapping and climate coding justin...
TRANSCRIPT

Tracking Climate Aid in Malawi:
Results from Pilot Program on Geomapping and Climate Coding
Justin Baker, University of Texas at Austin([email protected])
Christian Peratsakis, Development Gateway ([email protected])
Kate Weaver, University of Texas at Austin ([email protected])

Tracking Climate Aid in Malawi
Driving Questions:– How is aid addressing climate vulnerability in
Malawi?– Is aid going to the places/areas/people most in
need?– How does our tracking method compare to other
methods (pilot study of tracking methodology)?– Can this methodology extended to other
situations?

What did we do?
• Partnered with Ministry of Finance in Malawi and Development Gateway (Aid Management Platform system) to gain access to available project documents across donors in Malawi.
• Geocoded all aid projects in AMP system• Coded all projects for climate adaptation aid,
using own methodology • Used project documents where possible, coded
at the activity level, rather than the project level

Geocoding
• Identify multiple activities within aid projects
• Subnational location of aid activities (8 levels of proximity)
• Sector tags• Donor tags
• Layer indicators (e.g. aid activities on top of poverty levels)
• Interactive map on CCAPS Dashboard http://strausscenter.org/ccaps/
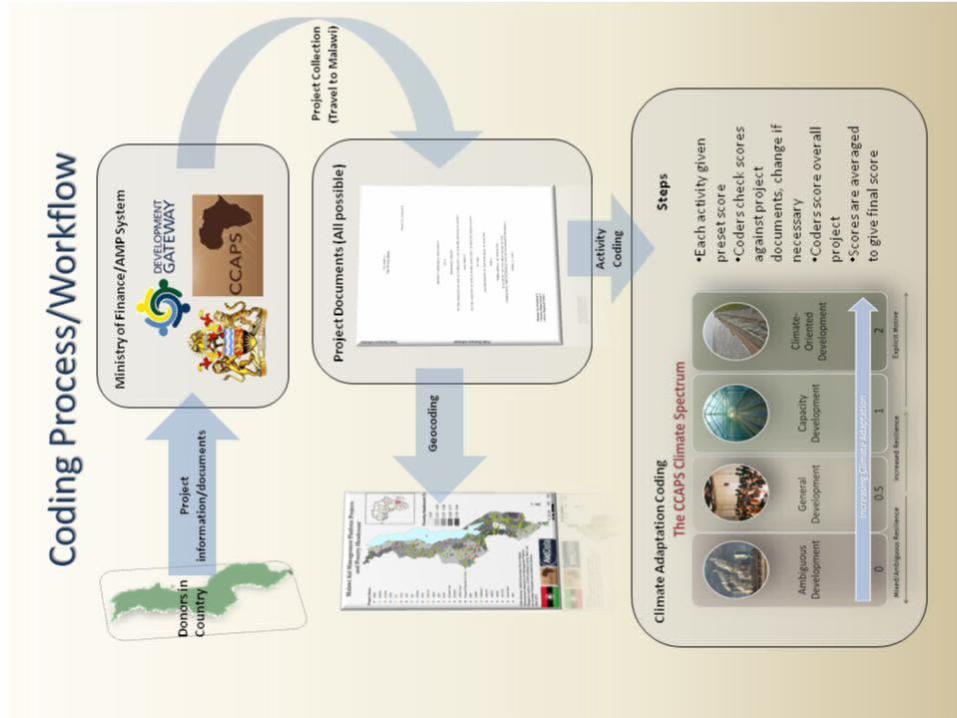
Climate Coding - Process
SHOW PORTRAIT FLOWCHART

•Activities coded between four ‘poles’ (definitions available)•Weighted scores give continuous numerical score, which can be placed back on spectrum for comparison•Numbers deliberately chosen to facilitate comparison to OECD Adaptation Markers•Coding at activity level gives greater ‘granularity’ (insight into where money is actually being spent)•Most detailed analysis possible (without detailed budget information, etc)•Uses established method of AidData activity coding
Coding Process (continued) - Rationale

Climate and Geocoding
•How targeted is climate aid?•Overlay on CCAPS Vulnerability Team maps•Need refinement for Malawi-specific vulnerability
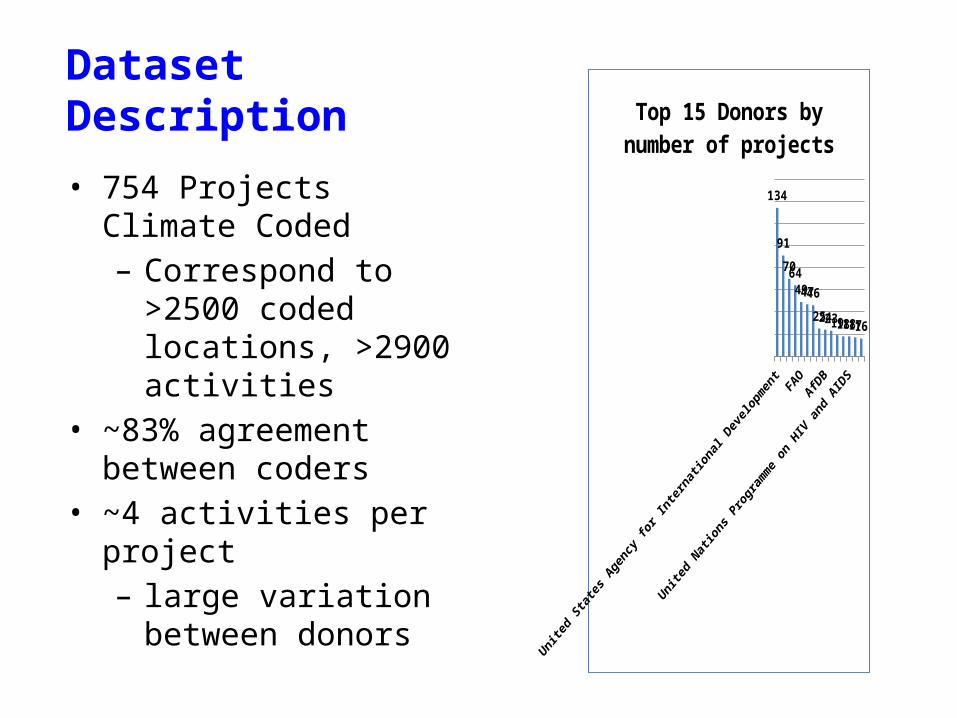
Dataset Description
• 754 Projects Climate Coded– Correspond to >2500
coded locations, >2900 activities
• ~83% agreement between coders
• ~4 activities per project– large variation between
donors
United St
ates A
gency
for Inte
rnati
onal Deve
lopment
United N
ations D
evelopment P
rogra
mme
Euro
pean Union
Irelan
d
United N
ations P
rogra
mme on HIV and AIDS
134
91
7064
494746
2524231918181716
Top 15 Donors by number of projects

Project Findings
The distribution of climate scores changes according to how it is viewed. Interestingly, there is not a significant difference overall between the number of CD/CO projects and CD/CO dollars committed. Yet there is variation within donors.
% by activity % by projects % by Dollars Commited
0%
10%
20%
30%
40%
50%
60%
70%
80%
90%
100%
1 2 2
7280 79
2114 18
6 4 1
Climate Score distribution viewed by: # of activities, by # of projects, by financial
amounts
COCDGDAD
The distribution is dominated by general development projects, even after projects have been weighted for activity scores. This is likely due to emphasis on health, infrastructure, budget support sectors.
0.0000.148
0.2960.444
0.5930.741
0.8891.037
1.1851.333
1.4811.630
1.7781.926
0
100
200
300
400
500
600
0.00%
20.00%
40.00%
60.00%
80.00%
100.00%
120.00%
Distribution of Final Weighted Scores
Frequency
Cumulative %
Final Score
Freq
uenc
y

$0
$20,000,000
$40,000,000
$60,000,000
$80,000,000
$100,000,000
$120,000,000
$140,000,000
$160,000,000
$180,000,000
Capacity Development
Climate Oriented
0
2
4
6
8
10
12
14
16
18
20
Capacity Development
Climate Oriented
Distribution of Climate Aid by DonorNumber of Climate Projects across Donors (all Climate Projects)
Only climate aid (CO, CD), by US$ commitment amount (Top 20)
By number of projects and commitment amounts, we see USAID, the European Union, the World Bank, and Norway near the top in each case.Ireland also shows strong climate adaptation emphasis, yet does not have the same resources as the others).
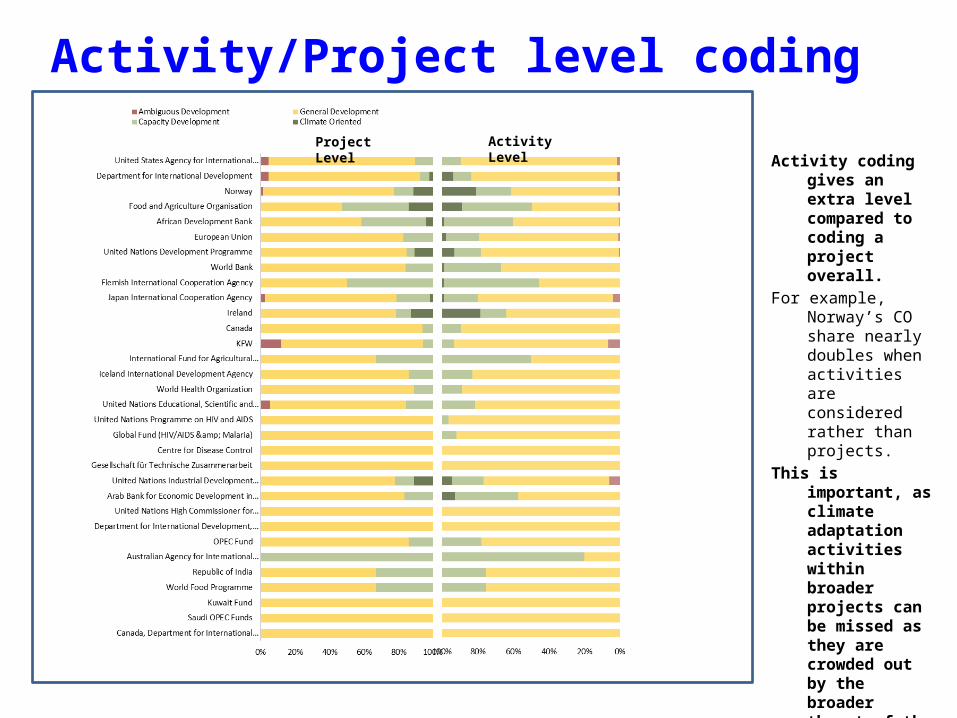
Activity/Project level coding
Activity coding gives an extra level compared to coding a project overall.
For example, Norway’s CO share nearly doubles when activities are considered rather than projects.
This is important, as climate adaptation activities within broader projects can be missed as they are crowded out by the broader thrust of the project.
Project Level Activity Level

$0 $500,000,000 $1,000,000,000BADEA2Kuwait FundIFAD2CanadaGIZ2OPEC FundUNDPKFWUNHCRJICAMulti-Donor Trust FundRepublic of IndiaWorld Food Program (WFP)NorwayAfDB2World BankGlobal FundUSAIDDfID2European Union
$0$500,000,000$1,000,000,000
Ambiguous Development
Capacity Development
Climate Oriented
General Development
Committed Financial AmountsBy Project By Activity*
(Millions of Dollars)
*Activities were assigned financial amounts by dividing each project amount by the number of activities contained by the project.
*~3% of project commitment amounts are not available on the AMP system currently.

Financial Commitments vs Activity Numbers
AfDB2
Australian Agency for International Development
Canada, Department for International Development, Norway, World Bank
Department for International Development, KFW, Norway, UNFPA, World Bank
European Union
FICA2
Global Fund (HIV/AIDS & Malaria)
International Fund for Agricultural Development
Japan International Cooperation Agency
Kuwait Fund
OPEC Fund
Saudi OPEC Funds
United Nations Educational, Scientific and Cultural Organisation
United Nations Industrial Development Organisation
United States Agency for International Development
World Bank
0% 10% 20% 30% 40% 50% 60% 70% 80% 90% 100%
Percent by number of Activities
0% 10% 20% 30% 40% 50% 60% 70% 80% 90% 100%
Percent by Dollars Committed per ac-tivity
Climate Oriented
Capacity Development
General Development
Relying on numbers of projects alone can be misleading, as financial data gives better insight into the breakdown of projects. Ideally, activity-level budget information would allow the most detailed and rigorous assessment of adaptation funding within development projects. Huge variation in scope and resources of donors, therefore solid financial commitments and disbursements are necessary for an accurate picture of aid.

Sector Analysis
Maternal Health
Food aid/Food security programmes, activity unspecified
Credit lines, FSFIs
Irrigation
Malaria control
Public sector financial management, specified
Health policy and administrative management, activity unspecified
Agricultural inputs, activity unspecified
Testing, STDs
Contraceptives
Infant and child health
Tuberculosis control
STD and HIV/AIDS, activity unspecified
Prevention, STDs
Treatment, care, STDs
All other activities when sector is not specified
All emergency food aid items or activities
Support for implementation of macroeconomic reforms
Road infrastructure, road vehicles
General budget support, activity unspecified
$0 $100,000,000 $200,000,000 $300,000,000
•Top sector is general budget support, activity unspecified
•Impossible to code well•Transparency of activity• >$400 million in unspecified aid altogether (~7%)
•Within specified sectors, focus is largely on health, with some infrastructure and food aid.
Top Activity Codes by Financial Amount Committed

Formal education/training, Agriculture
Institution capacity building, Agriculture
Irrigation
Environmental policy, laws, regulations and economic instruments
Agricultural services
Food crop production
Basic water supply, low-cost technologies
Agricultural extension
Water sector policy, planning and programs
Agricultural sector policy, planning and programmes
Water supply and sanitation - large systems, activity unspecified
Soil improvement
General environmental protection, activity unspecified
Supply of seeds
Agricultural co-operatives
0 10 20 30 40 50 60
Top 15 Activities by Climate Code (number of projects)
Capacity Development Climate Oriented
Top Activities in AMP Portfolio
• Sectors with most climate projects are unsurprising: Water & Irrigation, Agricultural training, Environmental Protection, etc.

Comparison to OECD Adaptation Marker2010 OCED Adaptation Marlers recorded only 42 projects as having “significant” (1) or “primary” (2) adaptation content. - Large variation in reporting practice makes it nearly
impossible to match up AMP projects (reported in country) with OECD projects (different titles, ID numbers, different languages).
- Missing Data: Some donors missing from AMP; many donors missing from OECD Adaptation Marker reporting
Greece
Netherlands
Luxembourg
Switzerland
Spain
Sweden
Belgium
Ireland
Germany
United Kingdom
EU Institutions
0 50 100 150 200 250 300
2010 Committed Aid reported to OECD, Rio Markers [excludes unmarked aid]
012
Furthermore, we noted several problems even within the small number of coded projects:
- Inconsistency – many donors, including the United States, did not report any marked projects at all (unlikely that the US did not have any adaptation-related projects in 2010)
- Over-coding –e.g. Denmark projects on Democratic Participation and Basic Health Care.
Germany
Canada
EU Institutions
Japan
Finland
Sweden
Norway
United Kingdom
Belgium
Ireland
Denmark
Distribution of ‘1’ and ‘2’ Projects across Donors
12
91%
9%
1%

Analytical Findings
• Breakdown by financial amount, number of activities, or number of projects yield different results– Higher variation would be expected with more detailed and accessible
project documents
• Climate aid (narrowly defined) makes up just 1-2% of aid to Malawi. This is consistent with our previous analysis of adaptation aid across Africa
• Norway, the World Bank, USAID, and the European Union are among the donors most involved in adaptation aid. Japan and Ireland have several adaptation-related projects, yet their financial contributions are much smaller than the others mentioned.

Lessons
• Variation in quality and quantity of donor reporting constrains coding efforts
• Updated, activity-level budget information would be ideal standard for use in tracking climate aid
• OECD Rio and Adaptation Marker reporting practices still problematic
Geocoding and Aid Transparency:Maps, Gaps, and Traps
• Maps– What we cannot tell from looking at maps
• Transparency Gaps– Holes in data– Inconsistencies (project IDs, titles, etc)– Lack of consistent and timely disbursement data– Lack of detailed/activity level budget
• Transparency Traps– Politicization of reporting (self-reporting creates credibility issues)– Maps are not comprehensive and difficult to keep updated, limiting utility for aid
coordination and country level budget management and planning.– Limited to ODA donors. Need NGO, government and CSO tracking to capture full
picture of adaptation work in countries.– Tracking channels of delivery/implementation partners needed to follow money and
effectively evaluate allocation and impact