tracking in cell and developmental biology -
TRANSCRIPT
Tracking in Cell and Developmental Biology
E. Meijering, O. Dzyubachyk, I. Smal, W. A. van Cappellen
Seminars in Cell and Developmental Biology, vol. 20, no. 8, October 2009, pp. 894-902
Abstract: The past decade has seen an unprecedented data explosion in biology. It has become evident that in orderto take full advantage of the potential wealth of information hidden in the data produced by even a single experiment,visual inspection and manual analysis are no longer adequate. To ensure efficiency, consistency, and completenessin data processing and analysis, computational tools are essential. Of particular importance to many modern live-cellimaging experiments is the ability to automatically track and analyze the motion of objects in time-lapse microscopyimages. This article surveys the recent literature in this area. Covering all scales of microscopic observation, fromcells, down to molecules, and up to entire organisms, it discusses the latest trends and successes in the developmentand application of computerized tracking methods in cell and developmental biology.
Keywords: Live cell microscopy; cell tracking; particle tracking; image analysis; pattern recognition.
1 Introduction
It has been increasingly recognized in recent times that life is a miraculous symphony [1]. From fastmetabolic pathways to the cell cycle, to the beating of the heart, all the way to annually repeating seasonalbehaviors, life is composed of a multitude of interconnected oscillations, together constituting a giganticorchestra spanning at least 10 orders of time magnitude. Recent investigations seem to suggest that carefulcoordination of these rhythms and their interactions is an important precondition for the maintenance ofnormal development and health. Conversely, a disturbance at any level of this intricate time network canbe expected to result in disease. Although it is not our purpose here to discuss the interesting findings ofchronobiological investigations, they do emphasize the importance of studying life’s processes in both spaceand time [2], that is, to analyze their structure and function.
The ability to visualize cells and subcellular dynamic processes in space and time has been made possible byrevolutionary developments in imaging technology in the past two decades. Advances in molecular biology,organic chemistry, and materials science have resulted in an impressive toolbox of fluorescent proteins(GFP and variants) and nanocrystals (quantum dots), and have enabled the study of protein expression,localization, conformation, diffusion, turnover, trafficking, and interaction [3, 4]. On the hardware side,advances in optical systems design have taken light microscopy from widefield to (multiphoton) confocaland spinning disk microscopy [5, 6], and more recent efforts to break the diffraction barrier have furtherextended the palette [7,8]. Together, these developments have redefined biological research by enabling theswitch from fixed to living cells and from qualitative to quantitative imaging [2,9].

TRACKING IN CELL AND DEVELOPMENTAL BIOLOGY 2
As was to be expected, the new possibilities offered by these developments to image (sub)cellular processesin space, time, and at multiple wavelengths, have resulted in a true data explosion. It has now become evi-dent that in order to ensure efficiency, consistency, and completeness in handling and examining the wealthof image data acquired in even a single experiment, computational image management, processing, andanalysis methods are indispensable [10–18]. Thus, it seems that the bottleneck in putting modern imagingtechnologies to high-throughput use, has shifted from the “wetware” and the hardware to the developmentof adequate software tools and data models. While the need for such tools has been recognized for a longtime in the medical imaging communities, and advanced image processing, computer vision, and patternrecognition methods have been developed in the past 30 years to enable computer assisted diagnosis in vari-ous clinical applications [19–21], it is only since relatively recently that similar methods are being exploredto facilitate automated image analysis in biological imaging [22,23].
This article briefly surveys the latest trends and successes in the endeavor to take full advantage of thevast amounts of image data acquired in biological imaging experiments. The emphasis is on tracking andmotion analysis of objects in time-lapse microscopy images. Updating previous surveys, aimed at engineers[16,24,25] or biologists [17,26,27] from different perspectives, we cover tracking at all scales of microscopicobservation, from molecules, to cells, to organisms. In view of the rapid developments in the field, andbecause of space limitations in the present article, we consider only (a subset of) works published sincethe year 2000. First, we give an overview of recent cell segmentation and tracking algorithms, which inmany experiments constitute the basis for further analyses. In the subsequent sections, we shift focus in twopossible directions: from cells down to molecules (capturing the trajectories of intracellular particles), andfrom cells up to organisms (following embryogenesis and adult locomotory behavior). The article hopefullyserves as a useful source of pointers to the relevant (mostly methodological) literature on tracking for a widevariety of applications in cell and developmental biology.
2 Cell Tracking
Being the fundamental units of life, cells are the key actors in many biological processes. Cell prolifera-tion, differentiation, and migration are essential for the conception, development, and maintenance of anyliving organism. These processes also play a crucial role in the onset and progression of many diseases.Understanding physiological processes in health and disease and developing adequate drugs requires theimaging and analysis of the (morpho)dynamic behavior of single cells or cells in tissues under normal andperturbed conditions [28]. This typically involves the tracking and quantification of large numbers of cellsin time-lapse fluorescence, phase-contrast, or intravital microscopy data sets consisting of hundreds to manythousands of image frames, making manual analysis no option, especially in 3D.
The automation of these tasks faces several challenges, including the generally poor image quality (lowcontrast and high noise levels), the varying density of cell populations due to division and cells entering orleaving the field of view, and the possibility of cells touching each other without showing sufficient imagecontrast. Many computerized methods for cell tracking have already been proposed, and some of these havefound their way to commercial and open-source software tools (summarized in [29]), but the consensusarising from the literature seems to be that any specific tracking task requires dedicated (combinations of)algorithms to obtain optimal results. Nevertheless, several trends can be observed in the development ofnew cell tracking methods, suggesting the superiority of particular algorithms.

TRACKING IN CELL AND DEVELOPMENTAL BIOLOGY 3
2.1 Segmenting Individual Cells
Cell tracking methods generally consist of two main image processing steps: 1) cell segmentation (the spatialaspect of tracking), and 2) cell association (the temporal aspect). Segmentation is the process of dividing animage into (biologically) meaningful parts (segments), resulting in a new image containing for each pixel alabel indicating to which segment it belongs (such as “foreground” versus “background”). One approach tosegmentation is to compare the value of each image pixel to a preset threshold value and to label pixels withvalues above (below) the threshold as foreground (background) [22]. Due to its simplicity, thresholding isone of the most commonly used segmentation methods, but it is also one of the most error-prone [30]. It willbe successful only if cells are well separated and their intensities differ sufficiently and consistently fromthe background—a condition hardly ever met in live cell imaging due to severe noise, autofluorescence andphotobleaching (in the case of fluorescence microscopy), or strongly varying intensities and halos (in thecase of phase- or differential interference contrast microscopy).
More sophisticated methods for cell segmentation include fitting predetermined cell intensity profiles (tem-plates) to the image data. This template matching approach works well for images showing consistent cellshape [31], but fails in the case of significant variations in cell morphology (between cells per image, or percell over time, or both). A more popular approach is to use the so-called watershed transform. In this case,an image is considered a topographic relief, and “flooding” this relief from the local intensity minima com-pletely subdivides the image into regions and delimiting contours, by analogy termed “catchment basins”and “watersheds”, respectively. The most important drawbacks of this method are its sensitivity to noiseand its tendency to yield too fragmented results (oversegmentation). Nevertheless, by combination withcarefully designed pre- and postprocessing strategies, such as marking and model-based segment merging,the method has been successfully applied to cell segmentation in microscopy [32–35].
Recent years have shown an increasing interest in the use of deformable models for cell segmentation [36–46]. These are defined either explicitly as parametric contours (mostly for 2D applications) or implicitly asthe zero-level of a so-called level-set function (a mathematical concept that can be applied to image data ofany dimensionality). The latter approach is often preferred, as it can naturally capture topological changes,such as cell division. Starting from a coarse, initial segmentation, deformable models are iteratively evolvedin the image domain to minimize a predefined energy functional (Fig. 1). The modeling aspect lies primarilyin the definition of this energy functional. Typically it consists of image-related terms (based on imagefeatures such as intensity, gradients, and texture) and image-independent terms (based on shape propertiessuch as boundary length or surface area, curvature, and similarity to reference shapes). This mixture of termsenables the incorporation of both image information and prior knowledge about the biological application[25]. In contrast with the watershed transform, model-evolution approaches have the tendency to yieldundersegmentation of the images (the contours or surfaces of neighboring cells may easily merge in theprocess), and usually require postprocessing steps to refine the results.
2.2 Connecting Cells Over Time
After segmentation, the second step in achieving cell tracking is cell association. This refers to the process ofidentifying and linking segmented cells from frame to frame in the image sequence to obtain cell trajectories.The simplest approach to accomplish this is to associate each cell in any frame to the spatially nearestcell in the next frame (for example according to centroid position) within a predefined range. However,when dealing with many cells or rapid cell movements, this may easily lead to mismatches. In order toallow for better discrimination of potential matches, the definition of “nearest” may be extended to include

TRACKING IN CELL AND DEVELOPMENTAL BIOLOGY 4
Figure 1 Cell tracking. (A) Three frames from a time-lapse fluorescence microscopy image, illustratingthe concept of model-evolution based cell segmentation and association. Cell contours or surfaces can bedefined parametrically or as the zero-level of a higher-dimensional function. In each image frame, the finalcontour of a cell (solid line) is obtained by minimization of an energy functional, typically consisting ofimage-based and shape-based terms. The initial cell contour (dotted line) for each frame is usually taken tobe the final contour from the previous frame. Cell divisions can be detected by monitoring the shape of thecontour function during energy minimization. (B) Depending on the type of labeling, the appearance ofcells (or in this case their nuclei) may vary greatly, within one frame as well as over time. (C) Thresholdingusually results in a very noisy (at low thresholds) or fragmented (at high thresholds) segmentation. (D)Model-based segmentation (in this case using level sets) can yield much more sensible results. Once allcells are tracked, they can be easily extracted individually (E) and geometrically transformed to a referencecoordinate-frame for subsequent intracellular analysis (F).
similarity in (average) intensity, area or volume, perimeter or surface area, orientation of major and minoraxes, boundary curvature, estimated displacement, and other features. Increasing the number of featuresused for comparison reduces the risk of ambiguity. A similar argument applies when using so-called mean-shift processes to iteratively compute cell positions [47,48].
Several of the discussed methods for cell segmentation can naturally be extended to also perform cell asso-ciation. The concept of template matching, for example, can serve as a basis for image registration betweentime points. Registration refers to the process of (global or local) alignment of images, using intensity-or geometry-based features. This can be done at the cell level [49], at the level of feature points [50], ordown to the pixel level, reminiscent of optic-flow schemes [29, 51]. In the case of deformable models, cellassociation can be performed “on the fly”, by using the segmentation results in any frame as initializationfor the segmentation process in the next frame (Fig. 1). Essentially, this is again a nearest-neighbor link-

TRACKING IN CELL AND DEVELOPMENTAL BIOLOGY 5
ing approach, which works well if the population density is not too high and the rate at which images areacquired is such that cells do not move more than at most their diameter between consecutive frames. Ifthese conditions are not met, or they need to be compromised for practical reasons, more sophistication isrequired, such as the use of gradient-vector flows [36, 52], estimated cell dynamics [39, 42], and specialprocedures to handle cell contacts, divisions, appearances, and disappearances [41,53]. Another trend in theattempt to achieve more robustness is the use of probabilistic schemes [31,42,44,54].
2.3 Cell Tracking in Practice
Once the cells are properly segmented in all frames of a time-lapse image sequence, and the correct associ-ations have been established between successive frames, it is relatively easy to compute (morpho)dynamicfeatures that may reveal biologically relevant phenomena. For example, variabilities in cell shape (withinpopulations or per cell over time) can be very effectively studied using statistical tools such as principalcomponent analysis (PCA) of the cell outlines [55]. Power spectrum analysis of size changes over timehave revealed the presence of regularities (periodicities hinting at underlying biochemical clocks) in themembrane deformation of crawling amoebae that were not obvious from visual inspection [25]. Automatedmeasurement of cell motility and proliferation have enabled the study of factors influencing osteoblast dif-ferentiation and growth, involved in the processes of bone formation and maintenance, as well as the dys-regulation of these processes leading to osteoporosis [56]. As a final example, computerized analysis of cellvelocities, directional persistence, turning frequencies, and invasion profiles, have demonstrated significantdependence of tumor cell infiltration and migration on cell type and the microenvironment, suggesting thatmetastasis is not a completely random phenomenon [57]. These examples clearly illustrate that computer-ized cell tracking not only provides objective numbers rather than subjective visual impressions, but alsooffers a level of sensitivity and statistical power unattainable by human observers.
3 From Cells to Molecules
The capacity of cells to perform their fundamental roles in living organisms is the product of a complexmachinery of intracellular and intranuclear processes, involving thousands of proteins and other constructs.Spurred by the technological advances mentioned in the introduction, the quest to improve medicine is there-fore increasingly focussing on acquiring a deeper understanding of these processes. In turn, this has boostedthe demand for powerful image processing tools able to automatically compute the location, distribution,and dynamics of large numbers of macromolecules in (usually fluorescence) microscopy image sequences.Going beyond ensemble averages of motion parameters, measured by fluorescence recovery after (or lossin) photobleaching (FRAP or FLIP) experiments [5, 58], these offer the possibility to study dynamic pro-cesses at the highest possible level of detail (individual particles), and are often collectively (and somewhatmisleadingly) referred to as “single-particle tracking” tools [24,59].
3.1 Detecting Single Particles
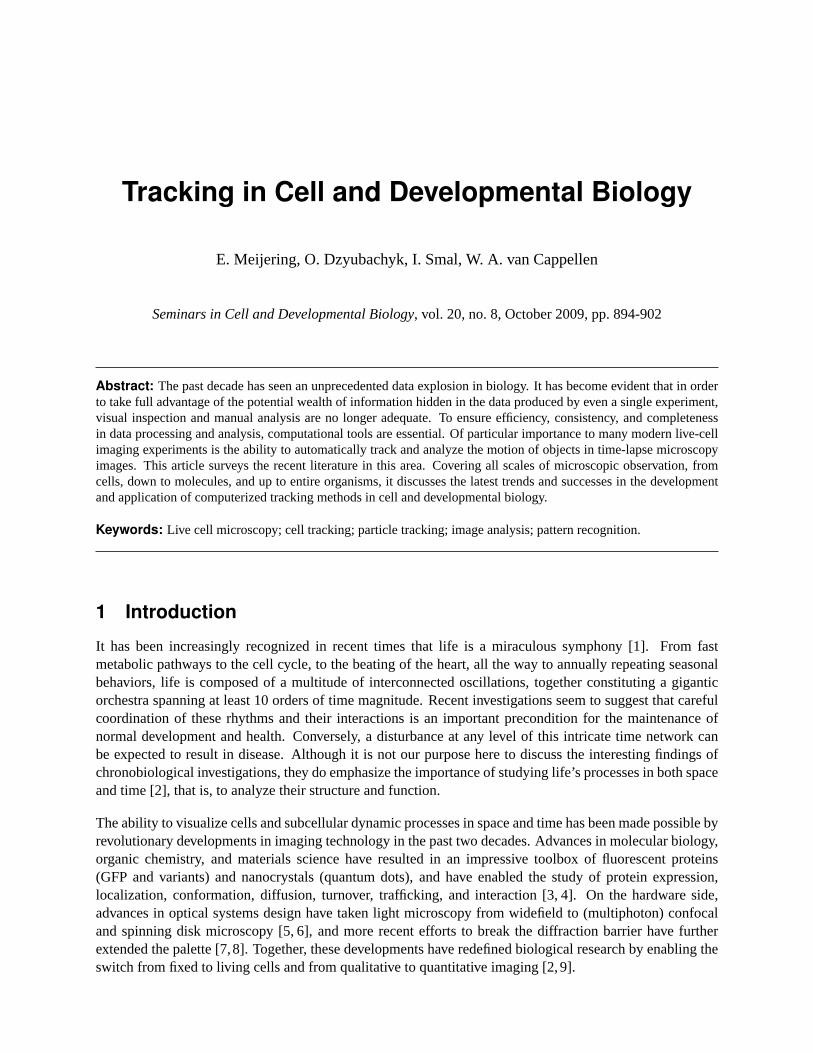
Similar to cell tracking methods, particle tracking methods too generally consist of two main processingsteps: 1) particle detection (within each time frame of a sequence), and 2) particle linking (between succes-sive frames). The former refers to the process of determining the presence and the location of particles in theimages. Since individual particles (or, equivalently, the fluorescent tags used to visualize them) are typicallyone or two orders of magnitude smaller than the optical resolution of the microscope, they have the appear-ance of diffraction-limited spots (“foci”, Fig. 2). In spite of this, recent studies [61] have demonstrated that
TRACKING IN CELL AND DEVELOPMENTAL BIOLOGY 6
Figure 2 Particle tracking. (A) Single frame from a time-lapse fluorescence microscopy image, show-ing hundreds of proliferating cell nuclear antigen (PCNA) foci in the process of DNA replication anddouble-strand break repair. (B) Individual foci often appear as diffraction-limited spots, which are wellapproximated by Gaussian (mixture) models, to be fitted to the data for detection. (C) Spatiotemporal pro-jection image of the yellow rectangle in (A), illustrating that moving particles give rise to tubular structuresin space-time, possibly extractable by spatiotemporal segmentation methods. (D) Bayesian network of thehidden Markov model assumed by probabilistic tracking methods. The posterior probabilityp(xt|zt) of thetrue statext of the system (containing all relevant object features) given all measurementszt, is obtainedby prediction based on the posterior of the previous time step and the dynamics modelp(xt|xt−1), fol-lowed by update of the prediction based on the observation modelp(zt|xt). (E) Example result of trackingvesicle movements (shown as color-coded trajectories overlaid on the last frame of the time series) using aprobabilistic method [60]. (F) Spatiotemporal rendering of the vesicle trajectories. (G) Comparisons haveshown that the method correlates very well with manual tracking by expert human observers, suggestingthat it may replace the latter, allowing experiments to be scaled up considerably.

TRACKING IN CELL AND DEVELOPMENTAL BIOLOGY 7
for an individual particle, a localization accuracy of around 10nm is achievable in practice, and that two ormore particles can be resolved with a reasonable level of accuracy for distances of about 50nm and larger.The limiting factor here is the photon count, or effectively the signal-to-noise ratio (SNR), which should beas high as possible to maximize estimation accuracy and precision, but in live cell imaging experiments isusually rather low to minimize photobleaching and photodamage.
The simplest approach to particle detection is to first identify (potential) particle loci by applying intensitythresholding and then to estimate their positions by computing the centroid (center of intensity mass) foreach locus [62]. For similar reasons as mentioned in the previous section, this is a frequently used butnoise-sensitive approach, with limited applicability to low-SNR live cell imaging experiments [30]. A moresensible approach is to search for loci with intensity profiles that fit the theoretical profile of a particle. Forsubresolution particles, the latter is equal to the point-spread function (PSF) of the microscope, which canbe well-approximated by the Gaussian function [63]. Experiments have shown superior performance ofGaussian fitting (with a limit of SNR≈ 4) [64] and successful application to the detection of single [65]as well as clustered particles (using Gaussian mixture models) [66]. More sophisticated methods involve(in order of increasing performance [67]) wavelet multiscale products [68], Laplacian-of-Gaussian filtering[69], specialized algorithms from mathematical morphology [60], and machine-learning [70].
3.2 Linking Particles Over Time
As for the linking of particles between consecutive frames, one of the simplest and most commonly usedapproaches is to apply the previously mentioned “nearest-neighbor” criterion. Similar to cell association,however, this quickly leads to ambiguities in the case of high particle densities and velocities [30,71]. Sinceindividual particles usually appear as nearly identical (PSF-shaped) spots, rather than more extended regionswith possibly varying shape and texture as in the case of cells, the use of additional cues to disambiguatepotential matches is mostly limited to comparing particle intensities and motion consistencies over time.The linking problem is further complicated by the fact that the total number of particles is usually notconstant, but may vary over time due to splitting and merging events, particles entering and leaving thefield of view, disassembly andde novoassembly, or intermitting fluorescence (as in the case of quantumdots). In this situation, the only solution is to abandon the idea of matching on a per-particle and per-frame basis, and to develop more global linking strategies. One way to do this is to consider the trackingproblem as a spatiotemporal segmentation problem (Fig. 2) and to search for optimal paths (typically tubularstructures) through the entire image data [69, 72, 73]. An alternative (but related) approach is to constructa so-called weighted graph (or a cost matrix) from the detected particles and possible correspondences(between two or more frames) with their likelihoods, and to find the optimal subgraph (corresponding to theset of trajectories) by minimizing a global cost function defined on the graph [74–76].
Another very important trend emerging from the recent literature on particle tracking, anticipated a fewyears ago [24], is the paradigm shift from deterministic to probabilistic approaches. In deterministic trackingschemes, such as many of the ones discussed above, hard decisions are made at every step about the presenceor absence of particles and their correspondences over time. In live-cell imaging experiments, however,there can be a great deal of uncertainty about these decisions. Regardless of the criteria used to detector link particles, it makes sense to assign probabilities to potential particle objects and potential particlecorrespondences to reflect this uncertainty, and to retain all this information during tracking until the finalstage, where hard decisions may (or may not) be required to allow further analyses.

TRACKING IN CELL AND DEVELOPMENTAL BIOLOGY 8
Generally, probabilistic tracking methods [60, 68, 77–79] implement the concept of Bayesian estimation(Fig. 2), which deals with the problem of inferring the true state of a dynamic system from noisy mea-surements (observations) of that system. In this scheme, the “state” is described by a mathematical vector,which includes all information to be estimated (such as object position, shape, intensity, and velocity).The estimation is a recursive two-step procedure of 1) state prediction (using dynamics models based onapriori knowledge of state changes) and 2) state update (using observation models based ona priori knowl-edge about the measurements given a particular system state). It can be computed analytically by meansof Kalman filtering (in the case of linear system dynamics and Gaussian measurement noise) or to goodapproximation by means of sequential Monte Carlo schemes (in non-linear or non-Gaussian cases).
3.3 Particle Tracking in Practice
After particle tracking has completed, a host of kinetic and kinematic features can be readily computed fromthe obtained trajectories. Similar to cell tracking, obvious examples include total and net distances traveled,directional changes and persistence, instant and average velocities and accelerations, and histograms thereofto compare the distribution of these features between different populations. A more sophisticated and fre-quently studied feature in particle tracking experiments is the mean square displacement (MSD). It enablesone to compute diffusion parameters of individual particles, as well as viscoelastic properties of the mediumin which they move [80]. By varying the time-lag over which displacements are averaged in a trajectory,an MSD-time curve can be constructed, the shape of which is indicative of the mode of motion (Brown-ian, active transport, impeded, confined). The computations need to be carried out with care, however, asshort trajectories and particle localization errors may give rise to apparent subdiffusion patterns [81], andthe averaging process may conceal mode transitions within single trajectories [30].
Various examples in the recent literature illustrate the crucial role of automated particle tracking methods indiscovering new biological phenomena. Computerized analysis of fluorescent speckle microscopy (FSM)movies of migrating cells have revealed that the protrusive behavior of the plasma membrane at the leadingedge during migration is mediated by two spatially colocalized but kine(ma)tically and molecularly distinctactin networks related to the lamellipodia and the lamella, respectively, where the former appear to serve anexploratory function while the latter are responsible for actual cell advancement [82]. Automated trackingand motion analysis of virus-like particles on the surface of tissue culture cells has provided new insightsinto the mechanisms involved in virus/receptor confinement before internalization [83]. Tracking of hu-man immunodeficiency virus-1 (HIV-1) complexes have revealed directed movements characteristic of bothmicrotubule- and actin-dependent transport within the cytoplasm towards the nuclear membrane, which con-tributes to the understanding of the cellular factors cooperating with or restricting HIV-1 infection [84]. Asa final example, it has been shown by single particle tracking that to a large extent, the mobility of proteinassemblies within the cell nucleus correlates with the compaction of chromatin [85].
4 From Cells to Organisms
One of the major goals of biological research in our postgenomic era is to gain full understanding of the pro-cesses by which the genome directs the development of a single-cell zygote into a multicellular organism.Complete knowledge of the gene regulatory networks giving rise to specific phenotypes will dramaticallyadvance the discovery of drugs and, ultimately, the development of clinical therapies. Model organismssuch as the nematode wormCaenorhabditis elegansand the zebrafish are now widely used to study de-velopmental phenomena efficiently. However, the imaging and quantification of every cell cleavage and

TRACKING IN CELL AND DEVELOPMENTAL BIOLOGY 9
every cell-cell interaction in an entire developing organism, as well as the phenotypical characteristics andbehaviors of adult organisms, pose enormous challenges in terms of both image acquisition and image anal-ysis [86–89]. Concerning the latter, it is safe to say that such studies constitute the ultimate test cases forautomated tracking and motion analysis methods. Nevertheless, recent literature has shown first successesin the development and application of new methods for this purpose.
4.1 Tracking Embryogenesis
The indispensability of computational tools for studying embryogenesis quantitatively has already been rec-ognized for some time. Interactive computer-assisted systems facilitated the segmentation, reconstruction,visualization, and motion analysis of every cell and nucleus in a developing embryo [90, 91], but requiredsubstantial manual effort in tracing and editing contours, limiting the practical use of these systems to thevery early stages of embryogenesis. Automation of cell tracking in these stages is possible by applyingbasic image filtering techniques for cell segmentation and using spatial distance or the degree of cell overlapbetween image frames for cell association [86]. However, problems easily occur at later stages, due to therapidly increasing number of cells and the cell density (Fig. 3).
In the endeavor to track embryogenesis much further down the line, alternative methods have been devel-oped, based on fitting spherical models for segmentation and using heuristics about the shape and size of thenuclei at the various stages of the cell cycle to disambiguate potential matches between time frames [92,93].The use of additional cues is of crucial importance when tracking densely packed cells through mitosis,when the telophase daughter nuclei are sent to the distal ends of the cell, and the two newborn cells may eas-ily end up being closer to neighboring cells than to the mother cell in the previous frame. Several methodswere recently developed for tracking and lineage construction of cultured cell populations [44, 94] whichmay also prove useful for tracking embryogenesis. In line with the foregoing sections, especially the use ofcontour models, motion models, and probabilistic filtering schemes [44] can be expected to add considerablyto the much-needed robustness of cell tracking for this application.
4.2 Tracking Organism Behavior
In order to get a full picture for genotype-phenotype mapping, quantitative studies of the development ofan organism from the single cell stage to maturity must be complemented by analyses of the behavioral(ab)normalities of the adult subjects. This brings us to yet another (and in this article final) level of spatialand temporal observation, with its own peculiarities requiring special attention (Fig. 3). In the case ofC. eleganstracking, on which we will focus in the sequel, a large (inter- and intra-subject) variability inappearance and behavior may be observed. For robust geometric modeling, it has been proposed [95] tomake a distinction between the principal shape (the resting width-profile, length, and body orientation), andthe conformation (bending patterns or curvature profiles) of the worms.
The use of standard stereo dissecting microscopes for worm tracking usually results in fairly high-contrastimages, so that simple intensity thresholding can be used to segment the subjects from the background. Con-venient centerline representations of the worms can then be easily obtained by applying “skeletonization”algorithms from mathematical morphology [96–98] or by using curve fitting procedures [95]. The segmen-tation and association tasks become more difficult, however, when studying multiple worms simultaneouslyfor social behavior, where subject interactions, overlaps, or complex entanglements may occur. In addition,to be able to distinguish forward from backward movement, the head and tail need to be identified. Here

TRACKING IN CELL AND DEVELOPMENTAL BIOLOGY 10
Figure 3 Organism tracking. (A-C) Volume renderings of three time points (3D image stacks) from atime-lapse fluorescence microscopy data set, showingC. elegansembryogenesis from the four-cell stageto approximately one and two hours later, respectively. The rapidly increasing number of cells and celldensity pose a real challenge for automated cell tracking. (D) Result of 3D segmentation (only one plane isshown here) obtained by applying a level-set based model-evolution algorithm and morphological postpro-cessing to the stack rendered in (C). (E) Tracking results can be conveniently summarized and presented(after completion or even in the process) using lineage trees, which give a clear picture of mother-daughterrelations of cells, division times, and symmetry breaking events. (F) Single frame from time-lapse imagedata acquired using a dissecting microscope and showing the morphological and behavioral phenotypes ofan adult worm. (G) Owing to the high contrast in the image, the worm body can be accurately segmentedusing intensity thresholding, and simple morphological operations subsequently yield the outer contourand centerline (“skeleton”). (H) Finally, a variety of morphological features, such as body diameter andcurvature, can be easily computed at any position along the extracted centerline.
too, similar to cell and particle tracking, the trend in the development of more robust tracking methods is inthe direction of model-based and probabilistic estimation approaches [95].
4.3 Organism Tracking in Practice
For the presentation of the deluge of information resulting from exhaustive cell tracking during embryogene-sis, cell lineage trees (Fig. 3) can be very helpful. Such trees not only offer a convenient visual impression ofmother-daughter relations of cells, they also give a clear picture of division times, (a)synchronous divisions,symmetry breaking events, and even (by color coding) of gene expression levels, for which quantitativemetrics can be computed straightforwardly. However, in order for lineage related analyses to make biologi-

TRACKING IN CELL AND DEVELOPMENTAL BIOLOGY 11
cal sense, the reconstructed trees need to be flawless. Since a single tracking error will invalidate the entirecorresponding subtree, this imposes extremely high demands on the accuracy and robustness of cell trackingalgorithms. Because even state-of-the-art algorithms are not quite error-free, careful manual curation andpostediting of the resulting trees will always be necessary. Several software tools for visualizing, editing,and comparing cell lineage trees are publically available [99,100].
For the quantification of adult morphological phenotypes, geometrical features such as body length, area,thickness, symmetry, and curvature can be easily extracted upon successful segmentation [96]. As forbehavioral phenotypes,C. eleganslocomotion can be roughly classified into forward movement, backwardmovement, rest, and curl, the duration and change-rates of which are important parameters [98]. Automatedtracking systems have been successfully used for quantifying a variety of morphological and behavioralpatterns under controlled conditions (summarized in [96]). The statistical clustering of phenotypic patternsand their matching with genotypic classes and environmental conditions will yield new insights into thedifferent mechanisms driving organism development and how to influence them beneficially.
5 Conclusions
In concluding this article, we summarize the most important observations and their implications for futureresearch. First, in view of the data explosion that is currently taking place in cell and developmental biol-ogy, it is increasingly realized that powerful software tools are now essential on the road to discovery andbreakthrough. The massive change in scale of biological investigations not only calls for efficient solutionsfor data management, but also requires computational methods for objective and reproducible processing,analysis, and interpretation of the data. While the first challenge has already resulted in open standards forstoring and sharing image and meta data, the problem of how to best automate the actual “data crunching”is still being vigorously researched by many groups worldwide, and in this article we have attempted toprovide the reader with a good overview of recent efforts in the field to develop methods for tracking andmotion analysis of objects in time-lapse microscopy image data.
Second, the exponential growth of publications in the past few years on bioimage informatics related prob-lems is not just a testimony of the utter need for and the development of computational tools, but also ofthe fact that the field is still very much in an exploratory phase. The general conclusion emerging from thecurrent body of literature seems to be that there are no universal solutions to tracking problems in cell anddevelopmental biology, and that tools pretending the existence of such solutions (such as many commercialsoftware packages) generally show mediocre performance. This is understandable by realizing that, espe-cially in developmental experiments, one must be concerned with the analysis of events at the molecularlevel (nanometer scale), the cellular level (micrometer scale), up to the organism level (millimeter scale),that is at least six orders of spatial (not to mention temporal) detail, each with its own idiosyncrasies. How-ever, the advent of whole-body scanners for fluorescence and bioluminescence tomography imaging, andthe desire to be able to quantify (sub)cellular processes within intact organisms, will push the demand forintegrated methods capable of tracking motion at all relevant scales simultaneously. Currently, several trendscan be observed in the development of new tracking methods, including the increasing use of models (ofobject shape and dynamics as well as image formation) and probabilistic (Bayesian) estimation methods,which are known from other fields to yield improved robustness.
Finally, since every specific tracking problem currently requires its own dedicated solutions to optimallyextract and exploit the information contained in the data, investigators are constantly faced with the chal-lenge to develop their own software tools. This is increasingly possible, even for users without expertise

TRACKING IN CELL AND DEVELOPMENTAL BIOLOGY 12
in computer programming, by means of commercial and open-source tools facilitating the assembly of ex-isting image processing algorithms and the integration of custom-designed algorithms. However, biologyhas by now unquestionably developed into a multidisciplinary field, and it seems that the joint optimiza-tion of all aspects of biological experimentation (sample preparation, image acquisition, image analysis,data modeling, and statistics) is best achieved by a close collaboration between biologists, chemists, physi-cists, mathematicians, statisticians, as well as computer scientists, all the way from experiment planningto the ultimate interpretation of the results. Academic environments and research programs fostering thiscollaboration will likely prove to be the main contributors to progress in biology.
Acknowledgments
The authors are thankful to (in alphabetic order of surname) Anna Akhmanova, Katharina Draegestein,Jeroen Essers, Ilya Grigoriev, Adriaan Houtsmuller, Niels Galjart, Akiko Inagaki, Wiro Niessen, and Martinvan Royen (Erasmus MC – University Medical Center Rotterdam, The Netherlands), as well as to Rob Jelierand Ben Lehner (Centre for Genomic Regulation, Barcelona, Spain), and Marco Loog (Delft University ofTechnology, The Netherlands), for fruitful discussions and providing part of the sample image material usedin this article for illustrational purposes. TheC. elegansembryogenesis image data is available online fromthe lab of Robert H. Waterston (University of Washington, Seattle, WA, USA). Tracking research in the labof Erik Meijering is funded by the Netherlands Organization for Scientific Research through VIDI-grant639022401 and by the European Commission through FP7-grant 201842.
References
[1] Moser M, Fruhwirth M, Kenner T. The symphony of life: Importance, interaction, and visualization of biolog-ical rhythms. IEEE Engineering in Medicine and Biology Magazine 2008;27:29–37.
[2] Tsien RY. Imagining imaging’s future. Nature Cell Biology 2003;5:S16–S21.
[3] Lippincott-Schwartz J, Patterson GH. Development and use of fluorescent protein markers in living cells.Science 2003;300:87–91.
[4] Giepmans BNG, Adams SR, Ellisman MH, Tsien RY. The fluorescent toolbox for assessing protein locationand function. Science 2006;312:217–224.
[5] Stephens DJ, Allan VJ. Light microscopy techniques for live cell imaging. Science 2003;300:82–86.
[6] Pawley JB. Handbook of biological confocal microscopy. 3rd ed. New York: Springer; 2006.
[7] Hell SW. Microscopy and its focal switch. Nature Methods 2009;6:24–32.
[8] Garini Y, Vermolen BJ, Young IT. From micro to nano: Recent advances in high-resolution microscopy. CurrentOpinion in Biotechnology 2005;16:3–12.
[9] Vonesch C, Aguet F, Vonesch JL, Unser M. The colored revolution of bioimaging. IEEE Signal ProcessingMagazine 2006;23:20–31.
[10] Swedlow JR, Goldberg I, Brauner E, Sorger PK. Informatics and quantitative analysis in biological imaging.Science 2003;300:100–102.
[11] Eils R, Athale C. Computational imaging in cell biology. Journal of Cell Biology 2003;161:477–481.
[12] Murphy RF, Meijering E, Danuser G. Special issue on molecular and cellular bioimaging. IEEE Transactionson Image Processing 2005;14:1233–1236.

TRACKING IN CELL AND DEVELOPMENTAL BIOLOGY 13
[13] Swedlow JR, Lewis SE, Goldberg IG. Modelling data across labs, genomes, space and time. Nature CellBiology 2006;8:1190–1194.
[14] Zhou X, Wong STC. Informatics challenges of high-throughput microscopy. IEEE Signal Processing Magazine2006;23:63–72.
[15] Pepperkok R, Ellenberg J. High-throughput fluorescence microscopy for systems biology. Nature ReviewsMolecular Cell Biology 2006;7:690–696.
[16] Ahmed WM, Leavesley SJ, Rajwa B, Ayyaz MN, Ghafoor A, Robinson JP. State of the art in informationextraction and quantitative analysis for multimodality biomolecular imaging. Proceedings of the IEEE 2008;96:512–531.
[17] Dorn JF, Danuser G, Yang G. Computational processing and analysis of dynamic fluorescence image data.Methods in Cell Biology 2008;85:497–538.
[18] Peng H. Bioimage informatics: A new area of engineering biology. Bioinformatics 2008;24:1827–1836.
[19] Duncan JS, Ayache N. Medical image analysis: Progress over two decades and the challenges ahead. IEEETransactions on Pattern Analysis and Machine Intelligence 2000;22:85–106.
[20] Suri JS, Wilson D, Laximinarayan S. Handbook of biomedical image analysis. New York, NY: Kluwer Aca-demic / Plenum Publishers; 2005.
[21] Bankman IN. Handbook of medical image processing and analysis. 2nd ed. Burlington, MA: Academic Press;2008.
[22] Wu Q, Merchant FA, Castleman KR. Microscope image processing. Burlington, MA: Elsevier Academic Press;2008.
[23] Rittscher J, Machiraju R, Wong STC. Microscopic image analysis for life science applications. Norwood, MA:Artech House; 2008.
[24] Meijering E, Smal I, Danuser G. Tracking in molecular bioimaging. IEEE Signal Processing Magazine 2006;23:46–53.
[25] Zimmer C, Zhang B, Dufour A, Thebaud A, Berlemont S, Meas-Yedid V, Olivo-Marin JC. On the digital trailof mobile cells. IEEE Signal Processing Magazine 2006;23:54–62.
[26] Gerlich D, Mattes J, Eils R. Quantitative motion analysis and visualization of cellular structures. Methods2003;29:3–13.
[27] Kalaidzidis Y. Multiple objects tracking in fluorescence microscopy. Journal of Mathematical Biology 2009;58:57–80.
[28] Dormann D, Weijer CJ. Imaging of cell migration. EMBO Journal 2006;25:3480–3493.
[29] Hand AJ, Sun T, Barber DC, Hose DR, MacNeil S. Automated tracking of migrating cells in phase-contrastvideo microscopy sequences using image registration. Journal of Microscopy 2009;234:62–79.
[30] Meijering E, Smal I, Dzyubachyk O, Olivo-Marin JC. Time-lapse imaging. In: Wu Q, Merchant FA, CastlemanKR, editors. Microscope Image Processing. Burlington, MA: Elsevier Academic Press; 2008, p. 401–440.
[31] Kachouie NN, Fieguth P, Ramunas J, Jervis E. Probabilistic model-based cell tracking. International Journal ofBiomedical Imaging 2006;2006:1–10.
[32] Wahlby C, Sintorn IM, Erlandsson F, Borgefors G, Bengtsson E. Combining intensity, edge and shape infor-mation for 2D and 3D segmentation of cell nuclei in tissue sections. Journal of Microscopy 2004;215:67–76.
[33] Yang X, Li H, Zhou X. Nuclei segmentation using marker-controlled watershed, tracking using mean-shift, andKalman filter in time-lapse microscopy. IEEE Transactions on Circuits and Systems I: Regular Papers 2006;53:2405–2414.

TRACKING IN CELL AND DEVELOPMENTAL BIOLOGY 14
[34] Lin G, Chawla MK, Olson K, Barnes CA, Guzowski JF, Bjornsson C, Shain W, Roysam B. A multi-modelapproach to simultaneous segmentation and classification of heterogeneous populations of cell nuclei in 3Dconfocal microscope images. Cytometry Part A 2007;71:724–736.
[35] Zhou X, Li F, Yan J, Wong STC. A novel cell segmentation method and cell phase identification using Markovmodel. IEEE Transactions on Information Technology in Biomedicine 2009;13:152–157.
[36] Zimmer C, Labruyere E, Meas-Yedid V, Guillen N, Olivo-Marin JC. Segmentation and tracking of migratingcells in videomicroscopy with parametric active contours: A tool for cell-based drug testing. IEEE Transactionson Medical Imaging 2002;21:1212–1221.
[37] Dormann D, Libotte T, Weijer CJ, Bretschneider T. Simultaneous quantification of cell motility and protein-membrane-association using active contours. Cell Motility and the Cytoskeleton 2002;52:221–230.
[38] Ray N, Acton ST, Ley K. Tracking leukocytesin vivo with shape and size constrained active contours. IEEETransactions on Medical Imaging 2002;21:1222–1235.
[39] Debeir O, Camby I, Kiss R, Van Ham P, Decaestecker C. A model-based approach for automated in vitro celltracking and chemotaxis analyses. Cytometry Part A 2004;60A:29–40.
[40] Mukherjee DP, Ray N, Acton ST. Level set analysis for leukocyte detection and tracking. IEEE Transactionson Medical Imaging 2004;13:562–572.
[41] Dufour A, Shinin V, Tajbakhsh S, Guillen-Aghion N, Olivo-Marin JC, Zimmer C. Segmenting and trackingfluorescent cells in dynamic 3-D microscopy with coupled active surfaces. IEEE Transactions on Image Pro-cessing 2005;14:1396–1410.
[42] Shen H, Nelson G, Kennedy S, Nelson D, Johnson J, Spiller D, White MRH, Kell DB. Automatic trackingof biological cells and compartments using particle filters and active contours. Chemometrics and IntelligentLaboratory Systems 2006;82:276–282.
[43] Chang H, Yang Q, Parvin B. Segmentation of heterogeneous blob objects through voting and level set formu-lation. Pattern Recognition Letters 2007;28:1781–1787.
[44] Li K, Miller ED, Chen M, Kanade T, Weiss LE, Campbell PG. Cell population tracking and lineage constructionwith spatiotemporal context. Medical Image Analysis 2008;12:546–566.
[45] Degerman J, Thorlin T, Faijerson J, Althoff K, Eriksson PS, Put RVD, Gustavsson T. An automatic system forin vitro cell migration studies. Journal of Microscopy 2009;233:178–191.
[46] Padfield D, Rittscher J, Thomas N, Roysam B. Spatio-temporal cell cycle phase analysis using level sets andfast marching methods. Medical Image Analysis 2009;13:143–155.
[47] Debeir O, Van Ham P, Kiss R, Decaestecker C. Tracking of migrating cells under phase-contrast video mi-croscopy with combined mean-shift processes. IEEE Transactions on Medical Imaging 2005;24:697–711.
[48] Chen Y, Ladi E, Herzmark P, Robey E, Roysam B. Automated 5-D analysis of cell migration and interac-tion in the thymic cortex from time-lapse sequences of 3-D multi-channel multi-photon images. Journal ofImmunological Methods 2009;340:65–80.
[49] Wilson CA, Theriot JA. A correlation-based approach to calculate rotation and translation of moving cells.IEEE Transactions on Image Processing 2006;15:1939–1951.
[50] Matula P, Matula P, Kozubek M, Dvorak V. Fast point-based 3-D alignment of live cells. IEEE Transactions onImage Processing 2006;15:2388–2396.
[51] Yang S, Kohler D, Teller K, Cremer T, Baccon PL, Heard E, Eils R, Rohr K. Nonrigid registration of 3-Dmultichannel microscopy images of cell nuclei. IEEE Transactions on Image Processing 2008;17:493–499.
[52] Ray N, Acton ST. Motion gradient vector flow: An external force for tracking rolling leukocytes with shapeand size constrained active contours. IEEE Transactions on Medical Imaging 2004;23:1466–1478.

TRACKING IN CELL AND DEVELOPMENTAL BIOLOGY 15
[53] Xie J, Khan S, Shah M. Automatic tracking ofEscherichia coliin phase-contrast microscopy video. IEEETransactions on Biomedical Engineering 2009;56:390–399.
[54] Cui J, Acton ST, Lin Z. A Monte Carlo approach to rolling leukocyte tracking in vivo. Medical Image Analysis2006;10:598–610.
[55] Pincus Z, Theriot JA. Comparison of quantitative methods for cell-shape analysis. Journal of Microscopy 2007;227:140–156.
[56] Bahnson A, Athanassiou C, Koebler D, Qian L, Shun T, Shields D, Yu H, Wang H, Goff J, Cheng T, Houck R,Cowsert L. Automated measurement of cell motility and proliferation. BMC Cell Biology 2005;6:19.
[57] Demou ZN, McIntire LV. Fully automated three-dimensional tracking of cancer cells in collagen gels: Deter-mination of motility phenotypes at the cellular level. Cancer Research 2002;62:5301–5307.
[58] Lippincott-Schwartz J, Altan-Bonnet N, Patterson GH. Photobleaching and photoactivation: Following proteindynamics in living cells. Nature Cell Biology 2003;5:S7–S13.
[59] Saxton MJ. Single-particle tracking: Connecting the dots. Nature Methods 2008;5:671–672.
[60] Smal I, Meijering E, Draegestein K, Galjart N, Grigoriev I, Akhmanova A, van Royen ME, Houtsmuller AB,Niessen W. Multiple object tracking in molecular bioimaging by Rao-Blackwellized marginal particle filtering.Medical Image Analysis 2008;12:764–777.
[61] Ram S, Ward ES, Ober RJ. Beyond Rayleigh’s criterion: A resolution measure with application to single-molecule microscopy. Proceedings of the National Academy of Sciences of the United States of America 2006;103:4457–4462.
[62] Carter BC, Shubeita GT, Gross SP. Tracking single particles: A user-friendly quantitative evaluation. PhysicalBiology 2005;2:60–72.
[63] Zhang B, Zerubia J, Olivo-Marin JC. Gaussian approximations of fluorescence microscope point-spread func-tion models. Applied Optics 2007;46:1819–1829.
[64] Cheezum MK, Walker WF, Guilford WH. Quantitative comparison of algorithms for tracking single fluorescentparticles. Biophysical Journal 2001;81:2378–2388.
[65] Yildiz A, Selvin PR. Fluorescence imaging with one nanometer accuracy: Application to molecular motors.Accounts of Chemical Research 2005;38:574–582.
[66] Thomann D, Rines DR, Sorger PK, Danuser G. Automatic fluorescent tag detection in 3D with super-resolution:Application to the analysis of chromosome movement. Journal of Microscopy 2002;208:49–64.
[67] Smal I, Loog M, Niessen W, Meijering E. Quantitative comparison of spot detection methods in fluorescencemicroscopy. IEEE Transactions on Medical Imaging 2009;in press.
[68] Genovesio A, Liedl T, Emiliani V, Parak WJ, Coppey-Moisan M, Olivo-Marin JC. Multiple particle tracking in3-D+t microscopy: Method and application to the tracking of endocytosed quantum dots. IEEE Transactionson Image Processing 2006;15:1062–1070.
[69] Sage D, Neumann FR, Hediger F, Gasser SM, Unser M. Automatic tracking of individual fluorescence particles:Application to the study of chromosome dynamics. IEEE Transactions on Image Processing 2005;14:1372–1383.
[70] Jiang S, Zhou X, Kirchhausen T, Wong STC. Detection of molecular particles in live cells via machine learning.Cytometry Part A 2007;71:563–575.
[71] Schiffmann DA, Dikovskaya D, Appleton PL, Newton IP, Creager DA, Allan C, Nathke IS, Goldberg IG. OpenMicroscopy Environment and FindSpots: Integrating image informatics with quantitative multidimensionalimage analysis. BioTechniques 2006;41:199–208.
[72] Bonneau S, Dahan M, Cohen LD. Single quantum dot tracking based on perceptual grouping using minimalpaths in a spatiotemporal volume. IEEE Transactions on Image Processing 2005;14:1384–1395.

TRACKING IN CELL AND DEVELOPMENTAL BIOLOGY 16
[73] Racine V, Sachse M, Salamero J, Fraisier V, Trubuil A, Sibarita JB. Visualization and quantification of vesicletrafficking on a three-dimensional cytoskeleton network in living cells. Journal of Microscopy 2007;225:214–228.
[74] Vallotton P, Ponti A, Waterman-Storer CM, Salmon ED, Danuser G. Recovery, visualization, and analysis ofactin and tubulin polymer flow in live cells: A fluorescent speckle microscopy study. Biophysical Journal 2003;85:1289–1306.
[75] Sbalzarini IF, Koumoutsakos P. Feature point tracking and trajectory analysis for video imaging in cell biology.Journal of Structural Biology 2005;151:182–195.
[76] Jaqaman K, Loerke D, Mettlen M, Kuwata H, Grinstein S, Schmid SL, Danuser G. Robust single-particletracking in live-cell time-lapse sequences. Nature Methods 2008;5:695–702.
[77] Smal I, Draegestein K, Galjart N, Niessen W, Meijering E. Particle filtering for multiple object tracking indynamic fluorescence microscopy images: Application to microtubule growth analysis. IEEE Transactions onMedical Imaging 2008;27:789–804.
[78] Yoon JW, Bruckbauer A, Fitzgerald WJ, Klenerman D. Bayesian inference for improved single moleculefluorescence tracking. Biophysical Journal 2008;94:4932–4947.
[79] Godinez WJ, Lampe M, Worz S, Muller B, Eils R, Rohr K. Deterministic and probabilistic approaches fortracking virus particles in time-lapse fluorescence microscopy image sequences. Medical Image Analysis 2009;13:325–342.
[80] Suh J, Dawson M, Hanes J. Real-time multiple-particle tracking: Application to drug and gene delivery. Ad-vanced Drug Delivery Reviews 2005;57:63–78.
[81] Martin DS, Forstner MB, Kas JA. Apparent subdiffusion inherent to single particle tracking. BiophysicalJournal 2002;83:2109–2117.
[82] Ponti A, Machacek M, Gupton SL, Waterman-Storer CM, Danuser G. Two distinct actin networks drive theprotrusion of migrating cells. Science 2004;305:1782–1786.
[83] Ewers H, Smith AE, Sbalzarini IF, Lilie H, Koumoutsakos P, Helenius A. Single-particle tracking of murinepolyoma virus-like particles on live cells and artificial membranes. Proceedings of the National Academy ofSciences of the United States of America 2005;102:15110–15115.
[84] Arhel N, Genovesio A, Kim KA, Miko S, Perret E, Olivo-Marin JC, Shorte S, Charneau P. Quantitative four-dimensional tracking of cytoplasmic and nuclear HIV-1 complexes. Nature Methods 2006;3:817–824.
[85] Bacher CP, Reichenzeller M, Athale C, Herrmann H, Eils R. 4-D single particle tracking of synthetic andproteinaceous microspheres reveals preferential movement of nuclear particles along chromatin-poor tracks.BMC Cell Biology 2004;5:1–14.
[86] Hamahashi S, Onami S, Kitano H. Detection of nuclei in 4D Nomarski DIC microscope images of earlyCaenorhabditis elegans embryos using local image entropy and object tracking. BMC Bioinformatics 2005;6:125.
[87] Murray JI, Bao Z, Boyle TJ, Boeck ME, Mericle BL, Nicholas TJ, Zhao Z, Sandel MJ, Waterston RH. Au-tomated analysis of embryonic gene expression with cellular resolution inC. elegans. Nature Methods 2008;5:703–709.
[88] Keller PJ, Schmidt AD, Wittbrodt J, Stelzer EHK. Reconstruction of zebrafish early embryonic developmentby scanned light sheet microscopy. Science 2008;322:1065–1069.
[89] Vermot J, Fraser SE, Liebling M. Fast fluorescence microscopy for imaging the dynamics of embryonic devel-opment. HFSP Journal 2008;2:143–155.
[90] Heid PJ, Voss E, Soll DR. 3D-DIASemb: A computer-assisted system for reconstructing and motion analyzingin 4D every cell and nucleus in a developing embryo. Developmental Biology 2002;245:329–347.
TRACKING IN CELL AND DEVELOPMENTAL BIOLOGY 17
[91] Tassy O, Daian F, Hudson C, Bertrand V, Lemaire P. A quantitative approach to the study of cell shapes andinteractions during early chordate embryogenesis. Current Biology 2006;16:345–358.
[92] Bao Z, Murray JI, Boyle T, Ooi SL, Sandel MJ, Waterston RH. Automated cell lineage tracing inCaenorhabdi-tis elegans. Proceedings of the National Academy of Sciences of the United States of America 2006;103:2707–2712.
[93] Murray JI, Bao Z, Boyle TJ, Waterston RH. The lineaging of fluorescently-labeledCaenorhabditis elegansembryos with StarryNite and AceTree. Nature Protocols 2006;1:1468–1476.
[94] Al-Kofahi O, Radke RJ, Goderie SK, Shen Q, Temple S, Roysam B. Automated cell lineage construction: Arapid method to analyze clonal development established with murine neural progenitor cells. Cell Cycle 2006;5:327–335.
[95] Roussel N, Morton CA, Finger FP, Roysam B. A computational model forC. eleganslocomotory behavior:Application to multiworm tracking. IEEE Transactions on Biomedical Engineering 2007;54:1786–1797.
[96] Geng W, Cosman P, Berry CC, Feng Z, Schafer WR. Automatic tracking, feature extraction and classificationof C. elegansphenotypes. IEEE Transactions on Biomedical Engineering 2004;51:1811–1820.
[97] Cronin CJ, Mendel JE, Mukhtar S, Kim YM, Stirbl RC, Bruck J, Sternberg PW. An automated system formeasuring parameters of nematode sinusoidal movement. BMC Genetics 2005;6:5.
[98] Hoshi K, Shingai R. Computer-driven automatic identification of locomotion states inCaenorhabditis elegans.Journal of Neuroscience Methods 2006;157:355–363.
[99] Braun V, Azevedo RBR, Gumbel M, Agapow PM, Leroi AM, Meinzer HP. ALES: Cell lineage analysis andmapping of developmental events. Bioinformatics 2003;19:851–858.
[100] Boyle T, Bao Z, Murray JI, Araya CL, Waterston RH. AceTree: A tool for visual analysis ofCaenorhabditiselegansembryogenesis. BMC Bioinformatics 2006;7:275.