tracking redox potential in wine - ucanr.edu
TRANSCRIPT

TrackingRedoxPotentialinWine
Dr.GordonA.Walker
Flotek/SolarisBiotechGordonWalkerConsultingLLC

Redoxvs.Reduction

RedoxPotentialofWine
• Aromaticcompoundsarevolatileasthemolecular(reduced)formratherthantheionic(oxidized)form.
• HigherpHfavorslowerredoxpotentialàMoreReductiveEnvironment• LowerpHfavorshigherredoxpotentialàMoreOxidativeEnvironment

Reduction/OxidationReactions
“OILRIG”or“LEOsaysGER”

RedoxPotentialDeterminesBiologicalandChemicalDynamics
BillDudeney,ImperialCollege,UnitedKingdom

DefiningRedoxPotentialinWine
• OxidationReductionPotential(ORP)isaquantifiablemeasurementofthetendencyofamoleculeoriontogainorloseelectrons.*
• Redoxpotentialmediatesthefrequencyofalloxidationandreductionreactionsduringthelifeofawinethroughfermentationandaging.
*BruceZoecklein,VTemeritus
e e
HigherORPValue
LowerORPValue

OxidizingandReducingAgentsinWine
• Oxidizingagent:ReactiveOxygenSpecies(ROS)stealelectronsfromothercompounds,causeoxidation.
• Reducingagents(antioxidant):Ascorbicacid,SO2,phenolics,gluthathione,metalspecies(FeII,CuI)giveupelectrons,tomediateredoxpotential.

KineticsofRedoxReactionsinWine• Fastreactions(oxidationofethanol,ascorbicacid)
• Slowreactions(tannins/polyphenols)
• Reactiontype/kineticsarehighlymatrixdependent
• Equilibriumisalwaysinflux

WineFermentation
WineAging
50:50Fe(II)/Fe(III)=770mV
50:50Fe(II)Tartrate/Fe(III)Tartrate=500mV
50:50Cu(I)/Cu(II)=160mV
AdaptedfromDr.RogerBoulton
Eh=mV
Reductive“DangerZone”
pH
mV=ORP+~200

OrganicAcidComplexesDictateWineRedox
WinepH
AdaptedfromDr.RogerBoulton

RedoxMeasurementPrinciples
HamiltonCompany,SteveHammond

RedoxMeasurementPrinciples
HamiltonCompany,SteveHammond

RedoxMeasurementPrinciples
ORP=mV+OffsetValue(+220mV)HamiltonCompany,SteveHammond

YeastMetabolismisTransformative
“WineMicrobiologyforFermentationSuccessandWineQuality”VladimirJiranek

YeastMetabolism=BalancingRedox
“Redoxpotentialcontrolandapplicationsinmicroaerobicandanaerobicfermentations”Liu,etal.,BiotechnologyAdvances,2013

YeastImpactExtracellularRedox
ATPaseactivityofPma1isessentialtomaintainintracellularenvironment:enablingfermentativemetabolism,facilitatingnutrient
uptake,andmitigatingenvironmentalstressors.
ATP ADP
H+H+
ATPase:Pma1
ExtracellularEnvironmentHigher[H+]
IntracellularEnvironmentLower[H+]
pH:6.5-7
pH:2.8-4.5H+H+
H+
H+
AA
H+
ProtonStress:EtOH,OrganicAcids
AA
AASymporter
H+ H+
InternalRedox=-290mV

SaccharomycesLowerRedoxPotential
• Yeastcreatereductiveenvironmentbydepletingoxygenandreleasingprotons.
• Reductiveenvironmentnarrowstheecologicalniche,reducingcompetition.
• Reductiveenvironmentcanleadtohydrogensulfideviayeastmetabolismandspontaneouschemicalformation.
O2à àH+
H2S

RedoxPotentialInFermentation
“Redoxpotentialcontrolandapplicationsinmicroaerobicandanaerobicfermentations”Liu,etal.,BiotechnologyAdvances,2013
MaximumBiomassCorrespondswithMinimumORPàH2SQuorumSensing

HistoricWorkonRedoxPotentialinWhiteWines
5
Figure 1.3.1: Relationship between redox potential (Eh curve) and hydrogen sulfide (H2S curve) production during fermentation [1].
Figure 1.3.1 shows trends of different parameters during wine fermentation. The
important curves are the curves labeled H2S and Eh. The H2S curve shows the rate of hydrogen
sulfide formation and the Eh curve is the redox potential of the fermentation. The peak of the H2S
curve is at the point of lowest redox potential and as the redox potential curve increases, the rate
of H2S formation curve decreases. The natural decline in redox potential (roughly 300 mV down
to 100 mV in Rankine’s case) due to the metabolic processes in the wine fermentation seem to
create the proper reduction conditions for the elemental sulfur to reduce to H2S.
HydrogenSulfideProduction&Redox
Rankine,1963
EhcurvecorrespondstoRedoxPotential(ORP)
Hypothesis:Thelowertheredoxpotential,themoreH2Sproduced.
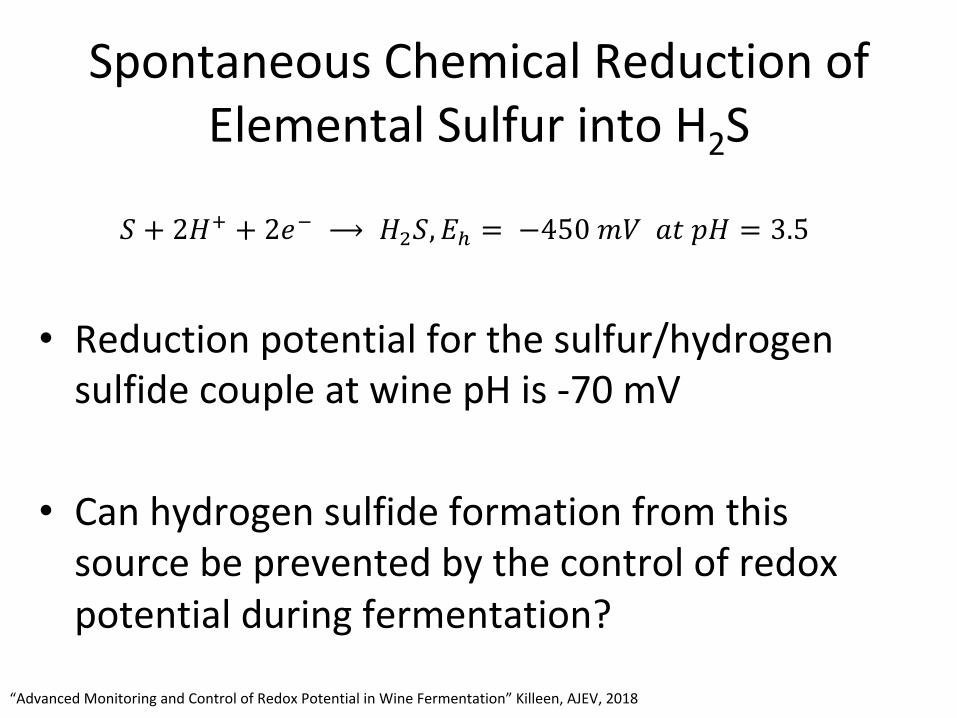
SpontaneousChemicalReductionofElementalSulfurintoH2S
• Reductionpotentialforthesulfur/hydrogensulfidecoupleatwinepHis-70mV
• Canhydrogensulfideformationfromthissourcebepreventedbythecontrolofredoxpotentialduringfermentation?
4
wines and also examined the effects of adding air [13]. This work observed that the redox
potential started at a high point, around 300 mV to 400 mV, and plunged down to a minimum
around 100 mV to 200 mV at the time when the fermentation was at its maximum rate. The
redox potential would then naturally rise after this point. Joslyn found that the rate and extent of
the rise was influenced by the aeration.
1.3 Redox Potential and Hydrogen Sulfide Production
One important redox reaction in wine involves elemental sulfur. The reaction between
elemental sulfur and H2S formation is favored at low redox potentials since it is a reduction
reaction:
! + 2!! + 2!! ⟶ !!!,!! = −450 !" !" !" = 3.5 (!"#$%&'( 1.3.1)
The extent and likelihood of this redox reaction is determined by the difference in potential
between the juice potential and the potential of the corresponding redox couple (Eh) at the juice
pH. Rankine found that the prevailing redox conditions of the wine during fermentation were
significant in determining H2S levels and rates of formation [1]. The rate of H2S formation was
greatest at the lowest redox potential levels. This suggests that it is the redox potential levels that
cause H2S to form in a natural fermentation.
“AdvancedMonitoringandControlofRedoxPotentialinWineFermentation”Killeen,AJEV,2018

TrackingRedoxPotential:OpusOneVintage2016&2017
• OrionVersaStarpHMeter
• OrionORPprobe
• TankSetup:BNCWireconnections,pipes,clamps,screen,bung,probe
Cap
Must

OpusOneRedoxPotentialConclusions
• HigherpHandtemperaturesleadtofasterfermentations,lowerORPvalues,andmoreH2Scharacter.
• Stimulatingyeastmetabolism(O2/nutrients)drivestheORPlower,correlateswithincreaseinbiomass/cell#.
• Clonesandotherredvarieties(datanotshown)donotappeartosignificantlyaffectORP,choiceofyeastdoes.

FutureGoalsforTrackingRedoxPotential
• FurtherexplorehowdifferentpumpoverstrategiesaffectORPoffermentation.
• ControlORPviapumpover/oxygenadditions.
• Testmoreenologicalvariables(yeastspecies,nutrition,co-ferments,vineyardtreatments,smoketaint,vesseldesign,etc…)

UsingORPAsProcessParameter
• Temperatureé(ORPê) • Temperatureê(ORPé) • pHé(ORPê)• pHê(ORPé)• DissolvedOxygené(ORPé)• DissolvedOxygenê(ORPê)
àORPtracksindirectlywithyeastmetabolism
PredictionsforRedoxControlofWineFermentations
• Fasterfermentations
• Lessincidenceofstuck/sluggishferments
• Moreyeastbiomass(goodforsurleeaging?)
• Less“reductive”aromas
• Controlalcoholcontent?

WhatRoleDoesRedoxPotentialPlayIn?
• Uninoculated/NativeFerments• MalolacticFermentation• EnologicalTreatments(Filtering,MicroOx,etc...)• SmokeTaint(Removal/RO)• Spoilage(Brett/Lactics)• EnzymaticTreatments(pectinase,lysozyme)• LongevityinBottle
Onlywaytoknowistomeasure!
ThankYouforListening!

Questions?
GordonWalkerConsulting@gmail.comwww.GordonWalkerConsulting.comwww.FlotekCA.comwww.HamiltonCompany.com