tracking structure of streaming social networks 2_1100... · tracking structure of streaming social...
TRANSCRIPT

Tracking Structure of Streaming Social NetworksJason Riedy, David Ediger, David A. Bader, & Henning Meyerhenke

Jason Riedy, GraphEx 2011
Overview• Background: Georgia Tech's focus
• Dynamic social networks: Target rates of change and software approach
• First proof-of-concept: Monitoring clustering coefficients
• Monitoring connected components– Edge insertions trivial, deletions...
• Initial work on community detection
• Forward directions
• Code: Seehttp://www.cc.gatech.edu/~bader/code.html
2

Jason Riedy, GraphEx 2011
Exascale Streaming Data Analytics: Real-world challenges
All involve analyzing massive streaming complex networks:•Health care disease spread, detection and prevention of epidemics/pandemics (e.g. SARS, Avian flu, H1N1 “swine” flu)
•Massive social networks understanding communities, intentions, population dynamics, pandemic spread, transportation and evacuation
•Intelligence business analytics, anomaly detection, security, knowledge discovery from massive data sets
•Systems Biology understanding complex life systems, drug design, microbial research, unravel the mysteries of the HIV virus; understand life, disease,
•Electric Power Grid communication, transportation, energy, water, food supply
•Modeling and Simulation Perform full-scale economic-social-political simulations
3
Exponential growth:More than 750 million active users
Sample queries: Allegiance switching: identify entities that switch communities.Community structure: identify the genesis and dissipation of communitiesPhase change: identify significant change in the network structure
REQUIRES PREDICTING / INFLUENCE CHANGE IN REAL-TIME AT SCALE
Ex: discovered minimal changes in O(billions)-size complex network that could hide or reveal top influencers in the community

Jason Riedy, GraphEx 2011
Example: Mining Twitter for Social Good
4
ICPP 2010
Image credit: bioethicsinstitute.org

Jason Riedy, GraphEx 2011
• CDC / Nation-scale surveillance of public health
• Cancer genomics and drug design– computed Betweenness Centrality
of Human Proteome
Human Genome core protein interactionsDegree vs. Betweenness Centrality
Degree
1 10 100
Be
twe
enn
ess
Ce
ntr
alit
y
1e-7
1e-6
1e-5
1e-4
1e-3
1e-2
1e-1
1e+0
Massive Data Analytics:Protecting our Nation
US High Voltage Transmission Grid (>150,000 miles of line)
Public Health
5
ENSG00000145332.2Kelch-
like protein
8implicat
ed in breast cancer

Jason Riedy, GraphEx 2011
Graphs are pervasive in large-scale data analysis
• Sources of massive data: petascale simulations, experimental devices, the Internet, scientific applications.
• New challenges for analysis: data sizes, heterogeneity, uncertainty, data quality.
Astrophysics Problem: Outlier detection. Challenges: massive datasets, temporal variations.Graph problems: clustering, matching.
BioinformaticsProblems: Identifying drug target proteins, denovo assembly.Challenges: Data heterogeneity, quality.Graph problems: centrality, clustering, path-finding.
Social InformaticsProblem: Discover emergent communities, model spread of information.Challenges: new analytics routines, uncertainty in data.Graph problems: clustering, shortest paths, flows.
Image sources: (1) http://physics.nmt.edu/images/astro/hst_starfield.jpg (2,3) www.visualComplexity.com
6

Jason Riedy, GraphEx 2011
Six degrees of Kevin BaconSource: Seokhee Hong
7
Informatics graphs are tough• Very different from graphs in scientific
computing!– Graphs can be enormous, billions of vertices and hundreds
of billions of edges!– Power-law distribution of the number of neighbors– Small world property – no long paths– Very limited locality, not partitionable
• Perhaps clusterable?– Highly unstructured– Edges and vertices have types
• Experience in scientific computing applications provides only limited insight.
7

Jason Riedy, GraphEx 2011
Center for Adaptive Supercomputing Software for MultiThreaded Architectures (CASS-MT)
• Launched July 2008
• Pacific-Northwest Lab– Georgia Tech, Sandia, WA State, Delaware
• The newest breed of supercomputers have hardware set up not just for speed, but also to better tackle large networks of seemingly random data. And now, a multi-institutional group of researchers has been awarded over $14 million to develop software for these supercomputers. Applications include anywhere complex webs of information can be found: from internet security and power grid stability to complex biological networks.
8
Image: www.visualComplexity.com
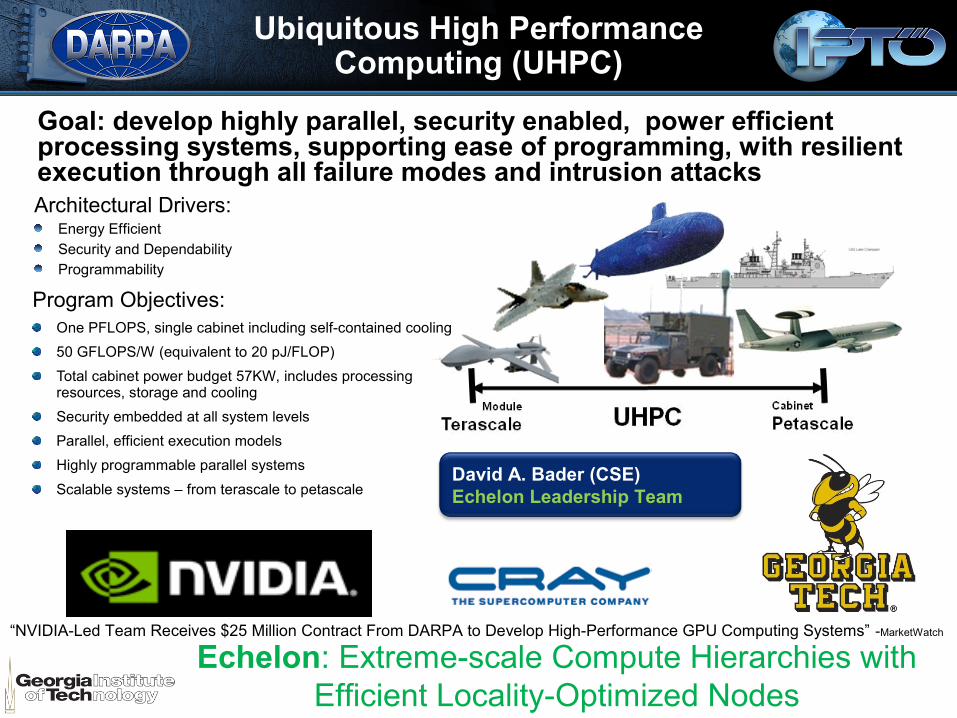
Ubiquitous High Performance Computing (UHPC)
Goal: develop highly parallel, security enabled, power efficient processing systems, supporting ease of programming, with resilient execution through all failure modes and intrusion attacks
Program Objectives:One PFLOPS, single cabinet including self-contained cooling
50 GFLOPS/W (equivalent to 20 pJ/FLOP)
Total cabinet power budget 57KW, includes processing resources, storage and cooling
Security embedded at all system levels
Parallel, efficient execution models
Highly programmable parallel systems
Scalable systems – from terascale to petascale
Architectural Drivers:Energy EfficientSecurity and DependabilityProgrammability
Echelon: Extreme-scale Compute Hierarchies with Efficient Locality-Optimized Nodes
“NVIDIA-Led Team Receives $25 Million Contract From DARPA to Develop High-Performance GPU Computing Systems” -MarketWatch
David A. Bader (CSE)Echelon Leadership Team

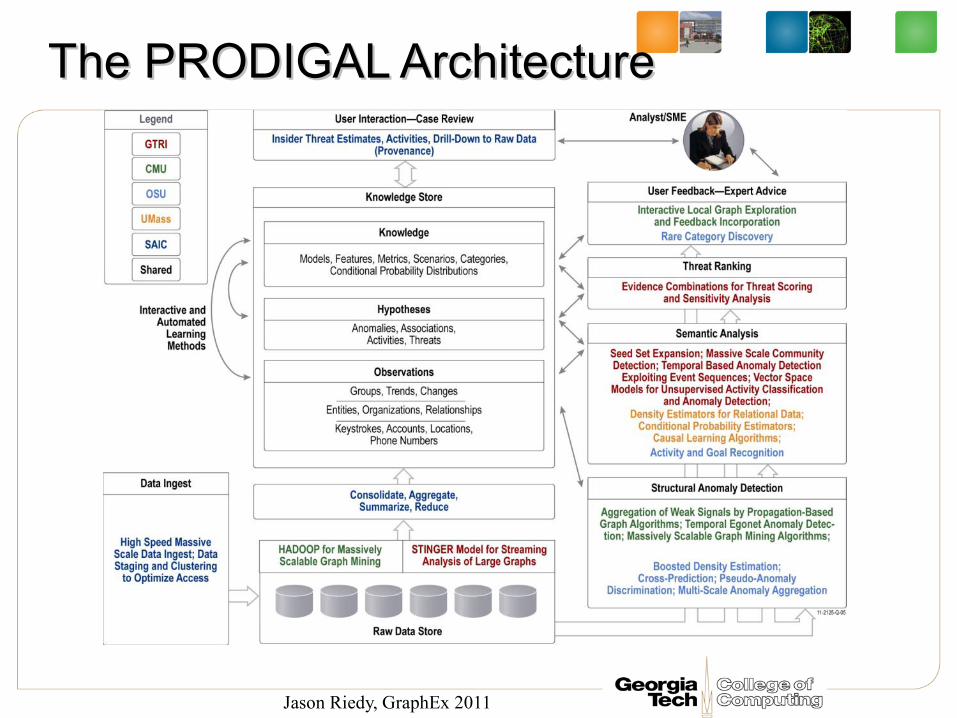
PRODIGALPRODIGAL: : Proactive Detection of Insider Proactive Detection of Insider Threats with Graph AnalysisThreats with Graph Analysisand Learningand Learning
ADAMS Program Kickoff Meeting, June 6-7, 2011ADAMS Program Kickoff Meeting, June 6-7, 2011
Tuesday June 7, 2001
SAICGeorgia Tech Research Institute
Carnegie-Mellon UniversityOregon State University
University of Massachusetts
Jason Riedy, GraphEx 2011
The PRODIGAL ArchitectureThe PRODIGAL Architecture

Jason Riedy, GraphEx 2011
Workshop on Scalable Graph Libraries
• Held at Georgia Tech, 29-30 June 2011
– Co-sponsored by PNNL & Georgia Tech
– Working workshop: Attendees collaborated on common designs and data structures.
• Break-out groups for roadmap, data structure, hierarchical capabilities, and requirement discussions.
– 33 attendees from mix of sponsors, industry, and academia.
– Outline and writing assignments given for a workshop report. To be finished August 2011.
12
Jason Riedy, GraphEx 2011
And more...
• Spatio-Temporal Interaction Networks and Graphs Software for Intel platforms
– Intel Project on Parallel Algorithms in Non-Numeric Computing, multi-year project
– Collaborators: Mattson (Intel), Gilbert (UCSD), Blelloch (CMU), Lumsdaine (Indiana)
• Graph500
– Shooting for reproducible benchmarks for massive graph-structured data
• System evaluation
– PERCS, looking at Convey systems, etc.
• (If I'm forgetting something, bug me...)
13
Jason Riedy, GraphEx 2011
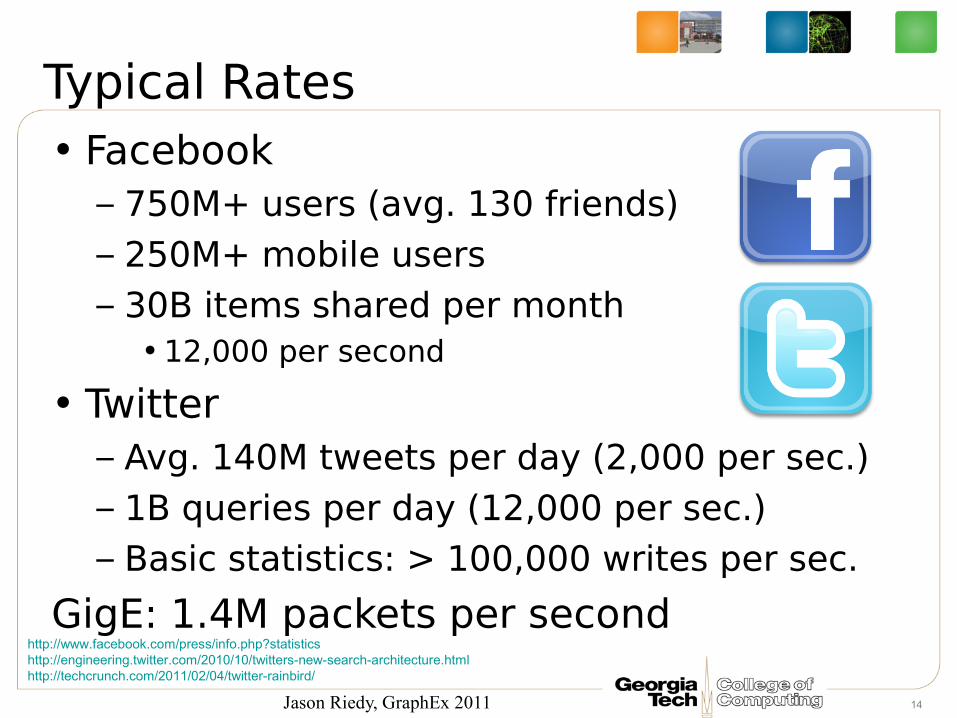
Typical Rates• Facebook
– 750M+ users (avg. 130 friends)– 250M+ mobile users– 30B items shared per month
• 12,000 per second
• Twitter– Avg. 140M tweets per day (2,000 per sec.)– 1B queries per day (12,000 per sec.)– Basic statistics: > 100,000 writes per sec.
GigE: 1.4M packets per second
14
http://www.facebook.com/press/info.php?statisticshttp://engineering.twitter.com/2010/10/twitters-new-search-architecture.htmlhttp://techcrunch.com/2011/02/04/twitter-rainbird/

Jason Riedy, GraphEx 2011
So what can we handle now?
• Accumulate edge insertions and deletions forward in an evolving snapshot.– Idea: Graph too large to keep history easily accessible.
– Want memory for metrics, sufficient statistics.
• Most results on Cray XMT @ PNNL (1TiB).
• Monitor clustering coefficients (number of triangles / number of triplets)– Exact: 50k updates/sec, Approx: 193k updates/sec
• A fast approach to tracking connected components in scale-free streaming graphs– 240,000 updates per sec
– Speed up from 3x to 20x over recomputation
• Starting on agglomerative community detection...
15
Jason Riedy, GraphEx 2011
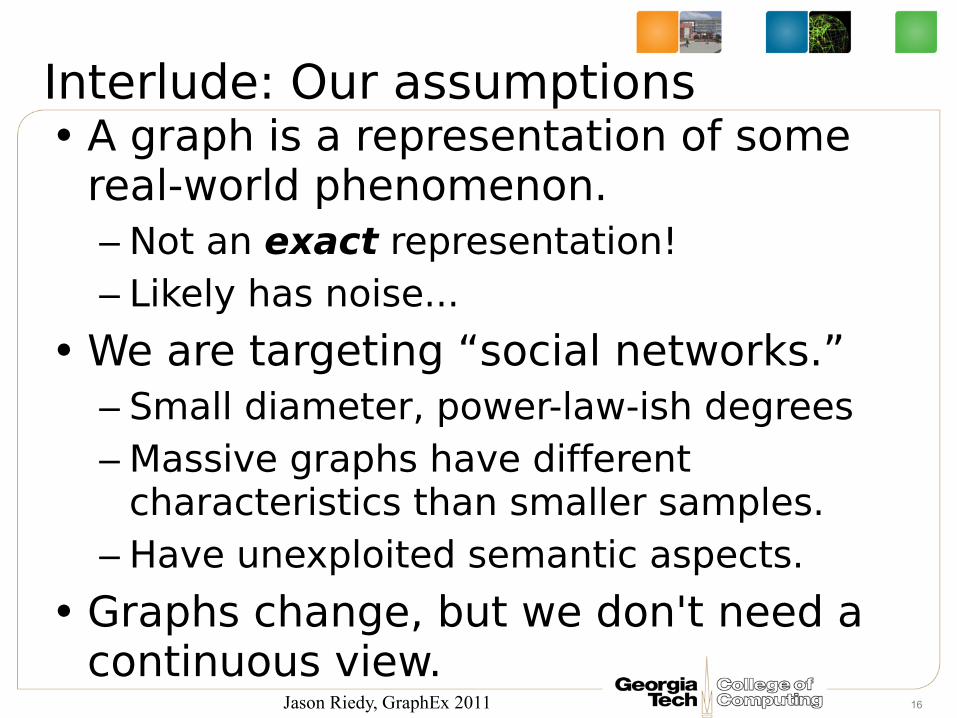
Interlude: Our assumptions• A graph is a representation of some
real-world phenomenon.– Not an exact representation!– Likely has noise...
• We are targeting “social networks.”– Small diameter, power-law-ish degrees– Massive graphs have different
characteristics than smaller samples.– Have unexploited semantic aspects.
• Graphs change, but we don't need a continuous view.
16

Jason Riedy, GraphEx 2011
The Cray XMT• Tolerates latency by massive multithreading.
– Hardware support for 128 threads on each processor– Globally hashed address space– No data cache – Single cycle context switch– Multiple outstanding memory requests
• Support for fine-grained, word-level synchronization
– Full/empty bit associated with every memory word
• Flexibly supports dynamic load balancing.
• Testing on a 128 processor XMT: 16384 threads– 1 TB of globally shared memory
Image Source: cray.com
17

Jason Riedy, GraphEx 2011
Massive streaming data analytics
• Accumulate as much of the recent graph data as possible in main memory.
18
Pre-process, Sort, Reconcile
“Age off” old vertices
Alter graph
Update metrics
STINGERgraph
Insertions / Deletions
Affected vertices
Change detection
Jason Riedy, GraphEx 2011
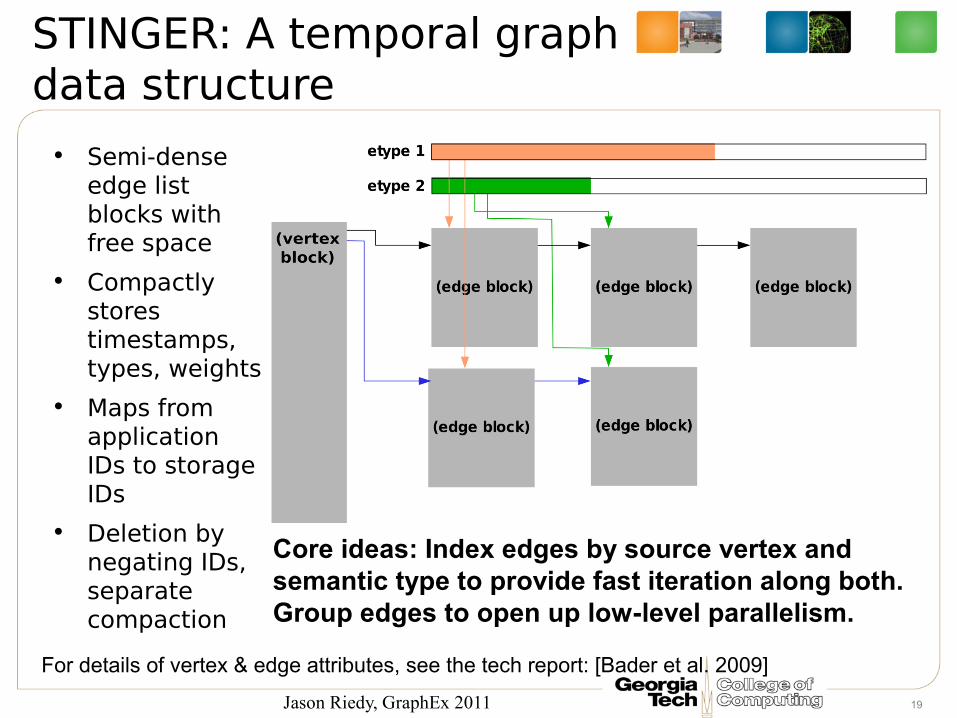
STINGER: A temporal graph data structure
• Semi-dense edge list blocks with free space
• Compactly stores timestamps, types, weights
• Maps from application IDs to storage IDs
• Deletion by negating IDs, separate compaction
19
For details of vertex & edge attributes, see the tech report: [Bader et al. 2009]
Core ideas: Index edges by source vertex and semantic type to provide fast iteration along both. Group edges to open up low-level parallelism.

Jason Riedy, GraphEx 2011
Generating artificial data
• R-MAT (Chakrabarti, Zhan, Faloutsos) as a graph & edge stream generator
• Generate the initial graph with SCALE and edge factor F, 2SCALE ∙ F edges– SCALE 20: 1 M vertices, SCALE 24: 16 M vertices– Edge factors 8, 16– Small for testing...
• Generate 1 million actions– Deletion chance 6.25% = 1/16– Same RMAT process, will prefer same vertices
• Start with correct data on initial graph• Update data (clustering coeff., components)
20

Jason Riedy, GraphEx 2011
Clustering coefficients• Vertex-local property: Number of triangles / number of triplets
– Edge insertion & deletion affects local area.
• Can approximate by compressing edge list into Bloom filter.
• Ediger, Jiang, Riedy, Bader. Massive Streaming Data Analytics: A Case Study with Clustering Coefficients (MTAAP 2010)
– Approximation provides exact result at this scale.
– B is batch size.
Algorithm B = 1 B = 1000 B = 4000
Exact 90 25,100 50,100
Approx. 60 83,700 193,300
32 of 64P Cray XMT, 16M vertices, 134M edges21
Updates per second

Jason Riedy, GraphEx 2011
Clustering coefficients performance
• Performance depends on degrees adjacent to changes, so scattered.
• 5k batches run out of parallel work quickly.• Depending on app, could focus on throughput.
22

Jason Riedy, GraphEx 2011
Tracking connected components• Global property
– Track <vertex, component> mapping
– Undirected, unweighted graphs
• Scale-free network– most changes are within one large
component
• Edge insertions– primarily merge small component
into the one large component
• Deletions– rarely disconnect components– small fraction of the edge stream
23
Jason Riedy, GraphEx 2011
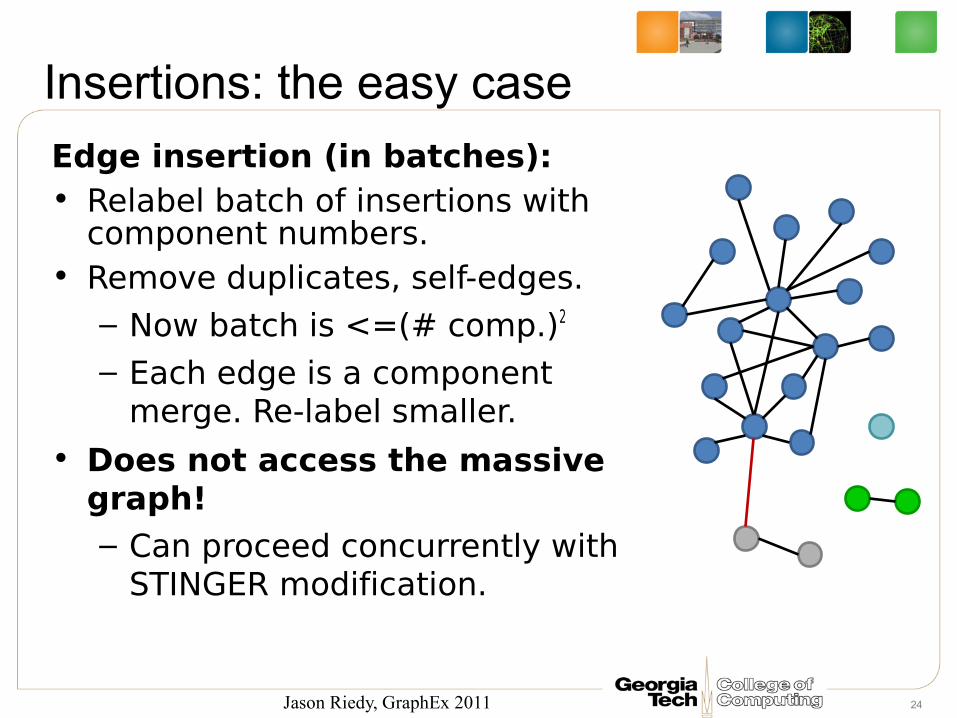
Insertions: the easy case
Edge insertion (in batches):• Relabel batch of insertions with
component numbers.• Remove duplicates, self-edges.
– Now batch is <=(# comp.)2
– Each edge is a component merge. Re-label smaller.
• Does not access the massive graph!– Can proceed concurrently with
STINGER modification.
24

Jason Riedy, GraphEx 2011
The problem with deletions
• An edge insertion is at most a merge.• An edge deletion may split components,
but rarely ever does.
25
• Establishing connectivity after a deletion could be a global operation!– But only one
component is sufficiently large...

Jason Riedy, GraphEx 2011
Not a new problem
• Shiloach & Even (1981): Two breadth-first searches– 1st to restablish connectivity, 2nd to find separation
• Eppstein et al. (1997): Partition according to degree
• Henzinger, King, Warnow (1999): Sequence & coloring
• Henzinger & King (1999): Partition dense to sparse– Start BFS in the densest subgraph and move up
• Roditty & Zwick (2004): Sequence of graphs
• Conclusions:
– In the worst case, need to re-run global component computation.
– Avoid with heuristics when possible.
26

Jason Riedy, GraphEx 2011
Handling deletions
Two methods:• Heuristics (in a moment)• Collect deletions over larger, multi-batch
epochs.– Intermediate component information is
approximate.– Could affect users (e.g. sampling), but
deletions rarely matter.– Once epoch is over, results are exact.
27
Jason Riedy, GraphEx 2011
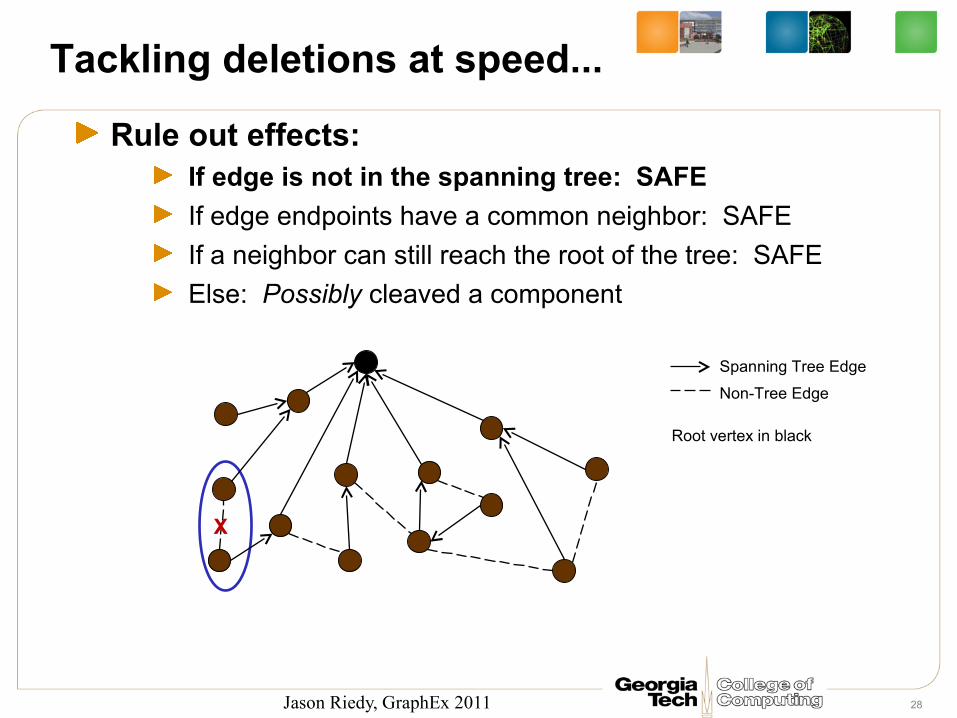
Tackling deletions at speed...
Rule out effects:If edge is not in the spanning tree: SAFE
If edge endpoints have a common neighbor: SAFE
If a neighbor can still reach the root of the tree: SAFE
Else: Possibly cleaved a component
Spanning Tree Edge
Non-Tree Edge
Root vertex in black
X
28

Jason Riedy, GraphEx 2011
Tackling deletions at speed...
Rule out effects:If edge is not in the spanning tree: SAFE
If edge endpoints have a common neighbor: SAFE
If a neighbor can still reach the root of the tree: SAFE
Else: Possibly cleaved a component
Spanning Tree Edge
Non-Tree Edge
Root vertex in black
X
29

Jason Riedy, GraphEx 2011
Tackling deletions at speed...
Rule out effects:If edge is not in the spanning tree: SAFE
If edge endpoints have a common neighbor: SAFE
If a neighbor can still reach the root of the tree: SAFE
Else: Possibly cleaved a component
Spanning Tree Edge
Non-Tree Edge
Root vertex in black
X
30
Jason Riedy, GraphEx 2011
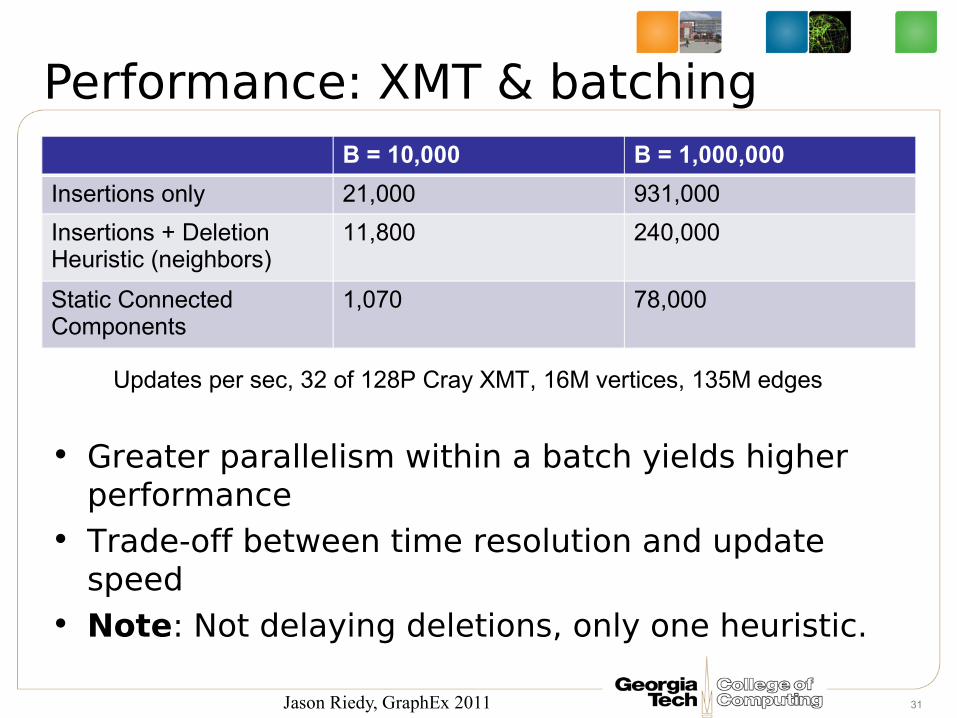
Performance: XMT & batchingB = 10,000 B = 1,000,000
Insertions only 21,000 931,000
Insertions + Deletion Heuristic (neighbors)
11,800 240,000
Static Connected Components
1,070 78,000
31
Updates per sec, 32 of 128P Cray XMT, 16M vertices, 135M edges
• Greater parallelism within a batch yields higher performance
• Trade-off between time resolution and update speed
• Note: Not delaying deletions, only one heuristic.

Jason Riedy, GraphEx 2011
Batching & data structure trade-off
32
32 of 128P Cray XMT
NV = 1M, NE = 8M NV = 16M, NE = 135M
• Insertions-only improvement 10x-20x over recomputation
• Triangle heuristic 10x-15x faster for small batch sizes
• Better scaling with increasing graph size than static connected components
Jason Riedy, GraphEx 2011
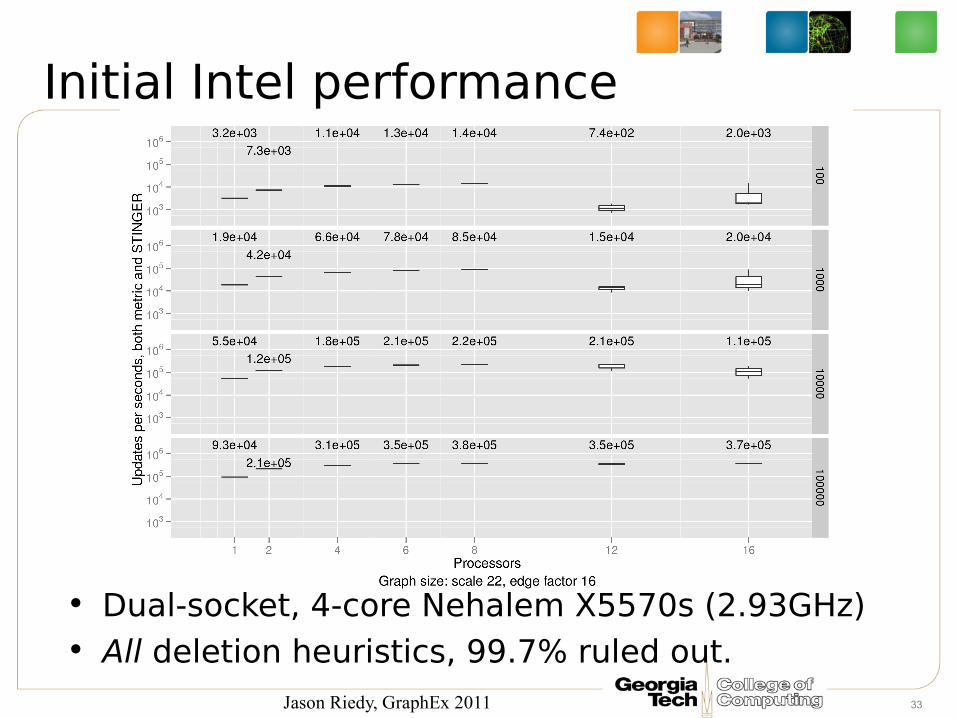
Initial Intel performance
33
• Dual-socket, 4-core Nehalem X5570s (2.93GHz)• All deletion heuristics, 99.7% ruled out.

Jason Riedy, GraphEx 2011
Community detection: Static & scalable
• Agglomerative method: Merge graph vertices to maximize modularity (or other metric).
34
• Parallel version: Compute a heavy matching, merge all at once.
• Scalable with enough data (XMT at PNNL to right, slower on Intel currently).
• 122M vertices, 2B edges: ~2 hours!

Jason Riedy, GraphEx 2011
Community detection: Quality?
• Agglomerative method: Merge graph vertices to maximize modularity (or other metric).
35
• Parallel version: Compute something different than sequential.
• Optimizing a non-linear quantity in irregular way...
• (SNAP: http://snap-graph.sf.net )

Jason Riedy, GraphEx 2011
Community detection: Streaming...
• Agglomerative method: Merge graph vertices to maximize modularity (or other metric).
• In progress...– Algorithm: Maintain agglomerated community
graph. De-agglomerate affected vertices and restart agglomeration.
– Sequential implementation promising...
• Other variations in progress, also.– Seed set expansion: Select handful of vertices
and grow a relevant region around them. Parallel within one set less interesting than maintaining many...
36

Jason Riedy, GraphEx 2011
Conclusions• Graphs are fun (a.k.a. difficult)!
– Real-world benefits and interest
• Parallel graph algorithms are possible... but not always obvious.
• Streaming opens up new avenues for performance.– Can achieve real-world rates and sizes
now with special architectures (XMT), close on common ones (Intel).
– Shooting for faster & larger & better & ...
37

Jason Riedy, GraphEx 2011
Related publications• D. A. Bader, J. Berry, A. Amos-Binks, D. Chavarría-Miranda, C. Hastings, K. Madduri, and S.
C. Poulos, “STINGER: Spatio-Temporal Interaction Networks and Graphs (STING) Extensible Representation,” Georgia Institute of Technology, Tech. Rep., 2009.
• D. Ediger, K. Jiang, J. Riedy, and D. Bader. “Massive Streaming Data Analytics: A Case Study with Clustering Coefficients,” Fourth Workshop on Multithreaded Architectures and Applications (MTAAP), Atlanta, GA, April 2010.
• D. Ediger, K. Jiang, J. Riedy, D. Bader, C. Corley, R. Farber, and W. Reynolds. “Massive Social Network Analysis: Mining Twitter for Social Good,” International Conference on Parallel Processing, San Diego, CA September 13-16, 2010.
• D. Ediger, J. Riedy, D. Bader, and H. Meyerhenke. “Tracking Structure of Streaming Social Networks,” Fifth Workshop on Multithreaded Architectures and Applications (MTAAP), 2011.
• J. Riedy, D. Bader, K. Jiang, P. Panda, and R. Sharma. “Detecting Communities from Given Seed Sets in Social Networks.” Georgia Tech Technical Report http://hdl.handle.net/1853/36980
• J. Riedy, H. Meyerhenke, D. Ediger, and D. Bader. “Parallel Community Detection for Massive Graphs,” Ninth International Conference on Parallel Processing and Applied Mathematics, September 11-14 2011.
38
Jason Riedy, GraphEx 2011
References• D. Chakrabarti, Y. Zhan, and C. Faloutsos, “R-MAT: A recursive model for
graph mining,” in Proc. 4th SIAM Intl. Conf. on Data Mining (SDM). Orlando, FL: SIAM, Apr. 2004.
• D. Eppstein, Z. Galil, G. F. Italiano, and A. Nissenzweig, “Sparsification—a technique for speeding up dynamic graph algorithms,” J. ACM, vol. 44, no. 5, pp. 669–696, 1997.
• M. R. Henzinger and V. King, “Randomized fully dynamic graph algorithms with polylogarithmic time per operation,” J. ACM, vol. 46, p. 516, 1999.
• M. R. Henzinger, V. King, and T. Warnow, “Constructing a tree from homeomorphic subtrees, with applications to computational evolutionary biology,” in Algorithmica, 1999, pp. 333–340.
• L. Roditty and U. Zwick, “A fully dynamic reachability algorithm for directed graphs with an almost linear update time,” in Proc. of ACM Symposium on Theory of Computing, 2004, pp. 184–191.
• Y. Shiloach and S. Even, “An on-line edge-deletion problem,” J. ACM, vol. 28, no. 1, pp. 1–4, 1981.
39

Jason Riedy, GraphEx 2011
Acknowledgment of Support
40