tracking to 2020 interim update - accessible · web viewlng exported from australia is generally...
TRANSCRIPT

Tracking to 2020An interim update of Australia’s greenhouse gas emissions projections
December 2015

© Commonwealth of Australia, 2015.
Tracking to 2020 is licensed by the Commonwealth of Australia for use under a Creative Commons By Attribution 3.0 Australia licence with the exception of the Coat of Arms of the Commonwealth of Australia, the logo of the agency responsible for publishing the report, content supplied by third parties, and any images depicting people. For licence conditions see: http://creativecommons.org/licenses/by/3.0/au/
This report should be attributed as ‘Tracking to 2020, Commonwealth of Australia 2015’.
The Commonwealth of Australia has made all reasonable efforts to identify content supplied by third parties using the following format ‘© Copyright, [name of third party] ’.
Further information about projections of greenhouse gas emissions is available on the Department of the Environment’s website: www.environment.gov.au. To contact the Projections team, please email [email protected]
DisclaimerThe views and opinions expressed in this publication are those of the authors and do not necessarily reflect those of the Australian Government or the Minister for the Environment.

ContentsIntroduction 2
Overview 3
Sectoral trends9Electricity........................................................................................................................................................................... 9
Direct combustion............................................................................................................................................................ 10
Transport......................................................................................................................................................................... 11
Fugitives.......................................................................................................................................................................... 13
Industrial processes and product use.............................................................................................................................. 14
Agriculture........................................................................................................................................................................ 15
Waste............................................................................................................................................................................... 17
Land use, land use change and forestry.......................................................................................................................... 17
Appendix A—Methodology and key assumptions 20
Appendix B—Change from previous projections 25
Appendix C—Emissions Reduction Fund methods 27
Appendix D—References 30In this report: totals may not sum due to rounding years contained in charts and tables refer to the financial year ending of the year shown percentages have been calculated prior to being rounded to the nearest whole number figures that are less than 0.1 are written as <0.1.
IntroductionTracking to 2020 is an interim update of Australia’s domestic emissions projections to 2019–20 and shows how Australia is tracking to meet the abatement task associated with the 2020 emissions target. The projections include an estimate of abatement from the Emissions Reduction Fund for the first time.
These projections are based on:

historical emissions data from Australia’s National Greenhouse Accounts: National Greenhouse Gas Inventory and Quarterly update of Australia’s National Greenhouse Gas Inventory, June Quarter 2015;
macroeconomic parameters consistent with the Australian Government’s 2015–16 Budget; and commodity forecasts and activity levels from a range of sources, as outlined in Appendix A.
The projections are prepared based on information and analysis available at a point in time. Therefore they do not take account of information that has recently been released, such as the International Energy Agency’s World Energy Outlook (2015), or estimates of abatement from policies and initiatives that are still in the early stages of development. These include: the National Energy Productivity Plan, which is being progressed in collaboration with the states and territories through
the Council of Australian Governments’ Energy Council; a Ministerial forum to commence work on improving the fuel efficiency of Australia’s vehicle fleet; and Australia’s announcement that it will work with other countries to phase-down the use of hydrofluorocarbons (HFCs) by
85 per cent by 2036.
It is also the case that the adoption of Intended Nationally Determined Contributions (INDCs) by the large majority of the countries of the world will result in technological innovations and changes in trade flows as countries take action to meet their commitments. Collectively, these factors will likely reduce Australia’s emissions and the effects will be progressively quantified in future projections.
Emissions projections are inherently uncertain, involving judgements about the growth path of future global and domestic economies, policies and measures, technological innovation and human behaviour. This uncertainty increases the further into the future emissions are projected. This report indicates what future emissions could be if the assumptions that underpin the projections continue to occur. The projections do not attempt to account for, or speculate on, the inevitable, but as yet, unknown changes that will occur, for example, in technology, government policy or the international and domestic economy. In short, this report is not a forecast of future emissions.
Calculation of Australia’s cumulative abatement task to 2020The Australian Government is committed to reducing emissions to five per cent below 2000 levels by 2020, equivalent to 13 per cent below 2005 levels. This target has been reported as a commitment under the United Nations Framework Convention on Climate Change. Australia’s 2020 target trajectory is calculated by taking a linear decrease from 2009–10 to 2019–20, beginning from the mid-point of the Kyoto Protocol first commitment period (CP1, 2008 to 2012) target level and ending at five per cent below 2000 levels in 2020.
The cumulative abatement task is defined as the difference in cumulative emissions over the Kyoto Protocol second commitment period (CP2, 2013 to 2020) and the target trajectory.
Institutional arrangements and quality assurance The projections are prepared by the Department of the Environment using the best available data and independent expertise to analyse Australia’s future emissions abatement task. The Department engages with a technical working group comprising of representatives from Commonwealth agencies to test the methodologies, assumptions and projections results. Australia makes formal submissions on its emissions projections to the United Nations and these are periodically subject to UN expert review.
OverviewThis interim update provides revised emissions projections for Australia to the year 2019–20, updating Australia’s emissions projections 2014–15, released in March 2015. The updated projections indicate that Australia will meet, in cumulative abatement terms, the Government’s target of a five per cent reduction in emissions on year 2000 levels by

2020.
Cumulative abatement task to 2020On current estimates the cumulative abatement task to 2020 is -28 Mt CO2-e1 (million tonnes of carbon dioxide equivalent). This compares with the cumulative abatement task of 236 Mt CO2-e reported in Australia’s emissions projections 2014–15 (Department of the Environment 2015a). Figure 1 shows the change in the cumulative abatement task.
Australia’s cumulative abatement task has steadily fallen as the Australian economy has become less emissions intensive; international carbon accounting rules have been revised to improve the measurement and recording of emissions; and the emissions outlook at the sectoral level have been updated with the latest data.
Figure 1 Cumulative abatement task over time
Note: The cumulative abatement task has been derived for the period 2013 to 2020 using the information available in each publication. It is important to note that year to year figures are not directly comparable as the underlying assumptions and policy measures differ. Emissions accounting approaches to comply with international reporting standards and target trajectories are also different between projections.
In the period 2013 to 2020, Australia is below the target trajectory in some years and the area below the trajectory (blue area) counts as a reduction to the cumulative abatement task (Figure 2). The cumulative abatement task is -28 Mt CO2-e (calculated as the grey area minus the blue area, minus the orange area, which represents the carryover from the Kyoto Protocol first commitment period), taking account of voluntary international units under the Waste Industry Protocol.
Figure 2 Cumulative abatement task, 2013 to 2020
1 The carryover estimate has been updated from 129 Mt CO2-e to 128 Mt CO2-e as part of the finalisation of Australia’s true-up for the first commitment period under the Kyoto Protocol. These estimates also take account of voluntary action of 8 Mt CO2-e. Voluntary action refers to individuals and companies offsetting their emissions to become ‘carbon-neural’ and households buying GreenPower (a government-accredited program for energy retailers to purchase renewable energy on behalf of customers). Voluntary action achieves emissions reductions additional to—that is, above and beyond—national targets.

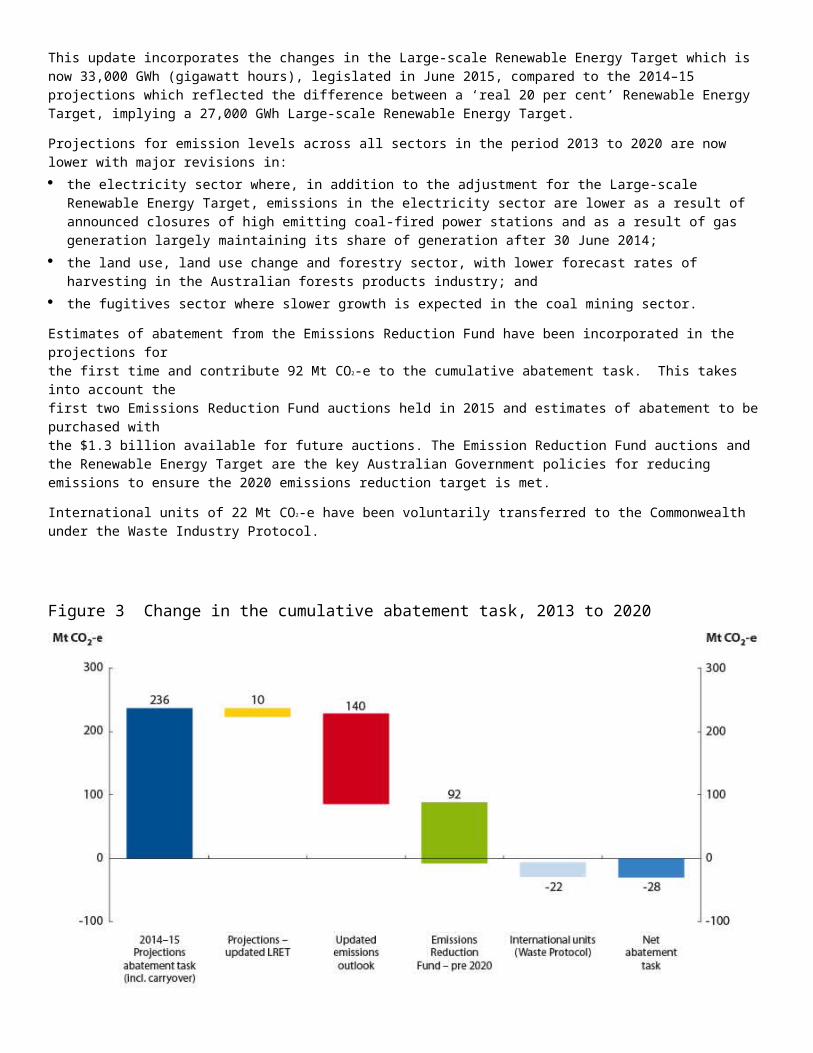
This update incorporates the changes in the Large-scale Renewable Energy Target which is now 33,000 GWh (gigawatt hours), legislated in June 2015, compared to the 2014–15 projections which reflected the difference between a ‘real 20 per cent’ Renewable Energy Target, implying a 27,000 GWh Large-scale Renewable Energy Target.
Projections for emission levels across all sectors in the period 2013 to 2020 are now lower with major revisions in: the electricity sector where, in addition to the adjustment for the Large-scale Renewable Energy Target, emissions in
the electricity sector are lower as a result of announced closures of high emitting coal-fired power stations and as a result of gas generation largely maintaining its share of generation after 30 June 2014;
the land use, land use change and forestry sector, with lower forecast rates of harvesting in the Australian forests products industry; and
the fugitives sector where slower growth is expected in the coal mining sector.
Estimates of abatement from the Emissions Reduction Fund have been incorporated in the projections for the first time and contribute 92 Mt CO2-e to the cumulative abatement task. This takes into account the first two Emissions Reduction Fund auctions held in 2015 and estimates of abatement to be purchased with the $1.3 billion available for future auctions. The Emission Reduction Fund auctions and the Renewable Energy Target are the key Australian Government policies for reducing emissions to ensure the 2020 emissions reduction target is met.
International units of 22 Mt CO2-e have been voluntarily transferred to the Commonwealth under the Waste Industry Protocol.
Figure 3 Change in the cumulative abatement task, 2013 to 2020
Revised annual projectionsThe updated projections show less growth in emissions compared with the 2014–15 projections. Emissions are rising from 560 Mt CO2-e in 2014–15 to 593 Mt CO2-e in 2019–20, which is 63 Mt CO2-e lower than the 2014–15 projections’ estimate for 2019–20 of 656 Mt CO2-e (Figure 4). It is expected that estimated emissions in 2019–20 will be revised down in future projections once emissions reductions from additional policies and initiatives22 are included.
Figure 4 Projected emissions in 2020 over time
Note: Projected emissions in 2020 have been calculated using the information available in each publication. It is important to note that year to year figures are not directly comparable as the underlying assumptions and policy measures differ. Emissions accounting approaches to comply with international reporting standards and target trajectories are also different between projections.
2 2For example the National Energy Productivity Plan, fuel efficiency standards for light vehicles and the phase-down of HFCs.

Figure 5 and Table 1 show domestic emissions by sector. The key changes expected in emissions by sector to 2019–20 are: expected growth in Liquefied Natural Gas (LNG) production will result in emissions from this industry increasing by
over 27 Mt CO2-e. This represents around three quarters of the expected increase in Australia’s emissions to 2019–20, with the increase projected in the electricity, direct combustion and fugitives sectors. LNG exported from Australia is generally used for gas-fired power generation which is considered an important fuel for many countries looking to reduce their energy-related emissions;
emissions related to transport are expected to increase by around 10 Mt CO2-e due to growth in passenger vehicle and the continuation of low oil prices. The finalisation of fuel efficiency standards will likely lead to a significant downward revision in the emissions outlook for this sector;
emissions associated with growth in coal exports are expected to rise by over 4 Mt CO2-e by 2019–20. This estimate will be reviewed in future projections as the impact of low international coal prices is further assessed; and
emissions associated with HFCs and other synthetic gases are expected to rise by around 2 Mt CO2-e and measures to phase-down HFCs would see this trend reverse.
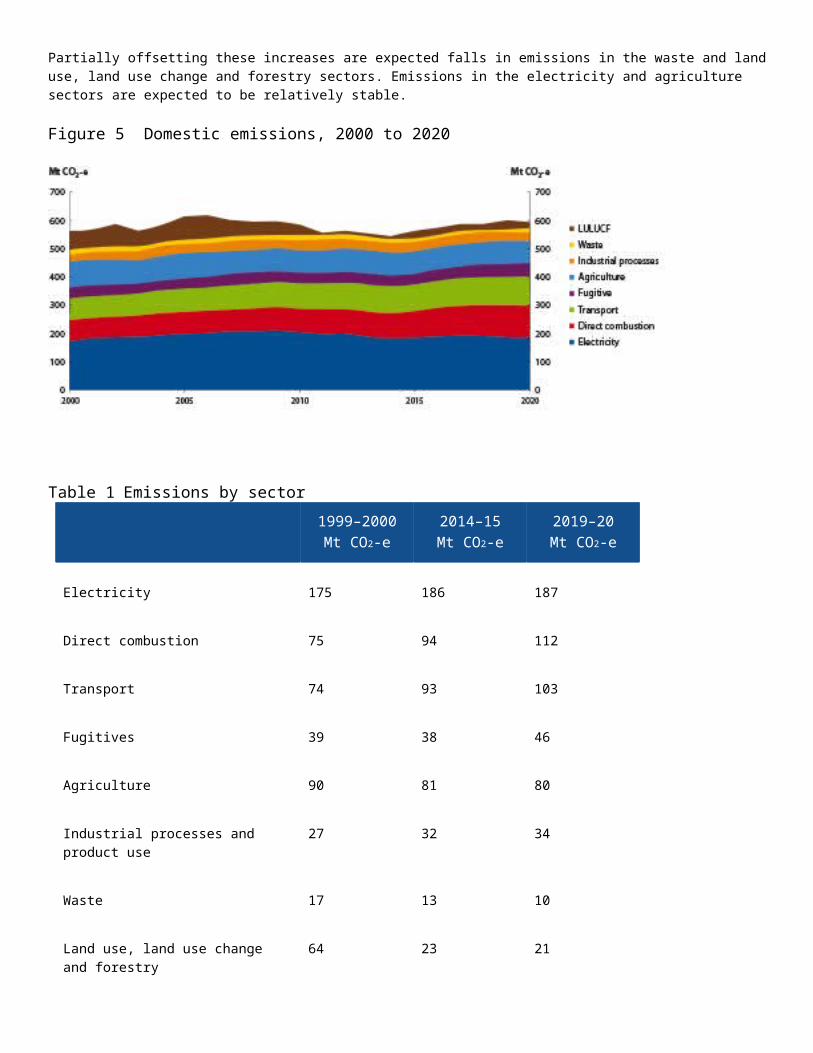
Partially offsetting these increases are expected falls in emissions in the waste and land use, land use change and forestry sectors. Emissions in the electricity and agriculture sectors are expected to be relatively stable.
Figure 5 Domestic emissions, 2000 to 2020
Table 1 Emissions by sector
1999–2000Mt CO2-e
2014–15Mt CO2-e
2019–20Mt CO2-e
Electricity 175 186 187
Direct combustion 75 94 112
Transport 74 93 103
1999–2000Mt CO2-e
2014–15Mt CO2-e
2019–20Mt CO2-e
Fugitives 39 38 46
Agriculture 90 81 80
Industrial processes and product use 27 32 34
Waste 17 13 10
Land use, land use change and forestry
64 23 21
Total 560 560 593
Indicators of the emissions intensity per unit of production in the economy (Figure 6) have declined and it is expected that the emissions intensity of GDP will have fallen by 42 per cent by 2019–20 compared to 1999–2000. Emissions per person (Figure 7) is also expected to continue to fall steadily by 22 per cent in 2019–20 compared to 1999–2000.
Figure 6 Emissions intensity of GDP, 2000 to 2020
Figure 7 Emissions per capita, 2000 to 2020

Sectoral trendsElectricityEmissions from electricity generation are the result of fuel combustion for the production of electricity on-grid and off-grid. Electricity generation represents the largest share of emissions in the national greenhouse gas inventory, accounting for 33 per cent of emissions in 2014–15.
Figure 8 shows that electricity emissions have increased slightly by 11 Mt CO2-e since 1999–2000, or 6 per cent in 2014–15. Growth in electricity emissions to 2020 is relatively flat, increasing by 1 per cent from 186 Mt CO2-e in 2014–15 to 187 Mt CO2-e in 2020. This is approximately 32 per cent of Australia’s emissions in 2019–20.
Electricity demand from general business and large industry, for example manufacturing and mining facilities, is expected to increase in line with economic growth, while residential energy demand is expected to rise with population growth. To 2019–20 electricity demand in Australia is expected to grow, largely from electricity demand from new LNG projects.
Figure 8 Electricity generation emissions, 2000 to 2020

Source: Department of the Environment 2015b; Department of the Environment analysis
Since 2008–09 there has been a significant decrease (12 per cent) in emissions from electricity generation, driven by both demand and supply side factors, with electricity emissions reaching its lowest point in 2013–14. A number of drivers contributed to the drop in demand including a consumer response to an increase in retail electricity prices; energy efficiency improvements in buildings and technology; and structural change in the economy, including a reduction in output from some manufacturing sectors. On the supply side there was a shift towards less emission intensive sources like gas and wind power. Hydro electricity output was also above long term average levels over the period 1 July 2012 to 30 June 2014. Electricity generation from renewables and black and brown coal has increased over 2014–15, while generation from gas and hydro fell.
The projections show electricity emissions continuing to rise until around 2016–17, when the effects of the Large-scale Renewable Energy Target begin to play a noticeable part in lowering electricity emissions (Figure 8). In 2016–17 electricity emissions decrease before flat-lining to 2019–20 as a result of increases in wind generation, particularly in the eastern states. Wind and solar PV generation is expected to dominate new capacity investment until the mid 2020s as a consequence of the Large-scale Renewable Energy Target. These results also include abatement from energy efficiency projects under the Emissions Reduction Fund.
Also contributing to the decline in emissions to 2019–20 is a decrease in coal-fired generation. The recent retirement of some aging coal power stations, as well as a slower than expected return to coal generation levels from before 1 July 2012, sees coal as a proportion of electricity generation fall from 69 per cent in 2015–16 to 60 per cent by 2019–20. Less emissions-intensive gas generation continues to maintain its share of electricity generation (around 14 per cent) over the projections period.
Figure 9 Electricity generation by technology, 2015 to 2020

Source: Jacobs Australia 2015
Direct combustionThe direct combustion sector is broken down into six subsectors: energy, mining, manufacturing, buildings, primary industries and other. Emissions from direct combustion are from the burning of fuels for energy used directly, in the form of heat, steam or pressure (excluding for electricity generation and transport). Energy used in mobile equipment in mining, manufacturing, construction, agriculture, forestry and fishing is also included in direct combustion as opposed to transport.
Figure 10 shows that emissions in the direct combustion sector have increased by 27 per cent since 1999–2000, to be 94 Mt CO2-e in 2014–15. Emissions are projected to be 112 Mt CO2-e in 2019–20, an increase of 19 per cent above 2014–15 levels. These results include abatement from industrial energy efficiency projects under the Emissions Reduction Fund.
Over the period from 2014–15 to 2019–20, growth in direct combustion emissions is mostly driven by the expected increase in LNG production by over 200 per cent. This leads to direct combustion emissions from LNG increasing from 6 Mt CO2-e to 19 Mt CO2-e over the period. The other significant area of growth over the period to 2019–20 is the mining subsector, where direct combustion emissions are projected to increase by 25 per cent from 18 Mt CO2-e to 22 Mt CO2-e.
Figure 10 Direct combustion emissions, 2000 to 2020
Source: Department of the Environment 2015b; Department of the Environment analysis

The majority of growth in the direct combustion sector over the projections period is driven by an expected growth in exports of Australian commodities. Increased production volumes of resources following a period of investment and Australia’s proximity to emerging economies such as China and India means that export volumes are expected to increase, despite global commodity prices being expected to drop (Office of the Chief Economist 2015).
The Australian LNG industry is expected to continue its rapid expansion. Coal production is also expected to increase and this is expected to result in an increase in direct combustion coal emissions of 18 per cent over the projections period from 8 Mt CO2-e to 9 Mt CO2-e. The projected increase in coal exports is due to demand from developing economies, particularly from Asia.
Other mining, mostly driven by growth in iron and gold ore exports, is projected to increase by 31 per cent over the projections period from 10 Mt CO2-e to 13 Mt CO2-e. The projected increase in iron ore exports is due to a number of factors, including increases in steel consumption in China in the medium term, as an oversupply of iron and low steel prices in the domestic Chinese market makes switching from highcost domestic iron ore to low-cost imported iron ore a more competitive option. Gold ore production is expected to increase slowly but steadily over the projections period as existing mines increase their output.
Manufacturing of goods and commodities forms the largest subsector of direct combustion (40 per cent of direct combustion emissions in 2014–15), with most emissions resulting from the manufacture of basic non-ferrous metals (such as alumina and nickel). Projected growth in the non-ferrous metals, non-metallic minerals and food and beverage processing subsectors, driven by export demand for Australian produce and commodities, is expected to lead to manufacturing emissions increasing by 4 per cent over the period 2014–15 to 2019–20.
Emissions from the buildings and other subsectors are projected to remain constant over the projections period, while direct combustion emissions from petroleum refining are projected to drop.
TransportThe transport sector includes emissions from the combustion of fuels in transportation by road, rail, domestic shipping, domestic aviation, off-road recreational vehicle activity and pipeline transport. Road transport includes private passenger vehicles (cars and motorcycles), light commercial vehicles, rigid trucks, articulated trucks and buses. Emissions from electricity used in electric vehicles and rail are accounted for under electricity generation. Emissions from the production and refining of oil-based fuels, including biofuels, are accounted for elsewhere in the inventory.
Emissions in the transport sector have increased by 25 per cent since 1999–2000, to be 93 Mt CO2-e in 2014–15 (Figure 11). Emissions are projected to be 103 Mt CO2-e in 2019–20, an increase of 11 per cent above 2014–15 levels. Transport emissions are projected to grow as a result of projected increases in transport activity, largely reflecting economic and population growth. These results include abatement from transport emissions reduction projects under the Emissions Reduction Fund.
Road transport is the dominant source of transport emissions accounting for 78 Mt CO2-e in 2014–15. Road transport emissions are projected to be 85 Mt CO2-e in 2019–20.
Cars are the largest contributor of road transport emissions, accounting for 43 Mt CO2-e in 2014–15. Car emissions are projected to increase steadily due to continued growth in the number of passenger vehicles, the recent drop in oil prices and increases in diesel consumption.
Freight transport (rigid trucks, articulated trucks and light commercial vehicles) emissions are expected to increase over the projections period due to increased activity and limited uptake of low emissions fuels. Freight emissions are projected to increase to 38 Mt CO2-e in 2019–20 in line with economic growth and continued growth in coal and iron ore exports.
Road fuel mix is dominated by petrol and diesel, accounting for 95 per cent of fuel consumption in road transport in 2014–15. A similar trend is projected to continue in future due to relatively low oil prices resulting in subdued uptake of alternative fuels in the road sector.

Figure 11 Transport emissions, 2000 to 2020
Source: Department of the Environment 2015b; Department of the Environment analysis
Emissions from non-road transport were 15 Mt CO2-e in 2014–15, contributing 16 per cent of transport emissions. Growth in emissions is largely driven by the domestic aviation and rail subsectors.
Domestic aviation is expected to have the strongest growth driven by falling airfares due to increased competition, lower oil prices and an increasing passenger preference for air travel over road or rail.
Growth in rail emissions is driven mainly by projected increase in freight activity. Freight rail activity is expected to increase slightly faster than passenger rail activity predominantly due to continued growth in iron ore exports.
Domestic shipping emissions are expected to grow more slowly than other sectors due to lower projected growth in petroleum oil and iron and steel production in Australia.
Fugitives Fugitive emissions occur during the production, processing, transmission and distribution of fossil fuels. The major sources of fugitive emissions are the intentional release or combustion of waste gases and unintended leakage. These emissions sources are predominantly from underground coal mines. Fugitive emissions do not include emissions from fuel combusted to generate electricity, operate plant equipment, or transport fossil fuels by road, rail or sea.
Fugitive emissions from fossil fuels have decreased by 2 per cent since 1999–2000, to be 38 Mt CO2-e in 2014–15 (Figure 12). Total fugitive emissions are projected to reach 46 Mt CO2-e in 2019–20, an increase of 21 per cent on 2014–15 levels. These results include abatement from industrial fugitive emissions reduction projects under the Emissions Reduction Fund.
Over the projections period, fugitive emissions are expected to rise from all subsectors other than oil and domestic gas, which are largely stable. Emissions growth is dominated by expected increases in coal and LNG production. Fugitive emissions from coal are expected to rise by 3 Mt CO2-e and fugitive emissions from LNG are expected to rise by 4 Mt CO2-e.
Figure 12 Fugitives emissions, 2000 to 2020

Source: Department of the Environment 2015b; Department of the Environment analysis
CoalCoal mine fugitive emissions were 25 Mt CO2-e in 2014–15; 66 per cent of total fugitive emissions. From 2014–15 to 2019–20, coal mine fugitive emissions are projected to increase by 13 per cent to 29 Mt CO2-e. Coal production is projected to increase to meet projected increases in export demand from China and India, for steel making and electricity generation.
Coal fugitive emissions are projected to grow strongly between 2014–15 and 2019–20 reflecting the strong growth in production. Underground mines generally produce more fugitive emissions than surface mines because they contain more methane. While significant growth in coal production is expected over the projection period, much of this is expected to be from surface mines. Emissions are therefore not expected to grow as quickly as production. Fugitive emissions from mines producing brown coal are minimal, at just <0.1 Mt CO2-e in 2014–15.
Natural gas and oilFugitive emissions from natural gas and oil are estimated to have been 13 Mt CO2-e in 2014–15, 34 per cent of total fugitive emissions. Natural gas and oil fugitive emissions are projected to increase by 36 per cent from 2014–15 to 2019–20. Most of the projected increase in natural gas and oil fugitive emissions is a result of the rapid expansion of Australia’s LNG industry currently underway to meet expected demand from Asian markets. Fugitive emissions from LNG are estimated to have been 3 Mt CO2-e in 2014–15, 8 per cent of total fugitive emissions. In 2019–20 they are projected to more than double to reach 7 Mt CO2-e.
The growth in projected fugitive LNG emissions is a result of a projected increases in Australian LNG production of more than 200 per cent over the projections period, reaching around 76 Mt LNG in 2019–20. This increase is largely driven by growing demand from China, South Korea and Japan, and by 2019–20, Australia is projected to become the world’s largest LNG exporter. A number of new LNG projects are expected to commence production from 2015–16 to 2017–18, which will see Australia’s nameplate capacity increase to around 87 Mt LNG by 2019–20 (Office of the Chief Economist 2015).

Fugitive emissions from LNG are highly dependent on the carbon dioxide content of the raw gas, which varies between projects and gas fields. The carbon dioxide content of coal seam gas fields is generally much lower than conventional fields. The emissions intensity of Australian LNG production is projected to decline in 2017–18 due to the commencement of the major coal seam gas to LNG projects. From 2017–18, the emissions intensity of LNG production is projected to increase above 2014–15 levels as conventional gas fields with higher emissions intensity are expected to begin production.
Fugitive emissions from domestic gas are estimated to have been 9 Mt CO2-e in 2014–15, 23 per cent of total fugitive emissions. In 2019–20 emissions are projected to remain stable at around 9 Mt CO2-e. The major end users of gas in Australia are the electricity generation, industry and residential and commercial sectors.
Fugitive emissions from oil production and refining were 1 Mt CO2-e in 2014–15, 3 per cent of total fugitive emissions. Over the projections period, fugitive emissions from oil are projected to remain at 1 Mt CO2-e.
Industrial processes and product useThe industrial processes and product use sector includes emissions from non-energy related production processes involving the use of carbonates (such as limestone and dolomite), carbon when used as a chemical reductant (such as iron and steel or aluminium production), chemical industry processes (such as ammonia and nitric acid production), the production and use of synthetic gases such as HFCs or sulphur hexafluoride, combustion of lubricant oils not used for fuel and carbon dioxide generated in food production. Emissions from nitrogen trifluoride (NF3) are negligible in Australia and, in accordance with reporting guidelines, are not estimated.
Industrial processes and product use emissions were 32 Mt CO2-e in 2014–15, a 19 per cent increase above 1999–2000 levels (Figure 13). Emissions are projected to be 34 Mt CO2-e in 2019–20, a slight increase of 6 per cent above 2014–15 levels.
Figure 13 Industrial processes and product use emissions, 2000 to 2020
Source: Department of the Environment 2015b; Department of the Environment analysis
The increase in industrial processes and product use emissions is primarily due to the increasing take up of equipment using HFCs, which leak gases gradually over their lifetime. The historically rapid growth in emissions from product uses as substitutes for ozone depleting substances is projected to slow by 2019–20 due to the almost complete replacement of

chlorofluorocarbons (CFCs) and hydrochlorofluorocarbons (HCFCs) with HFCs.
Emissions from iron and steel production, aluminium production and clinker production are projected to decline or remain steady throughout the projections period. A number of facility closures in 2014–15, such as Alcoa’s aluminium smelter at Point Henry, and Adelaide Brighton’s Munster and Boral’s Maldon clinker plants, will see projected emissions from metal and mineral production initially fall over the 2014–15 to 2019–20 period. Production from these subsectors has been affected by competition from low-cost producing countries, and low output prices resulting from excess world production capacity. Low prices and excess capacity are projected to continue throughout the period to 2019–20 (Office of the Chief Economist, 2015, IBISWorld 2015). Whilst emissions from metal production continue to decline out to 2019–20, emissions from the production of mineral products are projected to increase later in the period as lime production rises in response to growing demand from road construction and the agriculture sector, offsetting the decline in emissions from clinker production.
Emissions from the chemical industry are projected to grow between 2014–15 and 2019–20 as several new ammonium nitrate plants are expected to be established. These plants manufacture ammonium nitrate for use in explosives, primarily to supply the growing iron ore mining industry in Australia.
Emissions from the remaining subsectors: other product manufacture and use; non-energy products from fuels and solvents; and other production, constituted less than 2 per cent of industrial processes and product use emissions in 2014–15. Emissions were 0.6 Mt CO2-e in 2014–15, a decrease of 8 per cent below 1999–2000 levels. Emissions are projected to remain around 0.6 Mt CO2-e in 2019–20.
AgricultureThe agriculture sector includes emissions from enteric fermentation, manure management, rice cultivation, agricultural soils, prescribed burning of savanna and field burning of agricultural residues. It does not include emissions from electricity use or fuel combustion from operating equipment, which are included in the direct combustion sector. With the exception of carbon dioxide from the application of lime and urea, carbon dioxide emissions from agriculture are not counted because they are considered part of the natural carbon cycle.
Agriculture emissions have decreased by 10 per cent since 1999–2000, to be 81 Mt CO2-e in 2014–15. Once abatement from the Emissions Reduction Fund has been taken into account, emissions from agriculture are projected to be 80 Mt CO2-e in 2019–20, a 2 per cent decrease on 2014–15 levels.
Most agriculture emissions come from enteric fermentation and manure management associated with livestock production. Approximately 70 per cent of agriculture emissions in 2014–15 came from grazing beef cattle (42 per cent), sheep (16 per cent), and dairy (11 per cent). As a result, any variation in agricultural livestock production, particularly beef and lamb, has a significant impact on emissions in the sector.
Figure 14 shows that from 1999–2000 to 2014–15, emissions from agriculture fell by 10 per cent, although emissions were highly variable. Periods of low rainfall, from which there was some relief in 2004–05 and 2010–11, have caused reductions in agricultural activity and emissions. Significant restructuring of the sheep industry has also seen an ongoing decline in sheep numbers and emissions, which has stabilised since 2007–08.
Figure 14 Agriculture emissions, 2000 to 2020

Source: Department of the Environment 2015b; Department of the Environment analysis
In 2013–14 and 2014–15, beef and sheep producers reduced livestock numbers in response to ongoing dry conditions. A return to favourable seasonal conditions is now anticipated in late 2015–16. Based on an assumption that seasonal conditions will improve, stronger growth in emissions from grazing beef cattle and sheep are expected post 2015–16, with significant stock rebuilding expected as the carrying capacity of pastures improves.
Emissions from dairy are projected to fall slightly by 2019–20, but are expected to remain relatively unchanged throughout the projection period when compared with historical trends.
Crops contributed 11 per cent or 9 Mt CO2-e of total agriculture emissions in 2014–15 and are projected to increase annually by 1 per cent to 2019–20. Projected increases in global crop production is expected to be greater than projected increases in consumption, and prices are expected to average lower over the period 2014–15 to 2019–20, compared with the five years before. Despite this, Australian crop production is expected to increase steadily over the projections period as a result of growth in world population and incomes.
Emissions from soil treatments, which include fertiliser and urea and liming, are assumed to grow with livestock and crop production. Emissions from soil treatments have been incorporated into the relevant subsectors.
WasteThe waste sector includes emissions from the anaerobic decomposition of organic materials in landfill (solid waste to landfill), decomposition and treatment of wastes in wastewater, anaerobic decomposition of organic materials in composting facilities, and the combustion of waste in controlled incineration facilities.
Waste emissions were 13 Mt CO2-e in 2014–15, a 23 per cent decrease on 1999–2000 levels (Figure 15). Emissions are projected to be 10 Mt CO2-e in 2019–20, a decrease of 25 per cent below 2014–15 levels. These results include abatement from the Emissions Reduction Fund.
Figure 15 Waste emissions, 2000 to 2020

Source: Department of the Environment 2015b; Department of the Environment analysis
The majority of waste emissions come from solid waste to landfill. Historically, landfill waste emissions have declined, in spite of increased waste generation per capita, due to increased recycling and methane capture.
Projected solid waste emissions decline from 2014–15 to 2019–20, due to the commencement of emissions abatement projects which were successful in the Emissions Reduction Fund. Waste generation is expected to grow as a result of population and economic growth but increased recycling rates and methane capture lead to an overall reduction in emissions.
Wastewater emissions are projected to increase gradually throughout the projections, as growth in population and industrial production are expected to outpace increases in abatement from Emissions Reduction Fund projects. Domestic and commercial wastewater emissions are projected to grow in line with projected population growth. Industrial wastewater emissions are projected to grow as a result of projected increases in industrial activity.
Emissions associated with composting and incineration of solid waste are expected to remain low, with combined emissions less than 0.2 Mt CO2-e a year throughout the period 2014–15 to 2019–20.
Land use, land use change and forestryLand use, land use change and forestry emissions are reported for deforestation, afforestation/reforestation, forest management, crop management, grazing land management and revegetation activities. The estimates for emissions and removals in the land use, land use change and forestry sector, where inventory-specific monitoring systems have been put in place, are produced on a calendar year basis.
Annual emissions in the land use, land use change and forestry sector are estimated at 23 Mt CO2-e in 2015, a 64 per cent decrease from 2000 levels (Figure 16). Emissions are projected to be 21 Mt CO2-e in 2020, a decrease of 9 per cent from 2015 levels. These results include abatement from avoided deforestation, and reforestation and afforestation projects under the Emissions Reduction Fund.

Figure 16 Land use, land use change and forestry emissions, 2000 to 2020
Source: Department of the Environment 2015b; Department of the Environment analysis
The national greenhouse gas inventory shows that historically, land use, land use change and forestry emissions have declined substantially, from 64 Mt CO2-e in 1999–2000 to approximately 23 Mt CO2-e in 2015. There are multiple drivers of this trend, including declining rates of land clearing, changes in land management practices (such as introduction of no-till and stubble management), and changes in the forest products industry such as the establishment of new plantations and declining native forest harvesting.
From 2015, projected increases in land clearing (reported under deforestation) and forest harvesting from plantations (afforestation/reforestation and forest management) are offset by low rates of native forest harvesting reported under forest management. Emissions from other activities are steady, as past management changes (e.g. adoption of no-till, stubble retention) have a declining impact on soil carbon stocks reported under cropland management and grazing land management.
Deforestation emissions are projected to increase in the short term, reflecting changes in regulatory arrangements in Queensland which have re-introduced permits for clearing for the purpose of broad scale agriculture, and in response to rising agricultural prices. Deforestation emissions estimates used the FullCAM modelling framework and forecast land clearing rates based on the relationship between land clearing activity and the farmers’ terms of trade described in the Department of the Environment’s National Inventory Report 2013 (Department of the Environment 2015c).
Emissions from forest management and afforestation/reforestation activities reflect the trends in harvesting activity in the Australian forest products industry, including native forest harvesting and industrial plantations. Trends in log supply and harvesting from these sectors are connected and subject to long-term trends of substitution, primarily the shifting supply from native forest harvesting toward increased supply from plantations. For the 2015–16 emissions projections, log harvest forecasts were adopted from the ‘business as usual’ scenario published in the Outlook Scenarios for Australia’s Forestry Sector: Key Drivers and Opportunities (ABARES 2015a). ABARES forecasts an increase in total harvest volumes to 2020, with the increases predominantly from short-rotation hardwood plantations. Softwood plantation harvest volumes are also forecast to increase, while native forest harvest volumes are predicted to be stable or declining. The projections utilised the FullCAM modelling framework to estimate emissions, in conjunction with the harvested wood products model as described in the National Inventory Report 2013 (Department of the Environment 2015c).
20

Appendix A—Methodology and key assumptionsOutline of methodologyThese projections are prepared at the sectoral level consistent with international guidelines adopted by the United Nations Framework Convention on Climate Change for using Kyoto Protocol classifications. This includes projecting Australia’s emissions for the Kyoto Protocol greenhouse gases, expressed in terms of CO2-e using the 100-year global warming potentials contained in the Intergovernmental Panel on Climate Change’s Fourth Assessment Report (IPCC 2007).
Emissions projections indicate what future emissions could be if the assumptions that underpin the projections continue to occur. Projections are not forecasts or predictions about what will happen. In contrast, an emissions forecast speculates on expectations or predictions of what will happen in the future and thus what future emissions will be. In a forecast, the assumptions represent expectations of actual future events or changes.
The projections present a single baseline scenario that is developed on the basis of current policies and measures. This includes a Large-scale Renewable Energy Target of 33,000 GWh by 2019–20 and abatement from the Emissions Reduction Fund. The projections use a combination of top-down and bottom-up modelling prepared by the Department’s analysts and external consultants.
The preparation of the projections is based on macroeconomic assumptions of gross domestic product, exchange rates, labour costs and population growth, consistent with the Government’s 2015–16 Budget. The projections are also informed by a number of publications and data from government agencies and other bodies including the Department of Industry, Innovation and Science, the Australian Bureau of Agricultural and Resource Economics and Sciences and the Bureau of Infrastructure, Transport and Regional Economics.
Key assumptions specific to each sector are outlined below.
ElectricityThe interim electricity generation emissions projections are an update of the previous electricity emissions projections. They have been prepared based on research and modelling commissioned by the Department and undertaken by Jacobs Australia (2015). Abatement from the Emissions Reduction Fund has been adjusted separately.
Electricity demand is projected for each of the major electricity grids and large off-grid users. Electricity emissions are then calculated by taking into account a number additional factors including production of each power station, generation mix, technology costs, resource costs and assumptions of embedded (solar PV) generation. This is considered alongside existing Commonwealth and state and territory energy policies and programs.
The Department has used data from the Australian Energy Market Operator (AEMO 2015) and the Independent Market Operator (IMO 2015) to determine electricity demand forecasts for the National Electricity Market and the Wholesale Electricity Market to inform the electricity projections. Department analysis of National Greenhouse and Energy Reporting (NGER) data and data from the former Bureau of Resources and Energy Economics (BREE 2013) is used to calculate demand in the remaining regions of the North West Interconnected System (NWIS), the Darwin Katherine Interconnected System (DKIS), the Mt Isa system and off-grid demand.
Direct combustion
21

The interim direct combustion projection updates the 2014–15 projection. Emissions were projected by economic sector and fuel type using Commonwealth or third party activity information including NGER data, Office of the Chief Economist (2015) commodity forecasts, IBISWorld (2015) industry reports, Wood Mackenzie’s (2015) LNG Tool and AME Group’s (2015) coal industry analysis. These data were supplemented by a consultancy report by Core Energy Group (2014) to model residential and commercial gas activity levels and to provide advice on potential fuel switching in the industrial sector over the projections period.
For the interim projection, historical emissions intensity trends were analysed for the mining and manufacturing subsectors. Where a strong relationship was found, a formula was applied to project the emissions intensity trend into the future. Where there was no trend, a fixed emissions intensity was used over the projection based on 2014–15 levels.
Historically, the majority of growth in direct combustion emissions has been driven by mining emissions. High coal and iron ore prices around 2009–10 lifted exploration investment in Australia, which has resulted in substantially higher output. Emissions from the energy subsector have fluctuated around 15 Mt CO2-e from 1999–2000 to 2014–15. Emissions growth from the production of natural gas has outpaced the decline in refinery emissions. Recent closures of Australian petroleum refineries (including conversion to import terminals) have contributed to a decline in energy emissions from 2009–10 to 2014–15. Emissions from the manufacture of solid fuels rose from 1999–2000 to 2009–10 and have declined below 1999–2000 levels due to coke production closures in the Illawarra.
TransportThe interim transport projections update the results prepared by the Commonwealth Scientific and Industrial Research Organisation’s (CSIRO) Transport Greenhouse Gas Emissions Projections 2014 to 2050 (Graham and Reedman 2014, 2015). These results have been updated by taking account of short term activity forecasts provided by Pekol Traffic and Transport for the Australian Transport Facts 2015 (CTEE 2015). The results incorporate historical emissions data from the national greenhouse gas inventory from 1989–90 to 2014–15.
Transport projections developed by CSIRO uses the Energy Sector Model which determines the least cost fuel and vehicle mix to meet given transport activity levels. The projections take into account current policies and measures that apply to transport.
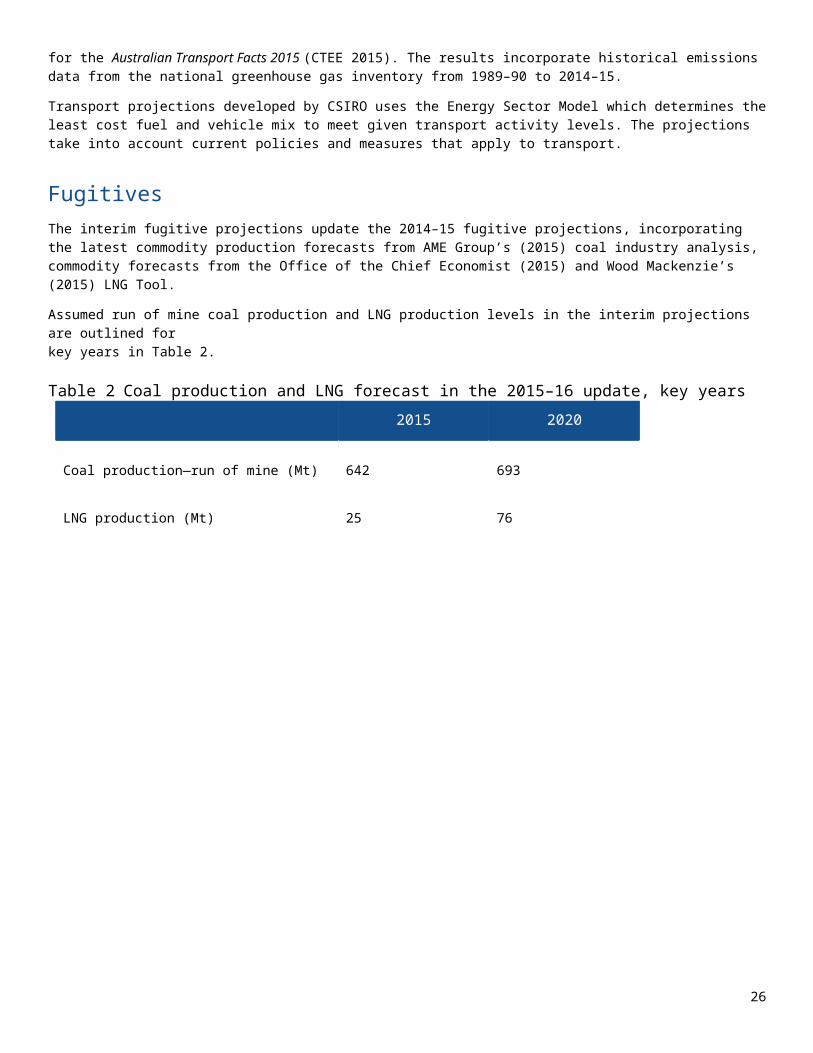
FugitivesThe interim fugitive projections update the 2014–15 fugitive projections, incorporating the latest commodity production forecasts from AME Group’s (2015) coal industry analysis, commodity forecasts from the Office of the Chief Economist (2015) and Wood Mackenzie’s (2015) LNG Tool.
Assumed run of mine coal production and LNG production levels in the interim projections are outlined for key years in Table 2.
Table 2 Coal production and LNG forecast in the 2015–16 update, key years
2015 2020
Coal production—run of mine (Mt) 642 693
LNG production (Mt) 25 76
22

Industrial processes and product use Commodity assumption estimates were based on a range of sources, mainly the Office of the Chief Economist (2015), IBISWorld (2015) reports, AME Group’s (2015) coal industry analysis and Wood Mackenzie’s (2015) LNG Tool. These sources were cross checked against company statements about the timing and scale of new project commencements and facility closures.
The interim industrial processes and product use projections are produced from industry level modelling of emissions growth in the activities that make up the sector. These projections do not incorporate any phase-down proposal of HFCs, as currently being negotiated under the Montreal Protocol on Substances that Deplete the Ozone Layer.
New facilities and facility closures that are explicitly included in the industrial processes and product use sector are outlined in Tables 3 and 4.
Table 3 New facilities and expansions assumed to commence in the 2015–16 update
Company and location Facility type
Simcoa, Kemerton Silicon
Orica, Burrup Peninsula Nitric acid
Cockburn Cement, Munster Lime
Table 4 Facilities assumed to close in the 2015–16 update
Company and location Facility type
Adelaide Brighton, Munster Clinker
Boral, Maldon Clinker
Glencore, Townsville Copper
AgricultureThe interim agriculture projections have been updated based on the Australian Bureau of Agricultural and Resource Economics and Sciences (ABARES 2015b,c) productivity forecasts to 2019–20. Emissions are calculated as the product of agricultural activity and the relevant emissions factor, and converted to carbon dioxide equivalent. Emissions factors are assumed to be constant over the projections period.
Restocking beef cattle
Livestock production, particularly beef and lamb, is a key driver of emissions from agriculture. Projected beef
23

cattle numbers from 2015–16 to 2018–19 are presented in Table 5.
24

Table 5 Beef cattle restocking rates
2015–16 Projections 2015–16 2016–17 2017–18 2018–19
Beef cattle (head) 23,662,000 25,157,215 25,594,704 25,897,663
Savanna burning
Over the period 2014–15 to 2019–20, emissions from savanna burning are assumed to be the average of emissions from savanna burning over the period 2003–04 to 2013–14 less abatement from the Emissions Reduction Fund. This assumption follows from the expectation of no change from historical seasonal conditions.
WasteThe interim waste projections are an update of the previous waste projections based on research by Hyder Consulting (Hyder 2014). New forecasts for the 2015–16 projections of population growth and industry output have been incorporated by the Department of the Environment. These results incorporate historical emissions data from the national greenhouse gas inventory to 2014–15.
Population growth
Population growth is a key driver of emissions from waste. The projections use population forecasts that are consistent with the Australian Government’s 2015–16 Budget (Australian Government 2015), and population forecasts consistent with Australian Bureau of Statistics modelling thereafter (ABS 2013).
Per person waste generation
Over the period 2014–15 to 2019–20, per person waste generation is assumed to grow at 1.7 per cent a year; the rate of increase observed between 2007–08 and 2010–11.
Waste diversion
The municipal solid waste diversion estimates for 2012–13 can be found in the National Inventory Report 2013 (Department of the Environment 2015c).This includes the stated targets for each state and territory, the assumed waste diversion rates, and the year they will occur. Waste diversion rates are assumed to increase slowly after the target year. Further detail on diversion rates for construction and demolition waste, and commercial and industrial waste can be found in Hyder Consulting’s report Waste sectoral modelling and analysis (Hyder 2014).
Land use, land use change and forestryThe projections for forest management and afforestation/reforestation have been updated since the 2014–15 projections. Trends in harvesting activity in the Australian forest products industry, including native forest harvesting and industrial plantations are key drivers of emissions from forest management and afforestation/reforestation activities. Projections for deforestation have been adjusted for a short-term increase in land clearing Queensland.
Projections for the remaining Kyoto Protocol activities have not been updated and the 2014–15 Projections results were
25
adopted with corrections based on the published National Inventory Report 2013 (Department of the Environment 2015c).
Appendix B—Change from previous projectionsThis section outlines sector specific changes in the emissions outlook when compared to the 2014–15 projections. A major change is that for the first time the results include abatement from the Emissions Reduction Fund of 92 Mt CO2-e. This has not been separately identified in the sectors below.
ElectricityEmissions from electricity are projected to be 14 Mt CO2-e lower in 2019–20. This is due to a combination of the following: the 2014–15 electricity emissions projections were modelled based on a 27,000 GWh (‘real 20’) Large-scale
Renewable Energy Target, while these projections are modelled on the legislated 33,000 GWh Large-scale Renewable Energy Target;
the interim projections take into account the closures of power stations announced since the release of the previous projections; and
expectations around the mix of coal generation and gas generation after 30 June 2014 have been revised to be more in line with recent activity in the National Electricity Market.
Direct combustionEmissions from direct combustion are projected to be 3 Mt CO2-e lower in 2019–20. This is due to a combination of factors: LNG production is forecast to be lower than last year due to low gas prices leading operators to produce at less than
full capacity in the short-term; coal mining growth is forecast to be lower than last year due to falling prices and lower demand; and the manufacture of solid fuels is expected to be lower due to changes in the expectations of Australian brown coal
briquette manufacturing (Energy Brix closure) and an improved modelling relationship between coking coal production and the forecast of Australian iron and steel production.
TransportTransport emissions are projected to be 2 Mt CO2-e lower in 2019–20. This is due to: a lower inventory starting point that sees a reduction in trucks and buses, light commercial vehicles, aviation, rail and
marine emissions; and relatively low crude oil prices that have contributed to the increases in projected private passenger vehicle emissions,
including less incentive to develop additional low emissions fuels, reduced competitiveness of more efficient vehicle types and increased transport activity.
Fugitives
Coal
Fugitive emissions from coal are projected to be around 9 Mt CO2-e lower in 2019–20. Australian coal production, although expected to grow strongly, is projected to be lower than in the 2014–15 projections. This is due to:
26

world coal supply growing faster than import demand, and coal prices falling as a result; and a number of high cost producers having ceased production.
Natural gas and oil fugitives
Fugitive emissions from natural gas and oil are projected to be less than 1 Mt CO2-e higher in 2019–20. These results are due to: lower projected LNG volumes due to current low spot prices; and an increase in expectations of gas demand for electricity generation.
Industrial processes and product use Industrial processes and product use emissions in 2019–20 are projected to be 2 Mt CO2-e lower. This is due to: lower 2014–15 national greenhouse gas inventory emissions for product uses as substitutes for ozone depleting
substances; and lower projected production for iron and steel and aluminium.
AgricultureProjected agriculture emissions in 2019–20 are 6 Mt CO2-e lower. This is due to: increased sheep and beef cattle turn-off 3 and low calving rates due to less favourable seasonal conditions; and increased beef cattle turn-off due to record high export prices.
Waste Projected waste emissions in 2019–20 are 5 Mt CO2-e lower. This is due to: lower 2014–15 national greenhouse gas inventory emissions than was projected in the 2014–15 projections, as a
result of greater methane capture than previously modelled.
Land use, land use change and forestryEmissions from land use, land use change and forestry are 23 Mt CO2-e lower in 2019–20. This is due to: lower forecast rates of harvesting from both native forests and plantation.
3 The quantity of livestock distributed to market.
27

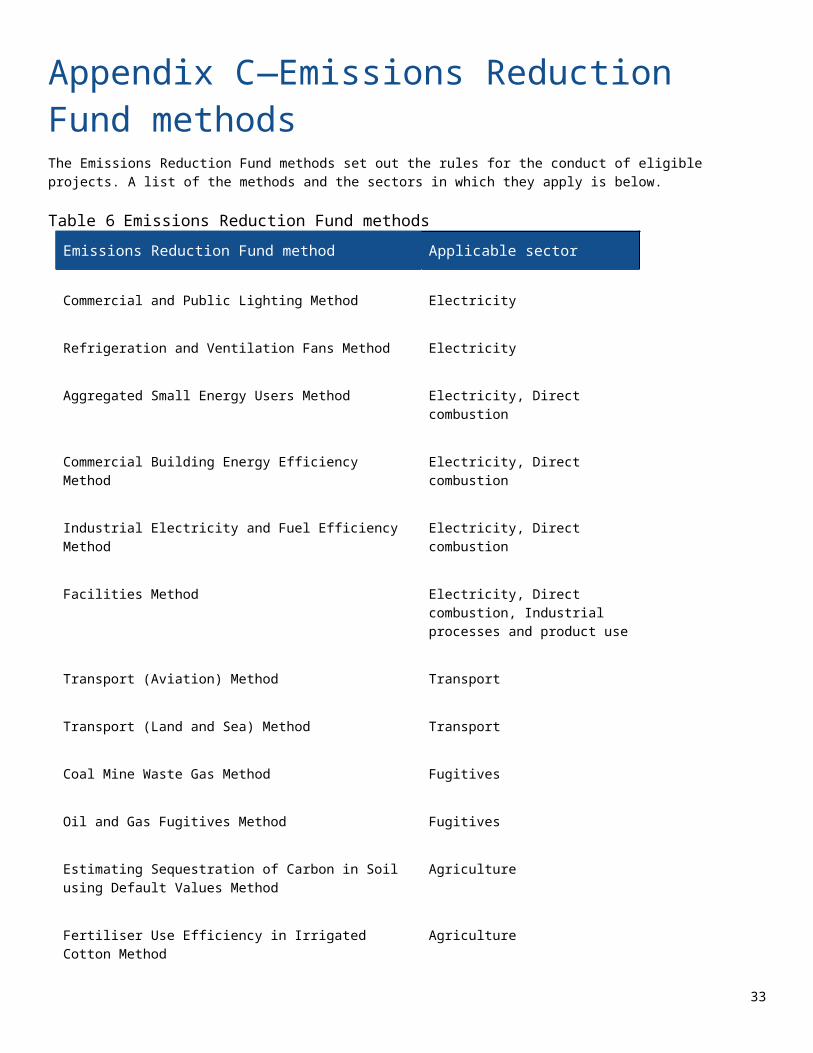
Appendix C—Emissions Reduction Fund methodsThe Emissions Reduction Fund methods set out the rules for the conduct of eligible projects. A list of the methods and the sectors in which they apply is below.
Table 6 Emissions Reduction Fund methods
Emissions Reduction Fund method Applicable sector
Commercial and Public Lighting Method Electricity
Refrigeration and Ventilation Fans Method Electricity
Aggregated Small Energy Users Method Electricity, Direct combustion
Commercial Building Energy Efficiency Method Electricity, Direct combustion
Industrial Electricity and Fuel Efficiency Method Electricity, Direct combustion
Facilities Method Electricity, Direct combustion, Industrial processes and product use
Transport (Aviation) Method Transport
Transport (Land and Sea) Method Transport
Coal Mine Waste Gas Method Fugitives
Oil and Gas Fugitives Method Fugitives
Estimating Sequestration of Carbon in Soil using Default Values Method
Agriculture
Fertiliser Use Efficiency in Irrigated Cotton Method Agriculture
Beef Cattle Herd Management Method Agriculture
Destruction of Methane from Piggeries Using Agriculture
28

Emissions Reduction Fund method Applicable sector
Bioengineered Biodigesters Method
Destruction of Methane Generated From Dairy Manure in Covered Anaerobic Ponds Method
Agriculture
Destruction of Methane Generated from Manure in Piggeries Method (1.1)
Agriculture
Reducing Greenhouse Gas Emissions in Beef Cattle Through Feeding Nitrate Containing Supplements Method
Agriculture
Reducing Greenhouse Gas Emissions in Milking Cows Through Feeding Dietary Additives Method
Agriculture
Sequestering Carbon in Soils in Grazing Systems Method Agriculture
Alternative Waste Treatment (AWT) Method Waste
Landfill Gas Method Waste
Wastewater Treatment Method Waste
Reforestation and Afforestation Method (2.0) Land use, land use change and forestry
Designated Verified Carbon Standards Projects Method Land use, land use change and forestry
Emissions Abatement Through Savanna Fire Management Method
Land use, land use change and forestry
Avoided Deforestation Method Land use, land use change and forestry
Avoided Clearing of Native Regrowth Method Land use, land use change and forestry
Human-induced Regeneration of a Permanent Even-aged Native Forest Method (1.1)
Land use, land use change and forestry
29

Emissions Reduction Fund method Applicable sector
Measurement-based Method for New Farm Forestry Plantations
Land use, land use change and forestry
Native Forest from Managed Regrowth Method Land use, land use change and forestry
Reforestation by Environmental or Mallee Plantings—FullCAM Method
Land use, land use change and forestry
30

Appendix D—References ABARES 2015a, Outlook scenarios for Australia’s forest sector: key drivers and opportunities, Australian Bureau of Agricultural and Resource Economics and Sciences, Canberra, ACT.
ABARES 2015b, Agricultural commodities: March quarter 2015, Australia Bureau of Agricultural and Resource Economics and Sciences, Canberra, ACT.
ABARES 2015c, Agricultural commodities: September quarter 2015, Australian Bureau of Agricultural and Resource Economics and Sciences, Canberra, ACT.
ABS 2013, Population Projections [Series B], Australia, 2012 (base) to 2101 (cat. no. 3222.0), Australian Bureau of Statistics, Canberra, ACT.
AEMO 2015, 2015 National Electricity Forecasting Report, available at http://www.aemo.com.au/Electricity/Planning/Forecasting/National-Electricity-Forecasting-Report
AME Group 2015, AME Direct, Hong Kong.
Australian Government 2015, Budget 2015–16, Australian Government, Canberra, ACT.
Bureau of Resources and Energy Economics (BREE) 2013, Beyond the NEM and the SWIS 2011–12 regional and remote electricity in Australia, available at http://www.bree.gov.au/publications/beyond-nem-and-swis-2011–12-regional-and-remote-electricity-australia
Core Energy Group 2014, Guidance on Fuel Switching, Report to the Department of the Environment, June 2014.
CTEE 2015, Australian Transport Facts 2015, Centre for Transport, Energy and Environment, Pekol Traffic and Transport, Brisbane, Australia.
Department of the Environment 2015a, Australia’s emissions projections 2014–15, Commonwealth of Australia (Department of the Environment), Canberra, ACT.
Department of the Environment 2015b, Australian National Greenhouse Accounts: Quarterly Update of Australia’s National Greenhouse Gas Inventory June Quarter 2015, Commonwealth of Australia (Department of the Environment), Canberra, ACT.
Department of the Environment 2015c, Australian National Greenhouse Accounts: National Inventory Report 2013, Commonwealth of Australia (Department of the Environment), Canberra, ACT.
Graham, P.W. and Reedman, L. J. 2014, Transport Sector Greenhouse Gas Emissions Projections 2014–2050, Report no. EP148256, Commonwealth Scientific and Industrial Research Organisation, Australia.
Graham, P.W. and Reedman, L. J. 2015, Transport Sector Greenhouse Gas Emissions Projections 2014–2050: Supplementary results for revised oil prices, Commonwealth Scientific and Industrial Research Organisation, Australia.
Hyder Consulting 2014, Waste Sector Modelling and Analysis, Hyder Consulting, North Sydney, NSW.
IBISWorld 2015, Australian Industry Reports, Melbourne, Vic.
International Energy Agency 2015, World Energy Outlook 2015, Paris, France.
IMO 2015, 2014 Electricity statement of opportunities, available at http://www.imowa.com.au/home/electricity/electricity-statement-of-opportunities
31

IPCC 2007, Fourth Assessment Report: Working Group 1 Report: The Physical Science Basis, Cambridge University Press, Cambridge.
Jacobs Australia 2015, Australia’s emissions projections: electricity market emissions projections to 2034–35, Jacobs Australia, Melbourne, Victoria.
Office of the Chief Economist 2015, Resources and Energy Quarterly September Quarter 2015, Department of Industry, Innovation and Science, Canberra, ACT.
Wood Mackenzie 2015, LNG Tool, Edinburgh, UK.
32
environment.gov.au
CC119.1115
33