trade compatibility between india and asean countries · pdf filetrade compatibility between...
TRANSCRIPT

MPRAMunich Personal RePEc Archive
Trade Compatibility Between India AndAsean Countries
B.P. Sarath Chandran
VVM’s Shree Damodar College of Commerce and Economics, Goa
7. December 2010
Online at http://mpra.ub.uni-muenchen.de/33138/MPRA Paper No. 33138, posted 2. September 2011 16:41 UTC
1
TRADE COMPATIBILITY BETWEEN INDIA AND ASEAN COUNTRIES
B.P. Sarath Chandran
Assistant Professor of Economics,
VVM’s Shree Damodar College of Commerce & Economics, Goa
Phone - 0832-2742914
Mobile - 09423445350

2
TRADE COMPATIBILITY BETWEEN INDIA AND ASEAN COUNTRIES
B.P. Sarath Chandran
1. Introduction
As the regionalization efforts of international trade gets widened primarily due to limited
progress at the multilateral trade negotiations, India is making serious regional
engagements to consolidate its trade positions. After initiating bilateral trade agreements
with Sri Lanka, Singapore, Thailand and South Korea, for the first time it signed a RTA
with a regional block, ASEAN on 13th
August 2009. India ASEAN Free Trade
Agreement (IAFTA) generated intense discussion on the economic impact on India‟s
trade in goods particularly on certain agricultural sectors where the livelihood of large
number of people were depended upon. For any Regional Trade Agreement (RTA) to be
successful, it is imperative on partner countries to have complementary trade structure to
be exploited for mutual benefit. Countries which got complementary trade structure are
likely to trade more where as economies with similar trade structure often struggle to
improve trade share unless there is substantial intra industry trade. RCA indices, despite
their limitations, provide a useful guide to underlying comparative advantage and offer a
further insight into the competitiveness of participating countries and hence reveal the
possibility of increased trade cooperation between them. In this context the paper tried to
identify complementary and competing sectors of trade between India and ASEAN
countries to consolidate their strengths and to overcome the pitfalls. The synergies
between India and ASEAN need to be identified for further cementing the economic
cooperation and deepening the relationship.
2. Emergence of Regional Trade Agreements (RTAs)
Proliferation of large number of RTAs is the single most important development that had
taken place in the international trading system in the post WTO period. Regionalism as an
alternative to multilateralism emerged mainly from the failure of the world trading system
to provide a quick and acceptable solution to the problems it encountered during its
existence. Multilateral trade negotiations are protracted and delayed as it encompasses
large number of countries with diverse economic, political and social background leading
to higher transaction costs and lost economic opportunity. While „regionalism versus
multilateralism‟ debate continues, large number of countries pursue the more confident
path of bilateral and regional agreements to consolidate the gains from international trade
and improve their strengths at the multilateral trade negotiations. Regionalism makes
countries to gang up under fiercely competing trade blocks such as EU, NAFTA,
Mercosur and ASEAN plus to benefit from discriminatory trade liberalization and to get
short term market access.
Asia is fast becoming the centre of gravity for the world economy with China, India and
resurgent East Asia propelling the engine of growth and producing goods and services for
world consumption. ASEAN is the vibrant regional grouping in Asia and envisioning
itself to become an Asian Economic Community (AEC). ASEAN for long followed
export oriented growth strategy simultaneously pursuing twin objectives of deepening
regional integration efforts and carrying out multilateral trade liberalization with rest of
the world. Realising the importance of the Asian region for sustaining high trade growth,
India initiated the „Look East‟ policy in the early nineties. The sustained interest and
focused attention for the region resulted in the India-ASEAN Free Trade Agreement.
3
3. Theoretical Developments and Empirical Studies
Theoretical studies on regionalism focused two important issues namely how formation
of Regional Trading Blocks impact the welfare of the members and world at large and
secondly whether regionalism help or hinder the process of multilateral trade
liberalization. In his seminal work on Customs Union (CU), Viner (1950) used two
concepts namely „trade creation‟ and „trade diversion‟ to explain the economic outcome
of the regional integration and demonstrated that „trade diversion‟ is harmful to world
trade. Subsequently Meade (1955), Lipsy (1960) Ohyama (1972), Kemp and Wan (1976)
and Vanek (1965) made substantial improvements in the theory of regional integration.
Baldwin (1993; 1995) developed Domino theory of Regionalism and along with
Juggernaut theory tried to answer the question of why countries prefer regional
integration than multilateral liberalization. The political economy dimension of regional
trade agreements were subjected to number of empirical studies by Levy (1997) Krishna
(1998) Bird and Rajan (2002) Albertin (2008) etc.
The creation of Regional Trade Agreement per say may not give the desired results and
the success of it depends on numerous other factors. Some of the factors which got
profound influence on trade are the complementarities in trading Nations, level of initial
protection, domestic trade liberalization measures, size of the economy and rule of origin.
The risk of trade diversion is lower if the PTA being formed is between countries that are
already major trading partners, indicating that trade flows are consistent with least-cost
sourcing. Moreover, the greater complementarity in import demands between PTA
members, the greater the potential gains from a PTA. Trade creation is more likely to
dominate trade diversion if there is greater difference between unit production costs
within the PTA and the smaller the difference in costs between the PTA and the rest of
the world. The higher the initial level of protection, the greater the benefits, if the
members reduce the protection after joining in a PTA. Inclusion of a highly protected
sectors in to trade agreements bring substantial gains for the members. It is also quite
clear that trade diversion will be minimal for a PTA whose external trade barriers are
lower compared to high tariff protected economies.
The classical trade theories are based on the principle of Comparative Advantage (CA)
which derives from differences in pre trade prices across countries, underlined by supply
and demand factors. However measuring Comparative Advantage and testing Hecksher
Ohlin theory have some difficulties since relative prices under autarchy is not observable.
Empirical studies on Comparative Advantage lack reliable and internationally comparable
data on many important variables such as exchange rates, purchasing power, valuation of
local land, labor and capital, government policy, history and other likely sources of CA
resulting difficulty in its quantification. In order to overcome this problem, Balassa
(1965) introduced the concept of “Revealed Comparative Advantage” (RCA) as a way to
approximate CA in autarky and suggested that Comparative Advantage is „revealed‟ by
observed trade pattern. According to Balassa, "the concept of RCA pertains to the relative
trade performances of individual countries in particular commodities. On the assumption
that the commodity pattern of trade reflects inter-country differences in relative costs as
well as in non-price factors, this is assumed to reveal the comparative advantage of
trading countries” (Balassa, 1977). Balassa Index tries to identify whether a country has a
revealed comparative advantage rather than to determine the underlying sources of
Comparative Advantage. The advantage of using the comparative advantage index is that
it considers the intrinsic advantage of a particular export commodity and is consistent
with changes in an economy‟s relative factor endowment and productivity. The index of
4
revealed comparative advantage (RCAij) is simple to interpret, it takes a value greater
than one if a country is having revealed comparative advantage in that product.
There have been many studies that used revealed comparative advantage index developed
by Balassa (1965). Chow (1990) and Leu (1998) assessed the shift in comparative
advantage of Japan and the Asian NICs (Newly Industrialized Countries). Lim (1997), in
his study based on the RCA index showed North Korea‟s comparative advantage had
moved up from Ricardo goods to Heckscher Ohlin (HO) goods, it would be difficult for
the country to move into the terrain of Product Cycle (PC) goods. Vollrath (1991) made
improvement in Balassa index and offered three alternative ways of measurement of a
country‟s RCA namely the relative trade advantage (RTA), the logarithm of the relative
export advantage (ln RXA), and the revealed competitiveness (RC). Ferto and Hubbard
(2002) used these modifications of the RCA index in the context of agricultural trade
between Hungary and EU. Other important studies based on RCA approach include Yeats
(1997), Richardson and Zhang (1999), Yue (2001), Bender and Li (2002), Weiss (2004),
Lall and Albaladejo (2003) and Lall and Weiss (2004).
Widgren (2005) in his study examined the basis RCA for a sample of Asian, American
and European countries between 1996 and 2002 and said factor content of comparative
advantage had some similarity in the Asian countries. Batra and Khan (2005) constructed
RCA index for India and China at the 2 and 6-digit level of HS classification and
compared India‟s comparative advantage with that of China. Burange and Chaddha
(2008) in their study evaluated India‟s RCA in exports and imports in different type of
goods suggested that India enjoyed comparative advantage in the exports of Ricardo and
Heckscher Ohlin (HO) goods while Product Cycle (PC) goods did not show any
improvement in terms of RCA.
There are number of studies that looked in to the performance and prospects of India -
ASEAN trade particularly in the context of India‟s „Look East Policy‟. Kumar (2002)
suggested India and East Asian countries need to deepen their ongoing cooperation
further and create an Asian Community which could emerge as the third pole of the world
economy after NAFTA and the EU. Rajen (2003) outlined India‟s manufactured exports
as a whole have stagnated when benchmarked against East Asia and India has largely
been left out of the production-sharing process. Asher and Sen (2005) argued that India‟s
unilateral liberalization policies and its Look East Policy have resulted in greater
integration with the rest of Asia than is commonly realized or acknowledged. Karmakar
(2005) studied the India – ASEAN cooperation in services and suggested that at least in
the medium term, there is a lot to be gained from a bilateral engagement between India
and the Members of ASEAN in services. Okamoto (2005) felt promotion of economic
cooperation between ASEAN and India may make sense in the long run, but its
immediate impact on both sides seems to be limited due to little intra-industry trade. The
review of literature showed that there are not many studies that looked in to the trade
complementarity between India and ASEAN at the disaggregated level to identify the
trade potential particularly in the context of the India – ASEAN FTA.
4. India ASEAN Trade - Broad Trends
India‟s trade with ASEAN remained moderate compared with its potential. The total trade
which was 2.9 billion in 1993 rose to 37.23 billion in 2007. This was achieved mainly by
the concerted efforts and renewed focus given by the Indian Government to the East
Asian region. In the year 2007, ASEAN‟s export to India was 24.83 billion and Import

5
was 12.39 billion US Dollars. ASEAN enjoys favourable trade account with India and
had a trade surplus of 12.44 billion in the year 2007.
ASEAN India trade was growing steadily in the nineties except during East Asian crisis
period and entered in to double digit growth trajectory in recent years. For the year 2007,
export grown at 31.23 percent while import witnessed a growth of 26.81 percent. For the
2003-08 period, ASEAN exports to India grew at an average annual rate of 28.90 percent
while imports for the same period grew at 33.68 percent. ASEAN-6 account bulk of
India‟s trade with ASEAN countries.
The major export commodities of ASEAN to India are HS-27(Mineral fuels, min oils &
products of distillation; bitium substances; mineral wax), HS-84(Nuclear reactors, boilers,
machinery & mechanical appliances/parts) and HS-85(Electrical machinery, equipments
& parts; sound equipment, television equipments). The top 10 export commodities
account 80 percent of the ASEAN export in 2007. The major import categories of
ASEAN from India are HS-71(Natural or cultured pearls; precious/semi precious
stone/metal; imitation jewelry; coin), HS-27(Mineral fuels, mineral oils & product of
distillation; bitum substances; min wax), HS-29(Organic chemicals) and HS-72(Iron and
Steel). The top ten import item account 73.5 percent of the ASEAN import in 2007.
5. Methodology
The study used Trade Intensity Index (TII) and Revealed Comparative Advantage (RCA)
Index to see trade complementarity and Similarity between India and ASEAN countries.
The trade intensity index (TII) is used to determine whether the value of trade between
two countries is greater or smaller than would be expected on the basis of their
importance in world trade. It is defined as the share of one country‟s exports going to a
partner divided by the share of world exports going to the partner. It is calculated as,
𝑇𝑖𝑗 =(𝑥𝑖𝑗 𝑋𝑖𝑡 )
(𝑥𝑤𝑗 𝑋𝑤𝑡 )
Where xij and xwj are the values of country i‟s exports and of world exports to country j
and where Xit and Xwt are country i‟s total exports and total world exports respectively.
An index of more (less) than one indicates a bilateral trade flow that is larger (smaller)
than expected, given the partner country‟s importance in world trade.
Trade Intensity Index is further divided in to Export Intensity Index (EII) and Import
Intensity Index (III) for looking the pattern of exports and Imports. Following Kojima
(1964) and Drysdale (1969), the index of trade intensity is restated as follows,
𝐸𝐼𝐼 𝑏𝑒𝑡𝑤𝑒𝑒𝑛 𝐼𝑛𝑑𝑖𝑎 𝑎𝑛𝑑 𝐴𝑆𝐸𝐴𝑁 = 𝑿𝑰𝑨 𝑿𝑰
𝑴𝑨 ( 𝑴𝑾−𝑴𝑰)
XIA = India‟s Export to ASEAN; XI= India‟s total Export; MA= Total Import of ASEAN;
Mw= Total World imports MI = Total Imports of India
𝐼𝐼𝐼 𝑏𝑒𝑡𝑤𝑒𝑒𝑛 𝐼𝑛𝑑𝑖𝑎 𝑎𝑛𝑑 𝐴𝑆𝐸𝐴𝑁 = 𝑴𝑰𝑨 𝑴𝑰
𝑿𝑨 (𝑿𝑾−𝑿𝑰)

6
M IA = Import of India from ASEAN; MI = Total Import of India; XA = Total Export of
ASEAN; XW = Total World Export; XI = Total Export of India
Trade Intensity Index is calculated for India and ASEAN countries for the period 1990 to
2007 taking data from Direction of Trade Statistics (DOTS), IMF and accessed through
World Integrated Trade Solutions (WITS). Both Export Intensity Index and Import
Intensity Index are calculated for India and ASEAN taking partners‟ position in world
trade. An index value of one indicates bilateral trade is following the pattern of rest of the
world and the value above one shows there is trade intensity between partners.
Revealed Comparative Advantage Index shows how competitive is a product in
countries‟ export compared to the products share in world trade. A product with high
RCA is competitive and can be exported to countries with low RCA. Measures of
revealed comparative advantage (RCA) have been used to help assess a country‟s export
potential. The RCA indicates whether a country is in the process of extending the
products in which it has a trade potential, as opposed to situations in which the number of
products that can be competitively exported is static. It can also provide useful
information about potential trade prospects with new partners. Countries with similar
RCA profiles are unlikely to have high bilateral trade intensities unless intra industry
trade is involved. RCA measures, if estimated at high levels of product disaggregation,
can focus attention on other nontraditional products that might be successfully exported.
The RCA index of country „i‟ for product „j‟ is often measured by the product‟s share in
the country‟s exports in relation to its share in world trade:
𝑅𝐶𝐴𝑖𝑗 =(𝑥𝑖𝑗 𝑋𝑖𝑡 )
(𝑥𝑤𝑗 𝑋𝑤𝑡 )
Where xij and xwj are the values of country i‟s exports of product j and world exports of
product j and where Xit and Xwt refer to the country‟s total exports and world total
exports. A value of less than unity implies that the country has a revealed comparative
disadvantage in the product. Similarly, if the index exceeds unity, the country is said to
have a revealed comparative advantage in the product.
Revealed Comparative Advantage (RCA) for ASEAN countries is calculated at three
levels namely Commodity Groups, HS-2 and HS-4 and compared them against India‟s
RCA to see trade complementarity between these trading partners. At the aggregate level,
RCA is calculated for eight ASEAN countries across 16 major commodity groups for 17
years to identify specific advantage in trade. The commodities for which RCA are
calculated include Agricultural Products, Food, Fuels and Mining, Fuels, Manufactures,
Iron and Steel, Machinery and Transport Equipment, Office and Telecom equipments,
EDP and OE, IC and EC, Pharmaceuticals, Chemicals, Automotive, Textiles and
Clothing. Data for calculating RCA are collected from IMF, WTO and ASEAN Statistical
Yearbook.
In order to get Revealed Comparative Advantage (RCA)at the disaggregate level, RCA
index at HS-2 digit level of classification are calculated for India and ASEAN countries
for the period 2003 to 2006. RCA for four years are calculated for India and combined
ASEAN countries (Cambodia, Malaysia, Philippines, Singapore and Thailand) and a
mean RCA is arrived at for comparison. Export-Import data for India and ASEAN
Countries at HS-2 level classification are extracted from DOTS of WITS (World
7
Integrated Trade Solutions). The absolute difference in RCA between India and ASEAN
is calculated to understand the extent of complementarity in commodities. This is
supplemented with trade performance under HS-4 digits classification to know finer
specialization of products by India and ASEAN countries.
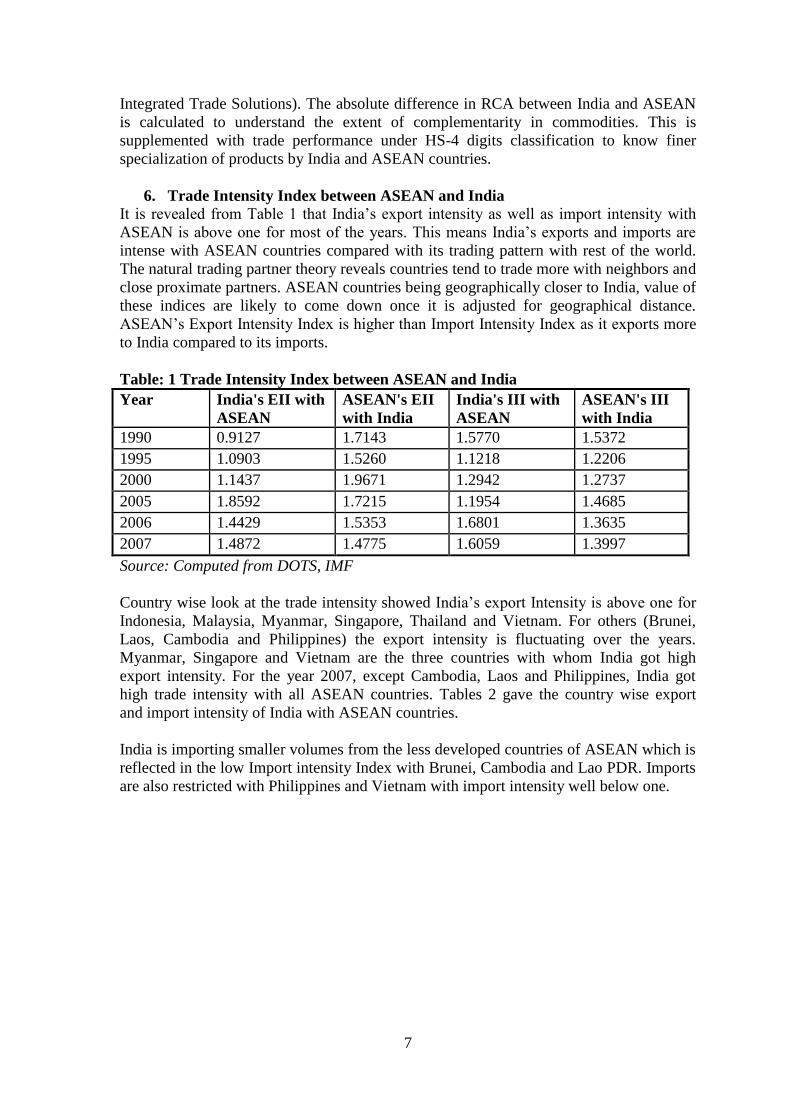
6. Trade Intensity Index between ASEAN and India
It is revealed from Table 1 that India‟s export intensity as well as import intensity with
ASEAN is above one for most of the years. This means India‟s exports and imports are
intense with ASEAN countries compared with its trading pattern with rest of the world.
The natural trading partner theory reveals countries tend to trade more with neighbors and
close proximate partners. ASEAN countries being geographically closer to India, value of
these indices are likely to come down once it is adjusted for geographical distance.
ASEAN‟s Export Intensity Index is higher than Import Intensity Index as it exports more
to India compared to its imports.
Table: 1 Trade Intensity Index between ASEAN and India
Year India's EII with
ASEAN
ASEAN's EII
with India
India's III with
ASEAN
ASEAN's III
with India
1990 0.9127 1.7143 1.5770 1.5372
1995 1.0903 1.5260 1.1218 1.2206
2000 1.1437 1.9671 1.2942 1.2737
2005 1.8592 1.7215 1.1954 1.4685
2006 1.4429 1.5353 1.6801 1.3635
2007 1.4872 1.4775 1.6059 1.3997
Source: Computed from DOTS, IMF
Country wise look at the trade intensity showed India‟s export Intensity is above one for
Indonesia, Malaysia, Myanmar, Singapore, Thailand and Vietnam. For others (Brunei,
Laos, Cambodia and Philippines) the export intensity is fluctuating over the years.
Myanmar, Singapore and Vietnam are the three countries with whom India got high
export intensity. For the year 2007, except Cambodia, Laos and Philippines, India got
high trade intensity with all ASEAN countries. Tables 2 gave the country wise export
and import intensity of India with ASEAN countries.
India is importing smaller volumes from the less developed countries of ASEAN which is
reflected in the low Import intensity Index with Brunei, Cambodia and Lao PDR. Imports
are also restricted with Philippines and Vietnam with import intensity well below one.
8
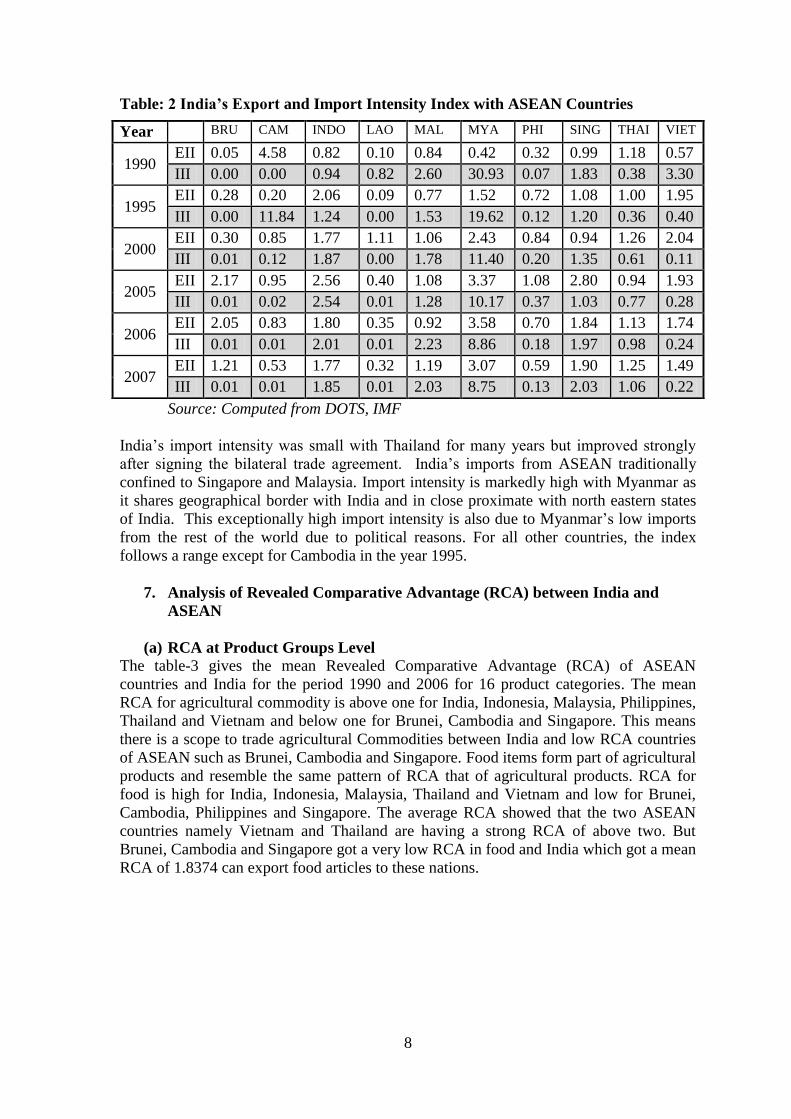
Table: 2 India’s Export and Import Intensity Index with ASEAN Countries
Source: Computed from DOTS, IMF
India‟s import intensity was small with Thailand for many years but improved strongly
after signing the bilateral trade agreement. India‟s imports from ASEAN traditionally
confined to Singapore and Malaysia. Import intensity is markedly high with Myanmar as
it shares geographical border with India and in close proximate with north eastern states
of India. This exceptionally high import intensity is also due to Myanmar‟s low imports
from the rest of the world due to political reasons. For all other countries, the index
follows a range except for Cambodia in the year 1995.
7. Analysis of Revealed Comparative Advantage (RCA) between India and
ASEAN
(a) RCA at Product Groups Level
The table-3 gives the mean Revealed Comparative Advantage (RCA) of ASEAN
countries and India for the period 1990 and 2006 for 16 product categories. The mean
RCA for agricultural commodity is above one for India, Indonesia, Malaysia, Philippines,
Thailand and Vietnam and below one for Brunei, Cambodia and Singapore. This means
there is a scope to trade agricultural Commodities between India and low RCA countries
of ASEAN such as Brunei, Cambodia and Singapore. Food items form part of agricultural
products and resemble the same pattern of RCA that of agricultural products. RCA for
food is high for India, Indonesia, Malaysia, Thailand and Vietnam and low for Brunei,
Cambodia, Philippines and Singapore. The average RCA showed that the two ASEAN
countries namely Vietnam and Thailand are having a strong RCA of above two. But
Brunei, Cambodia and Singapore got a very low RCA in food and India which got a mean
RCA of 1.8374 can export food articles to these nations.
Year BRU CAM INDO LAO MAL MYA PHI SING THAI VIET
1990 EII 0.05 4.58 0.82 0.10 0.84 0.42 0.32 0.99 1.18 0.57
III 0.00 0.00 0.94 0.82 2.60 30.93 0.07 1.83 0.38 3.30
1995 EII 0.28 0.20 2.06 0.09 0.77 1.52 0.72 1.08 1.00 1.95
III 0.00 11.84 1.24 0.00 1.53 19.62 0.12 1.20 0.36 0.40
2000 EII 0.30 0.85 1.77 1.11 1.06 2.43 0.84 0.94 1.26 2.04
III 0.01 0.12 1.87 0.00 1.78 11.40 0.20 1.35 0.61 0.11
2005 EII 2.17 0.95 2.56 0.40 1.08 3.37 1.08 2.80 0.94 1.93
III 0.01 0.02 2.54 0.01 1.28 10.17 0.37 1.03 0.77 0.28
2006 EII 2.05 0.83 1.80 0.35 0.92 3.58 0.70 1.84 1.13 1.74
III 0.01 0.01 2.01 0.01 2.23 8.86 0.18 1.97 0.98 0.24
2007 EII 1.21 0.53 1.77 0.32 1.19 3.07 0.59 1.90 1.25 1.49
III 0.01 0.01 1.85 0.01 2.03 8.75 0.13 2.03 1.06 0.22
9
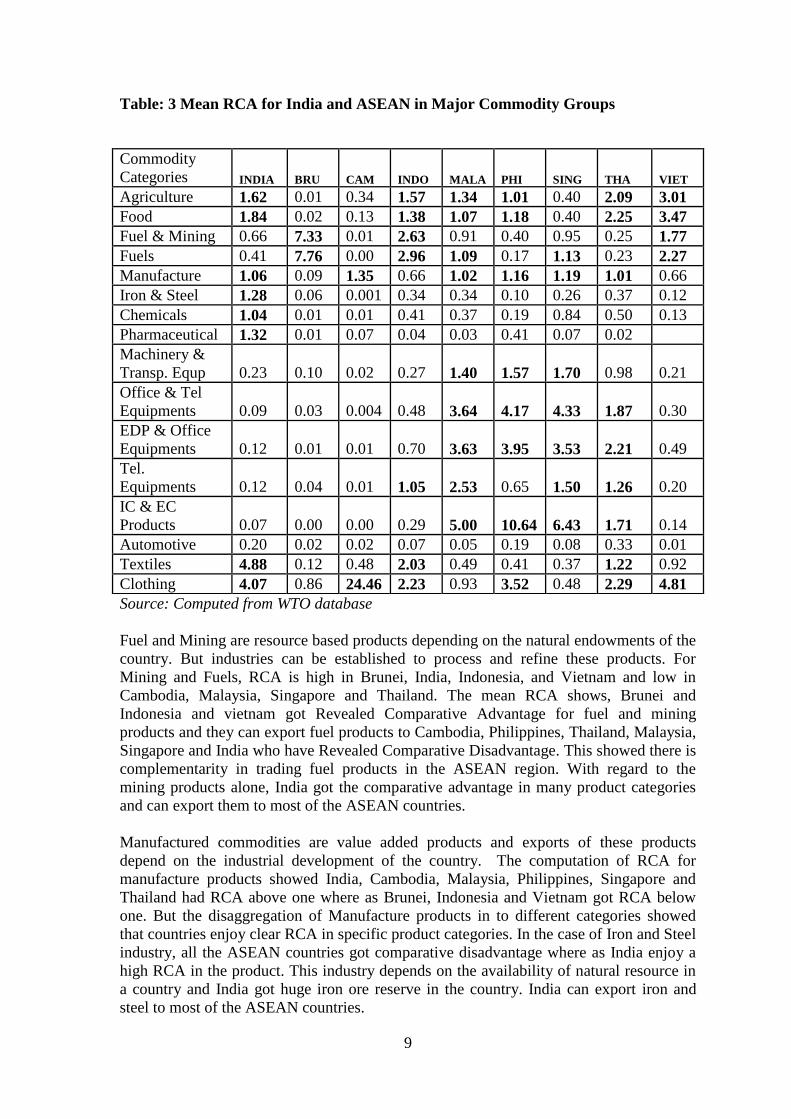
Table: 3 Mean RCA for India and ASEAN in Major Commodity Groups
Source: Computed from WTO database
Fuel and Mining are resource based products depending on the natural endowments of the
country. But industries can be established to process and refine these products. For
Mining and Fuels, RCA is high in Brunei, India, Indonesia, and Vietnam and low in
Cambodia, Malaysia, Singapore and Thailand. The mean RCA shows, Brunei and
Indonesia and vietnam got Revealed Comparative Advantage for fuel and mining
products and they can export fuel products to Cambodia, Philippines, Thailand, Malaysia,
Singapore and India who have Revealed Comparative Disadvantage. This showed there is
complementarity in trading fuel products in the ASEAN region. With regard to the
mining products alone, India got the comparative advantage in many product categories
and can export them to most of the ASEAN countries.
Manufactured commodities are value added products and exports of these products
depend on the industrial development of the country. The computation of RCA for
manufacture products showed India, Cambodia, Malaysia, Philippines, Singapore and
Thailand had RCA above one where as Brunei, Indonesia and Vietnam got RCA below
one. But the disaggregation of Manufacture products in to different categories showed
that countries enjoy clear RCA in specific product categories. In the case of Iron and Steel
industry, all the ASEAN countries got comparative disadvantage where as India enjoy a
high RCA in the product. This industry depends on the availability of natural resource in
a country and India got huge iron ore reserve in the country. India can export iron and
steel to most of the ASEAN countries.
Commodity
Categories INDIA BRU CAM INDO MALA PHI SING THA VIET
Agriculture 1.62 0.01 0.34 1.57 1.34 1.01 0.40 2.09 3.01
Food 1.84 0.02 0.13 1.38 1.07 1.18 0.40 2.25 3.47
Fuel & Mining 0.66 7.33 0.01 2.63 0.91 0.40 0.95 0.25 1.77
Fuels 0.41 7.76 0.00 2.96 1.09 0.17 1.13 0.23 2.27
Manufacture 1.06 0.09 1.35 0.66 1.02 1.16 1.19 1.01 0.66
Iron & Steel 1.28 0.06 0.001 0.34 0.34 0.10 0.26 0.37 0.12
Chemicals 1.04 0.01 0.01 0.41 0.37 0.19 0.84 0.50 0.13
Pharmaceutical 1.32 0.01 0.07 0.04 0.03 0.41 0.07 0.02
Machinery &
Transp. Equp 0.23 0.10 0.02 0.27 1.40 1.57 1.70 0.98 0.21
Office & Tel
Equipments 0.09 0.03 0.004 0.48 3.64 4.17 4.33 1.87 0.30
EDP & Office
Equipments 0.12 0.01 0.01 0.70 3.63 3.95 3.53 2.21 0.49
Tel.
Equipments 0.12 0.04 0.01 1.05 2.53 0.65 1.50 1.26 0.20
IC & EC
Products 0.07 0.00 0.00 0.29 5.00 10.64 6.43 1.71 0.14
Automotive 0.20 0.02 0.02 0.07 0.05 0.19 0.08 0.33 0.01
Textiles 4.88 0.12 0.48 2.03 0.49 0.41 0.37 1.22 0.92
Clothing 4.07 0.86 24.46 2.23 0.93 3.52 0.48 2.29 4.81

10
The computation of RCA for Chemicals showed that India developed comparative
advantage in the product category over the period of time. Currently India is exporting
different chemical products and increasing the export share in its export basket. India got
Revealed Comparative Advantage in Chemicals where as all the other ASEAN countries
have revealed comparative disadvantage pointing out India can improve trade in
Chemical products with the ASEAN countries. India‟s comparative advantage in this
knowledge based industry is the reflection of the capacity developed over the period of
time. All the ASEAN countries have Comparative Disadvantage in this category even
though Philippines is slowly increasing its share over time. There is a prospect higher
trade between India and ASEAN countries in Pharmaceutical Products.
Singapore, Malaysia, Philippines and recently Thailand have been exporting more
Machinery and Transport Equipment and showing Comparative Advantage in this
product category. The disadvantaged countries in the product group include India, Brunei,
Cambodia, Indonesia and Vietnam. This reveals there is scope for trading Machinery and
Transport Equipment within ASEAN countries and ASEAN and India. In this high
technology industry; Singapore, Malaysia, Philippines and Thailand developed
competencies and exporting large share of products to other countries. The mean RCA is
above two for Singapore, Philippines and Malaysia where it is above one for Thailand.
On the other hand countries like India, Brunei, Cambodia, Indonesia and Vietnam have to
go a long way in developing comparative advantage and exporting these products to other
countries. This gives scope for higher intra regional trade for Office and Telecom
Equipment and between Singapore, Malaysia, Thailand and India. If we take the
Electronic Data Processing and Office Equipment separately it follows the same pattern.
Singapore, Malaysia, Philippines and Thailand had higher mean RCA and rest of ASEAN
and India got comparative disadvantage.
Malaysia enjoys high export performance of Telecom Equipment and there by possessing
significant comparative advantage followed by Singapore and Thailand in the region.
Indonesia whose RCA was above one during early 2000, slipped its position after 2005
when RCA fell below one. The less developed countries of ASEAN, Philippines and
India got comparative disadvantage in this product category giving scope for higher trade
among these countries. Integrated Circuits and Electronic Components are an important
input for the development of electronics and communication industry which is growing at
a rapid rate in this information age. East Asian Countries like Singapore, Malaysia,
Philippines and Thailand developed competencies in this sector and have a strong RCA.
The high mean RCA of Philippines (10.64), Singapore (6.43), Malaysia (5.00) and
Thailand (1.71) shows the strong export performance of this high value technology sector.
On the other hand the remaining East Asian countries like Brunei, Cambodia, Indonesia,
Vietnam and India got Revealed Comparative Disadvantage in this category. This showed
that large potential for bilateral trade for this important input component and increased
trade among ASEAN countries and between India and ASEAN.
Automotive is an important component in the manufacturing sector with strong backward
linkage and employment potential. But ASEAN countries as well as India do not have
comparative advantage in this sector. This is because of the dominance and Japanese
companies for long and Korea recently. India has been attracting foreign entry and
investment in this sector and exporting cars manufactured by Multinational (Maruthi
Suzuki, Hyundai) particularly to European nations but yet to develop RCA for sizable
export share and market dominance.

11
Textiles is labour intensive sector with high employment potential and most of the
developing countries of Asia depend on their export to earn their foreign exchange. India
traditionally exported large quantity of Textile products and revealed significant
Comparative Advantage. Indonesia and Thailand also possess considerable export
performance and RCA as their export shares are above the world share. The mean RCA
computed in the study is 4.88 for India, 2.03 for Indonesia and 1.22 for Thailand. Most of
the ASEAN countries have low RCA showing the complementarity existing in the sector
and they can trade more with India for their requirement. But the dismantling of MFA
(Multi Fibre Agreement) bring in strong players like China dominating the market and
India need to equip itself to take care of this advantage. There is increased competition in
the clothing sector in the East Asian region as most of the developing countries having
strong comparative advantage along with India. The mean RCA for Cambodia (24.46),
Vietnam (4.81), Philippines (3.52), Thailand (2.29), and Indonesia (2.23) are high and
these countries are major exporters of clothing to the rest of the world. India is also a
major exporter of clothing to the world and there is limited complementarity between
India and ASEAN countries for increased trade in this sector.
RCA greater than or less than one is the classification used in the studies to ascertain the
comparative advantage for a country in a given product. But the degree of comparative
advantage is useful in getting the relative position of the commodity in the country‟s
export basket. If the RCA index is slightly lower than one, the country can make
concentrated efforts to move towards comparative advantage compared to a commodity
whose RCA is closer to zero. This facilitates easy comparison of relative position of
comparative advantage across countries and product groups. For this purpose mean RCA
of countries are classified in to four categories based on their export performance. These
categories are high comparative disadvantage (RCA 0 to 0.5); low comparative
disadvantage (RCA 0.5 to 1); high comparative advantage (RCA 1 to 2) and strong
comparative advantage (RCA above 2). RCA above one in the table is given in bold
showing comparative advantage enjoyed by the country. High and Low Revealed
Comparative Disadvantaged countries cannot trade as they do not have efficiency in
commodity production. High and strong RCA countries have comparative advantage and
face similar export structure. But finer specialization in production can lead to intra
industry and increased trade is possible between these categories of countries. But trade is
genuinely possible between countries with complementary trade structure like High
Disadvantage - Strong Advantage, High Disadvantage - High Advantage, High
Disadvantage - Strong Advantage and Low Disadvantage - High comparative advantage.
India’s Comparative Advantage with ASEAN Countries – Product Category wise
For easy comparison the mean RCA values calculated for 16 product categories for 8
ASEAN countries are arranged in four above mentioned categories and presented in
Table-4. For Agricultural Commodities India got a high RCA and can export to Brunei,
Cambodia and Singapore who have disadvantage in this product category. Food products
are part of agricultural products and follow the same pattern as that of agricultural
products. For Fuel and Mining products Brunei, Indonesia and Vietnam have comparative
advantage and can trade with India. India got comparative disadvantage in fuel and can
import it from Brunei, Indonesia and Vietnam who are the oil exporters of ASEAN or
from Malaysia and Singapore who refine crude oil and export it to other countries.

12
Table: 4 Country Classification Based on Mean RCA of Commodities
Commodity
Classification High Comparative
Disadvantage
RCA<0.5
Low
Comparative
disadvantage
0.5<RCA> 1
High RCA
RCA 1 to 2
Strong
RCA
RCA
Above 2
Agricultural
Products
Brunei, Cambodia,
Singapore
- India,
Indonesia,
Malaysia,
Philippines
Thailand,
Vietnam
Food Brunei, Cambodia,
Singapore
- India,
Indonesia,
Malaysia,
Philippines
Thailand,
Vietnam
Fuels & MP Cambodia,
Philippines,
Thailand
India, Malaysia,
Singapore
Vietnam
Brunei,
Indonesia
Fuels India, Cambodia,
Philippines,
Thailand
- Malaysia,
Singapore
Brunei,
Indonesia,
Vietnam
Manufacture Brunei
Indonesia,
Vietnam
India,
Cambodia,
Malaysia,
Philippines,
Singapore,
Thailand
-
Iron & Steel Brunei, Cambodia,
Indonesia, Malaysia,
Philippines,
Singapore,
Thailand, Vietnam
- India,
-
Chemicals Brunei, Cambodia,
Indonesia, Malaysia,
Philippines,
Vietnam
Singapore,
Thailand India
-
Pharmaceuticals Brunei, Cambodia,
Indonesia, Malaysia,
Philippines,
Singapore, Thailand
- India
-
Machinery &
Transport
Equipments
India, Brunei,
Cambodia,
Indonesia, Vietnam
Thailand Malaysia,
Philippines,
Singapore
-
Office &
Telecom
Equipments
India, Brunei,
Cambodia,
Indonesia, Vietnam
- Thailand
Malaysia,
Philippines,
Singapore
EDP & OE India, Brunei,
Cambodia, Vietnam
Indonesia - Malaysia,
Philippines,
Singapore,
Thailand

13
Telecom India, Brunei,
Cambodia, Vietnam
Philippines Indonesia,
Singapore,
Thailand
Malaysia
IC & EC India, Brunei,
Cambodia,
Indonesia, Vietnam
- Thailand
Malaysia,
Philippines,
Singapore
Automotive India, Brunei,
Cambodia,
Indonesia, Malaysia,
Philippines,
Singapore,
Thailand, Vietnam
- - -
Textiles Brunei, Cambodia,
Malaysia,
Philippines,
Singapore
Vietnam Thailand
India,
Indonesia
Clothing Singapore
Brunei,
Malaysia
- India,
Cambodia,
Indonesia,
Philippines,
Thailand,
Vietnam
Source: Computed from WTO database
India‟s RCA for Manufacture is high and there is a possibility in trade with Indonesia and
Vietnam who got low comparative advantage. All the ASEAN countries having weak
comparative advantage in Iron and Steel and there is a trade complementarity between
them and India. India‟s export of Chemical products is increasing and reveals a high
comparative advantage. RCA for Chemicals is weak for Brunei, Cambodia, Indonesia,
Malaysia, Philippines and Vietnam and low for Singapore and Thailand. This
complementarity in trade structure gives opportunity for India to export more Chemical
products to ASEAN countries. Similarly India got high RCA in Pharmaceutical products
and export them to weak RCA ASEAN countries.
Table 5 gives the complementary sectors between India and ASEAN for trade
promotion. For Iron and Steel, Chemical and Pharmaceuticals India got complementarity
with all ASEAN countries. For Textiles and Fuels, India got Trade complementarity with
four ASEAN countries. With regard to countries, India‟s complementarity is highest with
Singapore (13 sectors), followed by Malaysia (11), Brunei (10), Philippines (8), Indonesia
(07), Thailand (7), Cambodia (6) and Vietnam (6).
With regard to Machinery and Transport equipment, India got comparative disadvantage
and can import them from high RCA ASEAN countries such as Malaysia, Philippines and
Singapore. The core competence of East Asian countries is in Office and Telecom
Equipments in which the newly industrializing ASEAN countries such as Malaysia,
Singapore, Philippines and Thailand have a strong comparative advantage and export
large quantities to different parts of the world.
14
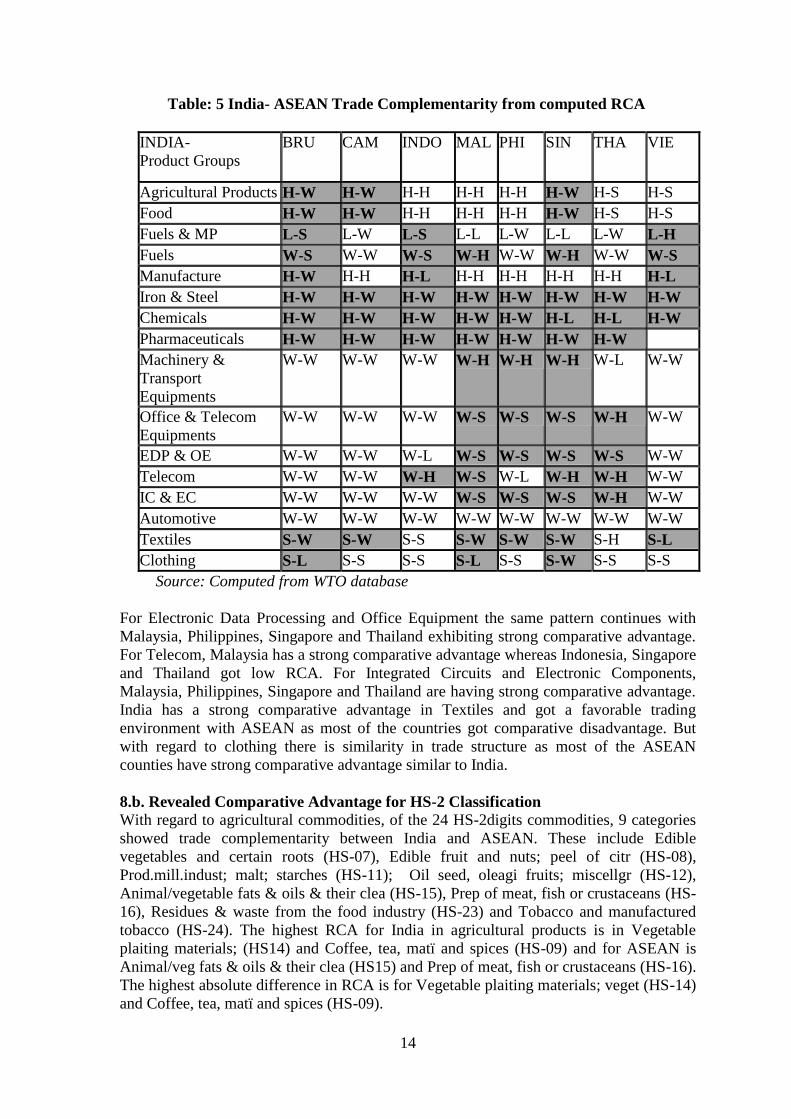
Table: 5 India- ASEAN Trade Complementarity from computed RCA
INDIA-
Product Groups
BRU CAM INDO MAL PHI SIN THA VIE
Agricultural Products H-W H-W H-H H-H H-H H-W H-S H-S
Food H-W H-W H-H H-H H-H H-W H-S H-S
Fuels & MP L-S L-W L-S L-L L-W L-L L-W L-H
Fuels W-S W-W W-S W-H W-W W-H W-W W-S
Manufacture H-W H-H H-L H-H H-H H-H H-H H-L
Iron & Steel H-W H-W H-W H-W H-W H-W H-W H-W
Chemicals H-W H-W H-W H-W H-W H-L H-L H-W
Pharmaceuticals H-W H-W H-W H-W H-W H-W H-W
Machinery &
Transport
Equipments
W-W W-W W-W W-H W-H W-H W-L W-W
Office & Telecom
Equipments
W-W W-W W-W W-S W-S W-S W-H W-W
EDP & OE W-W W-W W-L W-S W-S W-S W-S W-W
Telecom W-W W-W W-H W-S W-L W-H W-H W-W
IC & EC W-W W-W W-W W-S W-S W-S W-H W-W
Automotive W-W W-W W-W W-W W-W W-W W-W W-W
Textiles S-W S-W S-S S-W S-W S-W S-H S-L
Clothing S-L S-S S-S S-L S-S S-W S-S S-S
Source: Computed from WTO database
For Electronic Data Processing and Office Equipment the same pattern continues with
Malaysia, Philippines, Singapore and Thailand exhibiting strong comparative advantage.
For Telecom, Malaysia has a strong comparative advantage whereas Indonesia, Singapore
and Thailand got low RCA. For Integrated Circuits and Electronic Components,
Malaysia, Philippines, Singapore and Thailand are having strong comparative advantage.
India has a strong comparative advantage in Textiles and got a favorable trading
environment with ASEAN as most of the countries got comparative disadvantage. But
with regard to clothing there is similarity in trade structure as most of the ASEAN
counties have strong comparative advantage similar to India.
8.b. Revealed Comparative Advantage for HS-2 Classification
With regard to agricultural commodities, of the 24 HS-2digits commodities, 9 categories
showed trade complementarity between India and ASEAN. These include Edible
vegetables and certain roots (HS-07), Edible fruit and nuts; peel of citr (HS-08),
Prod.mill.indust; malt; starches (HS-11); Oil seed, oleagi fruits; miscellgr (HS-12),
Animal/vegetable fats & oils & their clea (HS-15), Prep of meat, fish or crustaceans (HS-
16), Residues & waste from the food industry (HS-23) and Tobacco and manufactured
tobacco (HS-24). The highest RCA for India in agricultural products is in Vegetable
plaiting materials; (HS14) and Coffee, tea, matï and spices (HS-09) and for ASEAN is
Animal/veg fats & oils & their clea (HS15) and Prep of meat, fish or crustaceans (HS-16).
The highest absolute difference in RCA is for Vegetable plaiting materials; veget (HS-14)
and Coffee, tea, matï and spices (HS-09).
15
For Chemical products the trade complementarity is present in Salt; sulphur; earth & ston;
plaste (HS-25), Ores, slag and ash (HS-26), Mineral fuels, oils & product (HS-27),
Tanning/dyeing extract; tannins & (HS-32) and Explosives; pyrotechnic prod; match (HS-
36). Interestingly India has a higher RCA than ASEAN for all product categories. India‟s
highest RCA is for Ores, slag and ash (5.66) and Salt; sulphur; earth & ston; plaste (HS-
25) and these two products have highest absolute difference in RCA.
For other manufactured products, the complementarity is present in Rubber and articles
thereof (HS-40), Raw hides and skins (HS-43) and Articles of leather; saddlery/harne
(HS-43). India has strong comparative advantage in Articles of leather; saddlery/harne
and Raw hides and skins (other than fu) where ASEAN got high comparative advantage
in Rubber and articles thereof. India‟s strong comparative advantage in Textiles and
related products include Silk (HS-50), Cotton (HS-52), Other vegetable textile fibres; pap
(HS-53), Man-made filaments (HS-54), Carpets and other textile floor co (HS-57)Art of
apparel & clothing access(HS-61), Art of apparel & clothing access (HS-62)Other made
up textile articles (HS-63) and these products have export markets in ASEAN countries.
The mean RCA for ASEAN countries taken together do not reveal comparative advantage
in textiles and related products even though individual countries show high revealed
comparative advantage.
In this category of industrial inputs the complementarity is present in prepared feathers &
down; artificial flower (HS-67) and Natural/cultured pearls, precious stone (HS-71) in
which India got very strong comparative advantage. Pearls and precious stones are
important items of export as these are used in jewellery and artifacts.
India enjoys comparative advantage in many mineral products compared to ASEAN
countries. These include Iron and steel (HS-72) Articles of iron or steel (HS-73), Copper
and articles thereof (HS-74) and Zinc and articles thereof (HS-79) in which India got high
RCA against ASEAN. ASEAN‟s comparative advantage lies in Tin and articles thereof
(HS-80) and India can import this from ASEAN as the absolute difference is highest in
this category.
ASEAN has strong RCA for Electrical machinery, equipments, parts thereof (HS-85) and
high RCA for Nuclear reactors, boilers, machinery (HS-84) against India and export lot of
items to India. On the other hand India‟s RCA include Ships, boats and floating structure
(HS-89), Clocks and watches and parts thereof (HS-91) and Works of art, collectors'
pieces etc. (HS-97).
8.c. Revealed Comparative Advantage (RCA) of HS -4 digits Classification
Revealed Comparative Advantage is calculated for four ASEAN countries namely
Malaysia, Philippines, Singapore and Thailand for the year 2008 and compared against
India‟s RCA to see the trade complementarity at the more disaggregated level. The
exercise could not be done for other ASEAN countries due to non availability of data at
the HS four digits level. The following section gives the analysis of RCA of ASEAN and
India in HS-4 digits commodity classification.
The top five HS-4 commodities in terms of export share for India are Petroleum oils and
oils obtained fr, (17.35 percent with a RCA of 3.84), Diamonds, whether or not worked,
bu, (8.19 percent with a RCA of 15.13), Iron ores and concentrates, include (3.10 percent
with a RCA of 46.30), Rice (1.56 percent with a RCA of 10.05), and Other organic

16
compounds (1.31 percent with a RCA of 46.30). Among agricultural commodities India
got comparative advantage in Coconuts, Pepper, Vanilla, Seeds of anise, badian, fennel,
Rice, Groundnut, Copra and Oil cakes and other residues.
The top five HS-4 commodities in terms export share for Malaysia are Automatic data
processing machines (7.20 percent with a RCA of 3.37), Petroleum gases and other
gaseous h (7.07 percent with a RCA of 3.56), Petroleum oils and oils obtained fr (6.65
percent with a RCA of 1.21), Palm oil and its fractions, whether (6.41 percent with a
RCA of 47.18) and Parts and accessories (other than c) (5.47 percent with a RCA of
6.30).
The top five HS-4 commodities in terms export share for Philippines are Electronic
integrated circuits and (9.73 percent with a RCA of 6.28), Automatic data processing
machines (7.65 percent with a RCA of 3.58), Parts and accessories of the motor (4.19
percent with a RCA of 2.24), Diodes, transistors and similar items (3.67 percent with a
RCA of 6.75) and Parts and accessories (other than c (3.35 percent with a RCA of 3.85)
The top five HS-4 commodities in terms export share for Singapore are Petroleum oils
and oils obtained fr (24.16 percent with a RCA of 5.35), Electronic integrated circuits and
(11.26 percent with a RCA of 7.28), Parts and accessories (other than c (4.28 percent with
a RCA of 4.92), Automatic data processing machines (3.77 percent with a RCA of 1.77)
and Prepared unrecorded media for sound (1.72 with a RCA of 9.61).
The top five HS-4 commodities in terms export share for Thailand are Automatic data
processing machines (7.62 percent with a RCA of 3.57), Petroleum oils and oils obtained
fr (5.05 percent with a RCA of 1.12), Electronic integrated circuits and (4.07 percent with
a RCA of 2.63), Natural rubber, balata, gutta-perch (3.82 percent with a RCA of 37.09)
and Rice (3.47 percent with a RCA of 22.31).
8. Conclusion
Inferences from the trade indices computed for understanding the trade structure between
India and ASEAN revealed that there are complemetary sectors and products available for
enhancing trade cooperation between the trading partners. ASEAN countries are in
different stages of economic development and India can have trade cooperation with
some of them in all product categories. While India can export food grains to small and
developed countries of ASEAN, it can import edible and other agricultural products from
other ASEAN countries. India enjoys advantage in minerals whereas they can import
crude oil from ASEAN. India had advantage in some manufactured items like chemicals,
Iron and Steel, Jems and Jewellery and can export them to many ASEAN countries.
ASEAN has comparative advantage in Electrical and Electronic components and India
can import them from ASEAN. With regard to Textiles and Clothing there is intense
competition between ASEAN and India to increase market share. India‟s average tariff is
higher than ASEAN countries and reduction of tariffs will have a short term impact on
India‟s exports but can consolidate in the medium term through productivity gains and
efficiency. Also emerging economic structure warrants greater cooperation from India in
the regionalization efforts in Asia.

17
References
Asher, M.G. and R.Sen. 2005. “India‐East Asia Integration: A Win‐Win for Asia”.
Economic and Political Weekly, 60, 36, :3932‐3941.
Balassa, Bela. 1965. “Trade Liberalization and Revealed Comparative Advantage”. The
Manchester School of Economic and Social Studies, No. 33: 99-123.
Balassa, Bela. 1977. “'Revealed' Comparative Advantage Revisited: An Analysis of
Relative Export Shares of the Industrial Countries, 1953-1971”. The Manchester School
of Economic & Social Studies, 45(4): 327-44
Baldwin, Richard. 1993. “A domino theory of regionalism‟. CEPR Discussion Paper
857; NBER Working Paper, 4465.
Baldwin, R.E. 1997. “The Causes of Regionalism”. The World Economy, 20(7): 865-888.
Batra, Amita and Zeba Khan. 2005. “Revealed Comparative Advantage: An Analysis
for India and China”. Indian Council for Research on International Economic Relations
(ICRIER), Working Paper No. 168, New Delhi.
Bender, Siegfried and Kui-Wai Li. 2002. “The Changing Trade and Revealed
Comparative Advantages of Asian and Latin American Manufacture Exports”. Yale
University, Economic Growth Center Discussion Paper Series No. 843.
Bird, Graham and Ramkishen S. Rajan. 2002. “The Political Economy of a Trade-
First Approach to Regionalism”. Institute of Southeast Asian Studies, Visiting
Researchers Series No. 2(2002).
Burange, L.G; and Sheetal, J. Chaddha. 2008. “ India‟s Revealed Comparative
Advantage in Merchandise Trade”. Department of Economics, University of Mumbai,
Working Paper UDE 28/06/2008.
Chow, Peter C. Y. 1990. “The Revealed Comparative Advantage of the East Asian
NICs”. The International Trade Journal, 5(2): 235 – 262.
Drysdale, P. 1969. "Japan, Australia, New Zealand: The Prospect for Western Pacific
Economic Integration", Economic Record, 45 (11):321-342.
Ferto, Imre and Lionel J. Hubbard. 2002. “Revealed Comparative Advantage and
Competitiveness in Hungarian Agri-Food Sectors”. Institute of Economics, Hungary
Academy of Sciences, Budapest, Discussion Paper Series 2002/8.
Karmakar, Suparna. 2005. “India–Asean Cooperation In Services – An Overview”.
ICRER Working Paper No. 176.
Kawai, Masahiro (2004), „Regional Economic Integration and Cooperation in East
Asia,‟ mimeo
Kemp, M. and H.Y. Wan. 1976. “An elementary proposition concerning the formation
of customs union”. Journal of International Economics, 6 (1): 95-97.
Kojima, K. 1964. "The Pattern of International Trade among Advanced Countries".
Hitotsubashi Journal of Economics, 5(1): 62-84.
Krishna, P. 1998. “Regionalism and Multilateralism: A Political Economy Approach”.
Quarterly Journal of Economics, 113(1): 227-250.
Kumar, N. 2002. “Towards an Asian Economic Community: The Relevance of India”.
Research and Information System for Non-Aligned and other Developing Countries
(RIS), Discussion Paper No.34, New Delhi.
Lall, Sanjaya and John Weiss. 2004. “People‟s Republic of China‟s Competitive Threat
to Latin America: An Analysis for 1990-2002”. Asian Development Bank Institute,
Discussion Paper No. 14
Lall, Sanjaya and Manuel Albaladejo. 2003. “China‟s Competitive Performance: A
Threat to East Asian Manufactured Exports?”, Queen Elizabeth House Working Paper
Series No. 110

18
Leu, Gwo-Jiun Mike. 1998. “Changing Comparative Advantage in East Asian
Economies”. School of Accounting and Business Research Center, NTU, Working Paper
Series, 3-98, Singapore.
Levy, P. 1997. “A Political-economic Analysis of Free-trade Agreements”. American
Economic Review, 87, 4, 506–19.
Lim, Kang-Taeg. 1997. “Analysis of North Korea‟s Foreign Trade by Revealed
Comparative Advantages”. Journal of Economic Development, 22 (2): 97-117.
Lipsey. 1960. “The theory of customs unions: A general survey”. Economic Journal, 70
September: 496-513.
Meade, J.E. 1955. “The Theory of Customs Unions”. Amsterdam: North-Holland.
Ohyama, M. 1972. “Trade and welfare in general equilibrium”. Keio Economic Studies
9: 37-73.
Okamoto, Yumico. 2005, “ASEAN, China, and India: Are they more Competitive or
Complementary to each Other?”. Department of Policy Studies, Doshisha University,
Japan. Available at http://www.elib.doshisha.ac.jp
Panagaria, Arvind. 2000. “Preferential Trade Liberalization: The Traditional Theory and
New Developments”. Journalof Economic Literature. XXXVIII: 287-331.
Rajen, Ramkishen S. 2003. “Production Sharing in East Asia, Implications for India”.
Economic and Political Weekly, September 6: pp.3770-2.
Richardson, David. J and Chi Zhang. 1999. “Revealing Comparative Advantage:
Chaotic or Coherent Patterns Across Time and Sector and U.S Trading Partner?”.
National Bureau of Economic Research, Working Paper 7212.
Soloaga, Isidro, and L. Alan Winters. 1999. “How Has Regionalism in the 1990s
Affected Trade?”. Policy Research Working Paper Series no. 2156. World Bank,
Washington, D.C.
Vanek, J. 1965. General Equilibrium of International Discriminaton: The Case of
Customs Unions, Cambridge, Massachusetts, Harvard University Press.
Viner, J. 1950. “The customs union issue”. New York: Carnegie Endowment for
International Peace.
Vollrath, T. L. 1991. “A Theoretical Evaluation of Alternative Trade Intensity Measures
of Revealed Comparative Advantage”. Weltwirtschaftliches Archiv, 130: 265–279.
Weiss, John. 2004. “People‟s Republic of China and its Neighbors: Partners or
Competitors for Trade and Investment?”, Asian Development Bank Institute, Discussion
Paper No. 13.
World Trade Organisation (WTO). 2008. “International Trade Statistics”, Geneva.
World Bank. 2005, “Trade, Regionalism and Development”. Global Economic
Prospects, Washington, D. C: World Bank.
Yeats, Alexander, J . 1997. “Does Mercosur‟s Trade Performance Raise Concerns
About the Effects of Regional Trade Arrangements”. International Economics
Department, The World Bank.
Yue, Changjun. 2001. “Comparative Advantage, Exchange Rate and Exports in China”.
Paper prepared for the international conference on Chinese economy, CERDI, France.