trade cycle. 1870 – 1938 - uc3mportal.uc3m.es/portal/page/portal/instituto... · (jeftanovic...
TRANSCRIPT

1
Avoiding the Dutch disease? The Chilean industrial sector in the nitrate trade cycle. 1870 – 1938.1 Cristián Arturo Ducoing Ruiz2. Universitat Pompeu Fabra
Marc Badia – Miró3. Universitat de Barcelona
Abstract
The Dutch disease associated to the expansion of the Natural Resources sector is broadly analyzed in the economic history of
the developing countries, due to the fact that is one of the most important restrains to achieve the economic development. One of
the most interest historical cases of Dutch Disease is the one associated to the Chilean nitrates cycle (1880 – 1930) However,
except a first attempt by Palma (2002), there is not a quantitative study that analyses the relation between nitrate export
trade and “deindustrialization” or lack of industrial development in this period. To search in the roots of this relationship,
the authors had estimated a new industrial GDP and have compared this variable with the terms of trade with the core and
their neighbors, relative wages and other macroeconomic indicators to achieve a clear perspective of what really happened during
this period. In previous works we have also found an inverse correlation between industrial development and the nitrate cycle.
This outputs could be compared the ones obtained by Lüders and Wagner (2003), and their analysis of the optimal tax.
This could be even more interesting if we consider that the years around the I World War, could be a good opportunity to the
industrial expansion, due to the collapse of the traditional manufacturing supplier. In this context, an expanding industry
could respond to this external stimulus.
Keywords: Dutch disease; industry; nitrates; GDP; terms of trade.
JEL Codes: N16; N66; O14
1 Cristián Arturo Ducoing Ruiz acknowledges support from the Spanish Innovation and Science Ministry (research project ECO2010-15882 led by Xavier Tafunell). Marc Badia-Miró acknowledges support from the Spanish Innovation and Science Ministry (research project ECO2009-13331-C02-02 led by Alfonso Herranz), and project 2009SGR153 (Antoni de Campany Centre of Economy and Economic History). We would like to thank the comments from Anna Carreras-Marín, A. Herranz, V. Neira, X. Tafunell and C. Yañez. 2 Cristián Ducoing is Visiting Professor, Department of Economics and Bussines, Pompeu Fabra University. Ramon Trias Fargas, 25 – 27. 08002, Barcelona, Spain. E-mail: [email protected] 3 Marc Badía – Miró is Assistent Professor of the Departament d’Història i Institucions Econòmiques, Facultat d’Economia i Empresa, Universitat de Barcelona. Av. Diagonal, 690, Torre 2, Planta 4, 08034, Barcelona, Spain. E-mail: [email protected]. Is also research affiliate to Centre d´Estudis ‘Antoni de Capmany’ d´Economia i Història Econòmica and to Xarxa de Referència d'R+D+I en Economia i Polítiques Públiques.

2
1. Introduction
Since the 1980s many articles have been written arguing for an early industrialization in Latin America
(Suzigan 1988; Williamson 2011) before the period known as ISI. This argument has a long discussion
about the effects of this industrialization in economic growth and public policy in the last period, because
is not feasible industrialization project from scratch, if there was a previous industrial base. One possible
guilty of the industrial underdevelopment is the called Dutch disease, a phenomenon affecting the
countries with an explosive improve in commodities’ exports, but with lack of competitiveness in the
industrial sector.
Chile, since 1880’s, as effect of the victory in the War of the Pacific4 (1879 – 1883) against Peru and
Bolivia, it had an impressive improvement in the saltpetre exports. The question for the economic
historians is: Were saltpetre exports an improvement to industrial development of the country or were a
resource curse? The GDP per capita it could be a good proxy; in 1870 the income of Chile represented
the 53% of the GDP per capita of USA. This indicator was downgrade to 46% in 1940 and its best
moment reached 61% (1912). Analysing this data is possible to think that the effects of the nitrates in the
Chilean economy are not visible in the GDP per capita as a measure of convergence with the economic
leader.
Figure 1 - Chilean GDP as percentage of the USA GDP per capita
Source: (Maddison 2006).
Is this lack of convergence with the economic leader the best choice to compare the effect of
saltpetre trade in the Chilean economy? Probably not; but if we compares with countries with a similar
GDP per capita en 1880, the results are in the same line; Chile was losing competitiveness and capacity to
growth. It could be a better approach make a new industrial output and compare this indicator with the
influence of the saltpetre trade in the principal macroeconomics indicators of the Country, as the
exchange terms, relative prices and distribution of the investment structure. Some authors, as (Palma
1979; 2000a) claims that the effect of the saltpetre trade was not detrimental to the economy and there is 4 Some authors tries to use the name “Saltpetre War” and avoid the name “War of the Pacific”
20
25
30
35
40
45
50
55
60
65
1870
18
75
1880
18
85
1890
18
95
1900
19
05
1910
19
15
1920
19
25
1930
19
35
1940
19
45
1950
19
55
1960
19
65
1970
19
75
1980

3
no evidence about dropping exchange rates in the period. However, the data used by Palma are too
aggregated, and there is no disaggregation among tradable and non – tradable goods.
In this paper, the objective is to use a new quantitative approach for the industrial development
considering machinery data base, elaborated from the Chile’s foreign trade and statistical yearbook and
foreign trade statistics from UK and USA. The importance of this data base is based in three principal
characteristics: firstly, is a long run series, between 1870 and 1938 (the most common year to set up the
beginning of the industrial policy by the state); secondly, consider an index of machinery prices; and lastly,
is disaggregated by productive sector composition (agricultural, mining, industry and transport
equipment). With these new series, it’s possible to observe the real amount expended in capital formation
in industrial machinery (henceforth CFM) by the country and allow us to have a new approach to the early
industrialization in Chile, considering the effects of saltpetre trade cycle over the Chilean economy and its
industrialization. The composition of machinery and its prices are proxies of the degree of
industrialization and for the cost opportunity to invest in other sectors out of mining. The chosen period
1844 – 1938 is important in the Chilean economic history because is a period with a great number of
unexplored statistical sources, and it covered all the years before the ISI.5 The paper is structured as
follows; point 2 analyses the symptoms (or their absence) of Dutch disease in the Chilean economy; point
3 offers a new estimation of the industrial GDP, in the aim to know the effects of the saltpetre boom on
industry. Section 4 closes with the conclusions.
2. The Symptoms of the Dutch Disease in Chile 1870 - 1940
Dutch disease appeared when an increase in revenues due to an export boom, leads to an appreciation in
real exchange rate which and, in parallel, this affects the competitiveness of the rest of the economy. At
the same time, higher potential profits in the export sector drain resources (investment) to the leader
sector (that is, to the mining sector o linked to them as transports and mining infrastructures).
Figure 2 – Drivers of Dutch Disease
(W. Max Corden and Neary 1982; W.M. Corden 1984; Van Wijnbergen 1984) in their seminal works,
points out that countries which experienced a natural resources boom, experienced a strong process of de-
industrialization due to the fact that exports boom sector attracted labour and investment and, at the same
time, service sector experienced a strong push due to the increase in the level of income. In parallel, higher
5 (Gómez Galvarriato and Williamson 2008) had done a similar approach, just with the USA and UK foreign exports. In the case of (Tafunell 2009), his comparative work begins in 1890.
Export boom
Increase in revenues Appreciation exchange rate
No competitiveness of the rest of the
economy
Drain resources from the other sectors of the economy

4
wages in natural resources sectors added to the appreciation in the exchange rate reduced the
competiveness of the “traditional” exporter sector. At the end, the result is a less diversified economy,
strongly dependent on the evolution of the natural resources prices (more volatile) and a less potential
growth. Many interesting works on this issue, has been published since then, and many interesting
contributions on country cases were done.6 We also highlight some studies with a more optimistic view as
the one done by (Davis 1995) on the positive performance of mineral-exporter and less developed
countries if they were compared with the other less developed countries, and (Mikesell 1997) who stress
that not all the boom exports implies Dutch disease. (Alvarez and Fuentes 2006; van der Ploeg 2011) have
made interesting surveys on this topic considering some of the most important approximations to this
field and list part of the case studies in the world.
If we focus our attention to the Chilean case, Dutch disease has been widely analysed in their different
boom export periods. (Jeftanovic Petrinovic 1992) and (Palma 2000b) provides opposite views of their
existence during the Nitrate booms. In one side, (Jeftanovic Petrinovic 1992) considers a model with three
sectors (tradable, non-tradable and export sector), to confirm the existence of a slowdown in agriculture
and industry at the beginning of the 20th century due to the draining of labour and investment to the
salitre sector. In that caee, the author only considers the evolution of real exchange rate and the existing
series of industrial GDP due to the lack of data.7 Their conclusions consider the existence of Dutch
disease in the industry and in the agriculture. On the other side, (Palma 2000b) stress the no existence of
Dutch disease due to the active paper played by the state in spent most of the surplus appropriated with
their fiscal policy and the expenses of the productive process. Other works from Chile, were focused in
the analysis of the expansion of the copper sector during the 20th century as (Pereira et al. 2009). Later,
(Giarda and Landerretche 2011) analyses the first decade of the 21st century and the impact of the
expansion of copper prices.
In our case, to try to understand the impact of nitrates boom in the performance of the industry in the
beginnings of the 20th century we consider the approximation that the one used by (Dobrynskaya and
Turkisch 2010) to test the existence of Dutch disease, due to the impact of the export boom in Russia, at
the end of the 20th century. To check the existence of Dutch disease in Chile, during the nitrate boom
period, we are going to analyze the existence of their symptoms, namely 1) appreciation of the exchange
rate, 2) rise in real wages, 3) growth in the service sectors and 4), a slow-down in industrial production.
6 Oil boom cases as (Usui 1997). 7 The autor considers the Industrial GDP from (Ballesteros and Davis 1963) which were considered as a optimistic serie.

5
1) Appreciation of the exchange rate.
The rise of exchange rate is basically the main assumption of the Dutch disease. A real appreciation of the
domestic currency is a net loss in competitiveness. The exports of commodities and the rise in internal
prices increase the cost to produces goods for exports. Was there a rise of the exchange rate between 1901
and 1931, from a maximum 1.6 in 1903 to a minimum of 0.58 in 1917, due the IWW. In the long run,
from 1901 to the end of the period, we didn’t see a real appreciation
Figure 3 - Evolution of the exchange rate in Chile, 1900 – 1940
2) Rise in real wages
The behaviour of real wages has been a source of many studies, among them the specifics of Braun (2000)
and Matus (2009) . The latter author has shown that in terms of sectors, the only economic
activity that had clearly positive trend was the industry, while other sectors remained stagnant. This is a
contradiction with the main idea of the Dutch disease; the other explanation is that the modern sector had
better salaries than the others.
Figure 4 - Real wages in the Chilean economy
0,0
0,5
1,0
1,5
2,0
2,5
3,0
3,5
1901 1906 1911 1916 1921 1926 1931 1936
0,00
5,00
10,00
15,00
20,00
25,00
30,00
35,00
40,00
1880
18
83
1886
18
89
1892
18
95
1898
19
01
1904
19
07
1910
19
13
1916
19
19
1922
19
25
1928
19
31
1934
19
37
1940
Salarios Reales (Remuneración del Trabajador 1995=100) DT-187, pp.136-7 Salarios Reales (1995=100)

6
3) Growth in service sectors
Which is the proxy for the growth in the services sector? The best statistics it would be the share in the
GDP of services sector. Sadly, we don’t have yet whit this kind of data, but we can use as proxy
investment in the services sector (Ducoing, 2011). If there were not Dutch disease in Chile, the
investment it would be directed to the industry, agriculture and mining; in Figure 5 we can appreciate the
continuous growth of the transport share in the gross capital formation. Of course, the existence of
railways is a condition to sustainable growth, but is notorious the preference of the investors by the
transport instead industry. If we consider the railway and total transport investment as proxy of growth in
the sector services, this could be a symptom of Dutch disease in Chile, because the incentives for the
economics agents are in the commodities sector (nitrates) instead the manufactures, and is more rentable
the investment in Transport equipment to take the minerals to the shores.
Figure 5 – Industrial machinery and Transport Equipment share in the Gross Capital formation in machinery 1880 – 1938
Source: Ducoing (2011; 2012)
3. Was the Chilean industrial production performance affected by Dutch Disease?
The fourth symptom of Dutch Disease is an expected slowdown in industry. The role played by the
industrialization in Chile before the Great Depression, has been widely analysed by the Chilean
bibliography. The foundation of the SOFOFA8 in 1883 started a period of deep reflexion around the role
that the industry would have to play and their promotion.9 The expansion in the nitrate sector diverts the
focus from the industry. Industrial policies weren’t a priority during the nitrate era (1880 – 1929).10
8 Sociedad de Fomento Fabril. 9 In 1877, due to the problems in the taxation, a change in import taxes was observed, especially in machinery and equipment goods. The level of the tax was around 15%, and it lasted till 1880s. (Ortega 2005, 310). 10 A detailed analysis on the paper played by the State in the promotion of the industry see (Ffrenc-Davis et al. 2000, 114–153).
0,00
10,00
20,00
30,00
40,00
50,00
60,00
70,00
Industrial Machinery Transport Equipment

7
To go further in the study of the evolution of the economy in this period, is essential the understanding of
the performance of the Chilean industry GDP. The first attempts were the some descriptive analysis as
the ones done by (Pinto and Ortega 1991; Ortega 2005) about some specific case’s study which allow us
to affirm, the existence of a previous industrialization process during the nitrate era, which failed due to
the absence of an active industrial policy. Featured authors have attempted to quantify the weight of
industry in the country through various techniques. The most widely accepted estimate by the literature of
National Accounts (Díaz, Lüders, and Wagner 2007) is the regression method developed by (Kirsch
1976), who starting from industrial GDP of (Muñoz Gomá 1968) established that the relationship
between industrial GDP and import of industrial raw materials measured is fairly accurate relationship.
However, Kirsch did not have many of the elements that are currently available as a series of industrial
machinery and disaggregated estimates of apparent energy consumption.11 Incorporating these new series,
and following the same methodology proposed by Kirsch, we aim to provide a new estimate of the
industrial level of Chile between 1870 and 1938 with the objective of coming as close as possible to pre
ISI industry. With the input of a new industrial GDP, it could be possible measure the effects of the
nitrate trade cycle over the industry along the period 1870 – 1938.
As we have said, (Kirsch 1976) obtained a linear regression from the previous estimations of the industrial
GDP of (Muñoz Gomá 1968), raw material imports, intermediate goods and a dummy to capture periods
with higher protectionism. The resulting expression was:
𝐿𝑛 (𝐺𝐷𝑃 𝑖𝑛𝑑�) = 6.669 + 0.428 · 𝐿𝑛(𝐼𝑀𝑃𝑅𝑀�) + 0.143 · 𝐷𝑀𝑇𝐴𝑅𝐼𝐹𝐹 (1)
(Kirsch 1976) emphasizes the precariousness of the resulting output despite the higher grade of
explanation of the OLS estimation, due to the existence of autocorrelation in the error term.12 (Díaz,
Lüders, and Wagner 1998) obtain the missing data for the period 1880 – 1914 considering the “most
probable Kirsch index” from:
𝐼𝑛𝑑𝑖𝑐𝑒 𝐾𝑖𝑟𝑠𝑐ℎ = 59,6265 − 13,57425 · 𝑇 + 4,501584 · 𝑇� − 0,594484 · 𝑇�+
+0,042252 · 𝑇� − 0,001694 · 𝑇� + 3,59 · 10�� · 𝑇� − 3,09 · 10�� · 𝑇� (2)
For the previous period, between 1860 and 1880, (Díaz, Lüders, and Wagner 1998) considers that the
industrial output over the number of firms (Y) followed an annual time trend (1880, T=1) and depends on
the number of industrial workers (L), as we observe in equation (3):
𝑌 = 2,032163 + 0,034310 · 𝑇 + 1,549 · 𝐿 (3)
11 (Ducoing 2010; 2011). 12 (Ballesteros and Davis 1963, 178) also points out the existence of autocorrelation.

8
From equation (2) and considering the number of workers for each firm and the number of firms, for the
period 1860 – 1880, they obtain the industrial output. Other estimations for the industrial GDP were the
ones from (Ballesteros and Davis 1963). These authors consider the production data from the industrial
firms provided by the official statistical sources from 1908.13 The resulting output was deflated by a
weighted price index which considers six manufacturing raw materials, before 1929. After 1929 they
consider the official price index for the industry.14 From 1929 onwards, they consider the deflated values
instead of the physical product because they were more reliable if we consider a downward estimation.
Other estimations of industrial output were the ones provided by (Palma 1979) for the period 1911 –
1935. This was the one used by (Haindl Rondanelli 2006) in their latter GDP reconstruction between 1900
and 2000.
When we compare all this estimations we observe the existence of important discrepancies around the
period previous to the I World War (see Figure 6). While (Kirsch 1976) and (Díaz, Lüders, and Wagner
1998) consider that the levels of industry in 1913 were similar to the ones observed at the end of the war,
and therefore, the weight of the industry in the economy was already important at the end of the 19th
century. In contrast to this view, the outputs provided by the other authors showed that the I World War
was a period of strong expansion of the industry, and hence, industry at the begging of the 20th century
was less developed.
Figure 6 – Industrial output series, 1880 – 1940 (1929 = 100)
Source: Various authors.
This contradiction appears as a key point in the understanding of the Chilean industrial performance. Data
from official sources in current prices (Anuarios Estadísticos (Industria)) could be observed in Table 1.
13 Data came from Industry in the Anuario Estadístico. Some limitations and difficult arises in the sources. The series were not homogeneous. Some years it considered firms with more than 5 workers and from 1916 onwards, it considered firms with more workers. This sub biased the latter estimations. 14 Estadística Chilena. Various years.
20
40
80
160
1880 1885 1890 1895 1900 1905 1910 1915 1920 1925 1930 1935 1940
Ballesteros (1963) Haindl (2006) Palma (1979)
Muñoz (1968) Díaz et al. (1998) Kirsch (1976)

9
Table 1 – Industry production ($ m.c.)
Año Producción Año Producción
1908 469,123,133 1917 720,919,430
1909 584,909,560 1918 766,776,872
1910 531,493,917 1919 905,151,651
1911 535,037,093 1920 993,220,128
1912 563,339,541 1921 1,014,276,595
1913 654,837,495 1922 1,064,089,995
1914 445,731,319 1923 1,172,601,971
1915 580,996,077 1924 1,328,184,534
1916 651,581,446
Fuente: Anuario Estadístico (Industria). Varios años.
The next step is the transformation into constant prices. This point appeared as a key point in the
reconstruction of the industry figures. If we compare different the resulting output considering the
available industry price index from (Ballesteros and Davis 1963; Díaz, Lüders, and Wagner 1998; Tafunell
2011) as well as other consumer price index (Matus González 2009) to compare the robustness of all of
them. As we have observed previously, differences on the level of industry previous to the I World War
arises (see
Figure 7).
Figure 7 - Evolution of indutry product, 1908 – 1920 (in constant prices of 1913)
Source: Anuario Estadístico (Industria). Various years. Industry deflator from (Ballesteros and Davis 1963; Díaz, Lüders, and
Wagner 1998; Tafunell 2011).
The observation of the evolution of other variables could provide some light to solve this contradiction.
The evolution of the number of manufacturing employers and firms clearly shows a less optimistic view
of the performance of the Chilean manufactures. Total exports and total imports during this period (see
Figure 8), jointly with the evolution of machinery imports from Germany, reinforced the less optimistic
0
200.000.000
400.000.000
600.000.000
800.000.000
1.000.000.000
1.200.000.000
1908 1909 1910 1911 1912 1913 1914 1915 1916 1917 1918 1919 1920 1921 1922 1923 1924
Producción anual ($ 1909) Tafunell Producción anual ($ 1909) Ballesteros
Producción anual ($ 1909) Matus Producción anual ($ 1908-10) Lüders
10
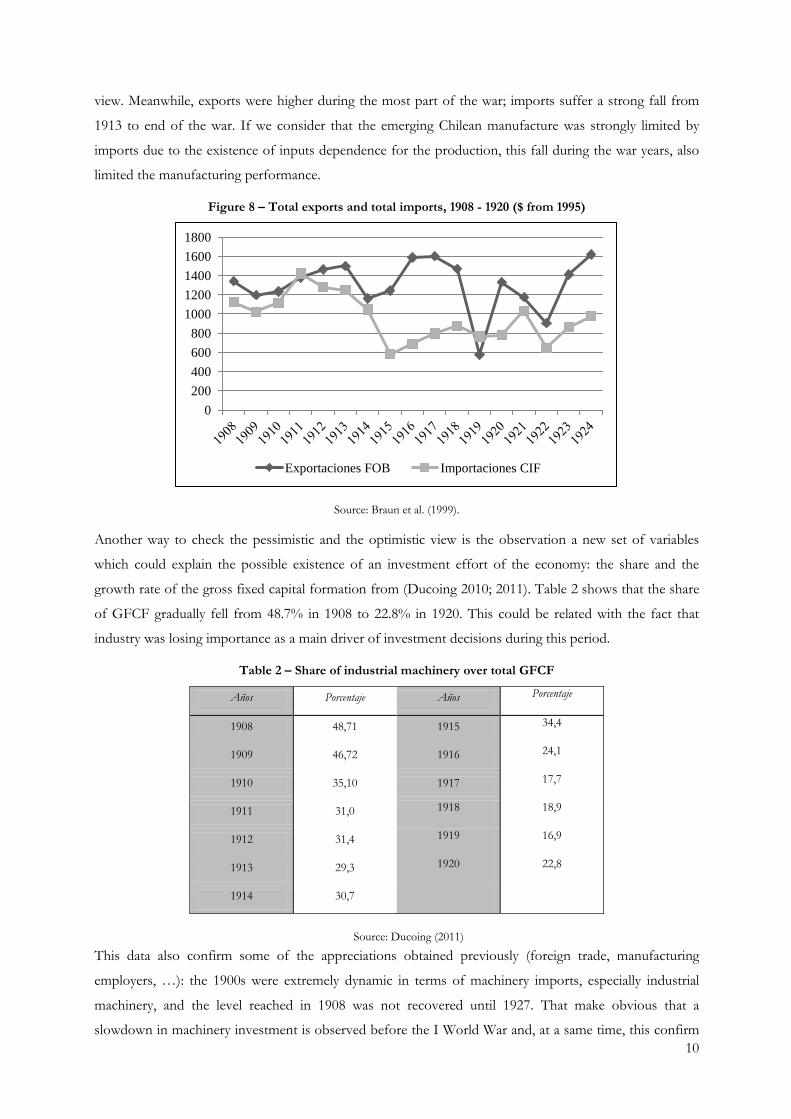
view. Meanwhile, exports were higher during the most part of the war; imports suffer a strong fall from
1913 to end of the war. If we consider that the emerging Chilean manufacture was strongly limited by
imports due to the existence of inputs dependence for the production, this fall during the war years, also
limited the manufacturing performance.
Figure 8 – Total exports and total imports, 1908 - 1920 ($ from 1995)
Source: Braun et al. (1999).
Another way to check the pessimistic and the optimistic view is the observation a new set of variables
which could explain the possible existence of an investment effort of the economy: the share and the
growth rate of the gross fixed capital formation from (Ducoing 2010; 2011). Table 2 shows that the share
of GFCF gradually fell from 48.7% in 1908 to 22.8% in 1920. This could be related with the fact that
industry was losing importance as a main driver of investment decisions during this period.
Table 2 – Share of industrial machinery over total GFCF
Años Porcentaje Años Porcentaje
1908 48,71 1915 34,4
1909 46,72 1916 24,1
1910 35,10 1917 17,7
1911 31,0 1918 18,9
1912 31,4 1919 16,9
1913 29,3 1920 22,8
1914 30,7
Source: Ducoing (2011)
This data also confirm some of the appreciations obtained previously (foreign trade, manufacturing
employers, …): the 1900s were extremely dynamic in terms of machinery imports, especially industrial
machinery, and the level reached in 1908 was not recovered until 1927. That make obvious that a
slowdown in machinery investment is observed before the I World War and, at a same time, this confirm
0 200 400 600 800
1000 1200 1400 1600 1800
Exportaciones FOB Importaciones CIF

11
the existence of an upper estimation of the recovery in industry at the end of the war. This result
relativizes the boom of the 1920s pointed out by (Palma 2000a) because their starting point was in 1914,
the worse year in industry, overestimating the recuperation and underestimating the existing level before
the war (see Table 3).
Table 3 – Production index and manufacturing exports, 1914 – 35
Años Manufacturing
Production
Exports Años Manufacturing
Production
Exports
1914 100 100 1925 189,1 126,1
1918 153 111 1928/29 181 167,1
1919 153,4 39,6 1932 145,5 30,6
1922 158,6 68,3 1935 208,3 48,7
Source: Palma (2000), pp. 49
Considering theses contradictory results and the existence of some problems obtaining these estimations,
the estimation of a new industrial output series to understand the industry performance is justified. Due to
the difficulties in built a new estimation directly, we consider the same methodology as the one used by
(Kirsch 1976) considering other complementary macroeconomic variables which reinforce the new
estimation and correct some of the existing problems. As we have said, we consider the gross fixed
capital formation from (Ducoing 2010), the energy consumption from (Rubio et al. 2010) and a time
trend.
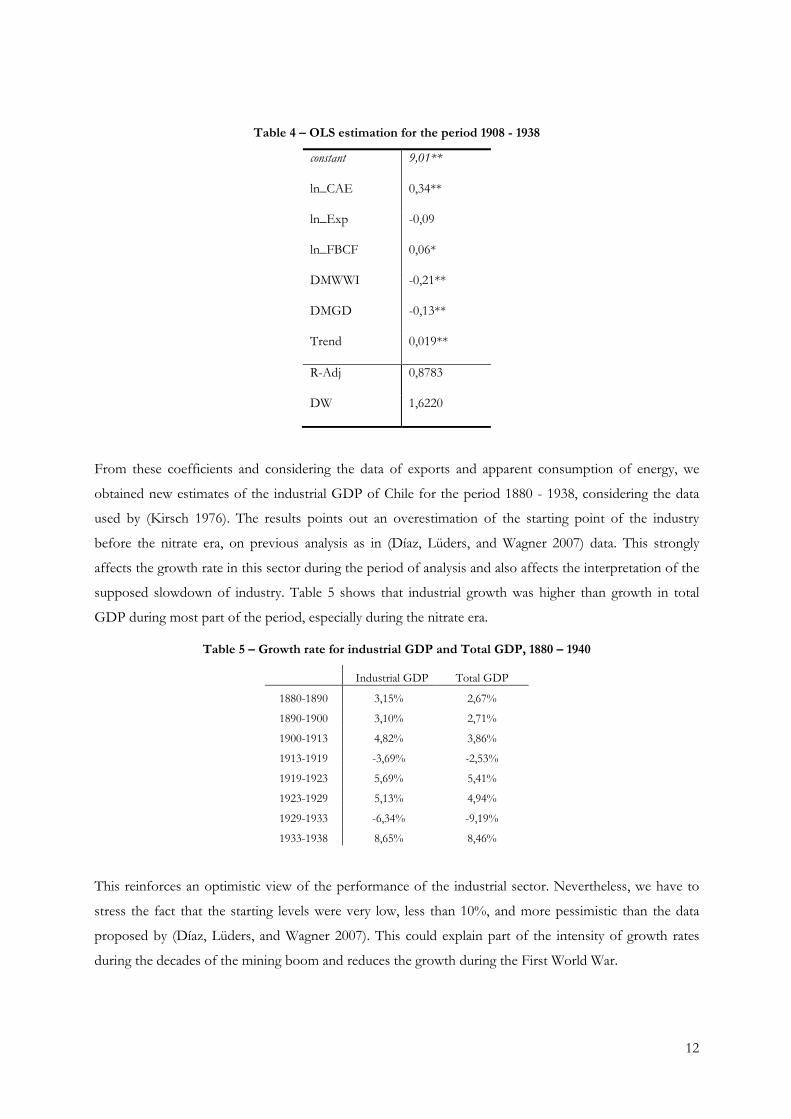
With these corrected data we repeat the regression using the methodology proposed by (Kirsch 1976). In
that case, we have chosen to consider exports (EXP) and energy (CAE) as explanatory variables. We have
also considered the gross fixed capital formation (GFCF), but have not been significant and its inclusion
did not improve the degree of explanation of the model. To capture the strong oscillations and the
external shock is the arrival of the First World War and the Great Depression (which also suffers impact
the industry's dependence on the external sector), we introduced a dummy for the years 1914 - 1919 and
another for the period 1930 to 1933. While in the first case it was found that significant, the second was
not significantly improved and also the degree of explanation. The same has happened with the trend
variable.
12
Table 4 – OLS estimation for the period 1908 - 1938
constant 9,01**
ln_CAE 0,34**
ln_Exp -0,09
ln_FBCF 0,06*
DMWWI -0,21**
DMGD -0,13**
Trend 0,019**
R-Adj 0,8783
DW 1,6220
From these coefficients and considering the data of exports and apparent consumption of energy, we
obtained new estimates of the industrial GDP of Chile for the period 1880 - 1938, considering the data
used by (Kirsch 1976). The results points out an overestimation of the starting point of the industry
before the nitrate era, on previous analysis as in (Díaz, Lüders, and Wagner 2007) data. This strongly
affects the growth rate in this sector during the period of analysis and also affects the interpretation of the
supposed slowdown of industry. Table 5 shows that industrial growth was higher than growth in total
GDP during most part of the period, especially during the nitrate era.
Table 5 – Growth rate for industrial GDP and Total GDP, 1880 – 1940
Industrial GDP Total GDP
1880-1890 3,15% 2,67%
1890-1900 3,10% 2,71%
1900-1913 4,82% 3,86%
1913-1919 -3,69% -2,53%
1919-1923 5,69% 5,41%
1923-1929 5,13% 4,94%
1929-1933 -6,34% -9,19%
1933-1938 8,65% 8,46%
This reinforces an optimistic view of the performance of the industrial sector. Nevertheless, we have to
stress the fact that the starting levels were very low, less than 10%, and more pessimistic than the data
proposed by (Díaz, Lüders, and Wagner 2007). This could explain part of the intensity of growth rates
during the decades of the mining boom and reduces the growth during the First World War.
13
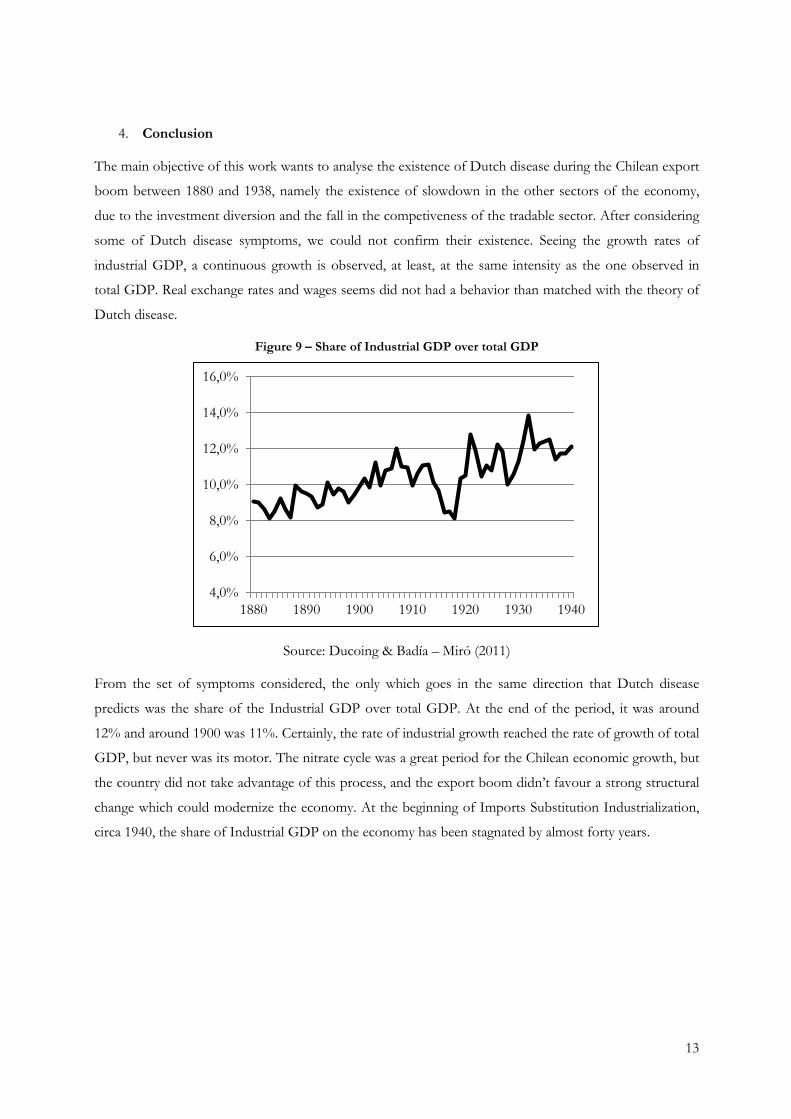
4. Conclusion
The main objective of this work wants to analyse the existence of Dutch disease during the Chilean export
boom between 1880 and 1938, namely the existence of slowdown in the other sectors of the economy,
due to the investment diversion and the fall in the competiveness of the tradable sector. After considering
some of Dutch disease symptoms, we could not confirm their existence. Seeing the growth rates of
industrial GDP, a continuous growth is observed, at least, at the same intensity as the one observed in
total GDP. Real exchange rates and wages seems did not had a behavior than matched with the theory of
Dutch disease.
Figure 9 – Share of Industrial GDP over total GDP
Source: Ducoing & Badía – Miró (2011)
From the set of symptoms considered, the only which goes in the same direction that Dutch disease
predicts was the share of the Industrial GDP over total GDP. At the end of the period, it was around
12% and around 1900 was 11%. Certainly, the rate of industrial growth reached the rate of growth of total
GDP, but never was its motor. The nitrate cycle was a great period for the Chilean economic growth, but
the country did not take advantage of this process, and the export boom didn’t favour a strong structural
change which could modernize the economy. At the beginning of Imports Substitution Industrialization,
circa 1940, the share of Industrial GDP on the economy has been stagnated by almost forty years.
4,0%
6,0%
8,0%
10,0%
12,0%
14,0%
16,0%
1880 1890 1900 1910 1920 1930 1940
14
5. References
Alvarez, Roberto, and Rodrigo Fuentes. 2006. “El ‘Síndrome Holandés’: Teoría y Revisión De La Experiencia Internacional.” Notas De Investigación Journal Economía Chilena (The Chilean Economy) 9 (3): 97–108. Ballesteros, Marto A, and Tom E Davis. 1963. “The Growth of Output and Employment in Basic Sectors of the Chilean Economy, 1908 - 1957.” Economic Development and Cultural Change 11 (2) (January): 152―176. Corden, W. Max, and J. Peter Neary. 1982. “Booming Sector and De-Industrialisation in a Small Open Economy.” The Economic Journal 92: 825–848. Corden, W.M. 1984. “Booming Sector and Dutch Disease Economics: Survey and Consolidation.” Oxford Economic Papers 36 (3): 359–380. Davis, G.A. 1995. “Learning to Love the Dutch Disease: Evidence from the Mineral Economies.” World Development 23 (10): 1765–1779. Díaz, José, Rolf Lüders, and Gert Wagner. 1998. “Economía Chilena 1810 - 1995: Evolución Cuantitativa Del Producto Total y Sectorial.” Documentos De Trabajo - PUC 186. ———. 2007. “Economía Chilena 1810-2000. Producto Total y Sectorial. Una Nueva Mirada.” Documento De Trabajo 315. Dobrynskaya, Victoria, and Edouard Turkisch. 2010. “Economic Diversification and Dutch Disease in Russia.” Post-Communist Economies 22 (3): 283–302. doi:10.1080/14631377.2010.498680. Ducoing, Cristián. 2010. “Inversión En Maquinaria y Crecimiento Económico En El Largo Plazo. Chile 1890-2005”. Master Thesis, Barcelona: Universitat de Barcelona. http://www.recercat.net/bitstream/handle/2072/168395/inversionmaquinaria.pdf?sequence=1. ———. 2011. “Capital Formation in Machinery and Industrialization. Chile 1844-1938.” Department of Economics and Business, Universitat Pompeu Fabra. - Working Papers Series. 1282. http://ideas.repec.org/p/upf/upfgen/1282.html. Ffrenc-Davis, Ricardo, Óscar Muñoz, José Miguel Benavente, and Gonzalo Crespi. 2000. “The Industrialization of Chile During Protectionism, 1940 - 82.” In An Economic History of Twentieth-Century Latin America, 3:114―153. Palgrave, New York. Giarda, Mario, and Óscar Landerretche. 2011. El “Efecto Holandés” En Chile: Heterogeneidad En Competitividad y Dinámica Macroeconómica. Working Paper. University of Chile, Department of Economics. http://ideas.repec.org/p/udc/wpaper/wp343.html. Gómez Galvarriato, Aurora, and Jeffrey G Williamson. 2008. “Was It Prices, Productivity or Policy? The Timing and Pace of Latin American Industrialization After 1870.” National Bureau of Economic Research Working Paper Series 13990. http://www.nber.org/papers/w13990. Haindl Rondanelli, Erik. 2006. Chile y Su Desarrollo Económico En El Siglo XX. Editorial Andrés Bello, Universidad Católica de Chile. Jeftanovic Petrinovic, Pedro. 1992. “El Sindrome Holandes: teoría, evidencia y aplicación al caso chileno, 1901-1940.” Estudios Públicos 45: 299–331. Kirsch, H. W. 1976. The Industrialization of Chile, 1880-1930. University Microfilms. http://books.google.es/books?id=ivkNYgEACAAJ. Maddison, Angus. 2006. Economic Progress and Policy in Developing Countries. Taylor & Francis. Matus González, Mario. 2009. “Precios y Salarios Reales En Chile Durante El Ciclo Salitrero, 1880-1930”. Info:eu-repo/semantics/doctoralThesis, Barcelona. Espanya.: Universitat de Barcelona. Departament de Història i Institucions Econòmiques. http://www.tdx.cat/bitstream/handle/10803/2063/MMG_TESIS.pdf?sequence=1. Mikesell, Raymond F. 1997. “Explaining the Resource Curse, with Special Reference to Mineral-exporting Countries.” Resources Policy 23 (4): 191–199. Muñoz Gomá, Óscar. 1968. Crecimiento Industrial De Chile: 1914 - 1965. Instituto de Economía y Planificación. Ortega, Luís. 2005. Chile En Ruta Al Capitalismo: Cambio, Euforia y Depresión 1850-1880. Lom

15
Ediciones: DIBAM. Centro de Investigaciones. Palma, José Gabriel. 1979. “Growth and Structure of Chilean Manufacturing Industry from 1830 to 1935”. University of Oxford. ———. 2000a. “From an Export-led to an Import-substituting Economy: Chile 1914-39.” In An Economic History of Twentieth-Century Latin America. Latin America in the 1930s. The Role of the Periphery in World Crisis. Vol. 3. Palgrave. ———. 2000b. “Trying to ‘tax and Spend’oneself Out of the ‘Dutch Disease’: The Chilean Economy from the War of the Pacific to the Great Depression.” In An Economic History of Twentieth-century Latin America, ed. Enrique Cardenas, Jose Antonio Ocampo, and Rosemary Thorp, 1:217–264. Palgrave associated with St Antony’s College. Pereira, M., Andrés Ulloa, Raúl O’Ryan, and Carlos de Miguel. 2009. “Síndrome Holandés, Regalías Mineras y Políticas De Gobierno Para Un País Dependiente De Recursos Naturales: El Cobre En Chile.” Series CEPAL 140. Serie Medio Ambiente y Desarrollo. http://www.cepal.org/cgi-bin/getProd.asp?xml=/publicaciones/xml/0/38260/P38260.xml&xsl=/dmaah/tpl/p9f.xsl&base=/dmaah/tpl/top-bottom.xsl. Pinto, Julio, and Luís Ortega. 1991. Expansión Minera y Desarrollo Industrial: Un Caso De Crecimiento Asociado (Chile 1850 - 1914). Departamento de Historia. Universidad de Santiago de Chile. van der Ploeg, Frederick. 2011. “Natural Resources: Curse or Blessing?” Journal of Economic Literature 49 (2) (May): 366–420. doi:10.1257/jel.49.2.366. Rubio, Mar, César Yáñez, Mauricio Folchi, and Albert Carreras. 2010. “Energy as an Indicator of Modernization in Latin America, 1890–1925.” The Economic History Review 63: 769–804. doi:10.1111/j.1468-0289.2009.00463.x. Suzigan, W. 1988. “Estado e Industrialização No Brasil.” Revista De Economia Política 8 (4): 5–16. Tafunell, Xavier. 2009. “Capital Formation in Machinery in Latin America, 1890-1930.” The Journal of Economic History 69: 928–950. ———. 2011. “Un Siglo De Formación De Capital En América Latina (1856-1950). Ensayo De Cuantificación General.” In Universidad Pablo de Olavide Carmona (Sevilla). Usui, N. 1997. “Dutch Disease and Policy Adjustments to the Oil Boom: a Comparative Study of Indonesia and Mexico.” Resources Policy 23 (4): 151–162. Van Wijnbergen, S. 1984. “The ‘Dutch Disease’: A Disease After All?” The Economic Journal 94 (373): 41–55. Williamson, Jeffrey G. 2011. “Industrial Catching Up in the Poor Periphery 1870-1975.” NBER Working Paper Series 16809. http://www.nber.org/papers/w16809.