trade facilitation and the performance of …
TRANSCRIPT

1Trade Facilitation And The... Aulia Luthfianto, D.S. Priyarsono, Raul Barreto
TRADE FACILITATION AND THE PERFORMANCE OF INDONESIAN MANUFACTURING EXPORT
FASILITASI PERDAGANGAN DAN KINERJA EKSPOR MANUFAKTUR INDONESIA
Aulia Luthfianto1, D.S. Priyarsono2, Raul Barreto3
1 Inspectorate IV, Inspectorate General, Ministry of Trade-RI, Jl. M.I. Ridwan Rais No.5, Central Jakarta, Indonesia
2 Department of Economics and Management, Bogor Agricultural University, Bogor 16143, Indonesia3 School of Economics, The University of Adelaide, Adelaide SA 5005, Australia
email: [email protected]
Naskah diterima: 25/01/2016 Naskah direvisi: 22/03/2016 Disetujui diterbitkan: 23/06/2016
Abstrak
Penelitian ini menganalisa dampak dari fasilitasi perdagangan pada kinerja ekspor manufaktur Indonesia. Data spesifik dari masing-masing negara baik Indonesia dan tiga puluh mitra dagang utama dari komoditi manufaktur selama periode 2010 hingga 2014 digunakan dalam membangun indikator fasilitasi perdagangan, termasuk langkah-langkah dalam lingkungan kepabeanan dan regulasi, efisiensi pelabuhan, dan infrastruktur di sektor jasa. Hubungan antara kinerja ekspor Indonesia dan indikator tersebut kemudian di estimasi menggunakan gravity model dengan data panel. Hasil analisa menunjukan bahwa fasilitasi perdagangan dalam lingkungan kepabeanan dari Indonesia dan mitra dagang utamanya berpengaruh besar dan positif terhadap kinerja ekspor manufaktur Indonesia, sementara lingkungan regulasi di Indonesia mengurangi arus perdagangan. Kerjasama perdagangan dengan negara-negara ASEAN berdampak positif dan signifikan terhadap kinerja ekspor manufaktur Indonesia. Implikasi kebijakan yang dapat disarankan adalah dengan memprioritaskan upaya dalam lingkungan kepabeanan Indonesia dan mitra dagang, melalui peningkatan efisiensi waktu dan biaya yang diperlukan dalam melakukan perdagangan. Selain itu, meningkatkan kerjasama perdagangan dalam kawasan ASEAN akan dapat meningkatkan kinerja ekspor Indonesia.Kata kunci: Fasilitasi Perdagangan, Ekspor Manufaktur, Gravity Model.
Abstract
This paper analyzes the impact of trade facilitation on Indonesian manufacturing export performance. Some specific data of Indonesia and thirty countries as Indonesian main trading partners of manufacture commodities over the period 2010 to 2014 were used to construct trade facilitation indicators, including measures in the customs and regulatory environment, port efficiency, and service sector infrastructure. The relationship between Indonesian export performance and these indicators were estimated using a gravity model with panel data. The findings provide some evidence that trade facilitation on customs environment of Indonesia and its trading partners largely and positively affects Indonesian manufacturing export performance, while the Indonesian regulatory environment deters the trade flows. Trade partnerships with ASEAN countries positively and significantly affect Indonesian manufacturing export performance. It is suggested for policy implication to prioritise efforts and development on Indonesian customs environment and its trading partners, through time and cost efficiency to trade. Moreover, Indonesia should generate more trade within ASEAN region which could stimulate a higher export performance.
Keywords: Trade Facilitation, Manufacturing Export, Gravity Model.JEL Classification: C23, F13, F14, F41

2 Buletin Ilmiah Litbang Perdagangan, VOL.10 NO.1, JULI 2016
INTRODUCTION
The global trade has now become increasingly liberalised as countries in the world become more integrated through international trade agreements, and also due to unilateral reforms. While agreement and policy reforms may eliminate barriers to trade, not all costs in trade are diminished through the liberalised market (Hoekman & Nicita, 2010). In fact, traders still face inefficiency in time and high trade-related costs due to excessive bureaucratic regulation and poor infrastructure. The results of a World Bank survey ‘Ease of Doing Business’ in 2008 revealed that administrative barriers, known as ‘red tape’ bureaucratic procedures related to the shipment of trading goods in developing countries, are estimated to cost more than 10 percent of the export value. The study of Marquez-Ramos et al. (2011) found that institutional trade barriers significantly affect trade flows than tariff barriers. In addition, congestion problems and the bottleneck in movement of goods in ports due to poor infrastructure have significantly contributed to high transportation costs, especially in the Southeast Asian countries (Abe & Wilson, 2009).
Efficiency is a key determinant for every country in order to compete in the global economy, as it can drive export competitiveness. To improve a country’s efficiency, governments should facilitate trade by easing the flows of goods and lowering the costs. In other words, it is important to take into account the trade facilitation on the development agendas.
While there is no standard definition for trade facilitation, in a general sense, trade facilitation can be interpreted as a policy to eliminate international trade costs (besides tariff and non-tariff barriers) such as administrative delays, transaction and institutional costs, transportation costs and any other costs, which are not explicitly stated in a country’s official framework, known as ‘non-official barriers’ (Zaki, 2008).
Trade facilitation has become a global concern in the last decade, so the importance of reform and development in this area is considered to be significant with regard to increase the efficiency and competitiveness of a country. Many empirical studies have investigated the impact of trade facilitation on trade flows; however, studies in the case of a specific country are still limited. The objective of this study is to examine the impact of trade facilitation on the performance of Indonesian manufacture’s export to its main trading partners. This examination provides some insights for policy makers in terms of prioritising development and reforms in trade facilitation in Indonesia to achieve higher export performance.
Indonesia has taken various trade facilitation measures to simplify and harmonise trade-related procedures as well as to develop supporting infrastructure in line with ongoing agreements at the multilateral and regional levels, such as the Trade Facilitation Agreement organised by the World Trade Organisation (WTO) and the ASEAN Trade in Goods Agreement (ATIGA) held by the Association of Southeast Asian Nations (ASEAN).
3Trade Facilitation And The... Aulia Luthfianto, D.S. Priyarsono, Raul Barreto
By being actively involved in several economic cooperations, Indonesia’s objective is not only aimed at opening market access and reducing trade barriers for Indonesian exports, but also at engaging with the global trade system (Damuri, 2006).
To measure the efforts of trade facilitation reforms in line with various agreements, it requires indicators that reflect the broad conditions of
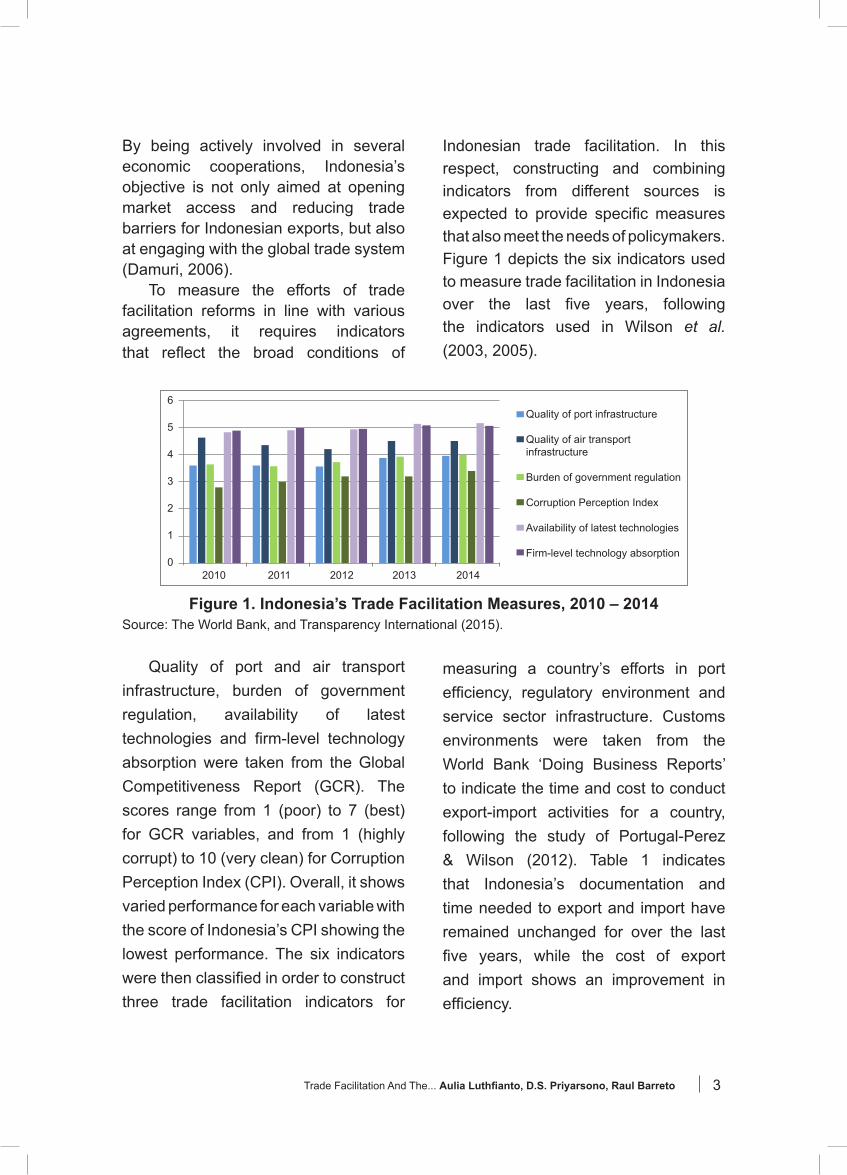
Indonesian trade facilitation. In this respect, constructing and combining indicators from different sources is expected to provide specific measures that also meet the needs of policymakers. Figure 1 depicts the six indicators used to measure trade facilitation in Indonesia over the last five years, following the indicators used in Wilson et al. (2003, 2005).
Figure 1. Indonesia’s Trade Facilitation Measures, 2010 – 2014Source: The World Bank, and Transparency International (2015).
Quality of port and air transport infrastructure, burden of government regulation, availability of latest technologies and firm-level technology absorption were taken from the Global Competitiveness Report (GCR). The scores range from 1 (poor) to 7 (best) for GCR variables, and from 1 (highly corrupt) to 10 (very clean) for Corruption Perception Index (CPI). Overall, it shows varied performance for each variable with the score of Indonesia’s CPI showing the lowest performance. The six indicators were then classified in order to construct three trade facilitation indicators for
measuring a country’s efforts in port efficiency, regulatory environment and service sector infrastructure. Customs environments were taken from the World Bank ‘Doing Business Reports’ to indicate the time and cost to conduct export-import activities for a country, following the study of Portugal-Perez & Wilson (2012). Table 1 indicates that Indonesia’s documentation and time needed to export and import have remained unchanged for over the last five years, while the cost of export and import shows an improvement in efficiency.
Quality of port infrastructure
Quality of air transportinfrastructure
Burden of government regulation
Corruption Perception Index
Availability of latest technologies
Firm-level technology absorption
2010 2011 2012 2013 2014
6
5
4
3
2
1
0

4 Buletin Ilmiah Litbang Perdagangan, VOL.10 NO.1, JULI 2016
Source: Doing Business Report (2015)
Figure 2. Trade Facilitation Indicators of Indonesia’s Major Trading Partners in 2014Source: The World Bank, and Transparency International (2015)
The documents, time and costs involved in conducting export and import with Indonesia’s 10 main trading partners are shown in Table 2. Singapore showed the top performance with less documents, time and cost required to
conduct the international trade compared to other countries. In contrast, Japan was the lowest performing among the 10 countries based on the Doing Business (DB) rank in 2015.
YearDocuments
to export(number)
Time toexport(days)
Cost to export(defiated USDper container)
Documentsto importnumber)
Time toimport(days)
Cost to import(defiated USDper container)
2010 4 17 820.7 8 27 841.1
2011 4 17 758.1 8 27 776.9
2012 4 17 701.2 8 23 718.6
2013 4 17 640.6 8 23 687.5
2014 4 17 585 8 26 660
Table 1. Indonesian Trading Across Borders, 2010 - 2014
Figure 2 shows the ten main destination countries of Indonesian manufacturing exports in 2014, the scores varied considerably among the countries. Figure 2 also demonstrates the level of CPI, the availability of the latest technologies, and firm-level technology absorption was high in most
observed countries, except China and Thailand. Overall, Singapore had the highest performance which is considered as the best practice among the observed countries. This level of trade facilitation indicators offers considerable potential correlation of export performance from Indonesia to the major markets.
9
8
7
6
5
4
3
2
1
0
Quality of port infrastructure
Quality of air transport infrastructure
Burden of government regulation
Corruption Perception Index
Availability of latest technologies
Firm-level technology absorption
United Singapore Japan Malaysia China Thailand Korea Australia Netherland GermanyStates

5Trade Facilitation And The... Aulia Luthfianto, D.S. Priyarsono, Raul Barreto
Indonesian Export PerformanceReforms and development of
trade facilitation is expected to enhance Indonesian competitiveness and generate more trade flows into and from the country. In fact, since the end of the oil boom in the mid 1980s Indonesia has modified its trade policy from import substitution industrialisation to become more export-oriented. This export-led growth strategy has been the driver of Indonesian economic movement, and as a result of trade reform and liberalisation taken in the 1980s, the
value of exports has grown until both export and import values decreased in 2009, they reached a new peak in 2011 (as evidenced in Figure 3). However, since 2012 Indonesia merchandise trade has experienced a trade deficit. This is mainly due to a trade deficit in the oil and gas sector as a consequence of the high demand for fuel subsidies. The price fall in Indonesia’s major commodities in the international markets had lowered export values and imposed regulations banning export of unprocessed minerals in early 2014 (World Bank, 2015a).
Figure 3. Indonesian Merchandise Export and Import Values (current USD), 1980 – 2014.
Source: World Bank (2015b)
USD
Mill
ions
Merchandise exports (current USD) Merchandise imports (current USD)
250,000
200,000
150,000
100,000
50,000
0
1980
1981
1982
1983
1984
1985
1986
1987
1988
1989
1990
1991
1992
1993
1994
1995
1996
1997
1998
1999
2000
2001
2002
2003
2004
2005
2006
2007
2008
2009
2010
2011
2012
2013
2014
Singapore 1 3 6 460 3 4 440Korea, Rep. 5 3 8 670 3 7 695United States 7 3 6 1190 5 5 1315Australia 10 5 9 1200 7 8 1220 Germany 14 4 9 1015 4 7 1050Malaysia 18 4 11 525 4 8 560China 19 8 21 620 5 24 615Thailand 26 5 14 595 5 13 760Netherlands 27 4 7 915 4 6 975Japan 29 3 11 915 5 11 1107
Economy DBRank
Documentsto export(number)
Time toexport(days)
Cost to export(deflated USDper container)
Documentsto import(number)
Time toimprt
(days)
Cost to import(deflated USDper container)
Table 2. Trading Across Borders of Indonesia’s Major Trading Partners in 2014
Source: Doing Business Report (2015)

6 Buletin Ilmiah Litbang Perdagangan, VOL.10 NO.1, JULI 2016
In terms of export commodities, Indonesia’s export merchandise is still dominated by fuels and mining products, followed by manufactured goods, and agricultural products with the proportion of total exports at 38.3%, 37%, and 23.3% respectively (World Trade Organization, 2014). Government regulations banning export of raw materials is aimed at increasing the value adding in Indonesian mine and mineral
commodities. By exporting the processed commodity, it is expected to stimulate higher performance of manufacturing export while the contribution of raw material export is limited. Therefore, it is esential to observe the impact of trade facilitation on manufacturing export performances, in order to prioritise reforms and development of Indonesian trade facilitation measures.
Figure 4. Share of Indonesia’s Manufacturing Exports in 2014Source: World Bank (2015b)
The percentage share of Indonesia’s manufacturing export market is dominated by developed countries such as the USA, Singapore and Japan at 13.89%, 12%, and 11.33%, respectively. While markets in ASEAN countries are also considerably high, Figure 4 shows that in 2014 Singapore, Malaysia, Thailand, Philippines and Vietnam were among the top 20 destination countries for Indonesian manufacturing exports. According to Leamer & Stern (1970), a country’s export performance is influenced by factors such as geographical destination, world export demand, product composition
and a country’s competitiveness. Unfortunately, the competitiveness of Indonesia’s merchandise export is considered low, as the share of natural resource intensive goods and unskilled labour intensive goods are still dominated in the Indonesia export commodities (Rahmaddi R & Ichihashi M, 2012). The exported natural resource as raw material goods indicates that value added in the domestic remain low, according to Giovanni & Levchenko (2012) dependency on primary commodities of country’s export could trigger volatility in the short run of GDP. Therefore, integrated efforts in enhancing
16.00%
14.00%
12.00%
10.00%
8.00%
6.00%
4.00%
2.00%
0.00%
Singap
oreJa
pan
China
Malays
ia
Thaila
nd
Austra
lia
Rep. o
f Kore
a
Philipp
ines
German
y
Netherl
ands
United
Emira
te Arab
Vietna
mInd
ia
Saudi
Arabia
United
King
dom
Hongk
ong
Belgium Braz
ilIta
lyUSA
= ASEAN countries= Non-ASEAN countries

7Trade Facilitation And The... Aulia Luthfianto, D.S. Priyarsono, Raul Barreto
the competitiveness of the processed and manufacturing commodity should be taken as an action by the government to develop Indonesian export-oriented industries in the future.
The Coase Theory of Transaction Costs
There are no specific theories which explain trade facilitation. However, trade facilitation in practice is connected with economics through cost channels in trade and also correlated with institutional development. In fact, the high transaction cost in trade and inefficiency in the process of conducting trade could be potentially reduced through reforms and development of a country’s trade facilitation. The literature on the importance of the institutional subcomponent for economic development refers to the theory of transaction costs which was formulated by Ronald Coase.
According to Coase (1992), the effects of high and costly transactions will without doubt hamper the economy. Entrepreneurs have to include transaction costs as a consideration in making decisions regarding their business and production plans. High costs in obtaining information and poorly protected property rights can make the agreements difficult to specify and implement. This may lead to high transaction costs. According to Shirley (2005), the institution is the key factor in determining whether transaction costs are high or low. Countries with interminably high transaction costs are likely to have fewer firms, less investment, less trade, less specialisation and lower
productivity. This view is also in line with Rodriguez-Pose’s study (2013) stating that local institutions are crucial for economics development.
The institutional features of a country, such as red tape bureaucracy in port and customs clearance, and lack of supporting infrastructure, reflect a negative externality on private commerce. This could increase the transaction costs in trade in a substantial level and adversely affect industrial organisations which in turn has a negative effect on economic growth and trade (Iwanow & Kirkpatrick, 2009). This notion is supported by Deardorff (2001) who argues that the process of international trade is more significantly impacted by hidden transaction costs than by technological factors and endowments.
Dimension of the Trade Facilitation Measure, and the Commodity Classification
Studies of the impact of trade facilitation in general can be divided into two groups on how trade facilitation is measured. The first measure focuses on a specific dimension, whereas the second involves all aspects of trade facilitation into the model. There are several studies which analyse trade facilitation impact by a single aspect known as ‘mono-dimensional models’ – for example Hummels (2001) investigated the effect of time on trade, and Helble, Shepherd, & Wilson (2009) studied the gain from reforms in trade policy transparency. ‘Multi-dimensional models’ were initiated by Wilson, Mann and Otsuki (2003, 2005) and they included different

8 Buletin Ilmiah Litbang Perdagangan, VOL.10 NO.1, JULI 2016
measures, such as efficiency of ports, the customs and regulatory environment and implementation of e-business, to examine its relationship with trade flows in the Asia-Pacific region. The objective of using several dimensions is to identify the area that needs to be prioritised by policy makers, rather than focusing on one specific dimension. Moreover, the selected measures are in accordance with GATT articles V, VI, VIII and X which underlie the trade facilitation agreement of WTO.
Both mono and multidimensional study can use aggregate or disaggregate data in the analysis to examine the impact of trade facilitation on the whole sector or in a specific sector of trade. For example, in examining the impact of trade facilitation by using a specific sector of trade, Martinez-Zarzoso and Marquez-Ramos (2008) used disaggregated trade data of the 4-digit level of the Standard International Trade Classification (SITC). The study used a narrow definition of trade facilitation by only including border related elements into the model. On the other hand, Wilson et al. (2003, 2005) used aggregate data through the analysis of one digit level of data in the manufacturing sector. This includes commodities in categories 5 to 8 except category 68 in the two digit level of the SITC. Besides using aggregate data, Shepherd & Wilson (2009) also used a different classification of commodity – the 1 digit product classification of the Broad Economic Categories (BEC).
An alternative commodity classification used internationally is the harmonized system (HS). These different classifications of commodity
are aimed to capture different features and criteria as there are different statistical and analytical needs. In terms of economic analysis, data taken from the SITC are more suitable due to their coverage which includes the production stage and its related factors. In contrast, the HS classification is based on the commodities’ nature, while the BEC classification comprises three primary classes: capital goods, intermediate goods and final goods (Lal, 2012). Since the coverage includes the production stage, the use of the SITC commodity classification is for studying the impact of trade facilitation on Indonesia’s export of manufactured goods.
Empirical Studies of Trade FacilitationTo date, studies on the impact of
trade facilitation on the economy have focused on international trade flows, and also investigated how reforms in trade facilitation can affect trade flows. In addition to the analysis of the global effects of a wide range of countries’ relationships, it is also possible to study the effects in both regionally and in a specific country which are still under research.
A study at the regional level was conducted by Shepherd & Wilson (2009) who analysed the advancement and indicators of trade facilitation in the ASEAN region using the gravity model of these following indicators: the quality of sea and air ports, irregular payments and the level of rivalry in Internet Service Providers (ISPs). They found that regional trade is sensitive to the quality of transport infrastructure and ISP. This is also supported by the counterfactual

9Trade Facilitation And The... Aulia Luthfianto, D.S. Priyarsono, Raul Barreto
simulation which showed that the benefits from trade facilitation reforms are greater than the benefits from reduction in tariffs. Following the approach taken by Wilson et al. (2005), the simulation was constructed using five different reform scenarios in order to provide a priority list of recommendations. A recent study by Felipe & Kumar (2012) analysed the relationship between trade facilitation and bilateral trade flows of the Central Asian countries using the gravity model. They found that infrastructure had the most significant contribution to higher trade flows followed by logistic costs and customs environment e.g. efficiency in time and costs of customs.
Another study conducted by Pomfret & Sourdin (2009) analysed trade facilitation using a different approach. It focused directly on trade cost issues by using data from the Cost Insurance Freight (CIF) and Free On Board (FOB) on Australian imports which indicates the international shipping costs between trading countries. By examining ASEAN country exports to Australia, the authors reported that trade costs had reduced significantly during the 1990s and 2000s from 10% of the average ad valorem costs in 1990 to less than 4% in 2007. This is related to the formation of the ASEAN Free Trade Agreement (AFTA) in the region that takes into account the liberalisation of trade by reducing tariffs and improving the trade facilitation environment. However, such an approach only captures the international transport costs and does not explain the broader range of trade costs which have
become the underlying focus of trade facilitation.
Dennis & Shepherd (2011) studied the effect of trade facilitation on export diversification in 118 developing countries taking into account the export costs and the market entry costs. The result shows that lowering export costs and market entry costs by 10% can stimulate export diversivication by 3 to 4%. There are very few studies of trade facilitation in Indonesia. Damuri (2006) examined the efforts of Indonesian trade facilitation in relation to negotiations in the WTO. This study was done by matching the measures taken by the government with a reference to GATT articles through a survey involving the private sector. The author found that simplification and automation of documentation required in trade procedures are the most important measures to take in order to improve trade facilitation. In addition, illegal charges must be solved before they hamper competitiveness. A recent study by Tambunan (2013) focused on accessibility and usefulness of trade facilitation for export-oriented in small and medium-sized enterprises (SMEs). The author concluded that there were some main factors of low export performance especially for SMEs located in rural areas, such as a lack of information about export markets, available trade facilitation and financial support to increase production capacity. This result is in line with an earlier study of Tambunan (2007, 2011) which found that limited working capital and lack of promotion were the main constraints for Indonesian SMEs to export.

10 Buletin Ilmiah Litbang Perdagangan, VOL.10 NO.1, JULI 2016
METHODOLOGIES
The main focus of this study is to measure the impact of trade facilitation in Indonesia as an exporter country and in relation to the conditions of trade facilitation in 30 main importing countries. This study uses the data from 2010 to 2014 due to the limitation of data availability.
In order to undertake quantitative analysis of trade facilitation measures and indicators of efforts, the data are divided into four distinct categories following Wilson et al. (2005, 2012): (i) port efficiency to measure the quality of port and air transport infrastructure, (ii) customs environment to measure the efficiency in time and costs of customs, (iii) regulatory environment to measure regulation development and government transparency and (iv) service sector infrastructure to measure the presence of
domestic infrastructure and technology in supporting economic activity.
Each of the trade facilitation indicators was constructed using two relevant surveys for constructing inputs and then it was averaged to obtain the value of each trade facilitation indicator. Because those surveys data are using a different ranges of response, recalculating the inputs index with benchmarking to the country with the highest performance as best practice will allowed those index into a comparable basis. The index ranges from 0 to 1 with the maximum value 1 referring to best-practice country, this indicated the level of performance of other countries. Table 3 depicts summary statistics of constructing indicators and aggregate indicators of trade facilitation, as well as importer country with the highest score compared to the lowest score.
Table 3. Summary of Statistics for Values of Trade Facilitation IndicatorsIndeces/variables Source Mean Std. Dev. Min Min. Importer Max Max. ImporterPort Efficiency 0.749 0.145 0.450 Brazil 0.993 SingaporeQuality of port infrastructure GCR 0.730 0.149 0.393 Brazil 1 NetherlandQuality of air transport infrastructure GCR 0.768 0.147 0.447 Bangladesh 1 Singapore
Customs Environment 0.432 0.181 0.175 Russia 1 SingaporeNumber of days to import DB 0.407 0.221 0.118 Bangladesh 1 SingaporeCost to import DB 0.456 0.207 0.151 Russia 1 Singapore
Regulatory Environment 0.659 0.162 0.433 Bangladesh 1 SingaporeBurden of government regulation GCR 0.669 0.157 0.366 Brazil 1 SingaporeCorruption Perception Index CPI 0.649 0.234 0.298 Bangladesh 1 Singapore
Service Sector Infrastructure 0.835 0.120 0.607 Egypt 0.999 United StatesAvailability of latest technologies GCR 0.826 0.128 0.582 Egypt 1 United StatesFirm-level technology absorption GCR 0.842 0.110 0.632 Egypt 1 Japan
Sources: Global Competitiveness Report (2015), Doing Business Report (2015), Transparency International (2015), processed.

11Trade Facilitation And The... Aulia Luthfianto, D.S. Priyarsono, Raul Barreto
Gravity models have been used extensively as an approach to analyse bilateral trade flows. The classical conception of the gravity model was originally reported by Tinbergen (1962) and Pöyhönen (1963), who were inspired by Newton’s law of universal gravitation, to explain the bilateral trade flow between trading partners. According to Leamer & Levinsohn (1995), modeling trade between two countries should include several variables, such as GDP and GDP per capita, as a proxy for a country’s economic ‘mass’ to indicate market size. The economic distance between countries is also included to capture the effect of transportation costs. Other variables can also be added into the model in order to weigh the barriers in trade, for example trade policy factors, a common language and the historical and geographical connections between countries. Such a basic formulation has evolved as the objective of hypothesis testing. In this regard, tariff and trade facilitation indicators, as well as additional factors can be added into the model.
The general form of the gravity equation, as used in the study of Anderson & Wincoop (2003), can be written as follows:
Where is the variable of export value from exporter country i to importer country j, while the notation and are the GDP of country i and j divided by Y which denotes world GDP. The terms of trade costs are included with the notation of , while denote the ease
of market access and/or multilateral resistance, while σ > 1 is the elasticity substitution of all goods.
In this study, the basic model was estimated by first transforming all variables into natural logarithms form so the estimate parameters
indicate the magnitude of elasticity of manufacturing export to each independent variable. The model presented is as follows:ln(EXPjt) = a0+b1ln(100+TARIFFjt)-ln (100) +b2ln(EXCRjt)+b3lnPEjt +b4lnREjt
+b5lnCEjt+b6lnSIjt+b7lnPEt
+b8lnREt+ b9lnCEt+b10lnSIt
+b11ln(GDPjt)+b12ln(POPjt) +b13ln(Distt)+b14ASEAN +b15EU+eijt
Where j stands for the 30 main importing countries of Indonesia, respectively and t denotes trading years (t = 2010 to 2014). Parameters
are the coefficients of variables, while is the error term. The term
represents export value of the manufacturing commodity from Indonesia to the importing country j in year t, measured at real USD at the 2005 year base. denotes the weighted applied tariff rate in ad valorem terms from country j to Indonesian exports in year t, while represents the real exchange rate of Indonesia to country j currency in year t.
Trade facilitation measures are in the terms of which denote the importing country j’s indicators, while denote Indonesia as the exporting

12 Buletin Ilmiah Litbang Perdagangan, VOL.10 NO.1, JULI 2016
country indicators of port efficiency, both the regulatory and customs environments and service sector infrastructure, respectively. For customs environment indicators, the difference between exporter and importer are in the constructing indicators, whereas the cost and time needed to import are used in the importing country j in year t. Also, cost and time needed to export are used in Indonesia as the exporting country in year t.
The term denotes Gross Domestic Product, while denotes total population of the importing country j in year t. These variables are used as a proxy for importer market size in manufacturing commodities. Another variable is the geographical distance or bilateral distance, in this study the distance between capital cities of Indonesia to country j’s is used and denoted as as taken from the Centre d’Etudes Prospectives et d’Informations Internationales (CEPII). The binary variables of the ASEAN and European Union (EU) preferential trade agreements are used to capture the effect of trade partnership between Indonesia and two major of regional partners.
The incorporation of trade facilitation indicators into the standard gravity model has been used in various studies. Wilson et al. (2003) analysed the empirical relationship between trade facilitation indicators and international trade flows among the APEC member countries in the period 1989 to 2000 by focusing
on four aggregate trade facilitation indicators in the importing country only, it was then regressed with other economic variables and distance. They found that port efficiency had the largest and positive impact on intra-APEC trade flows, while the other variables also positively contributed to trade flows but in smaller coefficient, except for the regulatory environment which was found to have a negative impact. This study was then extended by the authors in 2005 by adding trade facilitation variables of exporting countries, but excluding the customs environment variable. The results indicated that all trade facilitation indicators had a positive impact with higher trade flows. The difference in the resulting sign of regulatory environment variable is due to the differences of the approaches in constructing the trade facilitation measures that is used.
As this study aims to measure the impact of trade facilitation efforts in Indonesia as an exporter country, as well as the conditions in the 30 main importer countries on Indonesia’s export performance. It is important that the subject of analysis has a large share of Indonesian merchandise export. For this reason, this study uses manufacturing commodity, the second largest share of Indonesian merchandise exports after the fuel and mining commodity, which is also prioritised by the government to improve performance.
The data was collected from secondary sources during 2010 to 2014 covering the 30 main importing

13Trade Facilitation And The... Aulia Luthfianto, D.S. Priyarsono, Raul Barreto
countries of Indonesia’s manufacturing commodities. This study uses bilateral trade flow data of Indonesian exports taken from the United Nations statistics division of Commodity and Trade Data base (UNCOMTRADE). The defined categories of manufactured goods are from the Standard International Trade Classification (SITC Revision 4) with categories 5 to 8 at the one-digit level except category 68 (non-ferrous metal) at the two-digit level. The export value is then adjusted to real terms by using Indonesian data of the Producer Price Index (PPI) with the 2005 value as a base year taken from the Bank Indonesia data source.
Tariff data used in this study was taken from Trade Analysis and Information System (TRAINS) of the United Nations Conference on Trade and Development (UNCTAD). Import tariffs from the four commodity categories of manufacturing were used, specifically with the weighted average tariff rates in the periods 2010 to 2014 as applied by these 30 main importing countries. Data on Gross Domestic Product (GDP) were in constant 2005 US dollars, while data of total population were also for the period 2010 to 2014, and taken from the World Development Indicators (WDI) generated by the World Bank.
Another key variable used in this study is the exchange rate, with the nominal data taken from the United Nations Conference on Trade and Development statistic (UNCTADstat). The annual data of Indonesian Rupiahs
against importing countries currencies were also collected for the years 2010 to 2014. Afterwards it was deflated using Indonesia’s consumer price index and each importing country’s consumer price index with the 2005 value as the base year in order to obtain the real terms of exchange rates. This real term of all observed variables was used to address the inflation effect which may create bias in the interpretation of results.
RESULTS AND DISCUSSION
Estimated results of the gravity model are shown in Table 4. The model was run by using ordinary least square (OLS) and by employing the fixed effect (FEM), also random effect model (REM) with panel data regression to compare the differences. A statistical test was carried out using the Hausman test, followed by the Breusch and Pagan Lagrangian-multiplier (LM) and the Pasaran cross-sectional dependence test in order to select the best model to analyse the impact of trade facilitation on Indonesian export performances with its main trading partners.
According to Baltagi (2008), a difference estimation result between fixed effect and random effect models is yielded if the observed time (t) is relatively small while the observed individual (n) is large. A specification test using the Hausman test indicates the random effect model is appropriate to explain the outcome.

14 Buletin Ilmiah Litbang Perdagangan, VOL.10 NO.1, JULI 2016
Table 4. Regression Result ‒ OLS, FEM, and REMVariables OLS Std. Err. FEM Std. Err. REM Std. Err.
Constant 9.573 *** 1.168 -26.423 18.080 8.011 *** 2.534
lnTARIFF 0.360 1.709 0.382 1.345 0.792 1.267
lnEXCR -0.023 0.020 -0.232 * 0.129 -0.055 0.045
lnPE -0.149 0.363 -0.031 0.450 0.004 0.406
lnCE 0.691 *** 0.146 0.269 0.252 0.544 *** 0.191
lnRE 0.116 0.365 -0.040 0.248 0.110 0.235
lnSI 1.469 *** 0.479 0.375 0.396 0.376 0.360
lnPEIndo 0.082 1.448 0.414 0.463 0.124 0.444
lnCEIndo 1.479 1.746 0.984 * 0.546 1.131 ** 0.536
InREIndo -3.287 2.696 -2.619 ** 0.855 -2.980 *** 0.838
lnSIIndo 0.505 3.511 -0.017 1.105 0.534 1.059
lnGDP 0.561 *** 0.070 1.066 *** 0.378 0.747 *** 0.115
lnPOP -0.003 0.068 1.063 1.116 -0.151 0.113
lnDIST -0.473 *** 0.104 0 (omitted) -0.580 *** 0.226
DummyASEAN 1.024 *** 0.157 0 (omitted) 1.027 *** 0.381
DummyEU -0.275 *** 0.105 0 (omitted) -0.283 0.259Number of obs. Adjusted R-squaredR-squared – WithinR-squared – BetweenR-squared – Overall
150
0.4150.0330.033
150
0.3770.8460.837
Prob>chi2 0.000 0.000 0.000
Note: The significance levels denoted by *, ** and *** indicate for P < 0.1, P < 0.05, and P < 0.01 respectively.
Source: Author’s calculations
The Breusch and Pagan Lagrangian-multiplier (LM) test was conducted to examine whether the pooled regression model is more appropriate
than the random effect model, Table 5 indicates that the random effect model is more appropriate to explain the regression.
Table 5. Specification Rest of The Best Model
Specification testHausman test LM test Pesaran CD test
Statistic Prob. Statistic Prob. Statistic Prob.Chi-square 10.01 0.6153Chi-square 239.25 0.0000
Cross sectional independece -0.128 1.1020
1500.837
Source: Author's calculations
15Trade Facilitation And The... Aulia Luthfianto, D.S. Priyarsono, Raul Barreto
According to Hoechle (2007) if cross-sectional dependence exists, it can lead to bias in the results. The Pesaran cross-sectional dependence (CD) test is used to test the serial correlation. The test result (Table 5) shows that there is no serial correlation in the model.
Estimation results from three different regession methods are reported in Table 4. Overall, the preferred model, which is the random effect model, indicates good performance. Its probability value shows that model significance is in a 5 percent alpha (0.000 < 0.05), while the R-squared statistic accounts for around 83% of observed variation between dependent and independent variables within the selected sample.
The estimated results of the gravity model regression presented in Table 4 indicate different levels of significance for the three types of estimations performed. The GDP variables for importers were found to be consistent across the three estimations with all being positive and significant at 1 percent in OLS, FEM and REM. Such a result explains that the growing size of a market’s economy would generate higher Indonesian manufacturing export performance. The distance variable was found to be significant and had the expected negative signs in both OLS and REM. This means that distance adversely affects bilateral trade. Tariff and exchange rate variables were not statistically significant in the three regression estimations, except that exchange rate was negative and significant at 10 percent in the FEM. The constructed trade facilitation indicators also display considerable variation, but not all indicators were found to be
statistically significant. Specifically, the port efficiency variable was not significant in all three models of estimation, whereas the customs environment, regulatory environment and service sector infrastructure indicated a different level of significance for the three estimations performed.
As a result of the specification test, this study focuses on results from the REM as it is the best model to explain the data variation. The REM estimates that customs environment (CE) in both exporter and importer countries was positive and significantly associated with the Indonesian manufacturing export performance. It was significant at the standard 1% for the CE of the importer country and at 5% for Indonesia as the exporter country. Estimated coefficient magnitudes of the Indonesian customs environment were greater than the coefficient of importing countries by 1.13, while the importer CE coefficient was 0.54. This high and significant coefficients suggest that the customs environment plays an important role in Indonesian manufacturing export performance. However, the Indonesian regulatory environment has a negative and significant effect on manufacturing export performance with a relatively high coefficient of -2.98. This indicates an inverse effect in the tightening of corruption and transparency through government regulation. On the other hand, only the ASEAN binary variable was found to be statistically significant under both OLS and RE estimation, while the EU dummy variable was statistically insignificant.

16 Buletin Ilmiah Litbang Perdagangan, VOL.10 NO.1, JULI 2016
Regarding statistically insignificant variables in this study, namely port efficiency and service sector infrastructure in both exporter and importer countries and the regulatory environment in importer countries, it can be concluded that there is not enough evidence that these trade facilitation indicators influence Indonesian manufacturing export performance with its main trading partners. Therefore, further study is recommended to use a different approach of trade facilitation measures and to conduct more observations in the analysis for gaining a better understanding in the impact of such variables on manufacturing export performance.
Based on the estimation results in Table 4, and the description above, two trade facilitation indicators which significantly affect the Indonesian manufacturing export performance are the customs and regulatory environments. The coefficient variable of the customs environment in the importer countries showed a positive association of 0.54. This suggests that each one percent of an improvement in the degree of importer customs environment which is closer to the best practice country’s conditions will lead to an increase in Indonesian manufacturing export performance amounted to 0.54 percent, ceteris paribus. The improvement would be gained through reduction in time and costs to import goods in the importer country.
The impact of Indonesia’s trade facilitation on export performance would affect two channels. Firstly, improving the Indonesian customs environment
will positively effect manufacturing export performance. With a coefficient of variable of 1.13, this mean for each one percent of improvement in the degree of Indonesian customs environment closer to the best practice country’s conditions will lead to an increase in the Indonesian manufacturing export performance of 1.13 percent, ceteris paribus. The increased performance would be achieved by improving efforts to ease flows of export through customs which could reduce time and costs needed for traders to export from Indonesia.
Secondly, the coefficient variable of the Indonesian regulatory environment was -2.98, meaning that each one percent of an improvement in the degree of the Indonesian regulatory environment closer to the best practice country’s conditions will lead to a decrease in the Indonesian manufacturing export performance of 2.98 percent, ceteris paribus. In other words, tightening regulation will lead to greater corruption in the public sector and negatively affect the Indonesian export performance. This result is in line with the findings of Wilson et al. (2003) showing that high and strict government regulations can reverse the positive effects of other measures. Further studies should be undertaken in this area using a different approach to construct regulatory environment measures in order to find out the association that exists.
CONCLUSION AND POLICY RECOMMENDATIONS
Trade facilitation has become a global concern in the last two decades as reforms and developments in this

17Trade Facilitation And The... Aulia Luthfianto, D.S. Priyarsono, Raul Barreto
area are considered to have a positive impact on greater trade flows. Indonesia has suffered a trade deficit since 2012 with a government policy on banning raw material exports which contributes to lower merchandise export performance. Manufacturing commodities constitute the second largest share of Indonesian merchandise exports, with the improved trade facilitation it is expected to generate the competitiveness of Indonesian processed minerals commodity which can lead to higher export performance. Hence, this study examined a series of regressions using gravity models with panel data to identify indicators that statistically and significantly affect exports in the period 2010 to 2014. The gravity model was applied to measure the impact of trade facilitation in Indonesia and its 30 main trading partners on the Indonesian manufacturing export performance.
Based on the analysis conducted, the customs environment in both Indonesia and its trading partners has a positive and significant impact on Indonesian manufacturing export performance. The constructing indicators of trade facilitation measures in this area are the time and cost in undertaking export for the exporter country, while the time and cost of import was observed as the importer country’s indicators. Prioritising efforts to make the customs environment more efficient in time and costs will likely enhance the Indonesian manufacturing export performance. This provides an insight for the government to focus for reforms and development of trade facilitation measures.
The results of this study also indicate that Indonesia’s regulatory environment is not optimal in facilitating trade and has an adverse impact on manufacturing export performance, where through the simplification of regulations and less corrupt behaviour in public sector is negatively associated with the export performance. A related aspect which needs to be considered by the policy makers is the openness of information and public transparency. Incomplete information of evolving regulations could hamper trade and create lag time for traders to adjust. However, further study is required to use different approaches to better understand such impact.
It is also suggested to use a different approach to study the impact of port efficiency and service sector of infrastructure on export performance, as these were not statistically significant in this study. On the other hand, the estimated results indicate that improving trade partnerships in the ASEAN region will be beneficial to increase the Indonesia’s export performance. The upcoming regional agenda is to fully implement the ASEAN Economic Community by the end of 2015. It is expected to stimulate greater trade flows among the members, and Indonesia especially.
Although new insights into the impact of trade facilitation on export performance has been provided in this study, Indonesia should improve and develop all of trade facilitation measures in order to better engage with the global trade system and cope with evolving agreement and programs at both the
18 Buletin Ilmiah Litbang Perdagangan, VOL.10 NO.1, JULI 2016
multilateral and regional levels. In conclusion, reforms and development in trade facilitation not only provide benefits for traders, but also for the economy and the society through more efficient and timely trade.
ACKNOWLEDGEMENT
The authors thank the Ministry of Trade Republic of Indonesia and Australia Awards Scholarship for the support and sponsorship on dual degree program between Bogor Agricultural University and the University of Adelaide.
REFERENCES
Abe, K., & Wilson, J. S. (2009). Weathering the storm: investing in port infrastructure to lower trade costs in East Asia. The World Bank, Policy Research Working Paper Series: 4911.
Anderson, J. E., & Wincoop, E. v. (2003). Gravity with Gravitas: A Solution to the Border Puzzle. The American Economic Review, 93(1), 170-192. doi: 10.2307/3132167
ASEAN. (2015). ASEAN Trade in Goods Agreement. from http://www.asean.org/images/2013/economic/afta/atiga%20interactive%20rev4.pdf
Baltagi, B. (2008). Econometr ic analysis of panel data (Vol. 1): John Wiley & Sons.
Bank Indonesia. (2015). Producer Price Index. http://www.bi.go.id/sdds/series/ppi/index_ppi.asp
CEPII. (2015). Geographical Distance dataset. http://www.cepii.fr/cepii/en/bdd_modele/bdd.asp
Coase, R. H. (1992). The Institutional Structure of Production. The American Economic Review, 82(4), 713-719. doi: 10.2307/2117340
Damuri, Y. R. (2006). An evaluation of the need for selected trade facilitation measures in Indonesia: Implications for the WTO negotiations on trade facilitation. Asia-Pacific Research and Training Network on Trade Working Paper Series(10).
Deardorff, A. (2001). Local comparative advantage; trade costs and the pattern of trade, processed. University of Michigan.
Dennis, A., & Shepherd, B. (2011). Trade Facilitation and Export Diversification. World Economy, 34(1), 101-122. doi:10.1111/j.1467-9701.2010.01303.x
Di Giovanni, J., & Levchenko, A. A. (2012). Country size, international trade, and aggregate fluctuations in granular economies. Journal of Political Economy, 120(6), 1083-1132.
Felipe, J., & Kumar, U. (2012). The Role of Trade Facilitation in Central Asia. Eastern European Economics, 50(4), 5-20.
Helble, M., Shepherd, B., & Wilson, J. S. (2009). Transparency and Regional Integration in the Asia Pacific. World Economy, 32(3), 479-508. doi: 10.1111/j.1467-9701.2009.01170.x
Hoechle, D. (2007). Robust standard errors for panel regressions with cross-sectional dependence. Stata Journal, 7(3), 281.
19Trade Facilitation And The... Aulia Luthfianto, D.S. Priyarsono, Raul Barreto
Hoekman, B., & Nicita, A. (2010). Assessing the Doha Round: Market Access, Transactions Costs and Aid for Trade Facilitation. Journal of International Trade and Economic Development, 19(1), 65-79. doi: http://www.tandfonline.com/loi/rjte20
Hummels, D. (2001). Time as a trade barrier‘, Mimeo, Purdue University, July.
Iwanow, T., & Kirkpatrick, C. (2009). Trade Facilitation and Manufactured Exports: Is Africa Different? World Development, 37(6), 1039-1050. doi: http://www.sciencedirect.com/science/journal/0305750X
Lal, N. (2012). Commodity Classifications. Regional Workshop on International Merchandise Trade Statistic, New Caledoina: Secretariat of the Pacific Community.
Leamer, E. E., & Levinsohn, J. (1995). International Trade Theory: The Evidence, Chapter 20 of G. Grossman and K. Rogoff (eds), Handbook of International Economics vol. III: Amsterdam: Elsevier.
Leamer, E. E., & Stern, R. M. (1970). Quantitative International Economics. London: Aldine Transaction.
Martinez-Zarzoso, I., & Marquez-Ramos, L. (2008). The Effect of Trade Facilitation on Sectoral Trade. B.E. Journal of Economic Analysis and Policy: Topics in Economic Analysis and Policy, 8(1). doi: http://www.bepress.com/bejeap/topics/
Márquez-Ramos, L., Martínez-Zarzoso, I., and Suarez-Burguet. (2011). Trade
Policy versus Trade Facilitation: An Application Using Good Old OLS. Economics-The Open-Access, Open Assesment E-Journal 38 : 1-33.
Pomfret, R., & Sourdin, P. (2009). Have Asian trade agreements reduced trade costs? Journal of Asian Economics, 20(3), 255-268. doi: http://dx.doi.org/10.1016/j.asieco.2009.02.007
Portugal-Perez, A., & Wilson, J. S. (2012). Export Performance and Trade Facilitation Reform: Hard and Soft Infrastructure. World Development, 40(7), 1295-1307. doi: http://dx.doi.org/10.1016/j.worlddev.2011.12.002
Pöyhönen, P. (1963). A Tentative Model for the Volume of Trade between Countries. Weltwirtschaftliches Archiv, 90, 93-100. doi: 10.2307/40436776
Rahmaddi, R., & Ichihashi, M. (2012). How do Export Structure and Competitiveness EvolveSince Trade Liberalization? An Overview and Assessment of Indonesian Manufacturing Export Performance. International Journal of Trade, Economics and Finance, 3(4), 272.
Rodríguez-Pose, A. (2013). Do institutions matter for regional development?. Regional Studies, 47(7), 1034-1047.
Shepherd, B., & Wilson, J. S. (2009). Trade facilitation in ASEAN member countries: Measuring progress and assessing priorities. Journal of Asian Economics, 20(4), 367-383. doi: http://dx.doi.org/10.1016/j.asieco.2009.03.001
Shirley, M. (2005). Institutions and Development. In C. Menard & M. Shirley

20 Buletin Ilmiah Litbang Perdagangan, VOL.10 NO.1, JULI 2016
(Eds.), Handbook of New Institutional Economics (pp. 611-638): Springer US.
Tambunan, T. (2007). Entrepreneurship development: SMES in Indonesia. Journal of Developmental Entrepreneurship, 12(01), 95-118.
Tahi Hamonangan Tambunan, T. (2011). Development of small and medium enterprises in a developing country: The Indonesian case. Journal of Enterprising Communities: People and Places in the Global Economy, 5(1), 68-82.
Tambunan, T. T. (2013). Ongoing trade facilitation improvement: Its impact on export-oriented small and medium-sized enterprises in Indonesia: ARTNeT Working Paper Series.
Tinbergen, J., & Economics, E. S. O. (1962). Shaping the World Economy; Suggestions for an International Economic Policy: Twentieth Century Fund, New York.
Transparency International. (2015). Corruption Perceptions Index. http://www.transparency.org/research/cpi/overview
UNCOMTRADE. (2015). International trade statistic database. http://comtrade.un.org.proxy.library.adelaide.edu.au/data/
UNCTADstat. (2015). United Nations Confrence on Trade and Development Data Center. http://unctadstat.unctad.org/EN/Index.html
Wilson, J. S., Mann, C. L., & Otsuki, T. (2003). Trade Facilitation and Economic
Development: A New Approach to Quantifying the Impact. World Bank Economic Review, 17(3), 367-389. doi: http://wber.oxfordjournals.org/content/by/year
Wilson, J. S., Mann, C. L., & Otsuki, T. (2005). Assessing the Benefits of Trade Facilitation: A Global Perspective. World Economy, 28(6), 841-871. doi: 10.1111/j.1467-9701.2005.00709.x
World Bank. (2015a). Indonesia Economic Quartely Retrieved July 2015 http://www.worldbank.org/content/dam/Worldbank/document/EAP/Indonesia/IEQ-JUL-2015-english.pdf
World Bank. (2015b). World Development Indicators. Retrieved 20 August 2015, from viewed 20 August 2015 http://data.worldbank.org/data-catalog/world-development-indicators
World Bank. (2015c). Doing Business Report 2015. Washington DC.
World Economic Forum. (2015). Global Competitiveness Report 2015. Geneva.
World Trade Organization. (2014). Trade Profiles 2014. Switzerland: The World Trade Organization.
World Trade Organization. (2015). Trade Facilitation Agreement. from https://www.wto.org/english/tratop_e/tradfa_e/tradfa_e.htm
Zaki, C. (2008). Does Trade Facilitation Matter in Bilateral Trade ? Documents de travail du Centre d’Economie de la Sorbonne 2008.100 - ISSN : 1955-611X. Retrieved from https://halshs.archives-ouvertes.fr/halshs-00348924