trade, foreign direct investment and growth: evidence from
TRANSCRIPT

Trade, Foreign Direct Investment and Growth: Evidence from Transition Economies*
Hiranya K Nath†
June 2005 Abstract: Using fixed effects panel data approach, this paper empirically examines the effects of trade and foreign direct investment (FDI) on growth in 13 transition economies of Central and Eastern Europe, and the Baltic region (CEEB). Our analysis suggests that significant positive effect of trade on growth is a robust result for transition economies of this region. In addition, domestic investment appears to be an important determinant of growth. However, in the presence of trade in the growth equation, FDI does not seem to have any significant effect on growth. The estimation of the growth equation without trade renders FDI highly significant suggesting collinearity between trade and FDI. Furthermore, interaction between trade and FDI seems to be important for growth in transition economies. Among other findings, macroeconomic stability as reflected in the rate of inflation and fiscal balance plays a significant role in the growth process. Keywords: Transition economies; FDI; GDI; Fixed effects, Groupwise heteroscedasticity;
Cross-sectional correlation JEL Classification: F15, O52
* This version of the paper is prepared for the 80th Annual Conference of the Western Economic Association International 2005. I would like to thank Ioan Voicu for his comments on an earlier version of the paper. Please do not quote without permission. I am grateful to Don Bumpass and Don Freeman for reading this version of the paper and for their comments. I also thank Gabi Eissa for his excellent research assistance. † Department of Economics and International Business, Sam Houston State University, Huntsville, TX 77341-2118; Phone: 936-294-4760; Fax: 936-294-3488; E-mail: [email protected]

1
Trade, Foreign Direct Investment and Growth: Evidence from Transition Economies
1. Introduction
The experiences of economic transition from a centrally-planned to a market
based system in Central and Eastern Europe (CEE) and the former Soviet Union (FSU)
raise two pertinent questions. First, what triggered growth that ended the ‘transitionary
recession’ experienced by these transition economies in the early 1990s? Second, what
would sustain growth in subsequent periods? This paper is primarily concerned with the
second question and examines the role of trade and foreign direct investment (FDI) in
growth in transition economies of Central and Eastern Europe, and the Baltic Region
(CEEB). 1 Because these countries have substantially liberalized international trade and
have attracted large FDI in last few years, it is important to examine the significance of
their role in the long-run growth of these economies.
The volume of trade in these countries has increased: total exports from and
imports into these countries have doubled between 1990 and 2002. FDI inflows into these
thirteen countries steadily increased from less than half a billion USD in 1990 to about 26
billion USD in 2002, from 0.13 percent to 5.25 percent of GDP during the period. There
is wide variation across the recipient countries. For example, Czech Republic, Hungary
and Poland received 70 percent of total FDI inflows into the region. Six countries -
Albania, Estonia, Latvia, Lithuania, Macedonia and Slovenia – together received less
than 10 percent.
1 There are 13 countries in CEEB region. They are: Albania, Bulgaria, Croatia, Czech Republic, Estonia, Hungary, Latvia, Lithuania, Macedonia FYR, Poland, Romania, Slovak Republic and Slovenia.

2
Figure 1 displays trends in growth of per capita real GDP, FDI-GDP ratio, and
volume of trade (exports plus imports) as a share of real GDP – also used as a measure of
openness or trade liberalization- (all averaged across the cross-section of thirteen
transition economies, and expressed in percentages) between 1990 and 2003. As we can
see, average growth rate was negative until 1994. Then it fluctuated, and has been steady
around 4 percent since 2000. The volume of trade appears to have clear upward trend.
The FDI share has steadily been increasing and has slowed down only in 2003.
The transition economies of CEE and FSU experienced substantial decline in
output in the initial phase of transition (a phenomenon often referred to as ‘transitionary
recession’). As Fischer et al (1996a) argue, restrictive macroeconomic policies and
restructuring of the economy caused such decline in economic activities. However, the
extent and the speed of recovery varied across countries. There has been a substantial
literature that addresses various aspects of the transitionary recession, and attempts to
identify the factors that triggered the recovery. Some notable works include de Melo,
Denizer and Gelb (1996); Fischer, Sahay and Vegh (1996 a, b); Sachs (1996); de Melo,
Denizer, Gelb and Tenev (1997); Hernandez-Cata (1998); Havrylyshyn, Izvorski and
Rooden (1998); Berg, Borensztein, Sahay and Zettelmeyer (1999). These studies examine
one or more of four different sets of variables to understand the growth experiences of
early transition years. These four categories of factors are: macroeconomic variables,
structural reform variables, initial conditions and institutional factors.
The recovery and growth since the transitionary recession was over leave us with
only a few data points – not enough to conduct any meaningful time series analysis of the
growth experiences in transition countries. Pooling time series and cross section may,

3
however, provide a useful way of studying growth in those countries.2 There have been a
few attempts in recent years to use panel data approach to evaluate the contribution of
various factors to growth in transition economies. In a study very similar in spirit to the
current research, Cernat and Vranceanu (2002) use a panel data analysis of 10 CEE
countries to asses the impact of globalization on output performance. Their results
indicate that increased EU integration and trade liberalization are conducive to
development. Furthermore, increased FDI inflows seem to be associated with better
output performance.3
In this paper we examine empirically the role of FDI and trade in the process of
economic growth in 13 transition economies of the CEE region. The empirical work is
primarily motivated by an extension of growth theory that includes trade and FDI as
additional determinants of growth. Using fixed effects panel data estimation methods
applied to a data set that ranges for a period from 1990 to 2003, this paper examines the
effects of trade and FDI on growth after controlling for gross domestic investment (GDI)
and some important macroeconomic variables such as inflation, fiscal balance and size of
the government. This paper improves upon some previous work on growth in transition
economies by explicitly addressing three methodological issues. First. we formally test
for groupwise heteroscedasticity and cross-sectional correlation. Second, by including
lagged dependent variable (LDV), we estimate a dynamic version of the model to
mitigate the problem of serial correlation. Third, in order to deal with the problem of 2 To our knowledge, Islam (1995) is the first study to implement panel data approach to cross-country growth data. 3 In a related study, drawing on the insights provided by a production function with a low elasticity of substitution between capital and labor, for short-run growth dynamics in the transition economies, Lee and Tcha (2004) empirically show that the marginal contribution of FDI to growth is greater than that of domestic investment. In another study, Sohinger (2005) shows - in a less formal way - that FDI with its growth-enhancing effects, has played a significant role in setting the transition economies in the CEEB region onto the path of convergence with their more affluent neighbors.

4
omitted variables, a very general specification of the model including largest possible
number of variables is estimated and formal F-tests are conducted to implement a
‘general-to-specific’ approach of selecting the most parsimonious specification.
Our analysis suggests that significant positive effect of trade on growth is a robust
result for transition economies of the CEEB region. Additionally, domestic investment
appears to be an important determinant of growth. However, in the presence of trade, FDI
does not have any significant effect on growth. The estimation of the growth equation
without trade renders FDI highly significant suggesting collinearity between trade and
FDI. Furthermore, interaction between trade and FDI seems to be important for growth in
transition economies. Among other findings, macroeconomic stability as reflected in the
rate of inflation and fiscal balance plays significant role. Our results have important
policy implications.
The rest of the paper is organized as follows. Section 2 discusses theoretical
background of the linkages between trade, FDI and growth. In section 3, we describe the
data and the methodology. Section 4 presents the empirical results and analysis. In the
next section, we summarize and include a few concluding remarks.
2. Linkages between trade, FDI and growth: a theoretical background
The importance of trade and FDI for growth of developing countries has been
emphasized in both theoretical and empirical literature. Apart from the traditional
Ricardian argument of efficiency gain from specialization, there have been several other
hypotheses put forward to argue how trade may affect growth in developing countries. In
early works (e.g. Rosenstein-Rodan 1943, Nurkse 1953, Scitovsky 1954, Fleming 1955,

5
Hirschman 1958), exports are deemed to provide the big push to break away from the
vicious circle of low level equilibrium in which developing countries are often caught.
Later, it is argued that exports fill in the foreign exchange gap that prevents imports of
high tech machinery needed to be competitive in the market.4 More recently, Coe and
Helpman (1995) argue that trade enhances the spillover effects of foreign R&D on
domestic productivity. Another strand of recent literature uses new growth theory
framework to link trade policy to growth. Externalities associated with liberal trade
policies are seen as leading to higher levels of GDP or higher growth.5
The importance of FDI for growth is emphasized for its role in augmenting
domestic capital stock and as a conduit for technology transfer6 - two most essential
elements in modern growth literature. Studies that use new growth theory paradigm to
examine the effects of FDI on growth take two different routes. For example, extending a
hypothesis advanced by Jagdish Bhagwati (1973), Balasubramanyam et al (1996) were
able to show that the growth enhancing effects of FDI would be stronger in countries
with more liberal trade regime. They argue that a liberal trade regime is likely to provide
an appropriate environment conducive to learning that must go along with the human
capital and new technology infused by FDI. Others (e.g., Borensztein et al.1998) rely on
‘absorptive capability’ of the recipient country in the form of stock of human capital for
technological progress that is assumed to take place through a process of ‘capital
deepening’ in the form of new varieties of capital goods introduced by FDI.
4 See McKinnon (1964) 5 See Grossman and Helpman (1992) for a comprehensive discussion of a class of such models. 6 In the literature, the role of FDI in transferring technology has received much attention and spurred intense debate. For a recent survey, see Saggi (2002)

6
There are two dimensions to the hypothesis that FDI interacts with trade to have
positive effect on growth. First, a more liberal trade environment with export-orientation
attracts higher level of FDI inflows because it not only allows foreign capital to take
advantage of low cost of labor in the host country but also provides access to a larger
market. Second, the neutrality of incentives associated with export orientation allows
exploitation of economies of scale, better capacity utilization and lower capital-output
ratio thus making foreign capital more productive. Moreover, exports also promote
technical innovation and dynamic learning from abroad and thereby create a more
favorable environment for externalities and learning from technology spill-over
associated with FDI.
For the purpose of our empirical study, the theoretical expositions of the linkages
between trade, FDI and growth translate into an extended growth equation with trade and
FDI as the additional (extended) variables alongside domestic investment.
3. Data and Methodology Data
The main sources of data for this study are the United Nations’ Statistical
Database, the Statistics on Foreign Direct Investment and World Investment Report 2004
compiled by the United Nations Conference on Trade and Development (UNCTAD) and
the Transition Reports for various years prepared by the European Bank for
Reconstruction and Development (EBRD).
We obtain national accounts data on GDP per capita, gross fixed investment,
government consumption expenditures, exports and imports of goods and services from

7
the UN Statistical Database. These data are available both in national currency and in US
dollars; and both at current prices and at 1990 constant prices. We use constant 1990
USD data. We calculate nominal exchange rate from GDP in national currencies and in
USD at current prices. Although our sample covers a period from 1989 to 2003 there are
differences in the coverage of data across countries depending on availability. Appendix
Table – Table A.1 - describes the sample periods for different series by countries.
It may be noted that the national accounts data on the transition economies have
serious problems which have been emphasized by Fischer et al (1996a) and others. The
GDP data are likely to overstate the decline of output and the increases in prices because
the pre-transition prices were used to measure output, which was of extremely poor
quality. Moreover, government agencies were formerly responsible for collecting and
publishing data on output mainly from the state sector and, therefore, may have
underreported the expansion of the private sector during the initial years of transition.
We obtain the data on net FDI inflows for these countries from the UNCTAD. 7
CPI inflation data are obtained from the EBRD’s Transition Reports and IMF’s World
Economic Outlook 2005. Data on ‘share of private sector’, and ‘tariff revenues’ are
compiled from various issues of the Transition Reports. These data are mainly used for
various experiments that we conduct in this study.
Using the data we construct the following variables for the empirical analysis.
The growth rate of per capita real GDP is calculated as 100 times first log differences of
per capita real GDP and is used as the dependent variable (GROWTH) in the growth
7 FDI inflows in the recipient economy ‘comprise capital provided (either directly or through other related enterprises) by a foreign direct investor to an enterprise resident in the economy.’ ‘FDI flows are recorded on a net basis (capital account credits less debits between direct investors and their foreign affiliates) in a particular year.’ (see UNCTAD: Sources and Notes)

8
equation.8 Percentage share of real exports plus imports in real GDP is taken as a measure
of the trade variable (TRADE). FDI inflow as a percentage share of GDP (in constant
1990 USD) is taken as the FDI variable (FDI). Note that FDI current price series has
been converted into constant 1990 USD by using an implicit deflator calculated from the
series on gross fixed investment. FDI inflows are subtracted from gross fixed investment
to calculate Gross Domestic Investment. Percentage share of GDI in GDP is taken as the
domestic investment variable (GDI).
The summary statistics of the variables of interest (GROWTH, GDI, FDI and
TRADE) are presented in Table 1. The per capita real GDP in the CEEB countries grew at
an average rate of 0.59 percent during 1990-2003. However, average growth rate varies
widely across countries and so does its variance over time. Among the CEEB countries,
Poland has recorded the highest average annual rate of per capita real GDP growth (1.91
%) during this period, followed by Slovenia (1.81%). In Former Yugoslav Republic
(FYR) of Macedonia, the average annual growth rate has been negative. On an average,
these countries have invested 20 percent of their GDP in building domestic stock of fixed
capital during this period. Seven countries - Czech Republic, Estonia, Lithuania, Poland,
Romania, Slovak Republic and Slovenia, have exceeded this average. FDI inflows have
accounted for slightly above 4 percent of real GDP, on an average. This share is above 6
percent, on an average, in Czech Republic, Estonia and Hungary. Average trade volume
among these countries has surpassed GDP at 102 percent, with only 4 countries having
this ratio below 100 percent. In most countries, increase in this ratio over the sample
period has been substantial.
8 There have been studies that use per capita real GDP (mostly in logarithms) as the dependent variable. For example, see Berg et al (1999) and Cernat and Vranceanu (2002). Since our study is primarily motivated by a variant of the growth theory, the dependent variable is decidedly the growth rate of per capita real GDP.

9
Methodology
We use panel data estimation techniques for our empirical analysis. As discussed
above, extension of basic growth theory suggests that alongside domestic investment,
trade and FDI are important determinants of growth. We, therefore, consider GDI, FDI
and TRADE to be the main right-hand side variables in our growth equation. Although
time invariant initial conditions have been shown to be important for subsequent growth
in general (see, for example, Barro 1991) and for transition economies in particular (see
de Melo et al 1997, and Berg et al 1999), we leave them out in favor of country-specific
fixed effects primarily for two reasons. First, previous studies (for example, Berg et al
1999) have shown that more than one initial condition may be important for growth and
macroeconomic performance in transition economies.9 Inclusion of too many initial
conditions may lead to imprecise estimation of the coefficients. Moreover, there may be
country-specific factors - other than initial conditions - that contribute to variations in
growth experiences in transition economies. Therefore, our choice of a fixed effects
model is dictated by a desire for parsimonious specification and a concern for omitted
variable problem. Second, the objective of the study is to examine the contribution of
trade and FDI to growth in transition economies, and the role of initial condition or
relative importance of different initial conditions for growth is not of particular interest.
While growth theory provides some guidance, growth in countries that are going
through economic and political transition could just be a black box. Therefore, choosing
appropriate control variables is a difficult task. As shown in previous works, growth in
transition economies may well be affected by – in addition to initial conditions - macro
9 However, they have argued that the effects of these initial conditions taper off as time passes. This could be another reason why they may be excluded in investigating long run growth.

10
variables, structural reform variables, and institutional factors. Based on suggestions from
previous works and data availability, we choose two categories of variables:
macroeconomic variables and structural reform variables. The first category includes
CPI inflation (INF), fiscal balance as percentage of GDP (FBAL), size of the government
as measured by the percentage share of government consumption expenditures in GDP
(GOV) and nominal exchange rate (X). These variables are assumed to reflect the effects
of macroeconomic stabilization policies. Like Berg et al. (1999), inflation is our main
stabilization proxy. Fiscal balance is expected to affect growth through crowding out and
government consumption expenditures through a short run aggregate demand stimulus.10
Inclusion of nominal exchange rate is expected to reflect the effect of exchange rate
targeting of stabilization policies.
The category of structural variables includes the share of private sector in GDP
(PVT) and tariff revenue as a percentage of total imports (TARIFF). 11 The first variable is
an indicator of the speed and extent of structural reform and is expected to have a positive
effect on growth through increased efficiency. TARIFF measures the extent of trade
liberalization.12 Country-specific fixed effects will capture some of the important
differences in institutions that are inherent or evolved - across the transition economies.13
10 One might expect these two variables to be correlated and therefore, may prefer to use one instead of both. However, it turns out that the contemporaneous correlation between FBAL and GOV is 0.16. It is not difficult to see that they may have completely unrelated time patterns and may reflect different policy orientation. 11 Berg et al (1999) use three liberalization indices under this category. These indices measure extent of price liberalization, external liberalization and the progress in privatization. Although EBRD’s Transition Reports provide such indices, in many cases they are invariant over a number of years, are not available for almost half of the sample period considered here and, therefore, we are not using them. 12 Note that one of the variables of interest – TRADE, is also used as a measure of trade liberalization and one would expect it to be correlated with TARIFF. It turns out that the correlation coefficient between these two variables is -0.71 which is significantly high. 13 Grogan and Moers (2001) present a cross-section analysis of 25 transition economies to show that institutions are important for growth and FDI.

11
We estimate a pooled time-series cross-section regression of the following form:
itititiit Z'Xg εγβµ ++′+=
where git is the annual growth rate of per capita real GDP for state i in year t; µi is the
country-specific fixed effect; Xit is a vector of variables of interest: GDI, FDI and
TRADE; and Zit is a vector of control variables; i = 1, 2,…….N indexes country and t =1,
2, ……T indexes time.
Among various issues and concerns about this empirical methodology, the
following have been formally addressed. First, although country fixed effects take care of
time invariant country-specific factors, the model may still suffer from omitted variable
problem if some important ‘time-variant’ control variables are not included. Moreover,
some of these variables may be correlated with each other. Thus, while exclusion of
relevant variables may lead to the omitted variables problem, inclusion of them may give
rise to the problem of collinearity. To address these problems, we first estimate a general
model including all control variables listed above. The obvious drawback of including
many variables is that due to lack of degrees of freedom the coefficients are imprecisely
estimated. If some variables have negligible effects, excluding them would lead to more
precise estimates. Moreover, multicollinerity may show up in terms of statistically
insignificant individual coefficient with high R2. Remedies of this problem include
exclusion of variables that are collinear with others. We therefore adopt a loose
application of David Hendry’s “general-to-specific” approach. We then apply a sequence
of F-tests to reduce the model to more parsimonious specifications admissible under our
data set. We start with excluding single variable under each category of control variables,
and then we test for exclusion of an entire category of variables. This ‘general-to-

12
specific’ approach would help us find the most parsimonious specification of our
model.14
Second, given the differences in growth experiences among transition economies,
one would expect tremendous variation of variables in the model. Moreover, geographic
contiguity, and similarity and links between erstwhile political systems make it likely that
there are some common factors that affect these countries. We, therefore, formally test
for groupwise heteroscedasticity and cross-sectional correlation. Following Greene
(1997), we conduct simple Lagrange Multiplier (LM) Tests. For serial autocorrelation,
however, we rely on pooled Durbin-Watson (DW) test statistics.
4. Empirical Results
The test results for ‘general-to-specific’ approach of model selection are presented
in Table 2. Based on these results we include INF, FBAL and GOV as control variables in
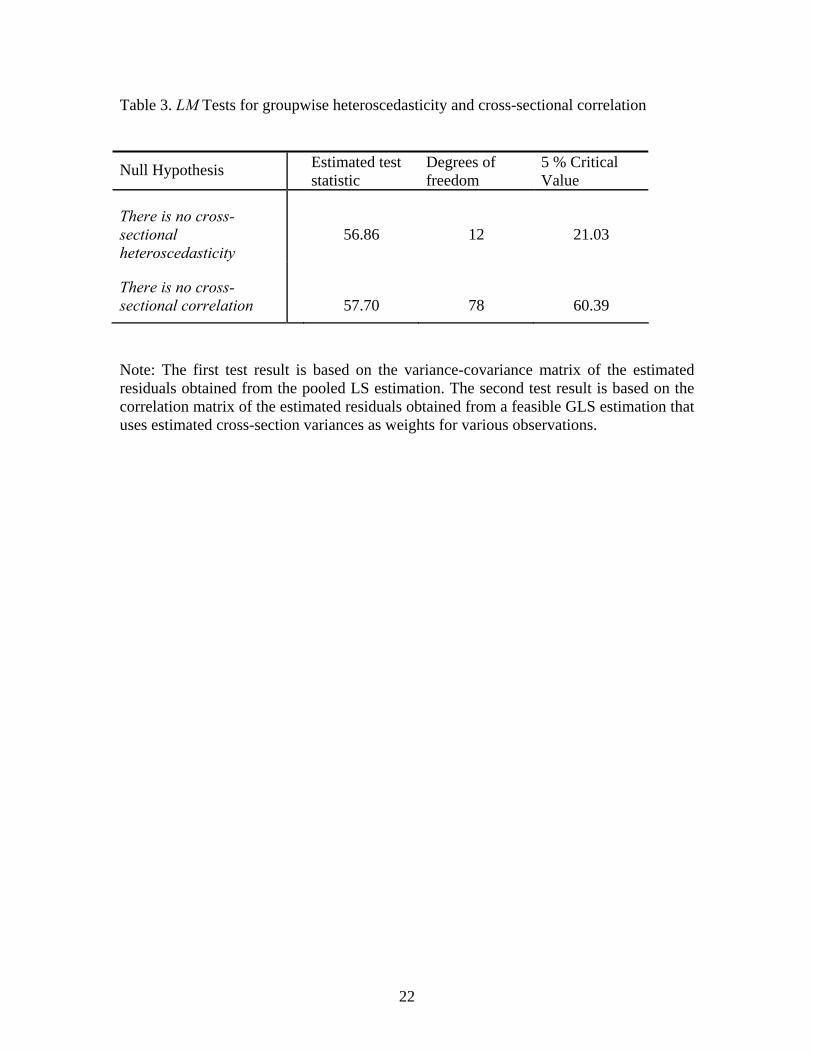
our pooled regression model. Test results for groupwise heteroscedasticity and cross-
sectional correlation are reported in Table 3. While the test strongly rejects the null
hypothesis of no heteroscedasticity across countries there is little evidence of cross-
sectional correlation.
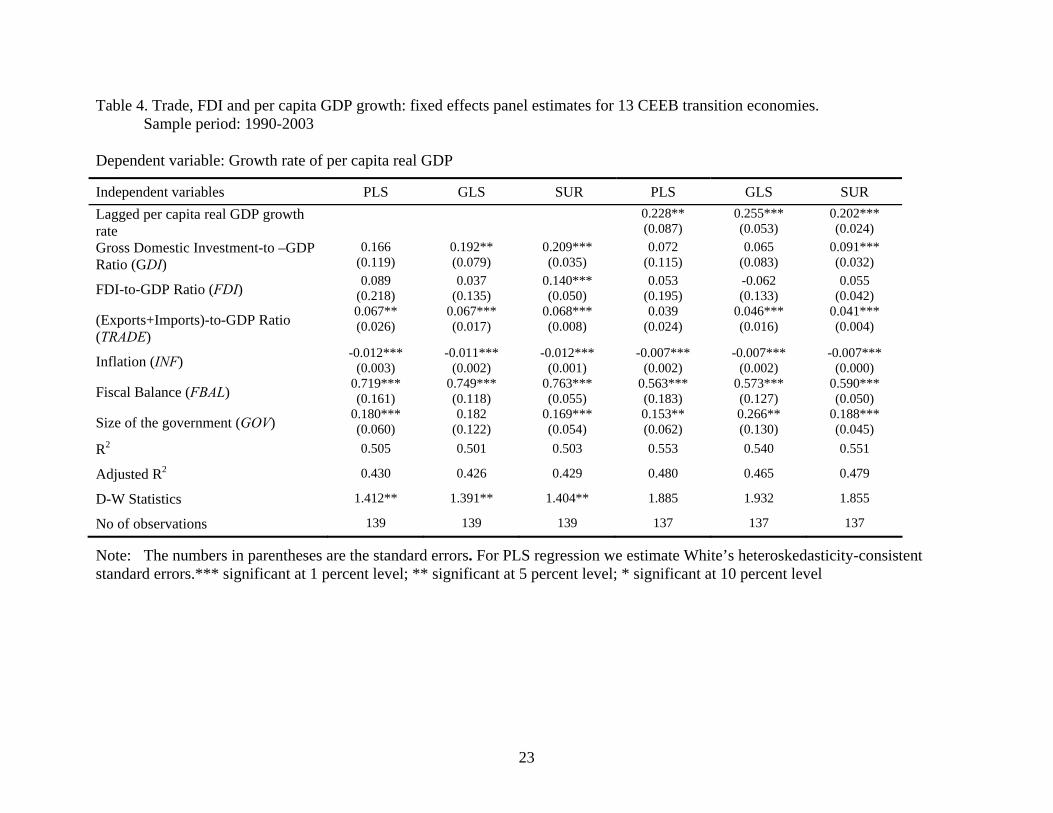
In Table 4, we present the regression results. The first three columns include
coefficient estimates, the standard errors and other relevant statistics estimates obtained
from three different estimation methods. Column 1 includes estimates from simple
pooled least square (PLS) method that assigns equal weights to all observations. Note that
the standard errors are estimated using White’s heteroskedasticity consistent variance-
14 Note that we do not apply the ‘general-to-specific’ approach to our variables of interest. Therefore, even in the most parsimonious specification, multicollinearity problem may arise if two or more of these variables are collinear. As we will see, that may in fact be the case with TRADE and FDI.
13
covariance estimates that are robust to general heteroskedasticity. Column 2 includes
estimates obtained from a feasible generalized least square (GLS) estimation method that
corrects for cross-sectional heterogeneity by using estimated cross-section residual
variances as weights. In column 3, we present the seemingly unrelated regression (SUR)
estimates.15 SUR estimation method – a version of feasible GLS - corrects for both cross-
sectional heterogeneity and cross-sectional correlation by using estimated cross-section
residual variance-covariance weights.
The results indicate that among the variables of interest, trade has significant
positive effect on per capita real GDP growth, and this result is robust under alternative
estimation methods. A one percent point increase in trade-GDP ratio increases per capita
real GDP growth rate by about 0.07 percent point. Domestic investment has significant
positive effect on the per capita growth rate under GLS and SUR. A one percent point
increase in GDI-GDP ratio leads to about 0.20 percentage point increase in per capita
GDP growth rate. Although the effect of FDI on per capita growth is positive it is
statistically significant only under SUR estimation method. Among the control variables,
highly significant negative effects of inflation and fiscal balance are robust to any
estimation method. The latter results accord well with previous studies by Berg et al
(1999) and highlight the importance of macroeconomic stabilization for growth of the
transition economies of the CEEB region. Size of the government has mostly significant
positive effect on growth. It seems to have affected growth by stimulating aggregate
demand.
15 Although we find little evidence of cross-sectional correlation, we present the SUR results for comparison.
14
We report the pooled Durbin-Watson test statistics for all three methods and they
indicate that the null of no serial correlation is rejected at 5 percent significance level.
We, therefore, include the lagged dependent variable (LDV) in next three sets of results
reported in column 4 through 6. Since LDV is correlated with country-specific fixed
factors it renders estimates of the coefficients biased and inconsistent. Note that only if
T → ∞, the LS estimates will be consistent for dynamic error panel model. However,
some researchers (for example, Islam 1995) favor LS estimates for moderate size T if N
is relatively large arguing that the bias may not be large in those cases.16
The trade coefficient is statistically significant at least under GLS and SUR. GDI
is now statistically significant only under SUR. FDI is no longer significant and, in fact,
has negative sign under GLS. Even long-run effects of these variables (calculated by
multiplying the estimated coefficients by )ˆ( ρ−1
1 where ρ̂ is the estimated coefficient of
the LDV) are smaller in magnitude than those in the static model. Note that the earlier
results about the effects of the control variables are robust to this dynamic specification
of the model. The D-W statistics in the LDV models suggest that the issue of
autocorrelation is now mitigated.
Sensitivity Analysis
We conduct three different sensitivity exercises. First, we exclude those years
when most transition economies in the CEEB region experienced negative growth. By
1995 the transitionary recession largely ended in the region except in Macedonia.
16 See Baltagi (2002) pp. 129-30 for a discussion. Many alternatives to get around the problems associated with dynamic specification of fixed effects model have been suggested. Notable works include Anderson and Hsiao (1981), Arellano (1989) and Arellano and Bond (1991).

15
Therefore, we re-estimate the model for the period 1995-2003. The PLS estimates are
presented in the first column of Table 5. As we can see, the effects of the macro variables
are still significant and have the expected signs. Among the variables of interest, TRADE
is still significant though the magnitude of its effect is much smaller. FDI has negative –
though statistically insignificant - effect on growth. Adding LDV (results not reported in
the table) does not change the result and, in fact, the AR coefficient is negative and
statistically insignificant. An examination of the D-W test statistics reveals that it is in the
‘no decision zone’ and LDV does not seem to alter the result. It may be noted that this
result may be due to the fact that Albania, Bulgaria, Croatia, Czech Republic, Lithuania
and Romania experienced decline in per capita real GDP for one or more years during
this period.
Second, we multiply the investment variables (both GDI and FDI) by the shares
of private sector (PVT). As has been discussed in other studies (for example, Berg et al
1999), the government sector is inefficient, and under the socialist regimes the CEEB
countries are known to have over-capitalization which means excess capacity and
inefficiency. By multiplying with private sector shares we are implicitly assuming that
both GDI and FDI contribute to growth only to the extent that the new capital is fully and
efficiently utilized in the private sector. The results are shown under column 2. Although
GDI is highly significant, both FDI and TRADE are now statistically insignificant.
Third, the fact that FDI is found to have statistically insignificant effect on growth
– which does not accord well with the insights provided by the growth theory framework
- while trade has significant positive effect, makes us suspect the possibility of a linear

16
relationship between FDI and TRADE.17 We, therefore, estimate the model without the
trade variable. Both GDI and FDI are now highly statistically significant, and FDI is now
significant even under the dynamic specification of the model. The results are shown in
column 3 and 4. Moreover, as discussed in section 2, theory suggests that trade and FDI
interact to enhance growth. We, therefore, conduct an additional experiment in which
instead of including FDI and TRADE separately, we include an interaction term between
these two variables which appears to be positive and highly significant under both static
and dynamic specifications.
To summarize, our results indicate that significant positive effect of trade on
growth is a robust empirical result for transition economies of the CEEB region.
Domestic investment, too, appears to be an important determinant of growth. However, in
the presence of trade in the growth equation, FDI does not have any significant effect on
growth. The estimation of the growth equation without trade renders FDI highly
significant suggesting collinearity between trade and FDI. Furthermore, interaction
between trade and FDI seems to be important for growth in transition economies. Among
other findings, macroeconomic stability as reflected in the rate of inflation and fiscal
balance plays a significant role.
These results have important policy implications for the transition economies of
the CEEB region. They are even more significant as most of these countries (so far 8
countries have joined the EU) have recently joined the European Union. With free
mobility of factors of production and liberal trade policies these countries are expected to
achieve high growth.
17 The contemporaneous correlation coefficient between these two variables is 0.433. Although in general collinerity is less of a problem in pooled regression models, inclusion of country specific fixed effects may aggravate the problem. See Baltagi (2002)
17
5. Concluding Remarks
This paper examines the effects of trade and FDI on growth using data for 13
transition economies in the CEEB region. An extension of traditional growth theory that
includes trade and FDI as additional determinants of growth provides the motivation for
this study which tries to understand growth and its sustainability in the transition
economies. The transition countries of the CEEB region have witnessed substantial
increase in trade and FDI during the first decade of their transition from plan to market
based system. Applying fixed effects panel estimation methods to a data set that ranges
for a period from 1989 to 2003, this paper finds that significant positive effect of trade on
growth is a robust result for these transition economies. Domestic investment appears to
be an important determinant of growth. However, in the presence of trade in the growth
equation, FDI does not have any significant effect on growth. The estimation of the
growth equation without trade renders FDI highly significant suggesting collinearity
between trade and FDI. Furthermore, interaction between trade and FDI seems to be
important for growth in transition economies. Among other findings, macroeconomic
stability as reflected in the rate of inflation and fiscal balance plays significant role.
One important shortcoming in this version of the paper is that it has not addressed
the problem of endogeneity. It has been suggested in the literature (for example, Jensen
2002) that growth significantly affects FDI flows into the transition economies. If that is
the case, it will be worthwhile to estimate the growth equation with appropriate
instruments. In the absence of suitable data for such an instrument(s), for now we leave it
as a future exercise which will hopefully improve our result. Besides, the future research

18
agenda includes re-estimating the dynamic models using one of the alternatives suggested
in the literature (e.g. Anderson and Hsiao 1981, or Arellano and Bond 1991).

19
-15
-10
-5
0
5
10
60
80
100
120
140
1990 1992 1994 1996 1998 2000 2002
FDI GROWTH TRADE
Average per capita real GDP growth, fdi-gdp ratio and trade-gdp ratioin CEEB transition economies: 1990 - 2003
Gro
wth
rate
and
sha
re o
f FD
I (in
per
cent
age)
Trade share in GD
P (in percentage)
Figure 1

20
Table 1. Summary Statistics of the Variables: 1990-2003 Per Capita GDP
Growth Rate GDI-GDP Ratio FDI-GDP Ratio Trade- GDP
Ratio
1 2 3 4
Mean 1.82 16.53 3.71 11.48 Standard dev 12.95 7.68 3.36 6.75
Albania (Max , Min) (13.51,-33.14) (34.56,10.18) (13.78,1.15) (15.99,-7.37) Mean -0.36 15.28 4.87 103.21 Standard dev 6.24 3.87 4.17 27.11
Bulgaria (Max , Min) (6.03,-10.22) (21.25,7.22) (11.03,0.45) (141.10, 70.60)Mean 0.53 16.23 4.06 107.59 Standard dev 9.01 2.98 2.67 22.95
Croatia (Max , Min) (8.20,-23.01) (21.55, 12.83) (8.15,0.62) (158.82,87.42) Mean 0.61 22.59 6.00 143.02 Standard dev 4.32 3.36 4.37 48.94
Czech Republic (Max , Min) (5.77,-12.40) (27.36,16.59) (13.30,1.48) (217.37,74.36) Mean 1.52 22.20 8.57 141.44 Standard dev 8.95 5.27 3.03 49.64
Estonia (Max , Min) (10.55, -22.06) (31.55, 10.00) (13.37, 4.05) (204.44,53.42) Mean 1.39 19.49 6.21 113.39 Standard dev 4.83 3.17 3.02 47.01
Hungary (Max , Min) (5.50,-12.33) (24.64, 11.82) (12.04,0.86) (181.71,55.95) Mean -0.61 12.72 3.74 102.32 Standard dev 14.15 5.87 1.59 14.20
Latvia (Max , Min) (9.17,-41.32) (23.06,6.09) (7.15, 1.51) (117.65,66.80) Mean -0.34 23.41 3.98 127.42 Standard dev 10.24 1.73 3.46 40.59
Lithuania (Max , Min) (9.15,-22.99) (27.59, 21.81) (11.57, 0.52) (172.91,43.28) Mean -1.33 14.96 2.94 79.15 Standard dev 4.34 4.37 4.26 18.47
Macedonia, FYR (Max , Min) (3.82,-8.27) (18.87,2.19) (14.20, 0.21) (106.47,46.65) Mean 1.91 22.58 3.35 83.77 Standard dev 5.47 3.31 2.18 23.91
Poland (Max , Min) (6.56,-12.63) (27.29,17.94) (7.84, 0.14) (114.09,48.17) Mean -0.30 20.71 2.51 61.90 Standard dev 6.44 2.28 1.98 21.46
Romania (Max , Min) (7.37,-13.64) (23.82,15.39) (6.76, 0.15) (102.90, 36.92)Mean 1.11 22.62 3.76 127.79 Standard dev 6.14 5.83 4.35 33.94
Slovak Republic (Max , Min) (5.76, -16.16) (29.68, 8.89) (14.62, 0.89) (185.21, 59.80)Mean 1.81 22.94 1.80 147.56 Standard dev 4.62 5.15 2.51 16.04
Slovenia (Max , Min) (5.87, -10.04) (30.95, 16.00) (9.58, 0.60) (169.29, 118.95)Mean 0.59 19.59 4.20 102.12 Standard dev 7.77 5.81 3.47 46.68
Full sample (Max , Min) (13.51,-41.32) (34.56, 2.19) (14.62, 0.14) (217.37, -7.37)

21
Table 2: F-test results for exclusion of control variables Category of variables Variable F-statistics Degrees of
freedom p-value
1 2 3 4
Inflation 27.71 (1,105) 0.00
Fiscal Balance 26.08 (1,105) 0.00
Size of the Government 4.44 (1,105) 0.04
Exchange Rate 0.12 (1,105) 0.73
Macroeconomic variables
All macro variables 14.20 (4,105) 0.00
Tariff revenue as % share of imports
0.72 (1,105) 0.40
Private sector share in GDP
0.03 (1,105) 0.87
Structural variables
All structural variables
0.36 (2,105) 0.70
22
Table 3. LM Tests for groupwise heteroscedasticity and cross-sectional correlation
Null Hypothesis Estimated test statistic
Degrees of freedom
5 % Critical Value
There is no cross-sectional heteroscedasticity
56.86
12
21.03
There is no cross-sectional correlation
57.70
78
60.39
Note: The first test result is based on the variance-covariance matrix of the estimated residuals obtained from the pooled LS estimation. The second test result is based on the correlation matrix of the estimated residuals obtained from a feasible GLS estimation that uses estimated cross-section variances as weights for various observations.
23
Table 4. Trade, FDI and per capita GDP growth: fixed effects panel estimates for 13 CEEB transition economies. Sample period: 1990-2003
Dependent variable: Growth rate of per capita real GDP
Independent variables PLS GLS SUR PLS GLS SUR Lagged per capita real GDP growth rate
0.228** (0.087)
0.255*** (0.053)
0.202*** (0.024)
Gross Domestic Investment-to –GDP Ratio (GDI)
0.166 (0.119)
0.192** (0.079)
0.209*** (0.035)
0.072 (0.115)
0.065 (0.083)
0.091*** (0.032)
FDI-to-GDP Ratio (FDI) 0.089 (0.218)
0.037 (0.135)
0.140*** (0.050)
0.053 (0.195)
-0.062 (0.133)
0.055 (0.042)
(Exports+Imports)-to-GDP Ratio (TRADE)
0.067** (0.026)
0.067*** (0.017)
0.068*** (0.008)
0.039 (0.024)
0.046*** (0.016)
0.041*** (0.004)
Inflation (INF) -0.012*** (0.003)
-0.011*** (0.002)
-0.012*** (0.001)
-0.007*** (0.002)
-0.007*** (0.002)
-0.007*** (0.000)
Fiscal Balance (FBAL) 0.719*** (0.161)
0.749*** (0.118)
0.763*** (0.055)
0.563*** (0.183)
0.573*** (0.127)
0.590*** (0.050)
Size of the government (GOV) 0.180*** (0.060)
0.182 (0.122)
0.169*** (0.054)
0.153** (0.062)
0.266** (0.130)
0.188*** (0.045)
R2 0.505 0.501 0.503 0.553 0.540 0.551
Adjusted R2 0.430 0.426 0.429 0.480 0.465 0.479
D-W Statistics 1.412** 1.391** 1.404** 1.885 1.932 1.855
No of observations 139 139 139 137 137 137
Note: The numbers in parentheses are the standard errors. For PLS regression we estimate White’s heteroskedasticity-consistent standard errors.*** significant at 1 percent level; ** significant at 5 percent level; * significant at 10 percent level

24
Table 5. Trade, FDI and per capita GDP growth: fixed effects panel estimates for 13 CEEB transition economies. Sensitivity analysis results
Dependent variable: Growth rate of real GDP per capita
Independent variable 1 2 3 4 5 6 Lagged per capita real GDP growth rate
0.255*** (0.080)
0.228*** (0.086)
Gross Domestic Investment-to –GDP Ratio (GDI)
0.074 (0.091)
0.363*** (0.100)
0.166 (0.104)
0.353*** (0.090)
0.180* (0.100)
FDI-to-GDP Ratio (FDI) -0.012 (0.144)
0.476*** (0.138)
0.257* (0.133)
(Exports+Imports)-to-GDP Ratio (TRADE)
0.031** (0.015)
0.005 (0.038)
FDI*TRADE 0.004*** (0.001)
0.002*** (0.001)
PVT*GDI 0.005*** (0.002)
PVT*FDI 0.003 (0.003)
Inflation (INF) -0.008*** (0.002)
-0.008*** (0.002)
-0.011*** (0.004)
-0.006*** (0.002)
-0.011*** (0.004)
-0.006*** (0.002)
Fiscal Balance (FBAL) 0.884*** (0.173)
0.776*** (0.133)
0.795*** (0.171)
0.583*** (0.184)
0.727*** (0.150)
0.570*** (0.177)
Size of the government (GOV) 0.187*** (0.059)
0.166** (0.067)
0.134** (0.055)
0.125** (0.060)
0.150*** (0.054)
0.134** (0.059)
R2 0.554 0.540 0.459 0.537 0.483 0.543
Adjusted R2 0.460 0.461 0.383 0.466 0.411 0.474
D-W Statistics 2.298 1.588** 1.352** 1.92 1.358** 1.867
No of observations 104 124 139 137 139 137
Note: The numbers in parentheses are the White’s heteroskedasticity-consistent standard errors.*** significant at 1 percent level; ** significant at 5 percent level; * significant at 10 percent level

25
Appendix Table Table A.1 Sample periods for different data series by country Series Albania Bulgaria Croatia Czech
Republic Estonia Hungary Latvia Lithuania Macedonia FYR Poland Romania Slovak
Republic Slovenia
Per capita real GDP
1989-2003 1989-2003 1990-2003 1989-2003 1990-2003 1989-2003 1990-2003 1990-2003 1990-2003 1989-2003 1989-2003 1989-2003 1990-2003
Gross fixed investment
1989-2002 1989-2003 1990-2003 1989-2003 1990-2002 1989-2002 1990-2002 1990-2002 1990-2002 1989-2002 1989-2002 1989-2003 1990-2003
Government consumption
1989-2002 1989-2003 1990-2003 1989-2003 1990-2002 1989-2002 1990-2002 1990-2002 1990-2002 1989-2002 1989-2002 1989-2003 1990-2003
Exports of goods and
1989-2002 1989-2003 1990-2003 1989-2003 1990-2002 1989-2002 1990-2002 1990-2002 1990-2002 1989-2002 1989-2002 1989-2003 1990-2003
Imports of goods and
1991-2002 1989-2003 1990-2003 1989-2003 1990-2002 1989-2002 1990-2002 1990-2002 1990-2002 1989-2002 1989-2002 1989-2003 1990-2003
FDI 1992-2003 1990-2003 1993-2003 1993-2003 1992-2003 1989-2003 1992-2003 1992-2003 1994-2003 1989-2003 1991-2003 1993-2003 1992-2003
CPI Inflation 1991-2003 1989-2003 1990-2003 1989-2003 1989-2003 1989-2003 1989-2003 1989-2003 1989-2003 1989-2003 1989-2003 1989-2003 1989-2003
Fiscal Balance 1990-2002 1989-2002 1992-2002 1990-2002 1993-2002 1991-2002 1994-2002 1993-2002 1991-2002 1989-2002 1992-2002 1992-2002 1991-2002
Share of private sector
1991-2001 1991-2001 1991-2001 1991-2001 1991-2001 1991-2001 1991-2001 1991-2001 1991-2001 1991-2001 1991-2001 1991-2001 1991-2001
Tariff 1993-2001 1993-2001 1993-2001 1993-2001 1993-2001 1993-2001 1993-2001 1993-2001 1993-2001 1993-2001 1993-2001 1993-2001 1993-2001

26
References: Anderson, T.W. and C. Hsiao.“Estimation of dynamic models with error components.”
Journal of the American Statistical Association 76, 1981, 598-606. Arellano, M. “A note on the Anderson-Hsiao estimator for panel data.” Economics
Letters 31, 1989, 337-341. Arellano, M. and S. Bond. “Some tests of specification for panel data: Monte Carlo
evidence and an application to employment equations.” Review of Economic Studies 58, 1991, 277-297.
Balasubramanyam, V.N., M. Salisu and David Sapsford. “Foreign Direct Investment and
Growth in EP and IS Countries.” Economic Journal 106 (January 1996), 1996, 92-105.
Baltagi, Badi H, 2002, Econometric Analysis of Panel Data, Second Edition, Chichester,
U.K.: John Wiley & Sons Ltd. Barro, Robert J. “Economic Growth in a Cross Section of Countries.” Quarterly Journal
of Economics, Vol. 106, No. 2 (May, 1991), 407-443. Berg, Andrew, E Borensztein, Ratna Sahay, and Jeromin Zettelmeyer. “The Evolution of
Output in Transition Economies: Explaining the Differences,” IMF Working Paper (WP/99/73) Washington, D.C.: IMF, 1999.
Bhagwati, J. N. 1973, “The theory of immiserizing growth: further application.” In
Michael B Connolly and Alexander K. Swoboda, (eds): International Trade and Money. Toronto: University of Toronto Press.
Borensztein, E., J. De Gregorio and J-W Lee. “How does foreign direct investment affect
economic growth?” Journal of International Economics 45, 1998, 115-135 Cernat, Lucian and Radu Vranceanu. “Globalisation and Development: New Evidence
from Central and Eastern Europe” Comparative Economic Studies XLIV, no. 4 (Winter), 2002, 119-136.
Coe, David T. and Elhanan Helpman. “International R&D Spillovers.” European
Economic Review, 39, 1995, 859-887. de Melo, Martha, Cevdet Denizer and Alan Gelb. “From Plan to Market: Patterns of
Transition.” World Bank Policy Research Working Paper 1564, Washington, D.C.: World Bank, 1996.
27
de Melo, Martha, Cevdet Denizer, Alan Gelb AND Stoyan Tenev. “Circumstance and Choice: The Role of Initial Conditions and Policies in Transition Economies.” World Bank Policy Research Working Paper 1866, Washington, D.C.: World Bank, 1997.
European Bank for Reconstruction and Development (EBRD), Transition Reports.
Various issues between 1994 – 2003, London: EBRD. Fischer, Stanley, Ratna Sahay and Carlos Vegh. “Stabilization and Growth in Transition
Economies: The Early Experience.” Journal of Economic Perspective, Vol. 10, No. 2 (Spring 1996), 45 – 66.
----- -, ------, ------ -------- and ------- ------.“Economies in Transition: The Beginnings of
Growth.” American Economic Review, Vol. 86, No. 2, Papers and Proceedings of the Hundredth and Eighth Annual Meeting of the American Economic Association San Francisco, CA, January 5-7, (May, 1996), 229 - 233
Fleming, J Marcus. “External Economies and the Doctrine of Balanced Growth.” Economic Journal, 65, 1955, 241-256.
Greene, William H. Econometric Analysis. Third edition. New Jersey: Prentice Hall,
1997 Grogan, Louise and Luc Moers. “Growth empirics with institutional measures for
transition countries.” Economic Systems, 25, 2001, 323-344. Grossman, Gene M. and Elhanan Helpman. Innovation and Growth: Technological
Competition in the Global Economy. Boston,MA: MIT Press, 1992. Havrylyshyn, Oleh, Ivailo Izvorski, and Ron van Rooden. “ Recovery and Growth in
Transition Economies 1990-97: A Stylized Regression Analysis.” IMF Working Paper (WP/98/141) Washington, D.C.: IMF, 1998.
Hendry, David F. Dynamic Econometrics. Oxford, New York: Oxford University Press,
1995. Hernandez-Cata, E. “Growth and Liberalization during Transition from Plan to Market.”
IMF Staff Papers 44 (4), 1997, 405-429 Hirschman, Albert O. The Strategy of Economic Development. New Haven: Yale
University Press. International Monetary Fund. World Economic Outlook 2005. Washington, D.C.: IMF,
2005. Islam, Nazrul. “Growth Empirics: A Panel Data Approach.” Quarterly Journal of
Economics, Vol. 110, No. 4 (Nov 1995), 1127-1170.

28
Jensen, Nathan. “Economic Reform, State Capture, and International Investment in Transition Economies.” Journal of International Development, 14, 2002, 973-977.
Keren, Michael and Gur Ofer, “The Role of FDI in Trade and Financial Services in
Transition: What Distinguishes Transition Economies from Developing Economies?” Comparative Economic Studies XLIV, no. 1 (Spring 2002), 15-45.
Lee, Minsoo and MoonJoong Tcha. “The Color of Money: The Effects of Foreign Direct
Investment on Economic Growth in Transition Economies” Review of World Economies 140 (2), 2004, 211-229.
McKinnon, R.I. “Foreign Exchange Constraints in Economic Development and Efficient
Aid Allocation.” Economic Journal, 74, 1964, 388-409. Nurkse, Ragnar. Problems of Capital Formation in Underdeveloped Countries. Oxford:
Oxford University Press, 1953. Rosenstein-Rodan, Paul N. “Problems of Industrialization of Eastern and South-Eastern
Europe.” Economics Journal, 53, 1943, 202-211. Sachs, Jeffrey D. “The Transition at Mid Decade.” American Economic Review, Vol. 86,
No. 2, Papers and Proceedings of the Hundredth and Eighth Annual Meeting of the American Economic Association San Francisco, CA, January 5-7, (May, 1996), 229 – 233
Saggi, Kamal. “Trade, foreign direct investment and international technology transfer: a
survey” World Bank Research Observer, v17, no2, (Fall 2002), 191-235. Scitovsky, Tibor. “Two Concepts of External Economies.” Journal of Political Economy,
62, 1954, 153-151. Sohinger, Jasminka, 2005, “Growth and Convergence in European Transition Economies:
The Impact of Foreign Direct Investment.” Eastern European Economics, vol. 43, no. 2: 73-94
UNCTAD. Statistics on Foreign Direct Investment
http://stats.unctad.org/fdi/eng/ReportFolders/Review/explorerp.asp UNCTAD. World Investment Report 2004. New York and Geneva: United Nations,
2004.