trade induced skill upgrading: lessons from the...
TRANSCRIPT

Trade Induced Skill Upgrading: Lessons from the
Danish and Portuguese Experiences
Grace Gu∗, Samreen Malik†, Dario Pozzoli‡, & Vera Rocha§
October 14, 2016
Abstract
We study how the skill distribution for an economy responds to changes in the skill
premium induced by trade integration. Using administrative data for Denmark (1993-
2012) and Portugal (1993-2011), we conduct a two-step analysis. In the first step we
predict the skill premium changes which are triggered by exogenous trade shocks. In
the second step we estimate the impact of such changes on the skill distribution. The
main results for Denmark show that both the average and the standard deviation of
skills increase as a result of trade integration. For Portugal we find instead that the
impact of trade mediated by skill premium changes is negligible and not statistically
significant. We provide a theoretical intuition to rationalize both sets of results.
Key words: skill premium, skill upgrading, trade integration and labor market frictions. JEL
code: F16 - J24
∗Email: [email protected]. University of California Santa Cruz.†Email: [email protected]. New York University Abu Dhabi.‡Email: [email protected]. Copenhagen Business School.§Email: [email protected]. Copenhagen Business School.
1

1 Introduction
Traditional trade models with endogenous human capital acquisition provide strong pre-
dictions about skill upgrading patterns: opening up to trade induces skill upgrading for
countries with a large endowment of skilled workers whereas unskilled abundant countries
experience a skill downgrade. These strong predictions are at odds with recent theoreti-
cal and empirical research that has highlighted that within an economy globalization may
have heterogeneous effects on workers skill upgrading decisions: some workers may respond
to globalization by increasing human capital investments while others may cut back on skill
upgrading (see e.g., Edmonds et al., 2009; Hickman and Olney, 2011; Atkin, 2012; Blanchard
and Willmann, 2016).
Workers’ heterogeneous skill upgrading in response to trade integration suggest that glob-
alization may have important implications for the skill distribution of a country. Specifically,
trade may potentially change not only the average (mean) but also the diversity (variance)
of skills. A potential transmission channel could be that trade has a positive effect on wages
associated with certain skills but a negative effect on wages of other skills resulting in a wage
gap across skills (henceforth “skill premium”). A change in skill premium may in turn affect
individuals’ incentives to invest in skill upgrading heterogeneously. In particular, individuals
who face an increase in the skill premium, will most likely upgrade their skills if the return
from new skills exceed the cost of skill acquisition. The opposite holds true for individuals
who experience a reduction in skill premium. Consequently, a non-monotonic response of
skill upgrading decision at an individual level can impact the entire domestic distribution of
skills.
The degree with which the above transmission channel affects the entire skill distribution
depends on whether individuals can freely adjust their skills in response to changes in skill
premium. Domestic policies and institution therefore may play an important role in this
adjustment process. For example, if domestic regulations are conducive to the smooth func-
tioning of labor markets, such as a flexible employment protection legislation and a liberal
educational policy, then one can expect that trade shocks to skill premium are more likely to
affect the skill composition within the economy. However, such effects may in fact be absent
under a frictional setting.
In this paper we formally study the effect of changes in skill premium induced by trade
integration (henceforth “trade-induced skill premium”) on domestic skill distribution and
how such effects interact with domestic labor market frictions. A systematic study high-
lighting these distributional effects can enhance our understanding of economic and policy
2

implications of trade integration. However, such effects are not extensively studied in the
existing literature. On the one hand, Bombardini et al. (2012) highlight that distribution
of skills (that is not only the average endowment of skills but the variation of skills) within
an economy is a crucial predictor of export volumes in a standard gravity equation model.
On the other hand, our analysis highlights the issue of reverse causality of trade integra-
tion where trade in itself may impact the distribution (the mean and the variance) of skills.
Therefore, our work shows that the distributional effects in response to trade should be
accounted for while designing trade and other domestic policies.
To provide an intuition of how individual level decisions for skill upgrading (in response
to changes in skill premium) impact the entire domestic skill distribution, we present a simple
3 period model. In the model, each individual is characterized by her innate ability and is
endowed with a fixed amount of time. In each period she decides whether to allocate her
endowed time towards work or skill upgrading. If she works, she earns a wage otherwise,
she bears an opportunity cost of missed wages but better skills enhance her wages for the
remaining periods. The individual ultimately maximizes her lifetime utility function subject
to her budget constraint. The optimal decision rule uses thresholds of exogenous ability;
these thresholds consequently determine whether the individual upgrades skills once, twice,
or not at all in her life time. An exogenous change in the wage gap across various skills (skill
premium) affects these thresholds and subsequently affect individual’s decision to upgrade
skills. In aggregation these individual level decisions impact the overall distribution of skills
in an economy. We extend this set-up to encompass the role of labor market frictions to
study how frictions can affect the response of the skill distribution to exogenous changes in
the skill premium.
Our corresponding empirical analysis is conducted in two steps. In the first step, we
estimate the effect of trade integration on the skill premium, proxied by measures of wage
gap. In the second step, we assess how changes in the skill premium as predicted from the
first step, affect the average and the variance of skills within the economy. We apply this
two-step approach to administrative data for Denmark and Portugal which are chosen for
the following reasons.
Both economies are industrialized countries characterized by a small, export oriented
economy. In terms of trade activity, Denmark and Portugal export almost half of their
GDP to other markets (OECD, 2013, 2014). Traditionally Danish and Portuguese trade has
been concentrated with a few trading partners but more recently both countries have also
started to trade with emerging economies, such as China and formerly communist countries.
Thus despite the maturity of these two economies, the process of trade integration is still
3

evolving. Also in terms of export composition, the two economies are fairly comparable as
both countries have a large export shares within “traditional” sectors, such as machinery
equipment, textiles, food and transport (OECD, 2013, 2014).
However these economies are extremely different in terms of labor market institutions and
educational policies. On the one hand, Denmark provides abundant subsidies for individuals
to upgrade skills. The support is not only in terms of formal schooling but also through
comprehensive active labor market policies that aim at keeping the skills of the workforce
updated (Andersen, 2012). Moreover Denmark has an extremely flexible labor market which
reduces the frictions hindering labor reallocation across firms within industries or across
industries. On the other hand, Portugal is characterized by one of the most rigid labor
markets in the world (Botero et al., 2004), with less generous educational policies and a
milder emphasis on lifelong learning opportunities.
In our empirical analysis, we therefore expect the effects of changes in trade-induced
skill premium to be stronger for the Danish skill distribution relative to the Portuguese skill
distribution. The comparison across these economies facilitates assessing whether the impact
of trade integration on skill distribution is further affected by the inefficient labor market and
educational policies across economies. In addition, both countries have documented detailed
data entries and provide us with an incredibly rich and comparable empirical environment
to study our question of interest.
Our research question described above poses two main challenges from an empirical
point of view. First individuals’ skills, our variable of interest, are generally very difficult to
measure. Second, reverse causality between our measures of skills and trade poses threat to
identification. In this paper, we tackle these two important issues as follows.
First, since we base our main measure of skills on workers’ wages, such measures may
not only reflect the observable and the unobservable features of individuals’ skills but also
firm level wage policies. To deal with this issue, we disentangle wages into the following
four components by using Abowd et al.’s 1999 model: i) a systematic component related
to observable workers’ characteristics, ii) an unobservable time-invariant component at the
worker level, iii) firm fixed effects and iv) a residual. For the purpose of our study and
similarly to Iranzo et al. (2008) and Irarrazabal et al. (2013), we focus on the observable
features of wages as a comprehensive measure of both formal and informal skills. In general
such detailed information on the individual determinants of skills – such as wages and the
workers’ observables in general – are often difficult to collect for the whole workforce due
to confidentiality and privacy laws.1 This has limited the analysis in most of the existing
1See (Goldberg and Pavcnik, 2007) for data limitations.
4

literature to years of education as a primary measure of skills (see e.g., Blanchard and Olney,
2015; Atkin, 2012). The use of confidential employer-employee linked Danish and Portuguese
data allows us to employ a more comprehensive measure of skills as the component of wages
which is explained by workers’ observable characteristics and not only by education levels.
To test the robustness of this definition, we also use other measures of skills, as explained
later.
To address the reverse causality issue, we apply the same identification strategy as in
Hummels et al. (2014) in our first step of empirical model. We tease out the impact of the
export (or import) volumes on the skill premium at the industry level, by exploiting the
shocks to the world import (or export) demand (or supply). This step provides us with
estimates which we employ to predict the trade-induced skill premium. Our second step
may also suffer from simultaneity issues given that it is difficult to rule out that the first two
moments of the skill distribution do not affect the trade-induced skill premium. To limit this
issue we lag the predicted trade-induced skill premium from the first step, as skill premium
changes from previous periods are less likely to be driven by the current skill endowments
and the variation of skills.
Our main results for Denmark show that trade integration has a non-linear effect on
wage gap across various skills and that these changes in the skill premium significantly
influence the skill distribution. Specifically, we find that the export (or import) volumes
have a negative effect on the ratio between the median and the 10th percentile of the wage
distribution and a positive effect on the ratio between the 90th percentile and the median
of the wage distribution. As a result of these changes in trade-induced skill premium, the
mean and the variance for the whole skill distribution increase. For Portugal, we find that
the export (or import) volumes have a positive impact on our measures of wage gap and the
effect is larger than the one estimated for Denmark. Despite the large estimates of trade-
induced skill premium for Portugal, their feedback effect on the first two moments of the
skill distribution are negligible and not statistically significant. These results therefore show
that the changes in trade-induced skill premium improve the overall level of skills but also
make the population more diverse in terms of skills in economies such as Denmark while
such effects are mitigated in frictional labor market settings in economies such as Portugal.
Our paper contributes to the existing literature on endogenous human capital invest-
ments (see for e.g., seminal work by Findlay and Kierzkowski, 1983) and more generally
on how the skill distribution responds to trade shocks (Johnson and Stafford, 1999). The
existing literature has either examined how trade affects the skill premium for a given skill
distribution or how trade affects skill composition within an economy (for e.g., Costinot
5

and Vogel, 2010; Egger and Kreickemeier, 2009; Yeaple, 2005; Maggi and Grossman, 2000).
However, the past literature has not jointly studied these two issues, with a few recent excep-
tions. Blanchard and Willmann (2016) present a trade model that highlights how trade and
educational institutions interact to determine individuals’ skill acquisition decisions and the
pattern of comparative advantage across countries. This framework is used to study how ed-
ucation or trade policies can be used to attenuate the “vanishing middle class” phenomenon
recently observed in much of the industrialized world. Blanchard and Olney (2015) empiri-
cally show that educational attainment also responds to exogenously driven changes in the
composition of country’s exports, and thus they offer insight into how investment in human
capital responds to changing patterns of production. Last, Atkin (2012) uses Mexican data
to study the effects of export expansion on school attainment and finds that location and
job characteristics are important determinants in understanding heterogeneous educational
attainment responses to changes in trade policies.
Our work complements these existing studies in many ways. Unlike past work, we do
not only focus on formal schooling and education as our skill measure. Instead, we rely on a
comprehensive definition of skills and use alternative definitions of skill measures. Moreover,
comprehensiveness of our dataset also allows us to overcome some of the limitations that the
past literature has encountered by using a database spanning several countries. For example,
we study how trade affects the skill composition through changes in skill premium for the
whole workforce employed in either the manufacturing or the service industry in contrast to
Blanchard and Olney (2015), who focus on the skill acquisition of the young cohorts and the
effects of exports within the manufacturing sectors. Finally our comparison of two extreme
examples of labor market environment (Danish versus Portuguese), allows us to highlight the
importance of labor market institutions in shaping the impact of trade on skill composition
offering new insights on the role of frictions.
In the next section we present a conceptual framework that explains how changes in the
skill premium affect the individual decisions to upgrade skills and their implications for the
whole skill distribution. In Section 3 we present the institutional background for Denmark
and Portugal. Data and summary statistics are then discussed in Section 4. Our empirical
strategy is explained in Section 5. We presents our results in Section 6 and conclude in
Section 7. Proofs, figures and tables are collected in appendices at the end.
6

2 Theoretical Intuition
In this section, we present a simple 3-period model to highlight how skill premium affects
skill distribution via its impact on individual’s decision to upgrade skills first in a frictionless
labor market and then in a frictional labor market.
2.1 A Three-Period Skill Upgrading Example
A country is populated by a continuum of heterogeneous agents with a unit mass. Each
individual i has a unique level of inherent ability ai where 0 < a ≤ ai ≤ a that does
not change over one’s life span. Ability, a, is distributed continuously with a cumulative
distribution function denoted by F (a) and corresponding density function denoted by f(a).
Each individual lives for three periods where each period is of length one. Each period j,
individual i can decide to acquire higher skills or continue with the existing skills. We denote
this decision using an indicator function Iij where Iij = 1 if individual i decides to obtain the
credit, otherwise Iij = 0. If Iij = 0 the individual will continue to earn wages w(sij) based
on her current skill level s. If Iij = 1, she will earn a higher wage w(sij + e) corresponding to
her new skill level. However, acquiring skill requires a fixed amount of credits e and has an
opportunity cost in terms of the wages not earned whilst the time spent for upgrading skills.
We denote this opportunity cost by t which increases with the required units of credits and
a decreases with the innate ability of the individual. More succinctly tij = eai
.
Each individual maximizes her life-time utility based on the consumption cij. We assume
each individual can perfectly smooth their consumption over the life time, financed by her
life-time income W , i.e., W ≡∑3
j=1w(sij)pj(1 − tij).2 We write individual i’s skill choice
problem as the following:
Vi = maxIij
U(ci1) + βU(ci2) + β2U(ci3)
s.t.3∑j=1
cijpj =3∑j=1
w(sij)pj(1− tij), sij = s+
j−1∑k=1
eIik, 0 ≤ tij = Iije
ai≤ 1
where U(cij) denotes the utility from consumption, pj is price in each period, and s is
the lowest skill level that every individual is born with in the first period and skill upgrading
2Relaxing this assumption requires a non-zero consumption cij in each period. Qualitatively the analysisstays unchanged, therefore we make this assumption for simplicity so as to present closed form solutions forthe follow up analysis.
7

is simply an additive process to the previous skill level via earning fixed credit e. We assume
wages are a increasing function of skills (dwds> 0) and concave (d
2wds2
< 0).3 Last, we assume
that inflation is positive (i.e., p1 ≤ p2 ≤ p3).
Under the assumptions discussed there exists thresholds in terms of ability denoted by
A1 and A2 such that a < A1 < A2 < a where:
A1 =w(s)p1e
(p2 + p3)∆1
, A2 =[w(s) + ∆1]p2e
p3∆2
(1)
where ∆1 ≡ w(s+ e)−w(s) is the skill premium for the low-medium skill, ∆2 ≡ w(s+ 2e)−w(s+ e) is the skill premium for medium-high-skill, and ∆1 > ∆2.
If an individual’s ability ai ≤ A1, one’s life-time utility is maximized when not upgrading
skill at all. If an individual’s ability A1 < ai ≤ A2, one’s life-time utility is maximized when
upgrading skill once in the first period. If an individual’s ability ai > A2, one’s life-time
utility is maximized when upgrading skill twice in the first two periods, respectively. We
show detailed solutions in the Appendix. Without loss of generality, we assume that A1 is
below the medium ability while A2 is above the medium ability. That is, a + a < 2A2 and
a+ a > 2A1.
Using this framework, it is straightforward to show that exogenous changes in skill
premium denoted by ∆1 and ∆2 affect the threshold levels. In particular, increase in ∆1
pushes A1 backwards ( ∂A1
∂∆1< 0) while A2 forward ( ∂A2
∂∆1|∆2|) > 0. Increase in ∆2 does not
affect A1 but pushes A2 backwards ( ∂A2
∂∆2|∆1|) < 0. These movements in thresholds in response
to skill premium have implications for the overall skill distribution which are summarized
below:
Proposition 1 Let E(s) denotes the mean and V ar(s) denotes the variation of skills. Sup-
pose ability is uniformly distributed then:
• If | ∂A1
∂∆1| < | ∂A2
∂∆1|∆2|, an increase in ∆1 decreases the E(s) and the V ar(s).
• An increase in ∆2 increases the E(s) and the V ar(s).
Proof. See Appendix.
3These assumptions imply that there is always a positive return for upgrading skills in terms ofwages and that the marginal benefit of upgrading skills diminishes. This is closer to what we observein the data where the median annual earnings of full-time year-round wage and salary workers for ages25 − 34 by educational attainment in USA in 2012 shows an approximate wage differential of $18, 000 forhigh school and college education versus $12, 000 for college and university education. See for example:http://nces.ed.gov/fastfacts/display.asp?id=77.
8

The c.d.fs and the ability thresholds pin down the aggregate effects on the mean and the
variance of skills in response to changes in skill premium. When ∆1 increases, the return
to acquiring subsequent skills for the low ability individuals increases while the opportunity
cost of acquiring subsequent skills for the medium ability individual increases. As a result,
threshold A1 and A2 move further apart. More of the lower ability individuals who would
not have upgraded skills ever will now upgrade skills once while less of the medium ability
individuals who would have upgraded skills twice will now only upgrade skills once. Con-
sequently, conditional on the relative movement of thresholds, the mean and variance will
be affected. If A2 moves less than A1, then on average skills in the population are lower
and the distribution of skills is more homogenous. In the case of an increase in ∆2 the
return of acquiring skills twice increases and hence more of the medium skilled individuals
would acquire skills twice resulting into a higher aggregate mean and more heterogeneous
skill distribution.
2.2 Labor Market Friction
So far the labor market in the previous model is fully efficient in the sense that as long as
the individual upgrades skills he/she will find a job that pays the skill-matching wage each
period. Now we extend the model by assuming that the labor market is inefficient due to the
presence of frictions, i.e., by assuming uncertainty in finding a job with skill-matching wage
after skill upgrading. Such uncertainty could be justified on the basis of a very regulated
labor market that limits turnover rates. We denote by 0 < θ ≤ 1 the probability of finding
such a job with skill-matching wage each period, and by (1− θ) the probability of having a
wage that corresponds to one level lower than the obtained skill. The smaller the θ is, the
more inefficient the labor market is.4
Under this additional assumption and assuming risk neutral agent, the new thresholds
are now also a function of the labor market friction (θ) and are as follows:
A1 =w(s)p1e
θ(p2 + p3)∆1
, A2 =[w(s) + θ∆1]p2e
p3[θ∆2 + (1− θ)∆1](2)
We restrict the range of θ such that the skill upgrading decision is monotonous. This is
similar to assuming that A1 < A2 to facilitate comparison across the two versions of the
model.5 Intuitively, labor market frictions affect the return and opportunity cost of skill
4See detailed mathematical setup in Appendix A.5For A1 < A2 to hold, θ needs to satisfy a certain condition. We prove that the condition is consistent
with 0 < θ ≤ 1. See Appendix A for more details. Moreover, θ takes the range such that skill upgrading ismonotonous. A person who finds skill upgrading once to be non-beneficial is not allowed to upgrade skills
9
upgrading. The return in the case of frictionless market is higher but opportunity cost is
either same or lower for skill upgrading. Introducing such a reduced form of labor market
frictions entails that when ∆1 increases, A1 moves back, however A2 moves forward for small
θ and moves backward for large θ, leaving the effect of ∆1 on the skill distribution ambiguous
and conditional on the size of θ. When ∆2 increases, A2 moves back hence the conclusion
for skill distribution stays the same as the previous analysis except the effect is smaller when
θ 6= 1. We summarize our results as follows:
Proposition 2 Let E(s) denotes the mean and V ar(s) denotes the variation of skills. Sup-
pose ability is uniformly distributed and 0 < θ < 1 then:
• An increase in ∆1 has ambiguous effect on the E(s) and V ar(s) of skills.
• An increase in ∆2 increases both the E(s) and V ar(s) of skills but by a smaller mag-
nitude relative to when θ = 1.
Proof. See Appendix.
The first implication of the above proposition is that the aggregate distributional effects
on skills are less informative since the ultimate outcome does not only depend on the relative
effect of ∆1 on A1 and A2 as in Proposition 1 but also on the size of θ. In the case θ = 1, it is
straightforward to see that A2 increases in response to ∆1 but this is not the case when θ < 1.
This is because the uncertainty in skill-wage matching simultaneously reduces the return
and the opportunity cost of skill upgrading. It is then the relative reduction of these two
components in the skill upgrading decision which determines whether A2 increases, decreases
or stays unchanged.6 It is therefore an empirical question to study the distributional effects
of ∆1 on the skills in such an environment. The second implication of the proposition is that
the effect of ∆2 on A2 is always smaller in a frictional setting. In summary, in the presence of
frictions in the labor market we are agnostic on the distributional effects of the skills when
∆1 changes but we are certain that the effects are expected to be much less pronounced
when ∆2 changes.
twice either.6Let ε be a cut-off of θ such that when θ = ε, reduction in return and cost of upgrading is equal and
therefore | ∂A2
∂∆1|∆2| = 0; above ε, reduction in return is more than the reduction in the cost of upgrading and
therefore | ∂A2
∂∆1|∆2| > 0, and below ε, reduction in cost is more than the reduction in the return of upgrading
and therefore | ∂A2
∂∆1|∆2 | < 0.
10

2.3 Connection with Empirical Analysis
The set-up discussed in the previous section provide us with the theoretical underpinnings
in order to study the effect of changes in skill premium on the skill distribution. The
model provides two empirically testable implications. First for the frictionless market, (a)
an increase in skill premium associated with the lower tail of the skill distribution has negative
effects on both the mean and the variance of the entire workforce’s skills, and (b) an increase
in skill premium associated with the higher tail of the skill distribution has positive effects
on the mean and the variance of the skill distribution. Second, for the frictional market (a)
becomes ambiguous while (b) gets less pronounced.
Our simple theoretical intuition focuses on how the skill distribution is affected by the
shocks to the skill premium, however, we do not explicitly model the origins of such shocks.
In the empirical analysis, as mentioned in the introduction, we will focus on the skill premium
changes which are induced via trade integration for a number of reasons. Trade integration
has recently become one of the primary sources of changes in factor prices such as wages.
This makes it relevant and interesting to study the effect of trade on the skill distribution
not only from an economic but also from a policy point of view. Moreover, despite the
recent discussions on the distributional effects of globalization, empirical analysis explicitly
covering the feedback effect of trade on the skill composition has been so far inhibited due
to empirical challenges, as highlighted in the introduction. Before moving to the empirical
analysis, we first present the main institutional differences between Denmark and Portugal
and then we describe the corresponding dataset for each country.
3 Institutional Background
In this section we explain the main features that define the trade patterns and the labor
market in Denmark and Portugal.
3.1 Trade patterns
Both Denmark and Portugal are highly export oriented economies. The ratio of export
volumes to GDP is in fact on a rising trend for both economies over the period analyzed in
this study (see Figures 2 and 3).
Traditionally Danish and Portuguese trade has been limited to a few trading partners
(in the 90’s about 70% of both Danish and Portuguese trade used to be with 10 countries,
11

mostly EU members) but more recently both countries have also started to trade with
emerging economies, such as the BRICs, east Asian countries and the formerly communist
countries. Figures 4 and 5 show that export volumes for both countries have been on a very
steep and positive trend when we look at destination markets outside the developed world,
especially China. Thus despite the maturity of the Danish and Portuguese economies, the
process of trade integration is still evolving for both countries for the period considered in our
analysis. Another similarity across the two economies is in terms of the export composition,
as both countries feature a large export shares within machinery equipment, textiles, food
and transport (OECD, 2013, 2014).
3.2 Labor Market and Educational Institution
3.2.1 The Danish Institutions
Following from the long-standing tradition for open trade, globalization is generally seen as a
positive force in Denmark. Indeed, the flexibility of the labor market means that Denmark is
in a better position than many European countries to adapt to the changes in global market
conditions brought about by the emergence of low-cost producer countries. Cornerstones
of the Danish model are in fact a high level of labor mobility and generous social security
schemes. The absence of severance pay lowers hiring and firing costs, reduces the matching
frictions and facilitates firms to adjust the quality and size of their workforce. Moreover,
although workers are not protected by stringent employment rules, they bear relatively low
costs of changing employers and have easy access to unemployment or social assistance
benefits and activation programs. In fact, Danish replacement ratios are among the most
generous in the world.
Another key feature of the Danish labor market is related to the organization of the
industrial relations. Historically all labor market issues have been settled in centralized
negotiations between representatives for employers and employees without political interfer-
ence. The social partners take full responsibility for wage bargaining and wage setting. They
also make agreements on normal working hours and set rules together with the government
for labor protection with respect to overtime and work environments. Moreover about 80%
of all employees are members of a trade union in Denmark. The wage and working hours
formation used to be highly centralized with biannual negotiations between trade union or-
ganization called Landsorganisationen i Danmark (LO) and Danish employers’ federation
(DA) in the private sector. Wage bargaining has recently become much more decentral-
ized. Since the early 1980s, an increasing share of wage bargaining descended to the firm
12

(individual employee) level, which increased the weight of employer and employee roles in
the resulting internal firm wage structure. As found in Eriksson and Westergaard-Nielsen
(2009), the within-firm wage variability in Denmark represents more than 80 percent of the
total variability observed among all workers.
Finally the Danish government generally provides abundant subsidies for individuals skill
upgrading and education. Formal schooling is largely provided for free at both the secondary
and tertiary level and a monthly income transfer, i.e., statens uddannelsesstøtte, of about
700 dollars is provided to all Danish students during the entire course of their undergraduate
and master studies. As a result of these policies, the educational level of the workforce is
very high by international standards. In 2012 the population share having attained upper
secondary education far exceeds the OECD average. The share having attained tertiary
education is also above the OECD average (OECD, 2013, 2014). Moreover life-long learning
opportunities are very accessible to those who are unemployed through the participation to
active labor market policies.
As a result of these liberal educational policies combined with a very flexible labor market
with limited matching frictions, the Danish workforce seems to be more equipped to adjust
to skill premium changes induced by trade. Such responses therefore are more likely to be
reflected in the changes in the skill distribution and composition.
3.2.2 The Portuguese Institutions
Contrary to the Danish labor market, the Portuguese one is, according to the OECD index
of employment protection legislation strictness, one of the most rigid labor market in the
world. As a result, Portugal features low labor turnover rates, very limited transitions be-
tween employment and unemployment, and very long unemployment spells (Blanchard and
Portugal, 2001). Portugal is also characterized by a very regulated industrial relations sys-
tem, where the wage setting consists of mandatory minimum wages and the widespread use
of (centralized) collective wage bargaining at the sector level (Cardoso and Portugal, 2005).
Roughly 90% of private sector jobs in Portugal are covered by sector-wide collective agree-
ments negotiated by employer associations and trade unions (Addison et al., 2016). Wage
clauses in collective agreements are typically updated every year and firm-level collective
bargaining covers a low proportion of the workforce (less than 10%).
The resulting collective agreements are both extensive and general. They are extensive
in the sense that they cover many categories of workers. They are also general as they
only set minimum working conditions that become binding for the entire industry through
administrative extension. The content of the agreements focuses on wage floors for each
13

category of workers, overtime pay, and the normal duration of work.
Under these conditions, the links between the wage growth defined by collective agree-
ments and the actual economic conditions prevailing at the micro (firm) level can be very
loose. Whatever the minimum wage level agreed upon for each category of workers at the
collective bargaining table, firms are free to pay higher wages, and they often deviate from
that benchmark, adjusting it to firm-specific conditions. As a consequence, employers have
the possibility of tailoring remunerations to their prevailing economic circumstances (see for
e.g., Cardoso and Portugal, 2005). On the other hand, this mechanism also discourages the
entry of new firms and competition in product markets, as one way through which new firms
can enter the market is to pay lower wages than incumbents for some time (OECD, 2014).
Overall, Portugal is characterized by very high levels of wage inequality, which suggests that
the wage setting is relatively unconstrained by institutional forces.
As far as education is concerned, Portugal is characterized by a workforce which is
intensive in low skills. Over 60% of the 25-64 population has not yet completed upper
secondary education, which is the third largest share in the OECD area (OECD, 2014).
Despite the progress made in the reduction of early school leaving rate during the most
recent years, the Portuguese indicators remain far above the targets set for Europe in 2020.
In general, tuition fees are higher than the minimum recommended in Portugal and
student social support is very limited. Full time students enrolled in Bachelor or Master
programs are charged an average tuition fee of around 950-1250 euros per academic year.
For PhD degrees, the average tuition fee amount to approximately 3000 euros per academic
year. As a result, Portugal is also one of the OECD countries where the association between
students’ socio-economic background and their performance at school is higher, and children
from highly educated parents are much more likely to participate in higher education than
others, compared to other countries (OECD, 2014). Finally the Portuguese active labor
market policies are characterized by low level of vocational training for the unemployed.
Spending on active labor market policies (ALMPs) increased at the beginning of the crisis,
peaked in 2008 at 0.63 per cent of GDP, but declined in the following years. The expenditure
on ALMPs in Portugal is clearly below that of the Nordic countries which is above 1 per
cent in Denmark from 2009 onwards (ILO, 2014).
A very rigid labor market combined with scarce public resources available for education
and retraining are very likely to increase the frictions that hinder how the skill distribution
adjusts to globalization.
14

4 Data
4.1 Data for Denmark
Information about firms and workers is collected from several sources at the Danish official
statistical institute (Denmark Statistics): the “Integrated Database for Labor Market Re-
search” (IDA), the “Accounting Statistics Registers” (FirmStat), and the “Foreign Trade
Statistics Register” (Udenrigshandelsstatistikken). From the population of all firms, we keep
only firms which are comprised by all these registers over the period from 1993 to 2012.
Moreover we only proceed with private companies. To avoid both self-employment, typical
migrant businesses, we keep firms with more than 1 employee.
IDA is a longitudinal employer-employee register, containing information on the age,
gender, nationality, place of residence and work, education, labor market status, occupation,
and wage of each individual aged 15-74 between 1980 and 2012. The information is updated
once a year in week 48. Apart from deaths and permanent migration, there is no attrition
in the data. The individual information in IDA is used to estimate our skill measure, as
explained in the next section. This is then aggregated at one of the most detailed classi-
fication of the Danish Industrial activities (4-digit level) for the purpose of our empirical
analysis.7 Individual-level variables in IDA are also used to measure a number of workforce
characteristics at the industry level: the share of workers with secondary and post-secondary
education; the percentage of male employees; the average age and work experience. Because
we can track people along the years, we can also establish the average tenure of all employees.
In order to deal with outliers, top and bottom 1% of wage earners are excluded every year.
FirmStat is a firm registers which provide the annual value of capital stock, firm pro-
ductivity and industry affiliation.8 This data captures some of the salient firm-level char-
acteristics, which are then aggregated at 4-digit level classification of the Danish Industrial
activities.
The “Foreign Trade Statistics Register” shows export sales and the number of exported
products at the firm level. These data are available both at specific destinations and aggre-
gated over all destinations. Exports are recorded in Danish kroner (DKK) according to the
7This industry classification corresponds to the 4-digit of the European classification,NACE rev.2. For more details on the Danish Industrial classification, please refer tohttp://dst.dk/da/Statistik/Publikationer/VisPub.aspx.
8The capital stock comprises the sum of the values (in Danish kroner) of land, buildings, machines,equipment and inventory. Firm productivity, which is the most important predictor of the export behaviorof a firm in the recent trade theory, is calculated as turnover per employee in logarithmic scale (i.e., laborproductivity). We deflate all monetary values using the World Bank’s GDP deflator with 2005 as the baseyear.
15

8-digit Combined Nomenclature as long as the transaction is at least worth 7500 DKK or
involves goods whose weight is at least 1000 kg.9 To construct our instruments, as explained
in the next section, we aggregate these flows to the 6 digit Harmonized System (HS) in
order to improve the merge to the COMTRADE data. Moreover, as we did for all the other
variables included in the empirical analysis, we calculate export sales at 4-digit level of the
industry classification.
4.2 Data for Portugal
Our analysis for Portugal is based on data from Quadros de Pessoal (QP). QP is, by con-
struction, a longitudinal matched employer-employee dataset. This is an annual mandatory
employment survey collected by the Portuguese ministry of employment covering all firms
(and each of its establishments) with at least one wage earner. Every year firms with paid
employees are legally obliged to fill in a standardized questionnaire, reporting information
at three levels: the establishment (location, industry, and employment), the firm (location,
industry, employment, sales, ownership, and legal setting), and each of its workers (gender,
age, education, skills, occupational category, employment status, earnings, citizenship, and
tenure). Self-employed individuals without employment are, hence, not covered in QP.
The information on earnings is very detailed, precise, and complete. It includes the base
wage (gross pay for normal hours of work), regular benefits, and overtime pay. Because
the information on earnings is reported by the employer, it is unlikely to be subject to
measurement error relative to worker-provided earnings data. The fact that the information
contained in the QP survey must by law be available in a public space at the establishment
further reinforces our trust in the information. We construct our monthly wage measure by
taking into consideration both workers base salary and any regular earning supplements. In
order to deal with outliers, top and bottom 1% wage earners are excluded every year.
Our analysis is based on all firms comprised by the registers over the period 1993-2011.10
Individual-level data files were used to estimate our skill measures and to characterize the
workforce (share of workers with secondary and tertiary education, the percentage of male
employees, average age, and work experience). Workforce and firm characteristics (namely
labor productivity) were then aggregated at the industry-level (3-digit).11 Trade information
97500 DKK are about 1000 euros at the time of writing. Since the introduction of the euro currency, theDanish Central Bank has adopted a fixed exchange rate policy vis-a-vis the euro.
10The year 2001 is missing as information for this year was not collected by Statistics Portugal.11In order to perform our empirical analysis over the whole period (1993-2011), we standardize all industries
according to the earlier version of NACE rev. 1.1, which is more aggregate than later versions (NACE rev2.). This gives around 80 (3-digit) industries in total every year.
16

at the industry-level was obtained from Statistics Portugal and merged with QP data. To
construct our instruments, we used trade information from COMTRADE at the product-
level. The link between each 3-digit industry, the respective 4-digit products exported (im-
ported), and the country of destination (origin) was also obtained from Statistics Portugal.
4.3 Descriptive statistics
Table 1 groups the descriptive statistics of all our main variables for both Denmark and
Portugal. Denmark features on average a larger (smaller) ratio of the 50th (90th) to the
10th (50th) percentiles of the earnings distribution compared to Portugal. As we will explain
in the next session, those wage ratios will be interpreted in the empirical analysis as proxies
for the low-medium skill and the medium-high skill premium. The first panel of Figures
6 and 7 describe their over time patterns: for both Denmark and Portugal the medium-
high skill premium is on a positive trend, whereas the development of the low-medium
skill premium looks very different across the two countries. Whereas for Portugal the wage
ratio, w50w10
, steadily increases up to 2008, the same ratio is on a flat, slightly negative, trend
for Denmark, even if its pattern seems to be very noisier than its Portuguese counterpart
especially in the last part of the period observed.
As far as the skill variable is concerned, we will proceed with a number of alternative
measures. The first three definitions represents our main measures and they are all estimated
from the additive “two-way” worker-firm effects model (Abowd et al., 1999), as explained in
the next section. These variables represent a good proxy for all the skills acquired formally
at school and informally on the labor market. As a robustness check, we will also provide
the results on the basis of two other measures of skills. The first one is based on years
of education (definition 4) whereas the second one is a multidimensional index drawn from
Portela (2001) (definition 5). According to definitions 4 and 5, Denmark has on average a
higher endowment of skills compared to Portugal.12 The second panel of Figures 6 and 7
report the overtime developments of the first two moments of skills measured by using the
fourth definition of skills, which is the only one directly comparable across the two countries.
These figures show that both the average and standard deviation of skills has been steeply
increasing for Denmark. The same holds true for Portugal, even though the positive trend
on the mean and the standard deviation are much less pronounced compared to its Danish
counterparts. In the empirical analysis we will analyze how much of these developments
12Direct comparison of definitions 1,2 and 3 is not feasible given that they originate from different measuresof wages, as it will be clearer in the next section.
17

in the skill distribution are specifically explained by the skill premium changes induced by
overtime increases in export or import activity.
Our trade measures will be mainly based on the export volumes, although in a robustness
check we also look at the import volumes. Denmark features higher volumes of exports,
overall and by destination, and of imports compared to Portugal. Finally we also consider a
number of industry-level characteristics, as control variables. Specifically we include in the
analysis a measure of capital intensity13 and productivity as proxies for technology at the
industry level and a whole host of workforce composition characteristics, as indirect measures
of the quality of the labor force in each industry. Compared to the Portuguese one, the
Danish case seems to be characterized by higher level of productivity, a larger fraction of
workers with either secondary or tertiary education and shorter employees’ tenure on average.
Similar statistics across the two countries are recorded for the share of male employees and
for employees’ average age and work experience.
5 Methodology
We organize this section into two parts. The first part describes how we calculate our main
measure of skills. The second part then discuss how we empirically test the main theoretical
predictions on the first two moments of the skill distribution.
5.1 Skill measure
Our point of departure for the measurement of the main skill variables is the following
gender-specific wage equation a la Abowd et al. (1999):
lnwijt = αi + ψj(i,t) + β1Xit,+ εijt (3)
where wijt is the gross wage earned by individual i in firm j in year t.14
Xit is a vector of individual specific controls that changes overtime. We include in
13Unfortunately capital intensity is not available for Portugal. We partially compensate for this importantmissing information by including 2-digit industry fixed effects in our regression models.
14For Denmark the wage variable is represented by the annual gross wages. The annual wages are in realterms and adjusted for possible unemployment spells during the year. In additional analysis for Denmarknot reported in the paper, we get similar results by focusing on wages corresponding to the November spellonly. In this case, for those employees who work for fewer than 365 days at the firm corresponding to theNovember spell (around 35 percent), we annualize their wages by using information on the duration of thesame spell. For Portugal we use wages for the month of October of each year.
18

X the workers’ education interacted with year dummies. In addition, we also control for
other factors that might affect wages such as age, experience and tenure and their squares.
The parameters αi and ψj(i,t) are respectively the individual and firm specific fixed effects.
We estimate this additive “two-way” worker-firm effects model by using the methodology
developed in (Abowd et al., 1999) for each gender separately. The results from this additive
fixed effects model are reported in Table 2 and look fairly comparable in terms of signs
estimated on the main coefficients across the two countries.
This methodology is based on the identification of connected sets of firms which are firms
that have movers in common. Due to the high mobility that characterizes the Danish labor
market and the relatively long time period considered, the largest connected set contains
more than 99% of the workers and firms in the sample. Moreover this methodology relies
on the assumption of “conditional exogenous mobility”. As suggested in Card et al. (2013)
for Germany and in Card et al. (2016) for Portugal, we empirically assess its plausibility for
the Danish case by considering all possible cases in which this assumption may be violated.
First, we consider the case of sorting based on the idiosyncratic employer-employee match
component of wages. This type of sorting is problematic because workers are paid differently
at each firm depending on the match component. Absent any match effect, the average wage
gains and losses from moving between high and low wage firms are expected to be symmetric.
The existence of match effects however, will tend to offset the losses associated with moving
to a low wage firm. If all transitions are voluntary and selection is based only on the match
component, movers would experience no wage losses.
Following Card et al. (2013), we construct mean log co-workers wages for each person in
each year. We assign each worker to a quartile of the co-workers wage distribution. We do
it separately for men and women. In each year we then derive average wages of movers by
quartiles. Movers are defined as those who move from one firm to the other and who can be
observed for two consecutive years in both the sending and the receiving firm. Figure 8 and
9 present the results of this analysis using data for male and female workers in Denmark.
The corresponding figures for Portugal can be found in Card et al. (2016). For clarity, only
the wage profiles of workers who move from jobs in quartile 1 and quartile 4 are shown in the
figures. Similar to Card et al. (2016) among others, we find rather symmetric wage losses
and wage gains for workers moving from high to low paying firms and the opposite. We
do not find big wage changes for workers moving across firms paying similar wages. This
suggests that the sorting based on a match component is likely to play a minor role in our
setting.
A second case in which the exogenous conditional mobility is violated is when mobility is
19

related to unobserved and temporary firm specific shocks. In this case for example, workers
might be more likely to leave firms that experience negative shocks so as to join those firms
which experience positive shocks. As in other studies however, we fail to find evidence in the
data of particular dips in the wages of leavers or exceptional growth in the wages of joiners
(Figures 8 and 9).
Finally a third problematic case might arise if mobility is related to unobserved tem-
porary individual shocks. This is the case for example, if workers who are performing well
earn higher wages in the sending firm and they move to high paying firms and those who
are performing worse experience wage cuts prior to moving to low paying firms.15 Under
this hypothesis, we would observe different trends prior to moving for workers who end up
in high versus low paying firms. We do not find particularly different pre-trends for workers
moving to high versus low paying firms (Figures 8 and 9), suggesting that temporary shocks
have a a small effect on mobility in our sample. All in all these findings seem to support the
exogeneity condition discussed above.
In the main analysis, our skill variable is then constructed for each male and female
worker from equation by considering the systematic part only, i.e. β1Xit. In an alternative
specification we also calculate the skill measure by excluding either age or both age and
tenure from the systematic part, as those variables may be mechanically related to wages
and consequently may not reflect any upgrading of the skill endowments. We then aggregate
all these skill measures at the industry level.
5.2 Skill premium and skill distribution
We now present the empirical set-up used in order to test the main predictions described in
the Section 2. Specifically we present the regression models in which we investigate how the
trade induced changes in the skill premium affect not only the average skill levels but also
the skill variance in the economy. The theoretical underpinnings suggest that the effects on
the mean and variance of skills depends on the type of skill premium considered. To explore
this hypothesis, we first estimate the following equation:
¯skill premiumjt = α + β′Xjt + γtradejt + δj + δt + εjt (4)
where the dependent variable is measured as the ratio between the 90th and the 50th
15This might for example also be the case when ability is slowly revealed overtime.
20
percentile of wage distribution (w90w50
) of industry j at time t, as a proxy for the medium-high
skill premium, i.e. ∆2 in our model. Or alternatively as the ratio between the 50th and
the 10th percentile of wage distribution (w50w10
) of the industry level j at time t, as a proxy
for the low-medium skill premium, i.e. ∆1 in our model. We measure the variable tradejt
with the industry-level export volumes aggregated over all destinations.16 The vector Xjt
includes a set of confounding factors that may effect the skill premium such as productivity,
capital intensity and workforce composition characteristics (such as the share of tertiary
educated employees and male workers) for each industry j. The specification of equation
(1) is completed with a full set of industry fixed effects denoted by δj and time fixed effects
denoted by δt.
To obtain an unbiased estimate of the parameter γ in equation (4), we instrument the
export volume variables with exogenous trade shocks at the industry level. Exogenous trade
shocks are constructed using changes in the world import demand for each product by using
the COMTRADE data following the IV approach employed in Hummels et al. (2014) and
aggregated at the industry level. We denote our instrument variable by mjt. More specif-
ically, the instrument is constructed jointly for the total exports of Denmark and Portugal
as follows:
mjt =C∑c=1
P∑p=1
expjcp baseyearexpj baseyear
Icpt (5)
where Icpt is each country c’s total purchases of product p from the world market (less
purchases from Denmark) at time t (Hummels et al., 2014). The variable expjcp baseyear are
the industry j’s export volumes of product p to the destination c at the base year (which is
the pre-sample year, 1993 in our case) and expj baseyear are the total export volumes within
each industry j. These shocks are external to Denmark and they vary across destinations,
countries and products. The weightsexpjcp baseyear
expj baseyearare the base-year (1993) export shares,
which are industry-specific and should be exogenous to over time changes in the level or the
type of technology, which may potentially affect both exports and the skill premium at the
industry level.
Since our theoretical model does not explicitly model the causes for skill premium
16In an alternative specification implemented in the robustness checks section, we either measure theindustry-level export volumes separately for “north” and “south” destinations or we use import volumesover all destinations are as a trade variable. “North” includes countries of North America, Oceania, Westernand Southern Europe (excluding the new EU members of the 2004 enlargement). All the other countries inthe world are considered under the category of “South”.
21

changes, we are agnostic about the sign of γ. However, following the standard practice
in this field (Costinot and Vogel, 2010), we can predict the separate effects of the export
volumes to north and south on the skill premium. Then the aggregate effect of all export
volumes is going to be a combination of the effects stemming from the two types of trade.
Specifically, we expect the export volumes from Denmark or Portugal to south to have a
negative impact on the wage differentials corresponding to lower tail of the skill distribution
and a positive impact on the wage differentials corresponding to the higher tail of the skill
distribution. South typically has lower endowment of skills, i.e. is less skill abundant, it
is therefore very likely that the skill premium for the upper tail of distribution, i.e., w90w50
,
increases on average. This is due to the fact that: 1) the employment share in tasks with
high skill intensities increases within the economy ; 2) high skill workers have a comparative
advantage in tasks with high-skill intensities (they experience a higher wage increase than
the other workers). The opposite is expected to happen to the wage of those skills which are
comparable to those prevailing in south, i.e., to w50w10
.
The export volumes to north are expected to have an ambiguous effect on our measures
of wage differentials. The sign on the coefficient γ estimated on w90w50
or w50w10
is therefore
not clear cut a-priori, as it depends on the difference in skill diversity between Denmark or
Portugal and their trading partners on average. If the distribution of skills in Denmark or
Portugal is on average more compressed and more homogeneous than the one prevailing in
north, then the γ estimated on w90w50
(w50w10
) is expected to be negative (positive) and we should
observe wage convergence. This occurs because exporting industries tend to specialize in
activities that require workers with similar skills to work together, i.e. technologies demand-
ing skill homogeneity and complementarity. The opposite holds if the distribution of skills
in Denmark or Portugal is on average more heterogeneous than the one prevailing in north,
i.e., we should observe wage polarization, as industries specialize in production processes
requiring skill diversity, i.e. industries intensify the adoption of sub-modular technologies.
As in our baseline specification, we mainly focus on total export volumes aggregated over
all destinations, we will estimate a coefficient γ that represents a combination of all the
mechanisms involved in the exporting activities to both north and south.
Once we have estimated equation 4, we then predict the skill premium at the industry
level (i.e. the exogenous component due to trade shocks) and we plug the latter in the
following regressions in order to test how overtime changes in the skill premium induced by
trade subsequently affect not only the average skills denoted by ¯skilljt but also skill diversity,
which is measured by the standard deviation of skills and denoted by σ(skilljt):
22
¯skilljt = α + β′Xjt−1 + γ
′
aveˆskill premiumjt−1 + δj + δt + εjt (6)
σ(skilljt) = α + β′Xjt−1 + γ
′
dispˆskill premiumjt−1 + δj + δt + εjt (7)
where the explanatory variable ( ˆskill premiumjt−1) is calculated as (γivtradejt−1), with
γiv estimated from equation 4 using our IV approach.17 The first two moments of the skill
distribution at the industrial level j will be based on the skill variable, as described in the
previous sections.
6 Results
Our main results for Denmark can be summarized as follows. On the one hand, the skill
premium associated to the lower (upper) tail of the distribution are negatively (positively)
affected by trade activity. On the other, an increase in these trade-induced skill premium has
asymmetric effects on the skill distribution: (1) an increase in the skill premium associated
with the lower tail of the distribution results in lower average skills and in a more homogenous
skill distribution, (2) an increase in the skill premium associated with the upper tail of the
distribution increases the overall average skills and it also makes the skill distribution more
heterogenous. Interpreting the results from the first and second steps jointly together allows
us to conclude that trade integration increases the overall mean and standard deviation of
the skill distribution in Denmark.
For Portugal, we find instead that trade has a significant and a positive effect on both
measures of skill premium. However, these trade-induced skill premium changes don’t seem
to influence the overall skill distribution, i.e., both the average level of skills as well as the
overall skill dispersion remain largely unaffected. The stark difference in the distributional
effects across the two countries further highlights that Denmark’s “flexicurity” model al-
lows its labor market to smoothly adjust to changes stemming from globalization and trade
integration. Portugal on the other hand is characterized by extensive employment protec-
tion legislations and limited support for skill upgrading opportunities both of which hinder
the ability of the workforce to respond to trade shocks efficiently. Therefore among other
differences across the two countries labor market flexibility may play an important role in
explaining such heterogenous responses to trade-induced skill premium changes. In the fol-
17Due to collinearity issues, we have to include the predicted changes in the skill premium,ˆskill premiumjt−1, separately for w90
w50 and w50w10 in equations and . We further investigate whether this
omission leads to biased coefficients in one of the last robustness exercises reported in the results section.
23

lowing section, we first discuss in details the baseline results and then present a whole host
of robustness checks that allows us to corroborate our main findings.
6.1 Main Results
The estimated coefficients of the first and second steps of our econometric specification
are presented in Table 3. In the first stage we tease out the impact of the trade on our two
measures of skill premium, by instrumenting the export volumes with shocks to world import
demand, as in Hummels et al. (2014). For Denmark, we find that an increase in trade volumes
induce wages for high skilled workers to diverge and wages for low skilled workers to converge.
Specifically, a standard deviation increase in the export volumes causes approximately 1 (2)
percent increase (decrease) in w90w50
(w50w10
).18 For Portugal both measures of wage gaps are
positively affected by an increase in the trade volumes and the magnitudes involved are
larger than the ones estimated for the Danish case. A standard deviation increase in the
export volumes implies approximately 8.5 (4.3) percent increase in w90w50
(w50w10
).19
In the second step we estimate the impact of an increase in the predicted skill premium
induced by the log of export volumes on the first two moments of the overall skill distribution,
by using the first definition of skills. The effect of trade-induced skill premium on the overall
skill distribution are significant for the Danish case but not for Portugal. For Denmark, a
standard deviation increase in the predicted skill premium w90w50
(w50w10
) leads to a 9 percent
increase (6.5 percent decrease) in the overall mean of skills. Moreover, a standard deviation
increase in the predicted skill premium w90w50
(w50w10
) leads to a 10 percent increase (marginally
insignificant) in the overall standard deviation of skills. Combining the results from the
first and the second stage reveals that the proportion of those individuals with medium skill
upgrading their skills to the next level is higher as a result of the decrease in the low-medium
skill premium and the increase in medium-high skill premium. As a result, the Danish skill
distribution shifts to the right and becomes more dispersed.
For Portugal, none of the effects estimated for w50w10
and w90w50
are statistically significant.
Moreover, despite the statistically and economically significant impact of export volumes on
both measures of skill premium, these trade-induced changes in the skill premium fail to
affect the overall skill distribution.20
18These figures are obtained by using the averages of w90w50 and w50
w10 and the standard deviation of the logof the export volumes from Table 1.
19These figures are obtained by using the averages of w90w50 and w50
w10 and the standard deviation of the logof the export volumes from Table 1.
20The large sizes involved in the skill premium changes estimated for Portugal also allow us to dismissthe surmise that for these distributional effects to show up it is necessary that the skill premium changes
24

These results are intuitive and in line with our theoretical predictions. Contrary to an
economic setting where the responses to changes in skill premium are hindered by a number
of domestic frictions (such as high educational costs and a very restrictive employment
protection legislation), flexible labor markets (such as the Danish one) are expected to show
significant responses to trade in terms of the skill distribution.
6.2 Robustness checks
6.2.1 Alternative skill definitions
In this section, as part of our robustness checks, we first evaluate the variations in the
coefficients estimated for the second step that result when the skill variable is calculated in
various ways. First, we rule out age (in skill definition 2) or both age and tenure (in skill
definition 3) from the skill measure based on the systematic component of wage regression in
equation 5.1. This is done to take into account those cases in which age or tenure in the wage
regressions do not exactly reflect the upgrading of the skills acquired in the labor market but
rather a mechanical improvement of wages related to seniority. Buhai et al. (2014) document
for example that there are significant returns to seniority in Denmark and Portugal and the
effects are twice as large in Portugal relative to Denmark. The results obtained from skill
definitions 2 and 3 are reported in the first and second sub-panels of Table 4 for Denmark
and Table 5 for Portugal. Reassuringly, these findings are fairly comparable to the main
results reported in Table 3, especially in terms of the impact on the overall average skills.
Given that the first three definitions of skills based on the AKM model requires the rather
restrictive assumption of “conditional exogenous mobility”, we also present the results by
using two additional alternative measures of skills, that are perhaps less controversial within
the labor economics literature and also allow a direct comparison with the other existing
studies. The first one simply relies on the workers’ years of education as in Blanchard and
Olney (2015) and as such it does not require any particular assumption. However the main
limitations of this measure is that it only captures those skills acquired through formal
schooling and it does not adjust the quality of skills. This corresponds to skill definition 4 in
Tables 4 and 5. The second one is drawn from Portela (2001) and it is a multidimensional
index of workers’ human capital. Specifically, this index is constructed at the worker level by
combining information on employees’ years of education, work experience and unobserved
ability estimated from a standard mincer equation with individual fixed effects, as follows:
exceed a certain threshold. We observe in fact that skill premium changes of smaller can indeed affect theskill distribution, as it is shown in the Danish case.
25

skilli = mschool
(0.5 +
e(schooli−mschool)/sschool
1 + e(schooli−mschool)/sschool
)(0.5 +
e(expi−mexp|schooli)/sexp|schooli
1 + e(expi−mexp|schooli)/sexp|schooli
)(
0.5 +e(effecti−meffect|schooliexpi)/seffect|schooliexpi
1 + e(effecti−meffect|schooliexpi)/seffect|schooliexpi
)
where m(s)school, m(s)exp and m(s)effect are respectively the mean (standard devia-
tion) of years of education, work experience and unobserved ability in the economy, whereas
schooli, expi and effecti are the same variables measured for each worker i. The skill mea-
sure skilli assumes that all the workers entered the labor market with the average education
in the economy, mschool. This average is then adjusted to take into account worker i’s
relative position in the distribution of schooling. This correction is computed by considering
the cumulative logistic distribution. The next step consists of adjusting the skill measure
for the work experience by considering it as complementary to education, i.e. by comparing
only the experience of individuals with the same years of education. This second correc-
tion reflects the fact that individuals with the same years of education may have different
skills as a result of a different work experience. After adjusting the years of education for
the work experience, we use a similar procedure to correct for the dispersion of unobserved
ability within those workers who have the same schooling and experience. This allows us to
calculate the measure of skills of worker i, skilli, which corresponds to skill definition 5 in
Tables 4 and 5.
By using these two additional alternative methods to calculate the first two moments of
the skill distribution for the whole economy, we find that the effects of the skill premium
changes induced by trade on the skill distribution are fairly similar in sign with those reported
in Table 3 for Denmark. However the magnitudes involved in these definitions are smaller
(larger) compared to the baseline definition, if we look at the impact of w90w50
on the mean
(the standard deviation) of skills for the whole economy in Denmark. If we take the skill
definition 4, for example, a standard deviation increase in the predicted skill premium w90w50
leads to nearly a 4 (30) percent increase in the overall mean (standard deviation) of skills.
As in the baseline results, none of the effects on the skill distribution are significant for
Portugal.
6.2.2 Alternative measures of trade activity
In this section, we proceed by assessing the sensitivity of our main results to alternative
measures of trade activity. First, we investigate whether the effects triggered by trade on
26

our measures of skill premium are heterogeneous across destination markets. We therefore
distinguish between the export volumes directed to the developed economies (north) and
those targeting the developing countries (south). Table 6 includes the results separately for
north and south obtained for the first and the second step of our empirical strategy. The
first sub-panel of Table 6 considers the Danish case and it reveals that most of the effects
estimated on the export volumes on our measures of wage differentials are driven by the
trade with south, as the impact of trade with north is never statistically significant. The
fact that w90w50
increases with the exports to south and that w50w10
is negatively affected by
the same type of trade is consistent with the Samuelson-Stolper hypothesis (Costinot and
Vogel, 2010). The combined effects of trade with south on the skill distribution are fairly
consistent with the baseline results, i.e. the changes in the skill premium triggered by trade
with south induces a shift of the overall mean to the right and an increase in skill dispersion
in Denmark. The second sub-panel of Table 6 presents the results for Portugal and shows
that for Portugal there is not enough variation to separately identify the impact of trade
with north and south on our measures of skill premium.21
In the next sensitivity exercise, we replace the export with the import volumes as a
measure of trade activity. For these estimations, we re-calculate our instrument by looking
at the changes in the world export supply for each product (minus Denmark’s or Portugal’s
export volumes) gathered by COMTRADE data. Our assumption is that a measure based
on the rest of the world’s export supply can be safely assumed to be exogenous to the Danish
or Portuguese import activities. The results based on this alternative measure of trade are
reported in Table 7. The estimates for both Denmark and Portugal are very similar to our
main findings, i.e. import volumes affects our measures of skill premium in both economies
but the impact on the first two moments of the skill distribution is statistically significant
only in the Danish case. A standard deviation increase in the predicted skill premiumw90w50
(w50w10
) leads to a 5 percent increase (3.5 percent decrease) in the overall mean of skills.
Moreover, a standard deviation increase in the predicted skill premium w90w50
(w50w10
) leads to
a 12 percent increase (9 percent decrease) in the overall standard deviation of skills. The
impact of the import volumes on the skill distribution is therefore fairly comparable to the
one estimated when trade activity is proxied by the export volumes instead.
We finally investigate whether the impact of trade on the skill distribution depends on
type of product exported. Blanchard and Olney (2015) show that the composition of trade
plays a crucial role in affecting the incentives for the acquisition of education. Growth in
less skill-intensive exports depresses average educational attainment while growth in skill-
21The second stage cannot be estimated as we only include those skill premium changes that are signifi-cantly related to trade activities in the first stage.
27
intensive exports increases schooling. However, the estimated coefficient on the overall ag-
gregate measure of exports may hide these opposite effects on the acquisitions of skills. We
therefore construct the export volumes variable separately for high or low skill intensive in-
dustries. To do so, we draw a distinction between industries with R&D expenditures above
the overall economy average (regarded as high-tech industries) and those with below average
R&D expenditures (defined as low-tech industries). Information on R&D expenditures at
the 3-digit NACE industry level is retrieved from the OECD database for both Denmark and
Portugal. Table 8 and Table 9 respectively present the results for trade activity separately
for high- and low-tech industries.
Unlike the evidence reported in Blanchard and Olney (2015), we don’t find substantially
different patterns across these two groups of sectors. Our results are fairly consistent with
the baseline evidence reported in Table 3. On the one hand for the Danish case, the overall
mean and standard deviation of skills is positively (negatively) affected by predicted skill
premium w90w50
(w50w10
) in both types of sectors. However the magnitudes involved are larger
when we focus on the high-tech industries compared to the main analysis. A standard
deviation increase in the predicted skill premium w90w50
(w50w10
) leads to a 20 percent increase (5
percent decrease) in the overall mean of skills. Moreover, a standard deviation increase in
the predicted skill premium w90w50
(w50w10
) leads to a 33 percent increase (8 percent decrease) in
the overall standard deviation of skills.
On the other hand for Portugal, while the impact of the predicted skill premium on the
standard deviation of skills is not significant as in the main analysis, the same impact on the
average skills is negative and significant, at least in the high-tech sectors. These results alone
may be interpreted as suggestive evidence of the skill convergence hypothesis resulting from
a specialization in technologies that require skill homogeneity, which may depress average
skill in the tech-industry (Costinot and Vogel, 2010). However the magnitude involved in
the estimated effect on the average skills is very limited. Moreover this interpretation is not
supported by the result on skill diversity and it is at odds with our theoretical propositions
on the role of frictions in the labor market.
6.2.3 Alternative IV strategies
One of the main assumptions behind our identification strategy is that changes in non-Danish
(or non-Portuguese) imports from non-Danish (or non-Portuguese) markets are orthogonal to
industry-specific shocks occurring in either Denmark or Portugal. We deem this assumption
plausible for our two economies given that both Denmark and Portugal are small countries
of less than 10 million people and represents a small share of trade, both in the aggregate
28

and for individual partners and products. Moreover all of our specifications include year and
industry dummies beside time-varying controls. However in order to deal with correlation
between the instrument and the residual in the wage differentials in equation 4, we exclude
those countries which are most similar to either Denmark or Portugal in terms of business
cycle. We therefore rule out from equation 5, Germany, Sweden and the USA in the Danish
application and Spain, France and Germany for Portuguese application. This is done in
order to address the concern that higher imports from these markets may be correlated with
the error term of equation 4, if they are triggered by demand shocks correlated with those
occurring in Denmark and Portugal. The results obtained from this alternative specification
of the instrument are reported in Table 10 and fairly comparable to those obtained in the
baseline analysis.
Next, as an additional check, we re-estimate our baseline specification excluding indus-
tries in which demand or technology shocks are more likely to be correlated across coun-
tries. Following Colantone et al. (2015), these industries are: manufacture of coke, refined
petroleum products and nuclear fuel (NACE 23); manufacture of rubber and plastic products
(NACE 25); manufacture of radio, television and communication equipment and apparatus
(NACE 32); air transport (NACE 62); post and telecommunications. Alternatively, we ex-
clude the seven industries originally identified by Autor et al. (2013) as having experienced
substantial fluctuations over the sample period across countries, due to technological inno-
vations, housing booms, and the rapid growth of emerging economies. These industries are:
manufacture of textiles (NACE 17); manufacture of wearing apparel; dressing an dyeing of
fur (NACE 18); tanning and dressing of leather; manufacture of luggage, handbags, sad-
dlery, harness and footwear (NACE 19); manufacture of other non-metallic mineral products
(NACE 26); manufacture of basic metals (NACE 27); manufacture of fabricated metal prod-
ucts, except machinery and equipment (NACE 28); manufacture of office machinery and
computers (NACE 30). The evidence obtained from both exclusions is reported in Tables 11
and 12 and confirms the robustness of our main results to any potential concerns regarding
our identification strategy.
6.2.4 Additional checks
Our results on the skill distribution for Portugal are insignificant for all the prior specifi-
cations. It could be argued that due to the fact that we only observe a more aggregated
classification of the Portuguese industries, the effects are instead not precisely estimated.
We assess whether this is the case by running both the first and the second stage for Den-
mark on a more aggregate level, by using 3-digit level of industry classification (instead of
29

a 4-digit classification). The results reported in Table 13 allow us to dismiss this concern,
as the estimated results for Denmark’s skill distribution are fairly comparable to the main
results obtained from the more disaggregated data.
The fact that we have to include the predicted changes in the skill premium,ˆskill premiumjt−1, separately for w90
w50and w50
w10in equations 17 and 17 may lead to a problem
of omitted variable bias. We therefore examine in Table 14 the sensitivity of the signifi-
cant effects on skill distribution of the predicted trade-induced skill premium reported in
Table 3 for Denmark to unobservables, by using the method proposed by Oster (2013). This
test formalizes a relationship between: i) the association between selection on observables
and unobservables and ii) R-squared values. This is done in order to explain the potential
importance of omitted variable bias. Movements in the coefficients and R-squared values
identify the bias resulting from omitted variables. Column (1) reports the raw effect of the
predicted trade-induced skill premium from a regression of one of the two moments of the
skill distribution on ˆskill premiumjt−1. Column (2) is the controlled effect, including all the
observables reported in Table 3 and acts as an upper bound for the estimated effect of skill
premium on one of the two moments of the skill distribution. The reported R-squared values
in columns (1) and (2) correspond to R and R respectively as in Oster (2013). Column (3)
reports the bounded set taking the value from column (2) and the bound estimate assuming
that: i) the relationship between the covariance, δ, of the variable of interest, i.e. the skill
premium, and observables and the covariance of the variable of interest and unobservables
is equal to 1, and ii) Rmax is higher than R. When δ=1, unobservables and observables are
equally important. When Rmax=1, the dependent variable is fully explained by the variable
of interest, and both the observable and unobservable controls. As this may not be rea-
sonable to assume22, we set Rmax=0.95 (i.e. Rmax=1.1* R) for the effects on the mean of
skills and Rmax=0.8 (i.e. Rmax=1.4* R) for the effects on the standard deviation of skills.
The resulting bound using the procedure developed by (Oster, 2013) suggests that, using
reasonable values for the necessary assumptions, we can exclude the possibility that w90w50
has
a negative impact on the mean and the standard deviation of skills or that w50w10
has a positive
effect on the mean.
Despite these relatively tight bounds, we can further investigate what properties, in terms
of unobservables, would have to hold in order to explain away the whole effect of the skill
premium. Column (4) reports the level of δ required for the effect of the variable of interest
on mean or the standard deviation of skills to be zero. The results show that selection
on unobservables would have to be greater than selection on observables, more than twice
22For example if Rmax=1, the first two moments of the skill distribution can be completely explained,implying zero measurement errors in the data.
30
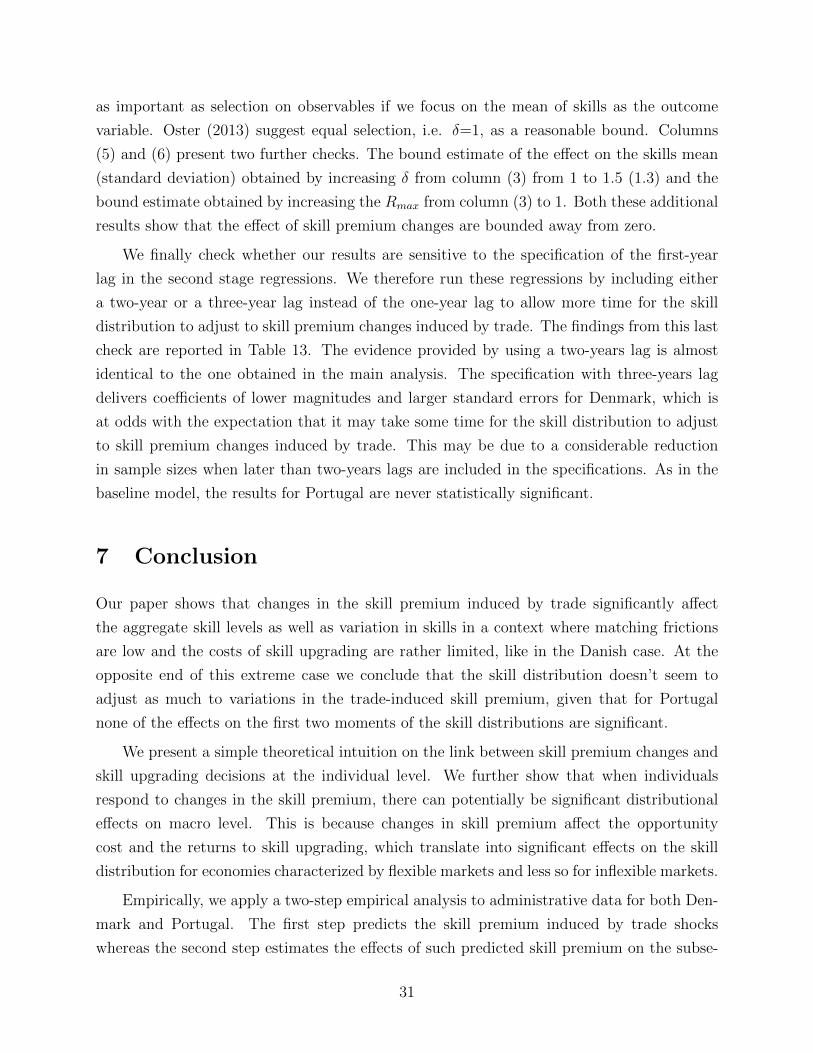
as important as selection on observables if we focus on the mean of skills as the outcome
variable. Oster (2013) suggest equal selection, i.e. δ=1, as a reasonable bound. Columns
(5) and (6) present two further checks. The bound estimate of the effect on the skills mean
(standard deviation) obtained by increasing δ from column (3) from 1 to 1.5 (1.3) and the
bound estimate obtained by increasing the Rmax from column (3) to 1. Both these additional
results show that the effect of skill premium changes are bounded away from zero.
We finally check whether our results are sensitive to the specification of the first-year
lag in the second stage regressions. We therefore run these regressions by including either
a two-year or a three-year lag instead of the one-year lag to allow more time for the skill
distribution to adjust to skill premium changes induced by trade. The findings from this last
check are reported in Table 13. The evidence provided by using a two-years lag is almost
identical to the one obtained in the main analysis. The specification with three-years lag
delivers coefficients of lower magnitudes and larger standard errors for Denmark, which is
at odds with the expectation that it may take some time for the skill distribution to adjust
to skill premium changes induced by trade. This may be due to a considerable reduction
in sample sizes when later than two-years lags are included in the specifications. As in the
baseline model, the results for Portugal are never statistically significant.
7 Conclusion
Our paper shows that changes in the skill premium induced by trade significantly affect
the aggregate skill levels as well as variation in skills in a context where matching frictions
are low and the costs of skill upgrading are rather limited, like in the Danish case. At the
opposite end of this extreme case we conclude that the skill distribution doesn’t seem to
adjust as much to variations in the trade-induced skill premium, given that for Portugal
none of the effects on the first two moments of the skill distributions are significant.
We present a simple theoretical intuition on the link between skill premium changes and
skill upgrading decisions at the individual level. We further show that when individuals
respond to changes in the skill premium, there can potentially be significant distributional
effects on macro level. This is because changes in skill premium affect the opportunity
cost and the returns to skill upgrading, which translate into significant effects on the skill
distribution for economies characterized by flexible markets and less so for inflexible markets.
Empirically, we apply a two-step empirical analysis to administrative data for both Den-
mark and Portugal. The first step predicts the skill premium induced by trade shocks
whereas the second step estimates the effects of such predicted skill premium on the subse-
31

quent distribution of skills at the industry level. The main results for Denmark show that
the effects of the skill premium changes driven by trade shocks are non-linear: increases in
low-medium skill premium reduces mean and variance of the skills whereas the opposite is
observed with increases in medium-high skill premium. Given that trade seems to affect the
low-medium skill premium negatively and the medium-high skill premium positively, we can
conclude that the overall distribution of skills in Denmark shifts to the right and becomes
more dispersed. For Portugal, none of the effects on the skill distribution are statistically
significant. Despite the larger impact of the export volumes on the skill premium for Portu-
gal (when compared to Denmark), skill premium changes triggered by trade shocks do not
seem to affect the overall distribution of skills in Portugal. All in all, these results are in line
with our theoretical predictions as well as robust to various sensitivity tests.
This study informs the policy makers about the distributional effects of trade integration
on skills which are shown to be economically and statistically significant if the framework
conditions and the labor market institutions are conducive to distributional adjustments.
While designing policies for labor adjustment process to trade shocks, policy makers must
account for such effects, especially in a context that favors the skill upgrading of the workforce
and the labor reallocation across firms within industries or across industries, like in the
Danish one.
In particular, if the policy maker’s ex-post trade integration objective is to reduce the
overall variation in the skills within the country then the first order analysis is to assess how
trade integration affects the skill premium across the different skills. If the skill premium
for the high skilled workers increases, the overall variation in the skills will be magnified.
Therefore, the policy design should focus on supporting the middle skills to reduce the
variation in the skills without affecting the average skills. If skill premium for the lower
skilled workers increases, the variation of skills is reduced but the average skill reduces as
well. Therefore, a policy that uniformly assists the lower skilled workers to upgrade skills
would improve the average skill without affecting the variation in skills.
32

References
Abowd, J. M., Kramarz, F., and Margolis, D. N. (1999). High wage workers and high wage
firms. Econometrica, 67(2):251–334.
Addison, J. T., Portugal, P., and Vilares, H. (2016). Unions and collective bargaining in the
wake of the great recession. IZA Discussion Paper No. 8943.
Andersen, T. M. (2012). A flexicurity labour market in the great recession: The case of
denmark. De Economist, 160(2):117–140.
Atkin, D. (2012). Endogenous skill acquisition and export manufacturing in mexico. Tech-
nical report, National Bureau of Economic Research.
Autor, D., Dorn, D., and Hanson, G. H. (2013). The China Syndrome: Local Labor Market
Effects of Import Competition in the United States. IZA Discussion Papers, (7150).
Blanchard, E. and Olney, W. (2015). Globalization and human capital investment: How
export composition drives educational attainment. mimeo.
Blanchard, E. J. and Willmann, G. (2016). Trade, education, and the shrinking middle class.
Journal of International Economics, 99(1):263–278.
Blanchard, O. and Portugal, P. (2001). What hides behind an unemployment rate: Compar-
ing portuguese and u.s. labor markets. The American Economic Review, 91(1):187–207.
Bombardini, M., Gallipoli, G., and Pupato, G. (2012). Skill dispersion and trade flows.
American Economic Review, 102(5):2327–48.
Botero, J. C., Djankov, S., Porta, R. L., Lopez-de Silanes, F., and Shleifer, A. (2004). The
regulation of labor. The Quarterly Journal of Economics, 119(4):1339–1382.
Buhai, I. S., Portela, M. A., Teulings, C. N., and van Vuuren, A. (2014). Returns to tenure
or seniority? Econometrica, 82(2):705–730.
Card, D., Cardoso, A. R., and Kline, P. (2016). Bargaining and the gender wage gap: A
direct assessment. The Quarterly Journal of Economics.
Card, D., Heining, J., and Kline, P. (2013). Workplace heterogeneity and the rise of west
german wage inequality. The Quarterly Journal of Economics, 128(3):967–1015.
Cardoso, A. R. and Portugal, P. (2005). Contractual wages and the wage cushion under
different bargaining settings. Journal of Labor Economics, 23(4):875–902.
33

Colantone, I., Crino, R., and Ogliari, L. (2015). The hidden cost of globalization: Im-
port competition and mental distress. CESifo Working Paper Series 5586, CESifo Group
Munich.
Costinot, A. and Vogel, J. (2010). Matching and inequality in the world economy. Journal
of Political Economy, 118(4):747–786.
Edmonds, E. V., Topalova, P., and Pavcnik, N. (2009). Child labor and schooling in a
globalizing world: Some evidence from urban india. Journal of the European Economic
Association, 7(2-3):498–507.
Egger, H. and Kreickemeier, U. (2009). Redistributing gains from globalisation*. The Scan-
dinavian Journal of Economics, 111(4):765–788.
Eriksson, T. and Westergaard-Nielsen, N. (2009). Wage and labor mobility in denmark,
1980-2000. The Structure of Wages: An International Comparison, pages 101–123.
Findlay, R. and Kierzkowski, H. (1983). International trade and human capital: a simple
general equilibrium model. The Journal of Political Economy, pages 957–978.
Goldberg, P. K. and Pavcnik, N. (2007). Distributional effects of globalization in developing
countries. Journal of Economic Literature, 45:39–82.
Hickman, D. C. and Olney, W. W. (2011). Globalization and investment in human capital.
Industrial & Labor Relations Review, 64(4):654–672.
Hummels, D., Jorgensen, R., Munch, J., and Xiang, C. (2014). The wage effects of off-
shoring: Evidence from danish matched worker-firm data. American Economic Review,
104(6):1597–1629.
ILO (2014). Tackling the job crisis in portugal. ILO reports.
Iranzo, S., Schivardi, F., and Tosetti, E. (2008). Skill dispersion and firm productivity: An
analysis with employer-employee matched data. Journal of Labor Economics, 26(2):247–
285.
Irarrazabal, A., Moxnes, A., and Ulltveit-Moe, K. H. (2013). Heterogeneous firms or het-
erogeneous workers? implications for exporter premiums and the gains from trade. The
Review of Economics and Statistics, 95(3):839–849.
Johnson, G. and Stafford, F. (1999). The labor market implications of international trade.
Handbook of Labor Economics, 3:2215–2288.
34

Maggi, G. and Grossman, G. M. (2000). Diversity and trade. American Economic Review,
90(5):1255–1275.
OECD (2013). Oecd economic surveys: Denmark 2013. OECD surveys.
OECD (2014). Oecd economic surveys: Portugal 2014. OECD surveys.
Oster, E. (2013). Unobservable Selection and Coefficient Stability: Theory and Validation.
NBER Working Papers 19054, National Bureau of Economic Research, Inc.
Portela, M. (2001). Measuring skill: a multi-dimensional index. Economics Letters, 72(1):27–
32.
Yeaple, S. R. (2005). A simple model of firm heterogeneity, international trade, and wages.
Journal of international Economics, 65(1):1–20.
35

A Appendix: Proposition Proofs
A.1 Theoretical Solution
In this section, we lay out a general model of skill upgrading decision. θ = 1 correspond to a friction
less environment while 0 < θ < 1 corresponds to the frictional environment.
Since individuals can perfectly smooth their consumption over time, it is easy to show that their
life-time utility Vi is an increasing function of their life-time income Wi ≡∑3
j=1w(sij)pj(1 − tij).Hence, we examine the following three cases.
Case 1: No skill upgrading: Iij = 0 for j = 1, 2, 3
The first case is if the individual decides not to obtain additional skills at all. One’s life-time income
is:
W 1 = w(s)(p1 + p2 + p3) (8)
Case 2: Upgrade skill once: Ii1 = 1 and Iij = 0 for j = 2, 3
The second case is if the individual upgrades skill once in the life time. One’s life-time income is:
W 2 = w(s)p1(1− e
ai) + [θw(s+ e) + (1− θ)w(s)]p2 + [θw(s+ e) + (1− θ)w(s)]p3 (9)
Case 3: Upgrade skill twice: Iij = 1 for j = 1, 2 and Ii3 = 0
The third case is if the individual upgrade skills twice in the life time. One’s life-time income is:
W 3 = w(s)p1(1− e
ai) + [θw(s+ e) + (1− θ)w(s)]p2(1− e
ai) + [θw(s+ 2e) + (1− θ)w(s+ e)]p3(10)
We solve for the ability thresholds A1 = w(s)p1eθ(p2+p3)∆1
and A2 = [w(s)+θ∆1]p2ep3[θ∆2+(1−θ)∆1] such that when
an individual i’s ability ai ≤ A1, they have W 1 ≥ W 2 and when an individual i′s ai ≥ A2, the
individual has W 3 ≥W 2; when an individual i’s ability A1 ≤ ai ≤ A2, the individual has W 2 ≥W 3
and W 2 ≥W 1.
The effect of changes in ∆1 and ∆2 on thresholds can be summarized as follows:
∂A1
∂∆1= − w(s)p1e
θ(p2 + p3)∆21
< 0 (11)
∂A2
∂∆1|∆2 =
p2e[θ2∆2 − (1− θ)w(s)]
p3[θ∆2 + (1− θ)∆1]2(12)
∂A2
∂∆2|∆1 = − θ[w(s) + θ∆1]p2e
p3[θ∆2 + (1− θ)∆1]2< 0 (13)
36

Moreover, changes in θ affecting the above differentials can be summarized as follows:
∂(∂A1∂∆1
)∂θ
=w(s)p1e
θ2(p2 + p3)∆21
> 0 (14)
∂(∂A2∂∆1|∆2
)∂θ
=p2e[w(s)(2∆2 −∆1) + θw(s)(∆1 −∆2)]
p3[θ∆2 + (1− θ)∆1]3(15)
∂(∂A2∂∆2|∆1
)∂θ
= −p2e[w(s)∆1 + w(s)θ(∆1 −∆2) + 2θ∆21]
p3[θ∆2 + (1− θ)∆1]3< 0 (16)
Last, assuming uniform distribution of ability, the first two moments are computed using the
following expressions. Moreover, the movement of threshold in response to changes in ∆’s affect
these moments and we provide the corresponding implications below:
(1) Mean (E(s)):
E(s) = sA1 − aa− a
+ (s+ e)A2 −A1
a− a+ (s+ 2e)
a−A2
a− a
= s+2a−A1 −A2
a− ae
(2) Variance (V ar(s)):
V ar(s) =∑
[si − E(s)]2
=A1 − aa− a
(2a−A1 −A2
a− ae)2 +
A2 −A1
a− a(a+ a−A1 −A2
a− ae)2 +
a−A2
a− a(2a−A1 −A2
a− ae)2
=e2
(a− a)3{(A1 − a)(2a−A1 −A2)2 + (A2 −A1)(a+ a−A1 −A2)2
+ (a−A2)(2a−A1 −A2)2}
=e2
(a− a)3{(A1 − a)(2a−A1 −A2)2 + [a− a− (A1 − a)− (a−A2)](a+ a−A1 −A2)2
+ (a−A2)(2a−A1 −A2)2}
=e2
(a− a)3{(A1 − a)[(2a−A1 −A2)2 − (a+ a−A1 −A2)2] + [a− a](a+ a−A1 −A2)2
+ (a−A2)[(2a−A1 −A2)2 − (a+ a−A1 −A2)2]}
=e2
(a− a)2{(A1 − a)(3a+ a− 2A1 − 2A2) + (a−A2)(2A1 + 2A2 − a− 3a)
+ (a+ a−A1 −A2)2}
=e2
(a− a)2{(A1 − a)(3a+ a− 2A1 − 2A2)− aa+ (A1 − a)2 +A2(a+ a−A2)}
37

A.2 Flexible Market (θ = 1)
Replacing θ = 1, ai ≤ w(s)p1e(p2+p3)[w(s+e)−w(s)] ≡ A1 and ai ≥ w(s+e)p2e
p3[w(s+2e)−w(s+e)] ≡ A2. Assumingd2wds2
< 0 and positive inflation (i.e., p1 ≤ p2 ≤ p3), we have A1 < A2. Hence, we can draw Figure 1.
Figure 1: Ability Thresholds and Skill Upgrading Decision
Note: The above illustration presents the ability specific thresholds and the associated ranking of wealthwith zero, once or twice skill upgrading. This illustration highlights that those individuals whose ability isbelow A1 do not upgrade skills at all, those with above A2 level of ability upgrade skills twice in their life
time, and those in between A1 and A2 upgrade skills only once.
∂A1
∂∆1< 0 (17)
∂A2
∂∆1|∆2 > 0 (18)
∂A2
∂∆2|∆1 < 0 (19)
Proof of Proposition 1.
• If | ∂A1∂∆1| < | ∂A2
∂∆1|∆2 |, an increase in ∆1 decreases mean (E(s)) and variation (V ar(s)) of skills.
(1) Mean: When ∆1 increases, A1 decreases and A2 increases. Since | ∂A1∂∆1| < | ∂A2
∂∆1|∆2 |, the
decrease of A1 is smaller than the increase of A2. Hence, E(s) = s + 2a−A1−A2a−a e decreases.
(2) Variance: Since a + a < 2A2, a + a > 2A1, and a < A1 < A2 < a, we have 3a + a −2A1− 2A2 > a+ a− 2A1 > 0. When ∆1 increases, A1 decreases and A2 increases. Assuming
| ∂A1∂∆1| < | ∂A2
∂∆1|∆2 |, we have both(A1 − a) and (3a + a − 2A1 − 2A2) decrease. The last term
in V ar(s) is A2(a + a − A2). Its value changes by a + a − 2A2 < 0 when A2 increases by
1. Hence, V ar(s) is A2(a + a − A2) also decreases when A2 increases. Therefore, we prove
V ar(s) decreases when ∆1 increases.
• An increase in ∆2 increases both the mean (E(s)) and the variation (V ar(s)) of skills.
(1) Mean: When ∆2 increases, A2 decreases while A1 does not change. Hence, E(s) =
s+ 2a−A1−A2a−a e increases.
(2) Variance: When A2 decreases, we have both 3a + a − 2A1 − 2A2 and A2(a + a − A2)
increases. Therefore, we prove V ar(s) increases when ∆2 increases.
38

A.3 Frictional Markets (θ 6= 1)
Before proving Proposition 2, we first establish the condition for θ under which A1 < A2. In order
to have A1 < A2, we need Xθ2 + Y θ + Z > 0 where
X = (p2 + p3)p2e∆21 > 0 (20)
Y = ew(s)[(p2 + p3)p2∆1 + (∆1 −∆2)p1p3] > 0
Z = −ew(s)p1p3∆1 < 0
Given the quadratic nature of the equation Xθ2 + Y θ + Z, it is easy to see that the equation’s
lowest point is achieved at θ = −Y2X < 0. That is, for any 0 < θ ≤ 1, Xθ2 + Y θ + Z monotonically
increases along θ. Then we solve for the positive θ∗ that equalizes Xθ2 + Y θ + Z to 0:
θ∗ =−Y +
√Y 2 − 4XZ
2X> 0 (21)
where −4XZ > 0 and thus Y 2 − 4XZ > Y 2 > 0. Hence, we have −Y+√Y 2−4XZ2X > 0. Assuming
d2wds2
< 0 and positive inflation (i.e., p1 ≤ p2 ≤ p3), when θ = 1 in the baseline model we have
A1 < A2 and thus Xθ2 +Y θ+Z > 0. Therefore, given Xθ2 +Y θ+Z monotonically increasing for
positive θ ∈ [θ∗, 1].
We have proven that −Y+√Y 2−4XZ2X < 1. Hence, we’ve shown that in order to have A1 < A2,
we need 0 < −Y+√Y 2−4XZ2X = θ∗ < θ ≤ 1, and this condition is consistent with θ being a probability
between 0 and 1.
Restricting θ ∈ [θ∗, 1], we can now study the distributional effects of changes in skill premium.
Recall that we cannot sign the ∂A2∂∆1|∆2 unless we have additional conditions stating whether θ
is above or below some cut-off denoted by ε while restricting the cut-off to lie in the range where
A1 < A2 only i.e., θ∗ < ε. To find θ = ε we need the numerator of ∂A2∂∆1|∆2 = 0 which implies that
[θ2∆2 − (1− θ)w(s)] = 0. Solving for the quadratic equation in θ, ε =−w(s)±
√w2(s)+4∆2w(s)
2∆2.
Then for θ ∈ [θ∗, ε] we have ∂A2∂∆1|∆2 < 0 and for θ ∈ [ε, 1] we have ∂A2
∂∆1|∆2 > 0.
Proof of Proposition 2.
• An increase in ∆1 has ambiguous effect on E(s) and V ar(s). Depending on the relation
between | ∂A1∂∆1| and | ∂A2
∂∆1|∆2 |, and the magnitude of θ various cases are possible and therefore
39

the ultimate effect is at best ambiguous.
Mean =
Decreases if | ∂A1∂∆1| < | ∂A2
∂∆1|∆2 | & θ ∈ [ε, 1]
Increases if | ∂A1∂∆1| > | ∂A2
∂∆1|∆2 | & θ ∈ [ε, 1]
Unchanged if | ∂A1∂∆1| = | ∂A2
∂∆1|∆2 | & θ ∈ [ε, 1]
Increases if θ ∈ [θ∗, ε]
V ariance =
Decreases if | ∂A1∂∆1| < | ∂A2
∂∆1|∆2 | & θ ∈ [ε, 1]
Ambiguous otherwise
• An increase in ∆2 increases both E(s) and V ar(s) of skills but by a smaller magnitude relative
to when θ = 1. (1) Mean: When ∆2 increases, A2 decreases while A1 does not change. Hence,
E(s) = s + 2a−A1−A2a−a e increases. Moreover,
∂(
∂A2∂∆2|∆1
)∂θ < 0, meaning in absolute terms the
effect increases as θ increases.
(2) Variance: When A2 decreases, we have both 3a + a − 2A1 − 2A2 and A2(a + a − A2)
increases. Therefore, we prove V ar(s) increases when ∆2 increases. Moreover,∂(
∂A2∂∆2|∆1
)∂θ < 0,
meaning in absolute terms the effect increases as θ increases.
40
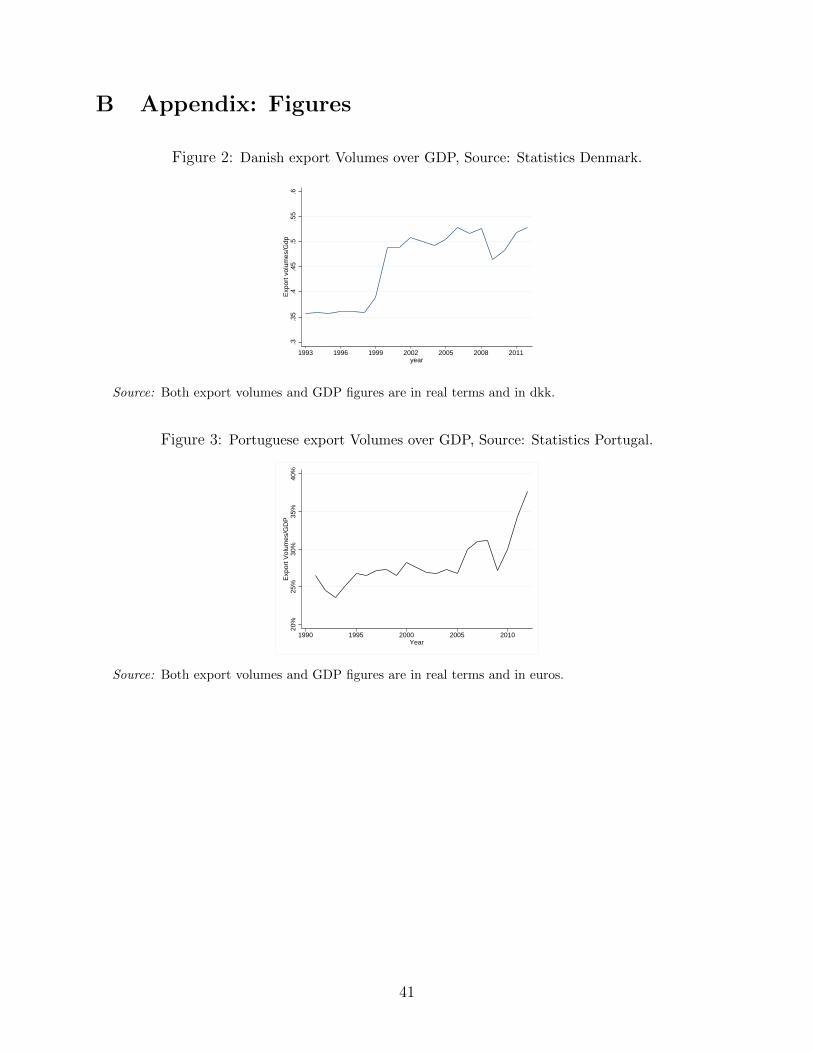
B Appendix: Figures
Figure 2: Danish export Volumes over GDP, Source: Statistics Denmark.
.3.3
5.4
.45
.5.5
5.6
Exp
ort v
olum
es/G
dp
1993 1996 1999 2002 2005 2008 2011year
Source: Both export volumes and GDP figures are in real terms and in dkk.
Figure 3: Portuguese export Volumes over GDP, Source: Statistics Portugal.
20%
25%
30%
35%
40%
Exp
ort V
olum
es/G
DP
1990 1995 2000 2005 2010Year
Source: Both export volumes and GDP figures are in real terms and in euros.
41

Figure 4: Destination of Danish Exports, Source: Statistics Denmark.
2022
2426
28
1993 1996 1999 2002 2005 2008 2011year
North SouthChina
Source: Amount in dkk. North includes countries of North America, Oceania, Western and SouthernEurope (excluding the new EU members of the 2004 enlargement). All the other countries in theworld are considered under the category of South.
Figure 5: Destination of Portuguese Exports, Source: Statistics Portugal.
1618
2022
24E
xpor
t vol
umes
(lo
g)
1990 1995 2000 2005 2010Year
North South China
Source: Amount in euros. North includes countries of North America, Oceania, Western and SouthernEurope (excluding the new EU members of the 2004 enlargement). All the other countries in the worldare considered under the category of South.
42

Figure 6: Overtime wage ratios and skills, Denmark
1.52
1.53
1.54
1.55
1993 1997 2001 2005 2009 2013
w90/w50
1.4
1.6
1.8
22.
2
1993 1997 2001 2005 2009 2013
w50/w10
1111
.512
12.5
1993 1997 2001 2005 2009 2013
mean skills def.4
1.5
22.
53
1993 1997 2001 2005 2009 2013
sd skills def.4
Source: The first two panels plot the average skill premium w90w50 and w50
w10 against year. The last twopanels plot the first two moments of the skill distribution against year. Skill definition 4 is based onyears of education.
Figure 7: Overtime wage ratios and skills, Portugal
1.65
1.7
1.75
1.8
1.85
1993 1997 2001 2005 2009
w90/w50
1.45
1.5
1.55
1.6
1993 1997 2001 2005 2009
w50/w10
6.3
6.5
6.7
1993 1997 2001 2005 2009
mean skills
.05
.06
.07
.08
.09
.1
1993 1997 2001 2005 2009
sd skills
Source: The first two panels plot the average skill premium w90w50 and w50
w10 against year. The last twopanels plot the first two moments of the skill distribution against year. Skill definition 4 is based onyears of education.
43

Figure 8: Wage Dynamics of Male Movers.
12.20
12.30
12.40
12.50
12.60
12.70
12.80
12.90
13.00
13.10
-2 -1 0 1
Me
an L
og
Wag
e o
f M
ove
rs 1 to 1
1 to 2
1 to 3
1 to 4
4 to 1
4 to 2
4 to 3
4 to 4
Source: Figure shows mean wages of male workers who changed jobs in 1996-2005 and held thepreceding job for 2 or more years, and the new job for 2 or more years. Each job is classified intoquartiles based on mean log wage of co-workers in the last year of the old job (for origin firm) and inthe first year on the new job (for the destination firm).
Figure 9: Wage Dynamics of Female Movers.
11,80
12,00
12,20
12,40
12,60
12,80
13,00
-2 -1 0 1
Me
an L
og
Wag
e o
f M
ove
rs 1 to 1
1 to 2
1 to 3
1 to 4
4 to 1
4 to 2
4 to 3
4 to 4
Source: Figure shows mean wages of female workers who changed jobs in 1996-2005 and held thepreceding job for 2 or more years, and the new job for 2 or more years. Each job is classified intoquartiles based on mean log wage of co-workers in the last year of the old job (for origin firm) and inthe first year on the new job (for the destination firm).
44

C Appendix: Tables
45

Tab
le1:
Des
crip
tive
stat
isti
cs
Vari
ab
les
Defi
nit
ion
Den
mark
Port
ugal
Wage
gap
san
dsk
ill
vari
ab
les:
Mean
Sd
Mean
Sd
w90
/w50
rati
oof
the
90th
to50
thp
erce
nti
leof
the
wag
edis
trib
uti
onat
the
indust
ryle
vel
1.54
40.
201
1.74
70.
224
w50
/w10
rati
oof
the
50th
to10
thp
erce
nti
leof
the
wag
edis
trib
uti
onat
the
indust
ryle
vel
1.80
20.
300
1.52
90.
223
Skill
defi
nit
ion
1-m
ean
Con
tinuou
ssk
ill
vari
able
esti
mat
edfr
omA
KM
,sy
stem
atic
com
pon
ent
1.44
90.
329
0.72
10.
060
Skill
defi
nit
ion
1-sd
0.32
10.
061
0.13
00.
015
Skill
defi
nit
ion
2-m
ean
Con
tinuou
ssk
ill
vari
able
esti
mat
edfr
omA
KM
,sy
stem
atic
com
pon
ent
wit
hou
tag
e1.
357
0.38
70.
168
0.04
8Skill
defi
nit
ion
2-sd
0.30
90.
061
0.07
60.
013
Skill
defi
nit
ion
3-m
ean
Con
tinuou
ssk
ill
vari
able
esti
mat
edfr
omA
KM
,sy
stem
atic
com
pon
ent
wit
hou
tag
ean
dte
nure
1.35
20.
394
0.13
20.
043
Skill
defi
nit
ion
3-sd
0.30
80.
061
0.05
80.
013
Skill
defi
nit
ion
4-m
ean
Con
tinuou
ssk
ill
vari
able
bas
edon
year
sof
form
aled
uca
tion
11.4
050.
961
7.40
01.
938
Skill
defi
nit
ion
4-sd
1.97
20.
462
3.81
00.
708
Skill
defi
nit
ion
5-m
ean
Con
tinuou
ssk
ill
vari
able
bas
edon
Por
tela
etal
.(2
001)
11.2
841.
450
7.59
21.
231
Skill
defi
nit
ion
5-sd
3.61
60.
684
2.57
20.
471
Tra
de
vari
ab
les:
Exp
ort
Log
ofre
alex
por
tvo
lum
es20
.704
7.87
517
.255
4.21
8E
xp
ort
Nor
thL
ogof
real
exp
ort
volu
mes
todev
elop
edco
untr
ies
19.9
968.
382
16.0
123.
608
Exp
ort
Sou
thL
ogof
real
exp
ort
volu
mes
tonon
dev
elop
edco
untr
ies
17.9
348.
622
15.9
335.
860
Imp
ort
Log
ofre
alim
por
tvo
lum
es22
.121
6.24
418
.114
2.95
3C
ontr
ol
vari
ab
les
Pro
duct
ivit
ylo
gav
erag
eto
tal
sale
sp
erem
plo
yee
19.6
121.
186
11.0
830.
941
Cap
ital
inte
nsi
tylo
gof
aver
age
capit
alst
ock
per
emplo
yee
18.2
601.
282
--
Mal
esav
erag
esh
are
ofm
ale
emplo
yees
0.66
00.
194
0.62
30.
205
Age
aver
age
emplo
yees
’ag
e40
.809
4.06
138
.281
2.68
4W
ork
exp
erie
nce
aver
age
wor
kex
per
ience
14.5
483.
920
6.84
92.
451
Ten
ure
aver
age
tenure
(yea
rsfo
rD
K;
mon
ths
for
PT
)5.
677
2.18
311
9.26
242
.414
skill1
aver
age
shar
eof
emplo
yees
wit
hse
condar
yed
uca
tion
0.59
80.
121
0.18
00.
112
skill2
aver
age
shar
eof
emplo
yees
wit
hte
rtia
ryed
uca
tion
0.13
40.
135
0.08
40.
11N
8,56
61,
135
Notes:
All
des
crip
tive
stati
stic
sare
calc
ula
ted
as
aver
ages
over
the
per
iod
1993-2
012.
Tra
de
an
dac
cou
nti
ng
vari
able
sar
ein
Eu
ros
for
both
Den
mark
an
dP
ort
ugal.
46

Table 2: Estimated coefficients of the time variant personal characteristics, AKM model.
Denmark PortugalMen Women Men Women
age 0.042*** 0.023*** 0.033*** 0.013***(0.002) (0.003) (0.000) (0.000)
age2 -0.001*** -0.000*** -0.000*** -0.000***(0.000) (0.000) (0.000) (0.000)
work experience 0.048*** 0.062*** 0.025*** 0.022***(0.001) (0.003) (0.000) (0.000)
work experience2 -0.001*** -0.001*** -0.001*** -0.001***(0.000) (0.000) (0.000) (0.000)
tenure 0.014*** 0.014*** 0.000*** 0.000***(0.001) (0.002) (0.000) (0.000)
tenure2 -0.000*** -0.000*** -0.000*** -0.000***(0.000) (0.000) (0.000) (0.000)
Secondary education*year dummies Yes Yes Yes YesTertiary education*year dummies Yes Yes Yes YesN 16,569,318 11,238,102 13,306,912 10,072,610R-sq 0.767 0.743 0.8449 0.8983
Notes: The dependent variable is log of annual (monthly) net earnings for Denmark (Portugal).Standard errors are clustered at the firm level. Significance levels: ***1%, **5%, *10%.
47

Table 3: Effects of Trade Activity on the Skill Premium and Distribution.
DenmarkStep 1 w90/w50 w50/w10Export 0.002*** -0.005***
(0.000) (0.001)F stat 3074.35 3074.35N 8,566 8,566R-sq 0.156 0.407Step 2, skill definition 1 Mean SD Mean SDFirst year lag of predicted (w90/w50) 0.692** 0.178**
(0.294) (0.088)First year lag of predicted (w50/w10) -0.318** -0.082
(0.159) (0.056)N 8,566 8,566 8,566 8,566R-sq 0.893 0.567 0.893 0.567
PortugalStep 1 w90/w50 w50/w10Export 0.036*** 0.020***
(0.004) (0.004)F stat 256.46 256.46N 1,137 1,137R-sq 0.561 0.595Step 2, skill definition 1 Mean SD Mean SDFirst year lag of predicted (w90/w50) -0.015 0.009
(0.011) (0.007)First year lag of predicted (w50/w10) -0.027 0.017
(0.022) (0.017)N 1,064 1,064 1,064 1,064R-sq 0.966 0.754 0.966 0.754
Notes: Skill definition 1 is based on the whole systematic component of the two-way fixed effectswage regression. In step 1, standard errors are clustered at the industry level. In step 2, standarderrors are clustered at the industry level and sequentially bootstrapped with step 1, 200 replications.All estimations are also weighted for the number of firms in each industry. Both steps also includethe following control variables: sales per employee, capital intensity (only for Denmark), workforcecomposition characteristics, year and 2 digit industry dummies. Significance levels: ***1%, **5%,*10%.
48

Table 4: Effects of Trade Activity on the Skill Premium and Distribution, alternative skilldefinitions, Denmark.
Step 2, skill definition 2 Mean SD Mean SDFirst year lag of predicted (w90/w50) 0.663** 0.181
(0.289) (0.131)First year lag of predicted (w50/w10) -0.305** -0.083
(0.151) (0.052)N 8,566 8,566 8,566 8,566R-sq 0.793 0.547 0.793 0.544Step 2, skill definition 3 Mean SD Mean SDFirst year lag of predicted (w90/w50) 0.663** 0.182
(0.337) (0.138)First year lag of predicted (w50/w10) -0.305** -0.083**
(0.151) (0.042)N 8,566 8,566 8,566 8,566R-sq 0.813 0.527 0.823 0.527Step 2, skill definition 4 Mean SD Mean SDFirst year lag of predicted (w90/w50) 2.017*** 2.775***
(0.752) (0.835)First year lag of predicted (w50/w10) -0.657*** -0.904***
(0.193) (0.256)N 8,566 8,566 8,566 8,566R-sq 0.870 0.597 0.870 0.597Step 2, skill definition 5 Mean SD Mean SDFirst year lag of predicted (w90/w50) 1.769* 3.152***
(1.004) (1.068)First year lag of predicted (w50/w10) -0.576 -1.026***
(0.416) (0.317)N 8,566 8,566 8,566 8,566R-sq 0.703 0.527 0.703 0.527
Notes: Skill definitions 2 and 3 are based on the systematic component of the two-way fixed effectswage regression respectively without age and without age and tenure. Skill definition 4 is basedon years of education whereas skill definition 5 is the multidimensional index as in Portela et al.(2001). Both steps also include the following control variables: sales per employee, capital intensity,workforce composition characteristics, year and 2 digit industry dummies. In step 2, standard errorsare clustered at the industry level and sequentially bootstrapped with step 1, 200 replications. Allestimations are also weighted for the number of firms in each industry. Significance levels: ***1%,**5%, *10%.
49

Table 5: Effects of Trade Activity on the Skill Premium and Distribution, alternative skilldefinitions, Portugal.
Step 2, skill definition 2 Mean SD Mean SDFirst year lag of predicted (w90/w50) -0.005 -0.001
(0.009) (0.006)First year lag of predicted (w50/w10) -0.010 -0.002
(0.019) (0.012)N 1,064 1,064 1,064 1,064R-sq 0.957 0.857 0.957 0.857Step 2, skill definition 3 Mean SD Mean SDFirst year lag of predicted (w90/w50) -0.003 -0.001
(0.008) (0.005)First year lag of predicted (w50/w10) -0.006 -0.001
(0.016) (0.008)N 1,064 1,064 1,064 1,064R-sq 0.954 0.923 0.954 0.923Step 2, skill definition 4 Mean SD Mean SDFirst year lag of predicted (w90/w50) -0.501 -0.246
(0.430) (0.158)First year lag of predicted (w50/w10) -0.899 -0.442
(0.749) (0.342)N 1,064 1,064 1,064 1,064R-sq 0.971 0.783 0.971 0.783Step 2, skill definition 5 Mean SD Mean SDFirst year lag of predicted (w90/w50) -0.426 -0.003
(0.279) (0.132)First year lag of predicted (w50/w10) -0.766 -0.005
(0.591) (0.230)N 1,064 1,064 1,064 1,064R-sq 0.932 0.914 0.932 0.914
Notes: Skill definitions 2 and 3 are based on the systematic component of the two-way fixed effectswage regression respectively without age and without age and tenure. Skill definition 4 is based onyears of education whereas skill definition 5 is the multidimensional index as in Portela et al. (2001).Both steps also include the following control variables: sales per employee, workforce compositioncharacteristics, year and 2 digit industry dummies. In step 2, standard errors are clustered at theindustry level and sequentially bootstrapped with step 1, 200 replications. All estimations are alsoweighted for the number of firms in each industry. Significance levels: ***1%, **5%, *10%.
50

Table 6: Effects of Trade Activity on the Skill Premium and Distribution, the role of exportdestinations.
DenmarkStep 1 w90/w50 w50/w10Export North 0.001 -0.001
(0.001) (0.002)Export South 0.004*** -0.006***
(0.001) (0.002)F stat 3834.16 3834.16N 8,566 8,566R-sq 0.159 0.408Step 2, skill definition 1 Mean SD Mean SDFirst year lag of predicted (w90/w50) 0.326*** 0.102***
(0.114) (0.026)First year lag of predicted (w50/w10) -0.219** -0.068**
(0.092) (0.031)N 8,566 8,566 8,566 8,566R-sq 0.893 0.567 0.893 0.567
PortugalStep 1 w90/w50 w50/w10Export North 0.029 0.042
(0.023) (0.028)Export South -0.005 -0.036
(0.028) (0.035)F stat 122.88 122.88N 1,102 1,102R-sq 0.549 0.328Step 2, skill definition 1 Mean SD Mean SDFirst year lag of predicted (w90/w50) omitted omitted
First year lag of predicted (w50/w10) omitted omitted
N 1,042 1,042 1,042 1,042R-sq 0.966 0.756 0.966 0.756
Notes: Skill definition 1 is based on the whole systematic component of the two-way fixed effectswage regression. In step 1, standard errors are clustered at the industry level. In step 2, standarderrors are clustered at the industry level and sequentially bootstrapped with step 1, 200 replications.All estimations are also weighted for the number of firms in each industry. Both steps also includethe following control variables: sales per employee, capital intensity (only for Denmark), workforcecomposition characteristics, year and 2 digit industry dummies. Significance levels: ***1%, **5%,*10%.
51

Table 7: Effects of Trade Activity on the Skill Premium and Distribution, the role of imports.
DenmarkStep 1 w90/w50 w50/w10Import 0.004*** -0.008***
(0.000) (0.001)F stat 31199.44 31199.44N 8,566 8,566R-sq 0.154 0.400Step 2, skill definition 1 Mean SD Mean SDFirst year lag of predicted (w90/w50) 0.357*** 0.190***
(0.122) (0.059)First year lag of predicted (w50/w10) -0.177** -0.094**
(0.08) (0.046)N 8,566 8,566 8,566 8,566R-sq 0.893 0.567 0.893 0.567
PortugalStep 1 w90/w50 w50/w10Import 0.042*** 0.024***
(0.005) (0.005)F stat 281.17 281.17N 1,126 1,126R-sq 0.604 0.610Step 2, skill definition 1 Mean SD Mean SDFirst year lag of predicted (w90/w50) -0.016 0.036
(0.023) (0.029)First year lag of predicted (w50/w10) -0.027 0.061
(0.047) (0.045)N 1,064 1,064 1,064 1,064R-sq 0.920 0.667 0.920 0.667
Notes: Skill definition 1 is based on the whole systematic component of the two-way fixed effectswage regression. In step 1, standard errors are clustered at the industry level. In step 2, standarderrors are clustered at the industry level and sequentially bootstrapped with step 1, 200 replications.All estimations are also weighted for the number of firms in each industry. Both steps also includethe following control variables: sales per employee, capital intensity (only for Denmark), workforcecomposition characteristics, year and 2 digit industry dummies. Significance levels: ***1%, **5%,*10%.
52

Table 8: Effects of Trade Activity on the Skill Premium and Distribution, high-tech sectors.
DenmarkStep 1 w90/w50 w50/w10Import 0.004** -0.026***
(0.002) (0.007)F stat 1285.377 1285.377N 1,313 1,313R-sq 0.255 0.472Step 2, skill definition 1 Mean SD Mean SDFirst year lag of predicted (w90/w50) 1.443** 0.527**
(0.578) (0.249)First year lag of predicted (w50/w10) -0.227** -0.083**
(0.098) (0.039)N 1,313 1,313 1,313 1,313R-sq 0.893 0.567 0.893 0.567
PortugalStep 1 w90/w50 w50/w10Export 0.012 0.051***
(0.007) (0.007)F stat 83.945 83.945N 186 186R-sq 0.793 0.831Step 2, skill definition 1 Mean SD Mean SDFirst year lag of predicted (w90/w50) omitted omitted
First year lag of predicted (w50/w10) -0.044* -0.002(0.024) (0.009)
N 176 176 176 176R-sq 0.957 0.746 0.975 0.746
Notes: Skill definition 1 is based on the whole systematic component of the two-way fixed effectswage regression. In step 1, standard errors are clustered at the industry level. In step 2, standarderrors are clustered at the industry level and sequentially bootstrapped with step 1, 200 replications.All estimations are also weighted for the number of firms in each industry. Both steps also includethe following control variables: sales per employee, capital intensity (only for Denmark), workforcecomposition characteristics, year and 2 digit industry dummies. Significance levels: ***1%, **5%,*10%.
53

Table 9: Effects of Trade Activity on the Skill Premium and Distribution, low-tech sectors.
DenmarkStep 1 w90/w50 w50/w10Import 0.009*** -0.033***
(0.001) (0.004)F stat 2820.041 2820.041N 6,157 6,157R-sq 0.173 0.377Step 2, skill definition 1 Mean SD Mean SDFirst year lag of predicted (w90/w50) 0.344** 0.081
(0.156) (0.06)First year lag of predicted (w50/w10) -0.091*** -0.021**
(0.031) (0.009)N 6,157 6,157 6,157 6,157R-sq 0.893 0.567 0.893 0.567
PortugalStep 1 w90/w50 w50/w10Export 0.049*** 0.002
(0.006) (0.005)F stat 135.99 135.99N 940 940R-sq 0.433 0.638Step 2, skill definition 1 Mean SD Mean SDFirst year lag of predicted (w90/w50) 0.0001 0.017*
(0.008) (0.009)First year lag of predicted (w50/w10) omitted omitted
N 888 888 888 888R-sq 0.970 0.791 0.970 0.783
Notes: Skill definition 1 is based on the whole systematic component of the two-way fixed effectswage regression. In step 1, standard errors are clustered at the industry level. In step 2, standarderrors are clustered at the industry level and sequentially bootstrapped with step 1, 200 replications.All estimations are also weighted for the number of firms in each industry. Both steps also includethe following control variables: sales per employee, capital intensity (only for Denmark), workforcecomposition characteristics, year and 2 digit industry dummies. Significance levels: ***1%, **5%,*10%.
54

Table 10: Robustness check on the instrumental variable, the role of correlated businesscycles across countries.
DenmarkStep 1 w90/w50 w50/w10Export 0.005*** -0.007***
(0.000) (0.001)F stat 34768.76 34768.76N 8,566 8,566R-sq 0.1487427 0.3990634Step 2, skill definition 1 Mean SD Mean SDFirst year lag of predicted (w90/w50) 1.646*** 0.360***
(0.619) (0.133)First year lag of predicted (w50/w10) -1.015*** -0.118***
(0.202) (0.043)N 8,566 8,566 8,566 8,566R-sq 0.893 0.567 0.893 0.567
PortugalStep 1 w90/w50 w50/w10Export 0.036*** 0.019***
(0.004) (0.004)F stat 209.547 209.547N 1,137 1,137R-sq 0.555 0.598Step 2, skill definition 1 Mean SD Mean SDFirst year lag of predicted (w90/w50) -0.015 0.009
(0.011) (0.007)First year lag of predicted (w50/w10) -0.028 0.017
(0.021) (0.015)N 1,064 1,064 1,064 1,064R-sq 0.966 0.754 0.966 0.754
Notes: Skill definition 1 is based on the whole systematic component of the two-way fixed effectswage regression. In step 1, standard errors are clustered at the industry level. In step 2, standarderrors are clustered at the industry level and sequentially bootstrapped with step 1, 200 replications.All estimations are also weighted for the number of firms in each industry. Both steps also includethe following control variables: sales per employee, capital intensity (only for Denmark), workforcecomposition characteristics, year and 2 digit industry dummies. Significance levels: ***1%, **5%,*10%.
55

Table 11: Robustness check on the instrumental variable: the role of correlated technologyor demand shocks (Colantone and Crino’, 2014)
DenmarkStep 1 w90/w50 w50/w10Export 0.002*** -0.005***
(0.000) (0.001)F stat 29370.04 29370.04N 7,415 7,415R-sq 0.159 0.412Step 2, skill definition 1 Mean SD Mean SDFirst year lag of predicted (w90/w50) 0.688** 0.158**
(0.304) (0.065)First year lag of predicted (w50/w10) -0.291** -0.067
(0.202) (0.042)N 7,415 7,415 7,415 7,415R-sq 0.893 0.567 0.893 0.567
PortugalStep 1 w90/w50 w50/w10Export 0.037*** 0.004
(0.004) (0.004)F stat 275.67 275.67N 979 979R-sq 0.584 0.675Step 2, skill definition 1 Mean SD Mean SDFirst year lag of predicted (w90/w50) -0.013 -0.006
(0.012) (0.005)First year lag of predicted (w50/w10) omitted omitted
N 925 925 925 925R-sq 0.966 0.779 0.966 0.777
Notes: Skill definition 1 is based on the whole systematic component of the two-way fixed effectswage regression. In step 1, standard errors are clustered at the industry level. In step 2, standarderrors are clustered at the industry level and sequentially bootstrapped with step 1, 200 replications.All estimations are also weighted for the number of firms in each industry. Both steps also includethe following control variables: sales per employee, capital intensity (only for Denmark), workforcecomposition characteristics, year and 2 digit industry dummies. Significance levels: ***1%, **5%,*10%.
56
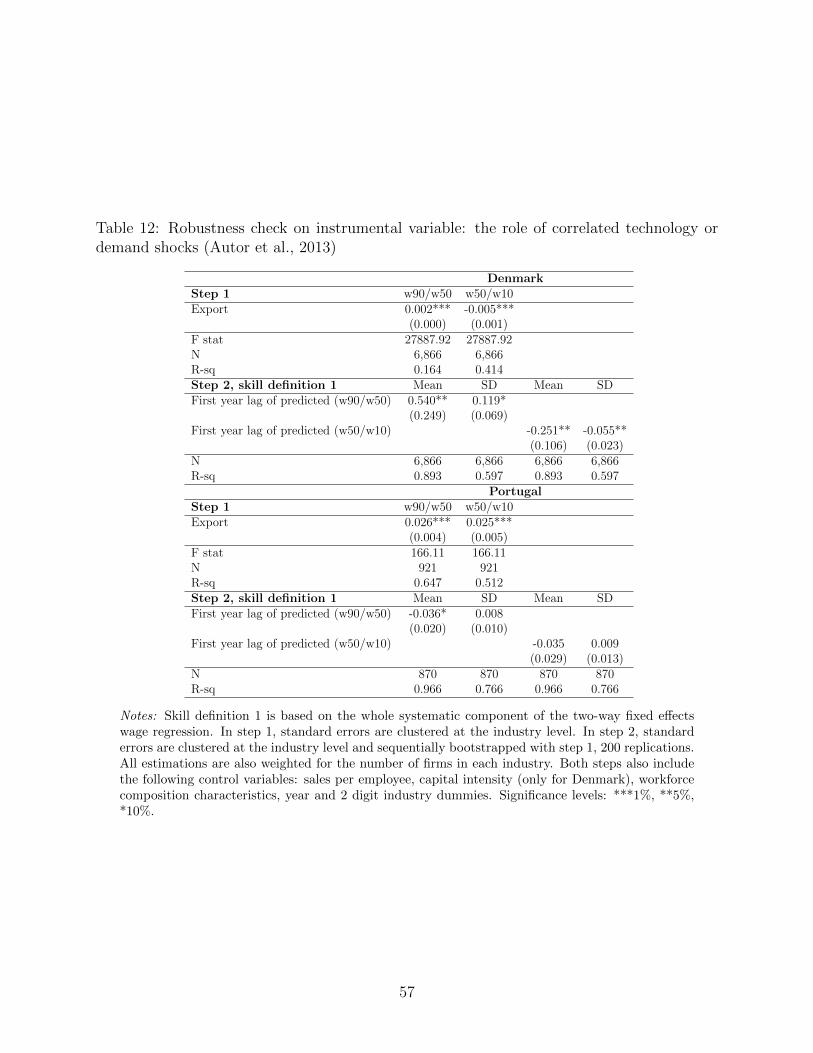
Table 12: Robustness check on instrumental variable: the role of correlated technology ordemand shocks (Autor et al., 2013)
DenmarkStep 1 w90/w50 w50/w10Export 0.002*** -0.005***
(0.000) (0.001)F stat 27887.92 27887.92N 6,866 6,866R-sq 0.164 0.414Step 2, skill definition 1 Mean SD Mean SDFirst year lag of predicted (w90/w50) 0.540** 0.119*
(0.249) (0.069)First year lag of predicted (w50/w10) -0.251** -0.055**
(0.106) (0.023)N 6,866 6,866 6,866 6,866R-sq 0.893 0.597 0.893 0.597
PortugalStep 1 w90/w50 w50/w10Export 0.026*** 0.025***
(0.004) (0.005)F stat 166.11 166.11N 921 921R-sq 0.647 0.512Step 2, skill definition 1 Mean SD Mean SDFirst year lag of predicted (w90/w50) -0.036* 0.008
(0.020) (0.010)First year lag of predicted (w50/w10) -0.035 0.009
(0.029) (0.013)N 870 870 870 870R-sq 0.966 0.766 0.966 0.766
Notes: Skill definition 1 is based on the whole systematic component of the two-way fixed effectswage regression. In step 1, standard errors are clustered at the industry level. In step 2, standarderrors are clustered at the industry level and sequentially bootstrapped with step 1, 200 replications.All estimations are also weighted for the number of firms in each industry. Both steps also includethe following control variables: sales per employee, capital intensity (only for Denmark), workforcecomposition characteristics, year and 2 digit industry dummies. Significance levels: ***1%, **5%,*10%.
57

Table 13: Effects of Trade Activity on the Skill Premium and Distribution, Danish industryclassification at 3-digit.
DenmarkStep 1 w90/w50 w50/w10Export 0.002*** -0.011***
(0.001) (0.002)F stat 8061.727 8061.727N 1,200 1,200R-sq 0.253 0.452Step 2, skill definition 1 Mean SD Mean SDLagged of predicted (w90/w50) 1.896*** 0.705**
(0.873) (0.353)Lagged of predicted (w50/w10) -1.106*** -0.132**
(0.183) (0.066)N 1,200 1,200 1,200 1,200R-sq 0.893 0.567 0.893 0.567
Notes: Skill definition 1 is based on the whole systematic component of the two-way fixed effectswage regression. Both steps also include the following control variables: sales per employee, capitalintensity, workforce composition characteristics, year and 2 digit industry dummies. In step 1,standard errors are clustered at the industry level. In step 2, standard errors are clustered at theindustry level and sequentially bootstrapped with step 1, 200 replications. All estimations are alsoweighted for the number of firms in each industry. Significance levels: ***1%, **5%, *10%.
58
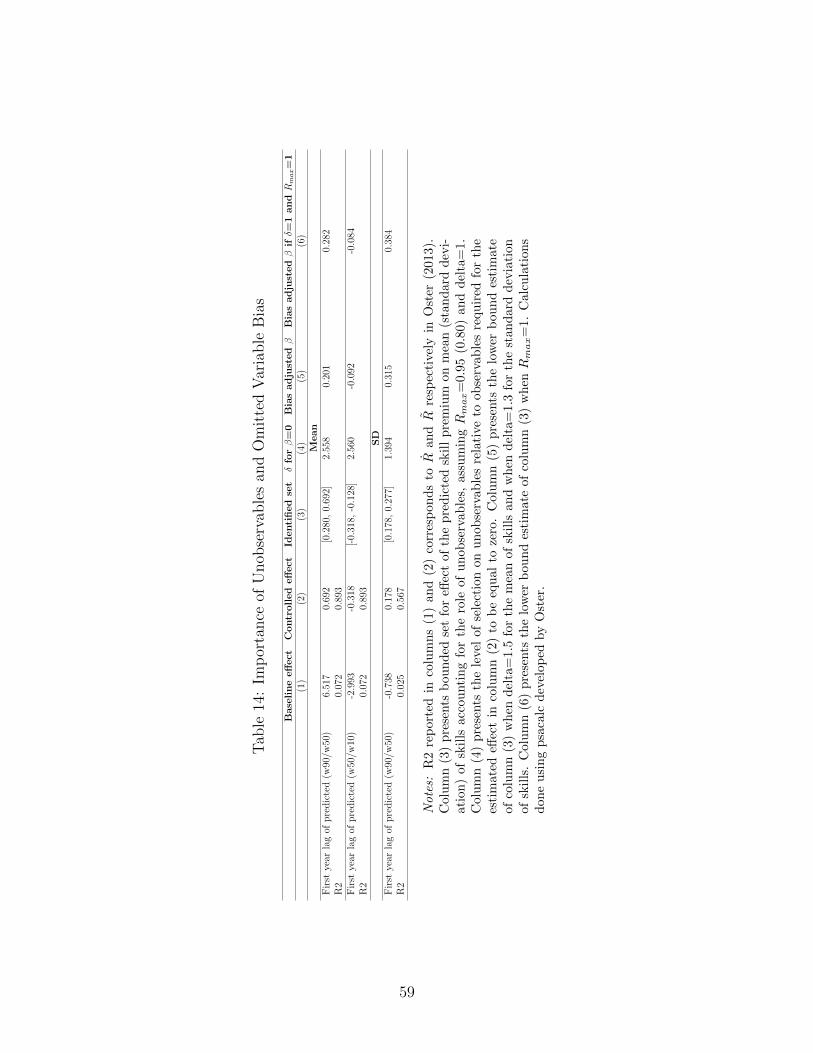
Tab
le14
:Im
por
tance
ofU
nob
serv
able
san
dO
mit
ted
Var
iable
Bia
s
Base
line
eff
ect
Contr
olled
eff
ect
Identi
fied
set
δfo
rβ=
0B
ias
adju
stedβ
Bia
sadju
stedβ
ifδ=
1andRmax=
1(1
)(2
)(3
)(4
)(5
)(6
)M
ean
Fir
stye
arla
gof
pre
dic
ted
(w90
/w50
)6.
517
0.69
2[0
.280
,0.
692]
2.55
80.
201
0.28
2R
20.
072
0.89
3F
irst
year
lag
ofp
red
icte
d(w
50/w
10)
-2.9
93-0
.318
[-0.
318,
-0.1
28]
2.56
0-0
.092
-0.0
84R
20.
072
0.89
3SD
Fir
stye
arla
gof
pre
dic
ted
(w90
/w50
)-0
.738
0.17
8[0
.178
,0.
277]
1.39
40.
315
0.38
4R
20.
025
0.56
7
Notes:
R2
rep
orte
din
colu
mn
s(1
)an
d(2
)co
rres
pon
ds
toR
an
dR
resp
ecti
vely
inO
ster
(2013).
Col
um
n(3
)p
rese
nts
bou
nd
edse
tfo
reff
ect
of
the
pre
dic
ted
skil
lp
rem
ium
on
mea
n(s
tan
dard
dev
i-at
ion
)of
skil
lsac
cou
nti
ng
for
the
role
of
un
ob
serv
ab
les,
ass
um
ingR
max=
0.9
5(0
.80)
an
dd
elta
=1.
Col
um
n(4
)p
rese
nts
the
level
of
sele
ctio
non
un
ob
serv
ab
les
rela
tive
toob
serv
ab
les
requ
ired
for
the
esti
mat
edeff
ect
inco
lum
n(2
)to
be
equ
al
toze
ro.
Colu
mn
(5)
pre
sents
the
low
erb
ou
nd
esti
mate
ofco
lum
n(3
)w
hen
del
ta=
1.5
for
the
mea
nof
skil
lsan
dw
hen
del
ta=
1.3
for
the
stan
dar
dd
evia
tion
ofsk
ills
.C
olu
mn
(6)
pre
sents
the
low
erb
ou
nd
esti
mate
of
colu
mn
(3)
wh
enR
max=
1.
Calc
ula
tion
sd
one
usi
ng
psa
calc
dev
elop
edby
Ost
er.
59

Table 15: Effects of Trade Activity on the Skill Premium and Distribution, specificationwith two and three years lag.
DenmarkStep 2, skill definition 1 Mean SD Mean SDPredicted (w90/w50), two years lag 0.631** 0.176*
(0.281) (0.101)Predicted (w50/w10), two years lag -0.290*** -0.081*
(0.141) (0.048)N 8,046 8,046 8,046 8,046R-sq 0.793 0.547 0.793 0.544Step 2, skill definition 1 Mean SD Mean SDPredicted (w90/w50), three years lag 0.453 0.207***
(0.313) (0.064)Predicted (w50/w10), three years lag -0.208* -0.095
(0.113) (0.071)N 8,046 8,046 8,046 8,046R-sq 0.761 0.512 0.772 0.532
PortugalStep 2, skill definition 1 Mean SD Mean SDPredicted (w90/w50), two years lag -0.015 0.006
(0.012) (0.008)Predicted (w50/w10), two years lag -0.027 0.012
(0.022) (0.017)N 1,003 1,003 1,003 1,003R-sq 0.964 0.760 0.964 0.760Step 2, skill definition 1 Mean SD Mean SDPredicted (w90/w50), three years lag -0.020 0.004
(0.014) (0.008)Predicted (w50/w10), three years lag -0.036 0.007
(0.025) (0.015)N 942 942 942 942R-sq 0.962 0.765 0.962 0.765
Notes: Skill definition 1 is based on the whole systematic component of the two-way fixed effectswage regression. Both steps also include the following control variables: sales per employee, capi-tal intensity (only for Denmark), workforce composition characteristics, year and 2 digit industrydummies. In step 1, standard errors are clustered at the industry level. In step 2, standard errorsare clustered at the industry level and sequentially bootstrapped with step 1, 200 replications. Allestimations are also weighted for the number of firms in each industry. Significance levels: ***1%,**5%, *10%.
60