trade integration and global value chains in sub-saharan africa
TRANSCRIPT
Trade Integration and Global Value Chains in Sub-Saharan Africa
African Deparment
In Pursuit of the Missing Link
I N T E R N A T I O N A L M O N E T A R Y F U N D
Staff team of Céline Allard, Jorge Iván Canales Kriljenko, Wenjie Chen, Jesus Gonzalez-Garcia, Emmanouil Kitsios, and Juan Treviño

I N T E R N A T I O N A L M O N E T A R Y F U N D
T h e A f r i c a n D e p a r t m e n t
Trade Integration and Global Value Chains in Sub-Saharan Africa In Pursuit of the Missing Link
A staff team of Céline Allard, Jorge Iván Canales Kriljenko, Wenjie Chen, Jesus Gonzalez-Garcia, Emmanouil Kitsios, and Juan Treviño

Copyright © 2016 International Monetary Fund
Cataloging-in-Publication Data Joint Bank-Fund Library
Names: Allard, Céline. | Canales‐Kriljenko, Jorge Iván. | Chen, Wenjie, Professor of international business. | Gonzalez‐Garcia, Jesus. | Kitsios, Emmanouil. | Treviño, Juan P. (Juan Pedro) | International Monetary Fund. | International Monetary Fund. African Department.
Title: Trade integration and global value chains in Sub‐Saharan Africa : in pursuit of the missing link / a staff team of Céline Allard, Jorge Iván Canales Kriljenko, Wenjie Chen, Jesus Gonzalez‐Garcia, Emmanouil Kitsios, and Juan Treviño.
Description: Washington, DC : International Monetary Fund, 2016. | Includes bibliographical references. | At head of title: The African Department.
Identifiers: ISBN 978‐1‐49834‐990‐1 (paper) Subjects: LCSH: Sub‐Saharan Africa—Economic integration. | Customs unions—Sub‐Saharan
Africa. | Economic development—Sub‐Saharan Africa. Classification: LCC HC800.T723 2016
Publication orders may be placed online, by fax, or through the mail: International Monetary Fund, Publication Services
P.O. Box 92780, Washington, DC 20090, U.S.A. Tel. (202) 623-7430 Fax: (202) 623-7201
E-mail: [email protected] www.imfbookstore.org www.elibrary.imf.org
The Departmental Paper Series presents research by IMF staff on issues of broad regional or cross-country interest. The views expressed in this paper are those of the author(s) and do not necessarily represent the views of the IMF, its Executive Board, or IMF management.
INTERNATIONAL MONETARY FUND iii
Contents
Overview ........................................................................................................................ v Chapter 1. Trade Integration Over the Past 20 Years .............................................. 1 Chapter 2. Centrality in the Global and Regional Trade Network .......................... 7 Chapter 3. Trade Openness and Macroeconomic Performance ........................... 11 Chapter 4. Scope for Further Integration? An Analysis Based on a Gravity Model ......................................................................................................... 15 Chapter 5. Global Value Chains ................................................................................ 21 Chapter 6. Conclusion ................................................................................................ 33 References ................................................................................................................... 35
Figures Figure 1. Exports of Goods Shares by Partner, 1995–2013 ................................................. 2 Figure 2. Change in Export Shares, 1995–2013 ........................................................................ 3 Figure 3. Real Export Value Decomposition, 1981–2013...................................................... 4 Figure 4. Goods and Services Export Compositions, Average 2008-12 ......................... 5 Figure 5. Change in Export Shares, 1995–2013 ........................................................................ 6 Figure 6. World Centrality per Region, 2000–13 ...................................................................... 8 Figure 7. Regional Centrality, 2013 ............................................................................................... 9 Figure 8. Trade Openness to GDP, 1983–2011 ...................................................................... 11 Figure 9. Annual Per Capita Real GDP Growth ...................................................................... 12 Figure 10. Trade and GDP per Person Employed, 1990–2011 ........................................ 13 Figure 11. Trade Flows Compared with other Regions ...................................................... 18 Figure 12. Potential Increase in Trade ....................................................................................... 19 Figure 13. Value-Added Trade and Global Value Chains– An illustrative Example ............................................................................................................... 23 Figure 14a. Depth of Integration in Global Value Chains and Real GDP per Capita, Average 1991–95 and 2008–12 (full country sample) ................................................................................................................... 24 Figure 14b. Depth of Integration in Global Value Chains and Real GDP per Capita, Average 1991–95 and 2008–12 (subset of countries with 2005 GDP per capita below 3,500 U.S. dollars) ............ 25 Figure 15. Global Value Chains Participation, Average 1991–95 and 2008–12 ........ 25
iv INTERNATIONAL MONETARY FUND
Figure 16. Sub-Saharan Africa and Comparator Countries: Depth of Integration in Global Value Chains, Average 2008–12 .............................. 26 Figure 17. Depth of Integration in Global Value Chains, Average 1991–95 and 2008–12 .............................................................................................. 27 Figure 18. Decomposition of Change in Depth of Integration in Global Value Chains, Average 1991–95 to 2008–12 ................................................. 28 Figure 19. Share of Manufacturing Value Added ................................................................. 29
Tables Table 1. Gravity Model Estimates ................................................................................................ 16Table 2. Output Drops and Decelerations (1990–2013) .................................................... 17Table 3. Panel Regression of Backward Integration and Policy Variables .................. 31
INTERNATIONAL MONETARY FUND v
Overview
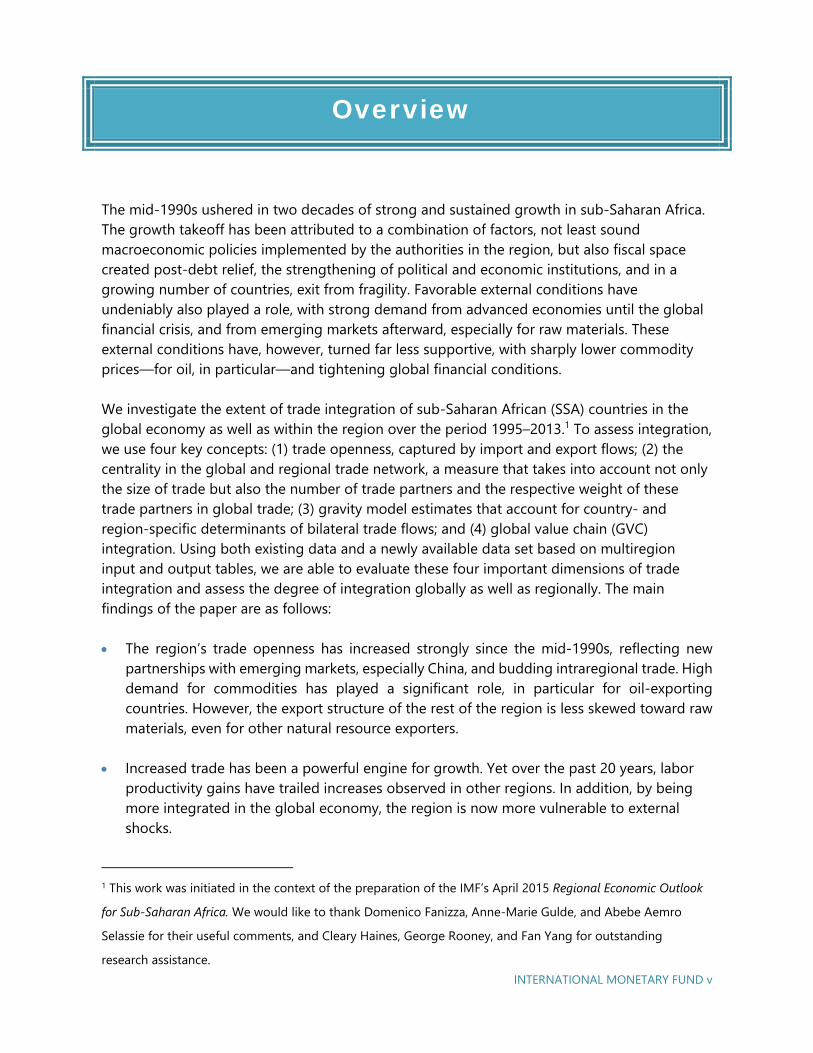
The mid-1990s ushered in two decades of strong and sustained growth in sub-Saharan Africa. The growth takeoff has been attributed to a combination of factors, not least sound macroeconomic policies implemented by the authorities in the region, but also fiscal space created post-debt relief, the strengthening of political and economic institutions, and in a growing number of countries, exit from fragility. Favorable external conditions have undeniably also played a role, with strong demand from advanced economies until the global financial crisis, and from emerging markets afterward, especially for raw materials. These external conditions have, however, turned far less supportive, with sharply lower commodity prices—for oil, in particular—and tightening global financial conditions.
We investigate the extent of trade integration of sub-Saharan African (SSA) countries in the global economy as well as within the region over the period 1995–2013.1 To assess integration, we use four key concepts: (1) trade openness, captured by import and export flows; (2) the centrality in the global and regional trade network, a measure that takes into account not only the size of trade but also the number of trade partners and the respective weight of these trade partners in global trade; (3) gravity model estimates that account for country- and region-specific determinants of bilateral trade flows; and (4) global value chain (GVC) integration. Using both existing data and a newly available data set based on multiregion input and output tables, we are able to evaluate these four important dimensions of trade integration and assess the degree of integration globally as well as regionally. The main findings of the paper are as follows:
The region’s trade openness has increased strongly since the mid-1990s, reflecting newpartnerships with emerging markets, especially China, and budding intraregional trade. Highdemand for commodities has played a significant role, in particular for oil-exportingcountries. However, the export structure of the rest of the region is less skewed toward rawmaterials, even for other natural resource exporters.
Increased trade has been a powerful engine for growth. Yet over the past 20 years, laborproductivity gains have trailed increases observed in other regions. In addition, by beingmore integrated in the global economy, the region is now more vulnerable to externalshocks.
1 This work was initiated in the context of the preparation of the IMF’s April 2015 Regional Economic Outlook
for Sub-Saharan Africa. We would like to thank Domenico Fanizza, Anne-Marie Gulde, and Abebe Aemro Selassie for their useful comments, and Cleary Haines, George Rooney, and Fan Yang for outstanding research assistance.

vi INTERNATIONAL MONETARY FUND
Substantial opportunities for further regional and global trade integration still lie ahead.Despite strong growth in trade flows, sub-Saharan Africa’s trade has barely kept pace withthe expansion of global trade, even as other regions managed to increase their weight inthe global trade network over the same period. Indeed, even after accounting for lowerlevels of income and economic size, generally longer distances between countries, and alarge number of landlocked countries, levels of trade flows emanating from sub-SaharanAfrica are found to be only half the magnitude of those experienced elsewhere in theworld.
Likewise, the region still has ways to go to better integrate in GVCs—a process that hasconsistently been associated with higher levels of activity and income growth over time—as has happened in South and East Asia or Eastern Europe. However, while oil-exportingcountries are clearly lagging behind, many other countries—both commodity and non-commodity exporters—are showing progress, even if from very low starting points, withthe East African Community (EAC) and the Southern African Customs Union (SACU)particular bright spots. In countries that have made the largest strides into GVCs—such asEthiopia, Kenya, Seychelles, South Africa, or Tanzania—manufacturing, agriculture, andagro-business—and, to a lesser extent, transport, tourism, and textile—have benefited themost from deeper integration. These results highlight the potential sectors where theregion could build on its comparative advantages, provided the business environment issufficiently conducive.
In that respect, our analysis suggests that, to leverage the region’s trade potential andensure strong job creation and durable growth in the process—especially at a juncturewhen external demand for commodities is far less supportive—it is more critical than everto make progress in filling the infrastructure gap, lowering tariff and nontariff barriers, andimproving the business climate and access to credit, while continuing to enhanceeducation outcomes.
The rest of the paper is organized as follows. In Section 1, we document SSA’s international and regional integration over the past 20 years. In Section 2, we introduce the concept of centrality in the global and regional trade network, which takes into account, for each country, both the size of its trade and the number of its trade partners and their weight on global trade. The third section links trade openness with macroeconomic performances. To investigate the determinants of trade and estimate the order of magnitude of a potential “trade gap” for sub-Saharan Africa, we use a gravity model approach in Section 4, explaining bilateral trade flows with both country- and region-specific determinants. Section 5 assesses the extent of SSA’s integration into global supply chains, using the newly created Eora database that provides multiregion input output tables. Section 6 concludes the paper.
INTERNATIONAL MONETARY FUND 1
Trade Integration Over the
Past 20 Years
Sub-Saharan Africa’s trade experienced a rapid expansion over the past 20 years. While cumulative nominal GDP growth for the region over 1995–2013 amounted to a substantial 350 percent (in U.S. dollars), the equivalent increase for goods exports was even larger, at 500 percent—over the same period, global trade expanded by 260 percent. The region’s export-to-GDP ratio2 rose from 20½ percent in 1995 to 27½ percent in 2013, with the import-to-GDP ratio also increasing, from 19 percent to 23 percent.
In the process, the destination of sub-Saharan Africa’s exports changed substantially: trade flows with advanced economies, which represented close to 90 percent of exports in 1995, slumped in the wake of the global crisis. Meanwhile, new trade partnerships were forged with emerging markets such as Brazil, China, and India. China is now the single most important trading partner of sub-Saharan Africa (IMF 2012, 2014c). Moreover, the share of intraregional trade almost doubled, although from a very low base, to reach 3½ percent of the region’s GDP.
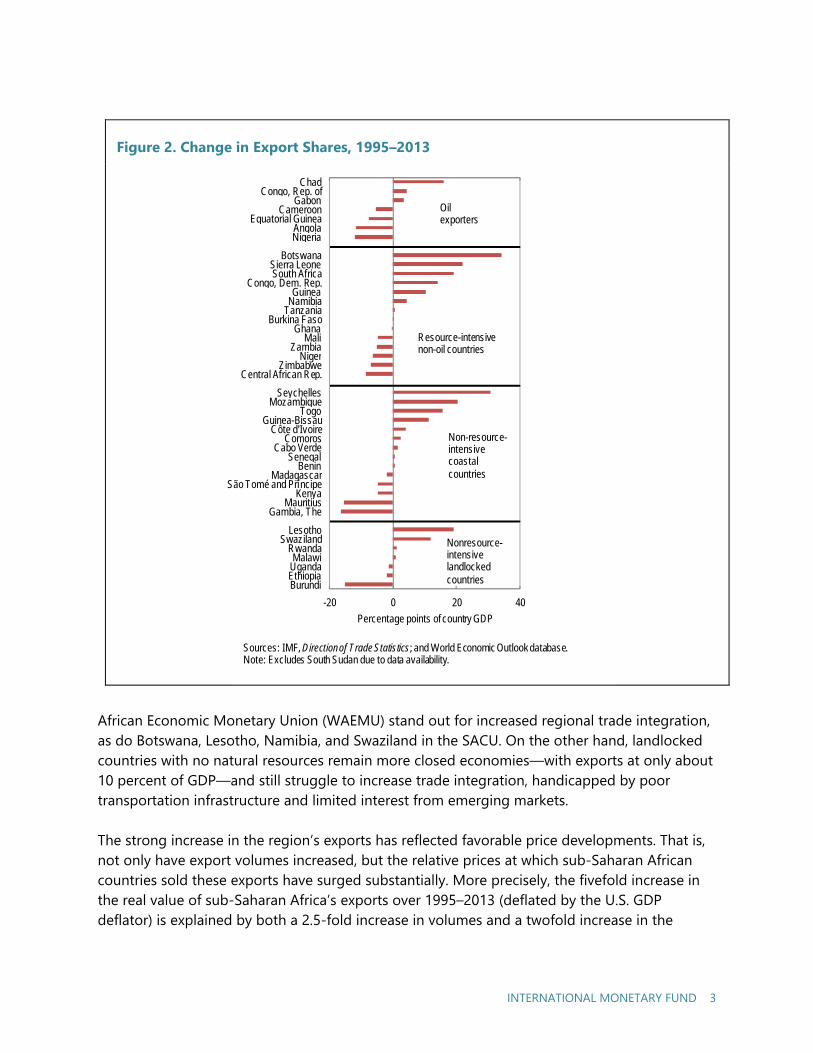
Trade patterns, however, are extremely heterogeneous across the region. In fact, while the export-to-GDP ratio has more than doubled for resource-rich non-oil exporters over 1995–2013—with South Africa accounting for about two-thirds of that increase—it has stagnated for non-commodity exporters as a group, and even dropped for oil exporters (Figure 1).
We conduct a more country-specific analysis that corroborates these findings. We define resource-intensive exporters as those for which nonrenewable resources represent 25 percent or more of goods exports over 2009-12. By dividing SSA countries into groups of oil exporters versus resource-intensive non-oil exporters, and coastal non-resource-intensive exporters versus landlocked non-resource-intensive exporters, Figure 2 depicts the changes in export shares between 1995 and 2013. New natural resource exporters over the period, such as Chad
2 We measure trade openness with export- and import-to-GDP ratio to document actual trade flows in sub-Saharan Africa as it has been commonly used in the literature; see, for example, Baldwin 2004. Alternatively, one could also study tariffs and impediments to trade, which would be more suited to an analysis of the effects of trade liberalization. The analysis on the determinants of trade openness includes tariff and other nontariff barrier measures in the later sections.
1

2 INTERNATIONAL MONETARY FUND
and Sierra Leone, have seen their export share increase substantially, driven by growing emerging markets’ interest for commodities. Conversely, export shares in most longtime commodity exporters, such as Angola, Equatorial Guinea, or Zambia, have declined over time—underscoring the difficulty to broaden the export base in countries with a longtime role of commodities. Moreover, in many countries, rapid GDP growth has been accompanied by the development of buoyant nontradables sectors, leading not only to a welcome diversification of growth sources but also to a somewhat lower trade share, with Nigeria standing out in that respect. As for regional trade, countries such as Côte d’Ivoire, Senegal, and Togo, in the West
Figure 1. Exports of Goods Shares by Partner, 1995–2013
11.27.0
21.2
10.0
2.1
2.0
0.6
1.7
1.0
2.9
0.6
5.9
0
5
10
15
20
25
30
35
40
1995 2013
Perc
ent o
f GD
P
Oil exporters
Countries in group: 7GDP share: 42.3 percent
4.3 4.1
9.2 9.4
1.7 4.11.6
9.7
0
5
10
15
20
25
30
35
40
1995 2013
Perc
ent o
f GD
P
Resource-intensive non-oil countries1
Countries in group: 15GDP share: 38.3 percent
10.36.0
7.8
3.1
3.8
7.5
0.3
0.90.9
0
5
10
15
20
25
30
35
40
1995 2013
Perc
ent o
f GD
P
Non-resource-intensive coastal countries
Countries in group: 15GDP share: 11.3 percent
5.22.1
4.8
3.3
0.3
1.90.7
0
5
10
15
20
25
30
35
40
1995 2013
Perc
ent o
f GD
PChinaIndiaBrazilSub-Saharan AfricaAdvanced (non-euro) and othersEuro area
Nonr-esource-intensive landlocked countries
Countries in group: 7GDP share: 8.1 percent
Source: IMF, Direction of Trade Statistics..Note: Excludes South Sudan due to data availability. Oil-rich sub-Saharan Africa includes: Angola, Cameroon, Chad, Republic of Congo, Equatorial Guniea, Gabon, and Nigeria. Resource-intensive sub-Saharan Africa inlcudes Botswana, Burkina Faso, Central African Republic, Democratic Republic of Congo, Ghana, Guinea, Liberia, Mali, Namibia, Niger, Sierra Leone, South Africa, Tanzania, Zambia, and Zimbabwe. Non-resource-intensive coastal sub-Saharan Africa includes Benin, Cabo Verde, Comoros, Côte d'Ivoire, Eritrea, The Gambia, Guinea-Bissau, Kenya, Liberia, Madagascar, Mauritius, Mozambique, São Tomé and Príncipe, Senegal, Seychelles, and Togo. Non-resource rich landlocked sub-Saharan Africa includes Burundi, Ethiopia, Lesotho, Malawi, Rwanda, Swaziland, and Uganda.1 Resource-intensive countries are defined as those for which nonrenewable resource exports are 25 percent or more of goods exportson average over 2009–2012.
INTERNATIONAL MONETARY FUND 3
Figure 2. Change in Export Shares, 1995–2013
African Economic Monetary Union (WAEMU) stand out for increased regional trade integration, as do Botswana, Lesotho, Namibia, and Swaziland in the SACU. On the other hand, landlocked countries with no natural resources remain more closed economies—with exports at only about 10 percent of GDP—and still struggle to increase trade integration, handicapped by poor transportation infrastructure and limited interest from emerging markets.
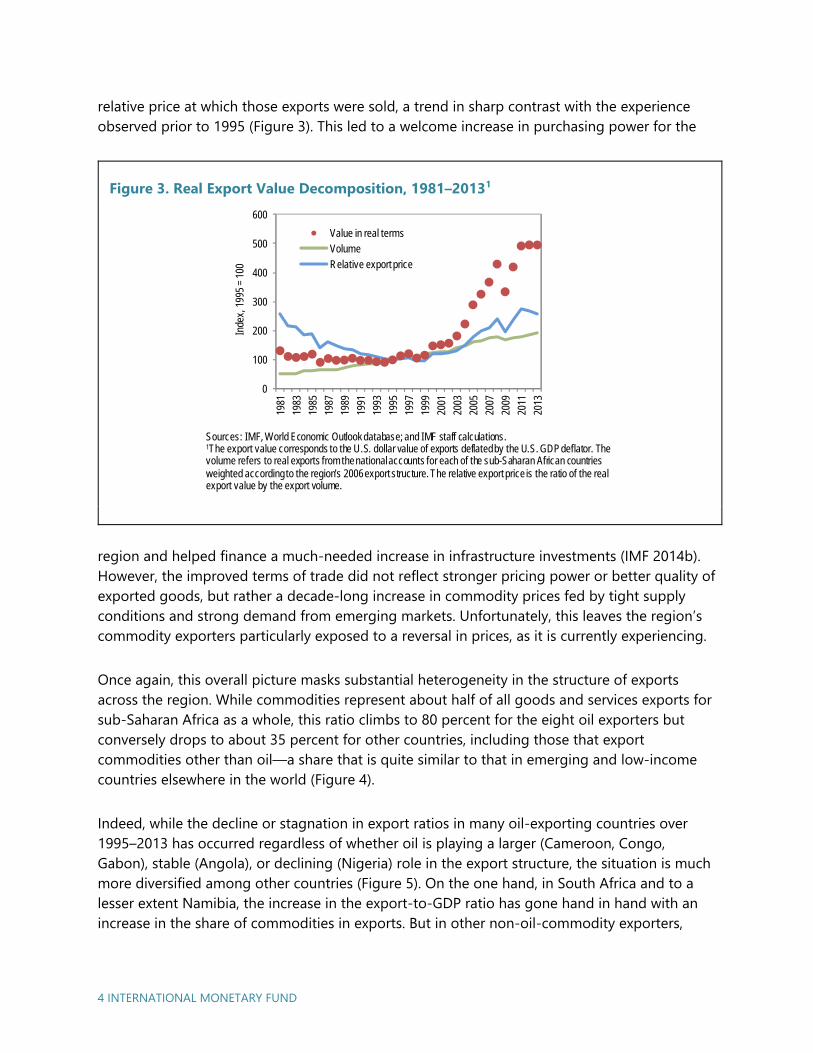
The strong increase in the region’s exports has reflected favorable price developments. That is, not only have export volumes increased, but the relative prices at which sub-Saharan African countries sold these exports have surged substantially. More precisely, the fivefold increase in the real value of sub-Saharan Africa’s exports over 1995–2013 (deflated by the U.S. GDP deflator) is explained by both a 2.5-fold increase in volumes and a twofold increase in the
-20 0 20 40
BurundiEthiopiaUgandaMalawi
RwandaSwaziland
Lesotho
Gambia, TheMauritius
KenyaSão Tomé and Príncipe
MadagascarBenin
SenegalCabo Verde
ComorosCôte d'Ivoire
Guinea-BissauTogo
MozambiqueSeychelles
Central African Rep.Zimbabwe
NigerZambia
MaliGhana
Burkina FasoTanzaniaNamibiaGuinea
Congo, Dem. Rep.South AfricaSierra Leone
Botswana
NigeriaAngola
Equatorial GuineaCameroon
GabonCongo, Rep. of
Chad
Percentage points of country GDP
Oil exporters
Resource-intensive non-oil countries
Non-resource-intensive coastal countries
Nonresource-intensive landlocked countries
Sources: IMF, Direction of Trade Statistics; and World Economic Outlook database.Note: Excludes South Sudan due to data availability.
4 INTERNATIONAL MONETARY FUND
relative price at which those exports were sold, a trend in sharp contrast with the experience observed prior to 1995 (Figure 3). This led to a welcome increase in purchasing power for the
region and helped finance a much-needed increase in infrastructure investments (IMF 2014b). However, the improved terms of trade did not reflect stronger pricing power or better quality of exported goods, but rather a decade-long increase in commodity prices fed by tight supply conditions and strong demand from emerging markets. Unfortunately, this leaves the region’s commodity exporters particularly exposed to a reversal in prices, as it is currently experiencing.
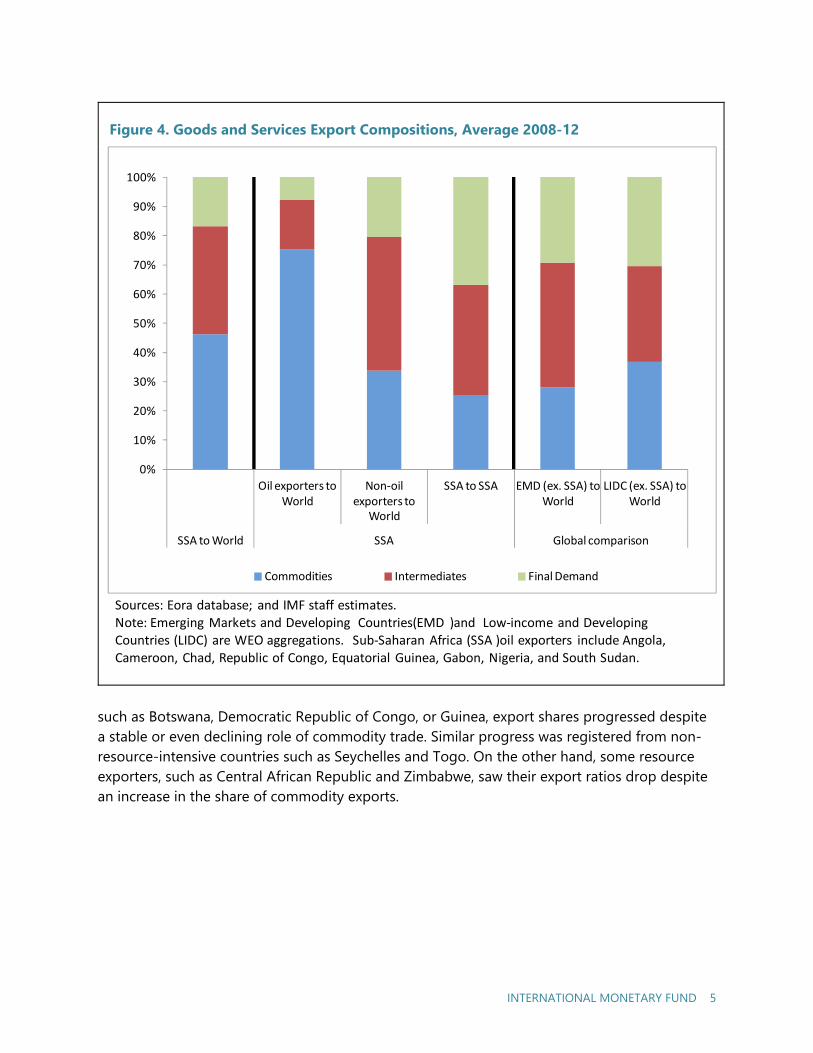
Once again, this overall picture masks substantial heterogeneity in the structure of exports across the region. While commodities represent about half of all goods and services exports for sub-Saharan Africa as a whole, this ratio climbs to 80 percent for the eight oil exporters but conversely drops to about 35 percent for other countries, including those that export commodities other than oil—a share that is quite similar to that in emerging and low-income countries elsewhere in the world (Figure 4).
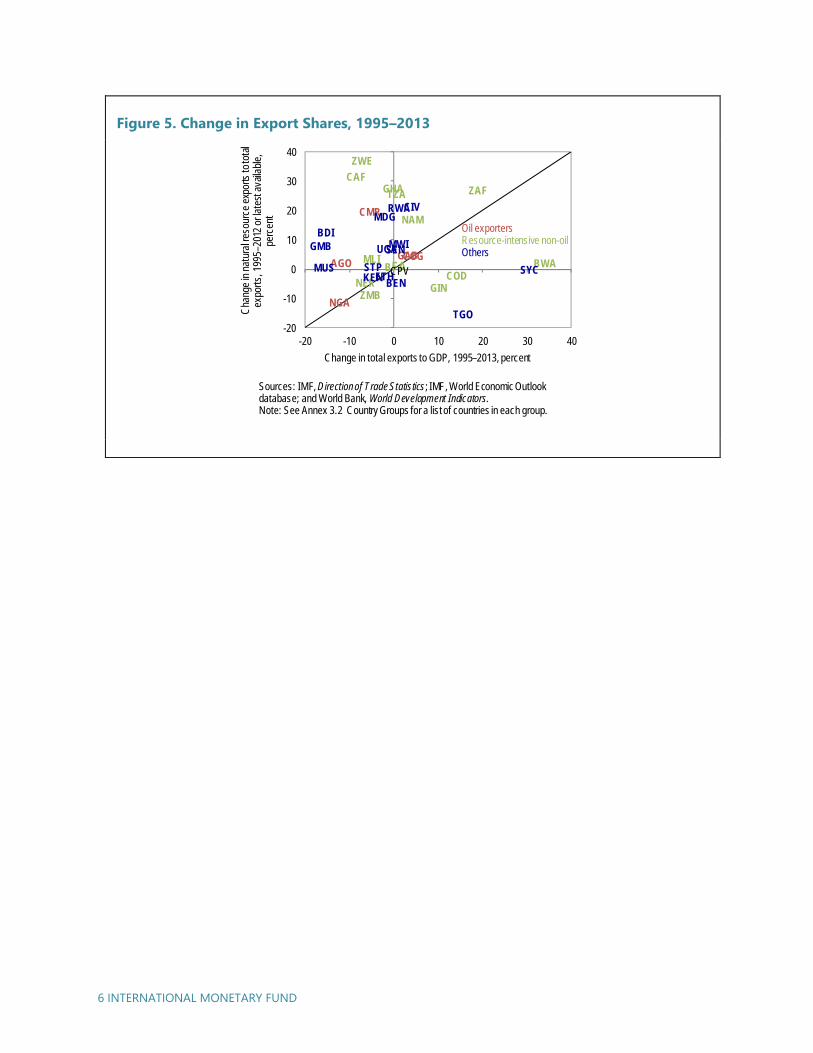
Indeed, while the decline or stagnation in export ratios in many oil-exporting countries over 1995–2013 has occurred regardless of whether oil is playing a larger (Cameroon, Congo, Gabon), stable (Angola), or declining (Nigeria) role in the export structure, the situation is much more diversified among other countries (Figure 5). On the one hand, in South Africa and to a lesser extent Namibia, the increase in the export-to-GDP ratio has gone hand in hand with an increase in the share of commodities in exports. But in other non-oil-commodity exporters,
Figure 3. Real Export Value Decomposition, 1981–20131
0
100
200
300
400
500
600
1981
1983
1985
1987
1989
1991
1993
1995
1997
1999
2001
2003
2005
2007
2009
2011
2013
Inde
x, 1
995
= 10
0Value in real termsVolumeRelative export price
Sources: IMF, World Economic Outlook database; and IMF staff calculations.1The export value corresponds to the U.S. dollar value of exports deflated by the U.S. GDP deflator. The volume refers to real exports from the national accounts for each of the sub-Saharan African countries weighted according to the region's 2006 export structure. The relative export price is the ratio of the real export value by the export volume.
INTERNATIONAL MONETARY FUND 5
such as Botswana, Democratic Republic of Congo, or Guinea, export shares progressed despite a stable or even declining role of commodity trade. Similar progress was registered from non- resource-intensive countries such as Seychelles and Togo. On the other hand, some resource exporters, such as Central African Republic and Zimbabwe, saw their export ratios drop despite an increase in the share of commodity exports.
Figure 4. Goods and Services Export Compositions, Average 2008-12
0%
10%
20%
30%
40%
50%
60%
70%
80%
90%
100%
Oil exporters to World
Non‐oil exporters to
World
SSA to SSA EMD (ex. SSA) to World
LIDC (ex. SSA) to World
SSA to World SSA Global comparison
Commodities Intermediates Final Demand
Sources: Eora database; and IMF staff estimates.Note: Emerging Markets and Developing Countries(EMD )and Low‐income and Developing Countries (LIDC) are WEO aggregations. Sub‐Saharan Africa (SSA )oil exporters include Angola, Cameroon, Chad, Republic of Congo, Equatorial Guinea, Gabon, Nigeria, and South Sudan.
6 INTERNATIONAL MONETARY FUND
Figure 5. Change in Export Shares, 1995–2013
NGA
AGOGABCOG
CMR
GINCOD
ZWE
NER
ZAFTZAGHACAF
MLI
NAM
ZMB
BWABFAKEN
MDG
MWI
ETH
RWACIV
UGA
TGO
BDI
SEN
BEN
GMB
STP SYCMUS CPV
-20
-10
0
10
20
30
40
-20 -10 0 10 20 30 40
Cha
nge
in n
atur
al re
sour
ce e
xpor
ts to
tota
l ex
ports
, 199
5–20
12 o
r lat
est a
vaila
ble,
pe
rcen
t
Change in total exports to GDP, 1995–2013, percent
Oil exportersResource-intensive non-oilOthers
Sources: IMF, Direction of Trade Statistics; IMF, World Economic Outlook database; and World Bank, World Development Indicators.Note: See Annex 3.2 Country Groups for a list of countries in each group.

INTERNATIONAL MONETARY FUND 7
Centrality in the Global and
Regional Trade Network
Sub-Saharan Africa’s overall progress in trade integration, however, needs to be put in perspective with developments in global trade over the same period. Global trade took off following the implementation of the Uruguay Round, the creation of the World Trade Organization (WTO) in 1995, and China’s entry in the WTO in 2001. This rapid expansion was characterized by the emergence of new trade giants and the decline in advanced economies’ contribution to world trade. In fact, it is only to the extent that sub-Saharan Africa was able to redirect trade toward these new trade players, particularly China, that it managed to keep its place in world trade—a place that nonetheless remains small in the global scene. As a simple illustration of this fact, export ratios at the global level rose by about as much as in sub-Saharan Africa, from 17 percent of GDP in 1995 to 25 percent of GDP in 2013 (versus 20½ percent and 27½ percent of GDP in the region, respectively).
A more granular measure of the region’s integration in global trade—its centrality in the global trade network—paints a similar picture. This measure takes into account not only the size of exports for a given country but also the number of its trade partners, as well as the relative weight of these trade partners in global trade, therefore better capturing the country’s interconnectedness within the web of global trade (De Benedictis and others 2014).
The centrality measure is estimated here using the PageRank algorithm created by Brin and Page (1998). The centrality score of each exporting country is computed as the probability that the country is chosen in the trading network by an importing country. The PageRank algorithm treats the trading network as a stationary distribution of a random walk defined on a set of trading countries.
The random walk tracks a randomly chosen importer with probability p at each step, and with probability 1 – p, the walk starts afresh from an exporter chosen at random according to a uniform distribution. More specifically, the centrality values satisfy the following equation:
1
→
1, 1, … ,
where is the centrality of country , is the number of countries that country is exporting to, and represents the probability of exporting to a country when abandoning the random walk. The sum in the first term on the right-hand side of the equation above is taken over all
2
8 INTERNATIONAL MONETARY FUND
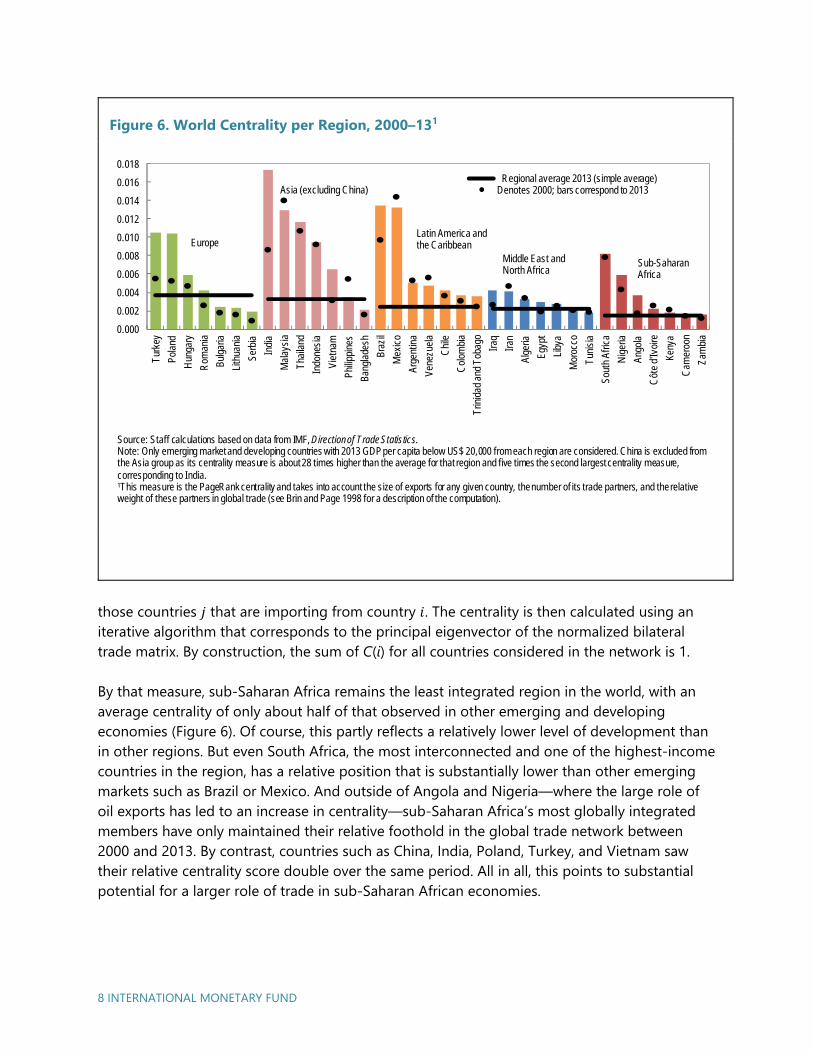
those countries that are importing from country . The centrality is then calculated using an iterative algorithm that corresponds to the principal eigenvector of the normalized bilateral trade matrix. By construction, the sum of C(i) for all countries considered in the network is 1.
By that measure, sub-Saharan Africa remains the least integrated region in the world, with an average centrality of only about half of that observed in other emerging and developing economies (Figure 6). Of course, this partly reflects a relatively lower level of development than in other regions. But even South Africa, the most interconnected and one of the highest-income countries in the region, has a relative position that is substantially lower than other emerging markets such as Brazil or Mexico. And outside of Angola and Nigeria—where the large role of oil exports has led to an increase in centrality—sub-Saharan Africa’s most globally integrated members have only maintained their relative foothold in the global trade network between 2000 and 2013. By contrast, countries such as China, India, Poland, Turkey, and Vietnam saw their relative centrality score double over the same period. All in all, this points to substantial potential for a larger role of trade in sub-Saharan African economies.
Figure 6. World Centrality per Region, 2000–131
0.000
0.002
0.004
0.006
0.008
0.010
0.012
0.014
0.016
0.018Tu
rkey
Pola
nd
Hun
gary
Rom
ania
Bulg
aria
Lith
uani
a
Serb
ia
Indi
a
Mal
aysi
a
Thai
land
Indo
nesi
a
Viet
nam
Philip
pine
s
Bang
lade
sh
Braz
il
Mex
ico
Arge
ntin
a
Vene
zuel
a
Chi
le
Col
ombi
a
Trin
idad
and
Tob
ago
Iraq
Iran
Alge
ria
Egyp
t
Liby
a
Mor
occo
Tuni
sia
Sout
h Af
rica
Nig
eria
Ango
la
Côt
e d'
Ivoi
re
Keny
a
Cam
eroo
n
Zam
bia
Regional average 2013 (simple average) Denotes 2000; bars correspond to 2013Asia (excluding China)
Europe
Sub-Saharan Africa
Latin America and the Caribbean
Middle East and North Africa
Source: Staff calculations based on data from IMF, Direction of Trade Statistics.Note: Only emerging market and developing countries with 2013 GDP per capita below US$ 20,000 from each region are considered. China is excluded from the Asia group as its centrality measure is about 28 times higher than the average for that region and five times the second largest centrality measure, corresponding to India.1This measure is the PageRank centrality and takes into account the size of exports for any given country, the number of its trade partners, and the relative weight of these partners in global trade (see Brin and Page 1998 for a description of the computation).
INTERNATIONAL MONETARY FUND 9
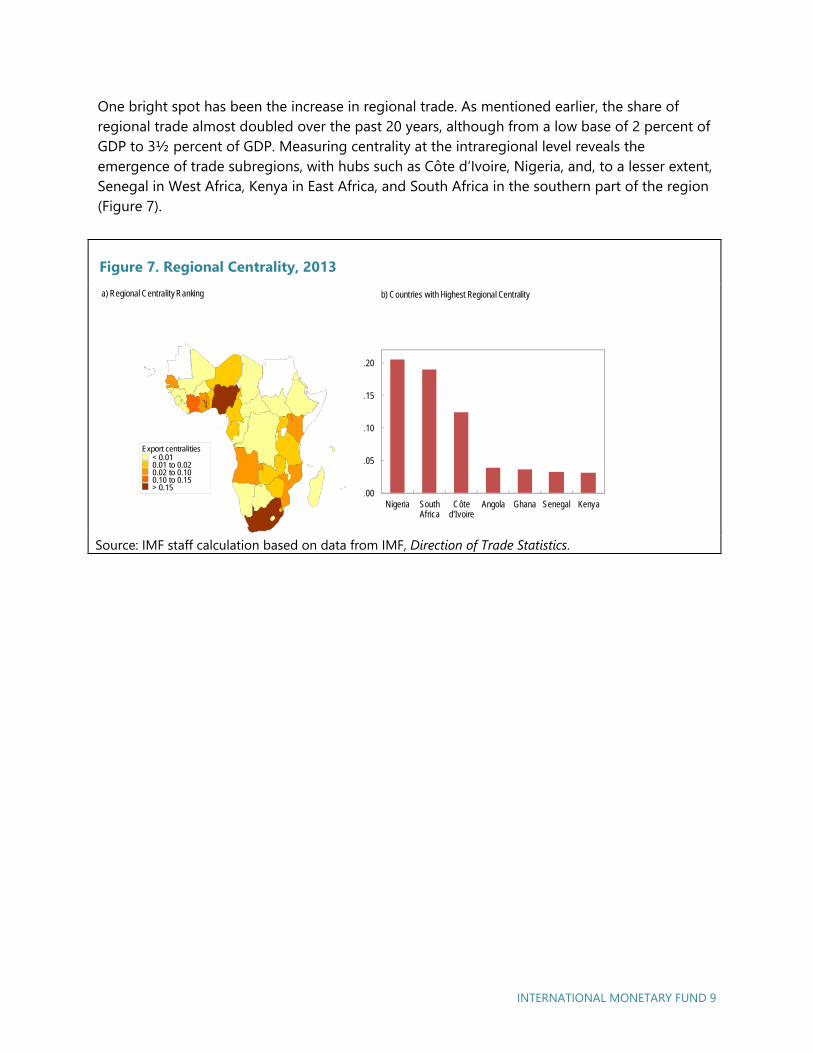
One bright spot has been the increase in regional trade. As mentioned earlier, the share of regional trade almost doubled over the past 20 years, although from a low base of 2 percent of GDP to 3½ percent of GDP. Measuring centrality at the intraregional level reveals the emergence of trade subregions, with hubs such as Côte d’Ivoire, Nigeria, and, to a lesser extent, Senegal in West Africa, Kenya in East Africa, and South Africa in the southern part of the region (Figure 7).
Figure 7. Regional Centrality, 2013
Source: IMF staff calculation based on data from IMF, Direction of Trade Statistics.
0.00
0.05
0.10
0.15
0.20
Nigeria South Africa
Côte d'Ivoire
Angola Ghana Senegal Kenya
b) Countries with Highest Regional Centralitya) Regional Centrality Ranking
Export centralities< 0.010.01 to 0.020.02 to 0.100.10 to 0.15> 0.15


INTERNATIONAL MONETARY FUND 11
Trade Openness and
Macroeconomic Performance
The recent period of rapid growth and generally better macroeconomic performance has coincided with expanding trade flows. Sub-Saharan Africa’s real GDP per capita growth substantially accelerated toward the end of the 1990s, to average 4.3 percent per year over the 2000s, compared with 2.9 percent a decade earlier. Increased political stability, better macroeconomic management, and access to financing as well as an improved business climate supported investment efforts, which in turn improved the productive capacity in the region. But increased trade integration also played a role, not only via higher demand for exported goods, but also by fostering competition and enabling some transfer of technology and efficiency gains from imported intermediary goods. Indeed, average trade openness—measured here as the sum of exports and imports in percent of GDP—increased from 41 percent of GDP in the 1990s to 45 percent in the 2000s, with a clear positive trend in the past three decades and an acceleration in the 2000s (Figure 8).
Figure 8. Trade Openness to GDP, 1983–20111
To disentangle the respective role of these factors, an econometric analysis is conducted, following previous studies on growth determinants, relating per capita real GDP growth in sub-Saharan countries over 1980–2010 to the initial level of development (as lower starting points tend to be associated with higher growth rates, as these countries catch up), investment
10
20
30
40
50
60
70
80
1983
1985
1987
1989
1991
1993
1995
1997
1999
2001
2003
2005
2007
2009
2011
Perc
ent o
f GD
P
Interquartile rangeSimple averageMedian
Source: Penn World Tables v. 8.0 ; and IMF staff calculations.1 Measured as the sum of real exports and imports in percent of real GDP.
3
12 INTERNATIONAL MONETARY FUND
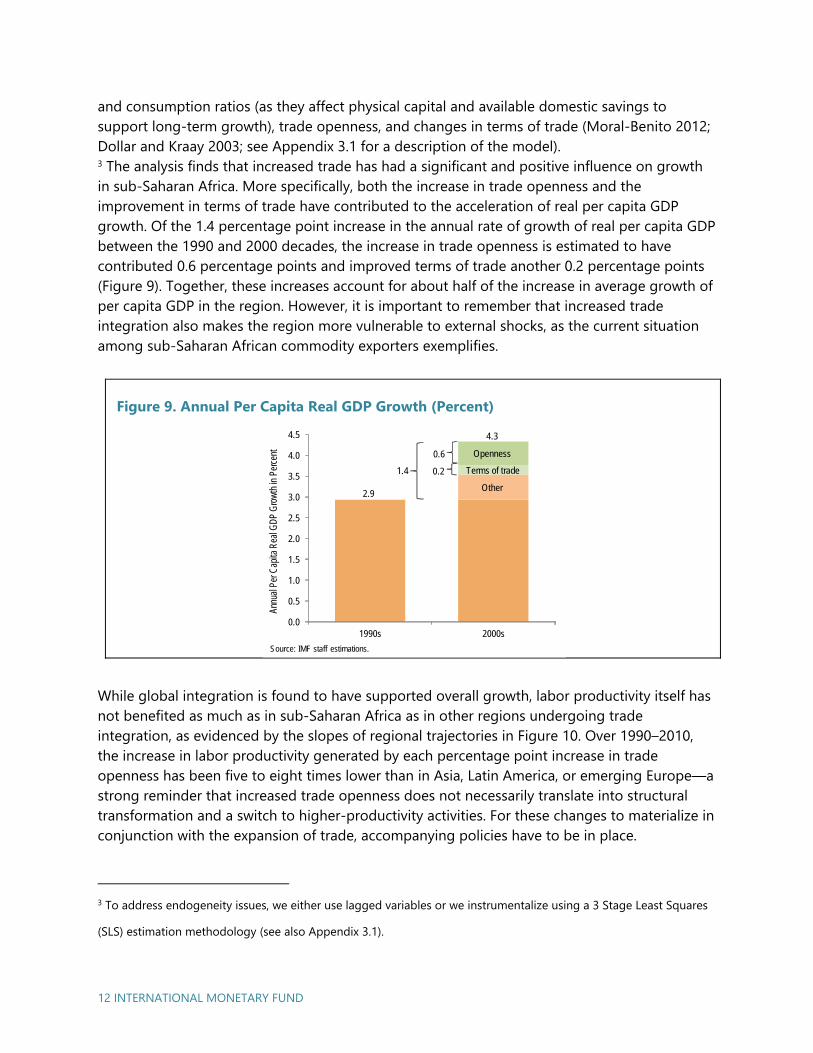
and consumption ratios (as they affect physical capital and available domestic savings to support long-term growth), trade openness, and changes in terms of trade (Moral-Benito 2012; Dollar and Kraay 2003; see Appendix 3.1 for a description of the model).3 The analysis finds that increased trade has had a significant and positive influence on growth in sub-Saharan Africa. More specifically, both the increase in trade openness and the improvement in terms of trade have contributed to the acceleration of real per capita GDP growth. Of the 1.4 percentage point increase in the annual rate of growth of real per capita GDP between the 1990 and 2000 decades, the increase in trade openness is estimated to have contributed 0.6 percentage points and improved terms of trade another 0.2 percentage points (Figure 9). Together, these increases account for about half of the increase in average growth of per capita GDP in the region. However, it is important to remember that increased trade integration also makes the region more vulnerable to external shocks, as the current situation among sub-Saharan African commodity exporters exemplifies.
Figure 9. Annual Per Capita Real GDP Growth (Percent)
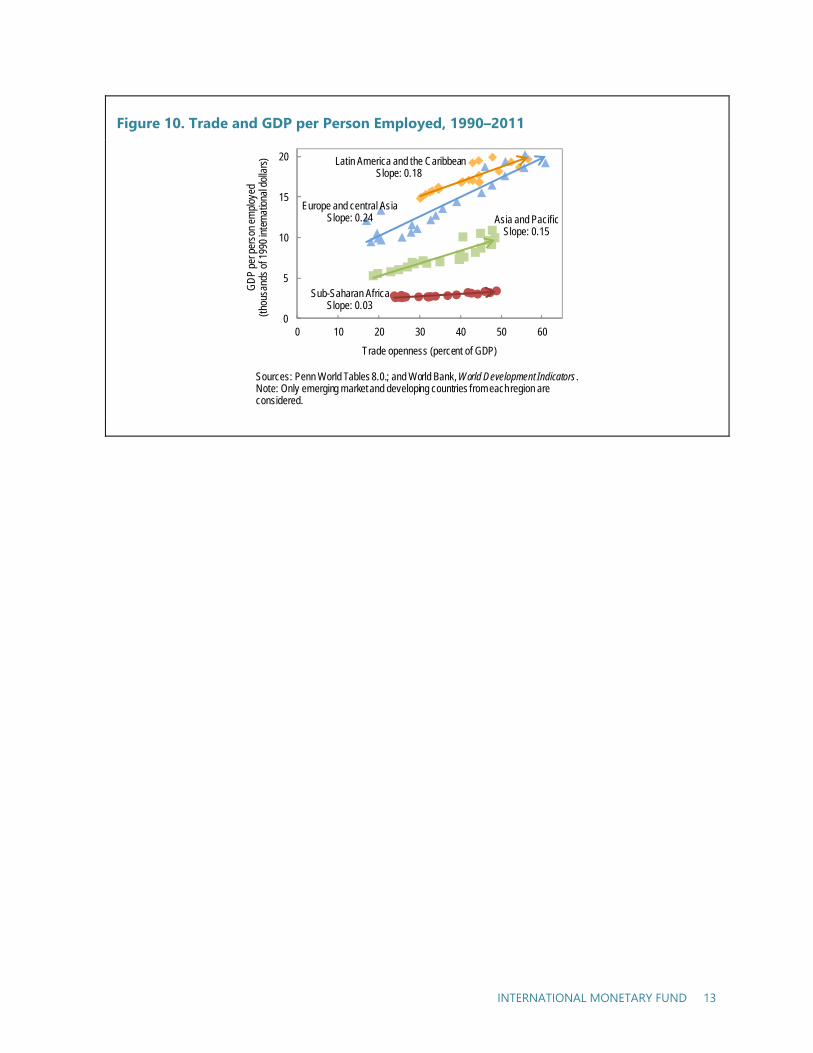
While global integration is found to have supported overall growth, labor productivity itself has not benefited as much as in sub-Saharan Africa as in other regions undergoing trade integration, as evidenced by the slopes of regional trajectories in Figure 10. Over 1990–2010, the increase in labor productivity generated by each percentage point increase in trade openness has been five to eight times lower than in Asia, Latin America, or emerging Europe—a strong reminder that increased trade openness does not necessarily translate into structural transformation and a switch to higher-productivity activities. For these changes to materialize in conjunction with the expansion of trade, accompanying policies have to be in place.
3 To address endogeneity issues, we either use lagged variables or we instrumentalize using a 3 Stage Least Squares
(SLS) estimation methodology (see also Appendix 3.1).
0.0
0.5
1.0
1.5
2.0
2.5
3.0
3.5
4.0
4.5
1990s 2000s
Annu
al P
er C
apita
Rea
l GDP
Gro
wth
in P
erce
nt
1.4
0.6
2.9
4.3
Openness
Other
0.2 Terms of trade
( )
Source: IMF staff estimations.
INTERNATIONAL MONETARY FUND 13
Figure 10. Trade and GDP per Person Employed, 1990–2011
Sub-Saharan AfricaSlope: 0.03
Latin America and the CaribbeanSlope: 0.18
Europe and central AsiaSlope: 0.24 Asia and Pacific
Slope: 0.15
0
5
10
15
20
0 10 20 30 40 50 60
GD
P pe
r per
son
empl
oyed
(thou
sand
s of
199
0 in
tern
ation
al d
olla
rs)
Trade openness (percent of GDP)
Sources: Penn World Tables 8.0.; and World Bank, World Development Indicators.Note: Only emerging market and developing countries from each region are considered.

INTERNATIONAL MONETARY FUND 15
Scope for Further Integration?
An Analysis Based on a Gravity
Model
To assess the underlying factors that drive trade integration and to estimate the order of magnitude of a potential “trade gap” for sub-Saharan Africa, we then use a gravity model approach. In general, trade between two countries tends to be more intense the closer the two countries are both geographically and culturally—such as sharing a similar language or past colonial ties. In addition, the size and level of development of the trading economies are important parameters influencing trade flows. A common way in the literature to assess the relative size of such flows is to estimate “gravity models,” linking the magnitude of bilateral trade flows to these very characteristics of the trading countries (Head and Mayer 2014).
We estimate such a gravity model using the IMF’s Direction of Trade Statistics (DOTS) database. Our sample covers 167 countries for the 1980–2013 period. While the DOTS database lacks data on services trade, it provides the most extensive panel data set of worldwide bilateral trade flows currently available. Our empirical specifications can be summarized in the following equation:
ln x a M a M θD a u .
In this equation, the exports from exporting country i to importing country j in year t, x , are conditioned on M and M , which denote the vectors of the attributes of exporter i and importer j in year t 1. Factors that affect trade costs between i and j are represented by D and u denotes the unobserved bilateral trade cost determinants. To avoid potential biases from reverse and simultaneous causation, we condition on the one-year lagged values of the regressors and we control for global common shocks by including a year fixed effect, a .
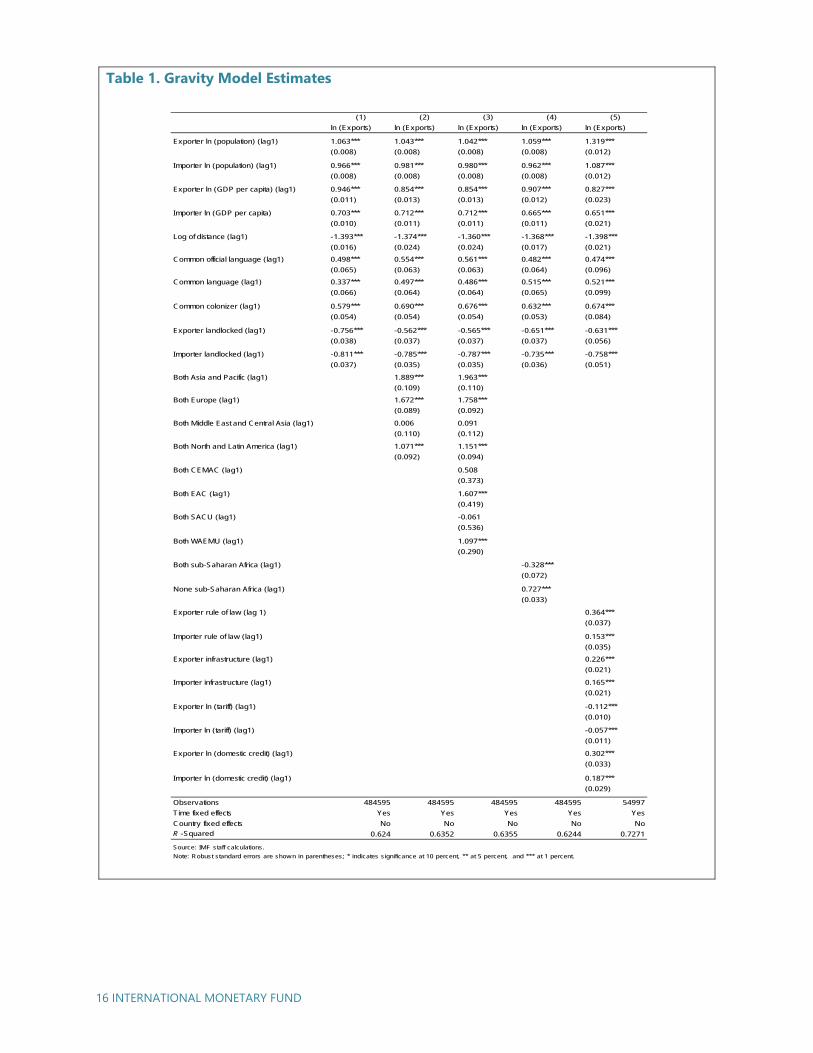
Table 1 shows the gravity equation estimates of the determinants of bilateral trade patterns. The standard errors reported in the regressions are robust and clustered at the country pair level to account for bilateral trade correlation across time and to allow for different variance across the pairs.
4
16 INTERNATIONAL MONETARY FUND
Table 1. Gravity Model Estimates
(1) (2) (3) (4) (5)
ln (Exports) ln (Exports) ln (Exports) ln (Exports) ln (Exports)
Exporter ln (population) (lag1) 1.063*** 1.043*** 1.042*** 1.059*** 1.319***
(0.008) (0.008) (0.008) (0.008) (0.012)
Importer ln (population) (lag1) 0.966*** 0.981*** 0.980*** 0.962*** 1.087***
(0.008) (0.008) (0.008) (0.008) (0.012)
Exporter ln (GDP per capita) (lag1) 0.946*** 0.854*** 0.854*** 0.907*** 0.827***
(0.011) (0.013) (0.013) (0.012) (0.023)
Importer ln (GDP per capita) 0.703*** 0.712*** 0.712*** 0.665*** 0.651***
(0.010) (0.011) (0.011) (0.011) (0.021)
Log of distance (lag1) -1.393*** -1.374*** -1.360*** -1.368*** -1.398***
(0.016) (0.024) (0.024) (0.017) (0.021)
Common official language (lag1) 0.498*** 0.554*** 0.561*** 0.482*** 0.474***
(0.065) (0.063) (0.063) (0.064) (0.096)
Common language (lag1) 0.337*** 0.497*** 0.486*** 0.515*** 0.521***
(0.066) (0.064) (0.064) (0.065) (0.099)
Common colonizer (lag1) 0.579*** 0.690*** 0.676*** 0.632*** 0.674***
(0.054) (0.054) (0.054) (0.053) (0.084)
Exporter landlocked (lag1) -0.756*** -0.562*** -0.565*** -0.651*** -0.631***
(0.038) (0.037) (0.037) (0.037) (0.056)
Importer landlocked (lag1) -0.811*** -0.785*** -0.787*** -0.735*** -0.758***
(0.037) (0.035) (0.035) (0.036) (0.051)
Both Asia and Pacific (lag1) 1.889*** 1.963***
(0.109) (0.110)
Both Europe (lag1) 1.672*** 1.758***
(0.089) (0.092)
Both Middle East and Central Asia (lag1) 0.006 0.091
(0.110) (0.112)
Both North and Latin America (lag1) 1.071*** 1.151***
(0.092) (0.094)
Both CEMAC (lag1) 0.508
(0.373)
Both EAC (lag1) 1.607***
(0.419)
Both SACU (lag1) -0.061
(0.536)
Both WAEMU (lag1) 1.097***
(0.290)
Both sub-Saharan Africa (lag1) -0.328***
(0.072)
None sub-Saharan Africa (lag1) 0.727***
(0.033)
Exporter rule of law (lag 1) 0.364***
(0.037)
Importer rule of law (lag1) 0.153***
(0.035)
Exporter infrastructure (lag1) 0.226***
(0.021)
Importer infrastructure (lag1) 0.165***
(0.021)
Exporter ln (tariff) (lag1) -0.112***
(0.010)
Importer ln (tariff) (lag1) -0.057***
(0.011)
Exporter ln (domestic credit) (lag1) 0.302***
(0.033)
Importer ln (domestic credit) (lag1) 0.187***
(0.029)
Observations 484595 484595 484595 484595 54997
Time fixed effects Yes Yes Yes Yes Yes
Country fixed effects No No No No No
R -Squared 0.624 0.6352 0.6355 0.6244 0.7271
Source: IMF staff calculations.
Note: Robust standard errors are show n in parentheses; * indicates significance at 10 percent, ** at 5 percent, and *** at 1 percent.
INTERNATIONAL MONETARY FUND 17
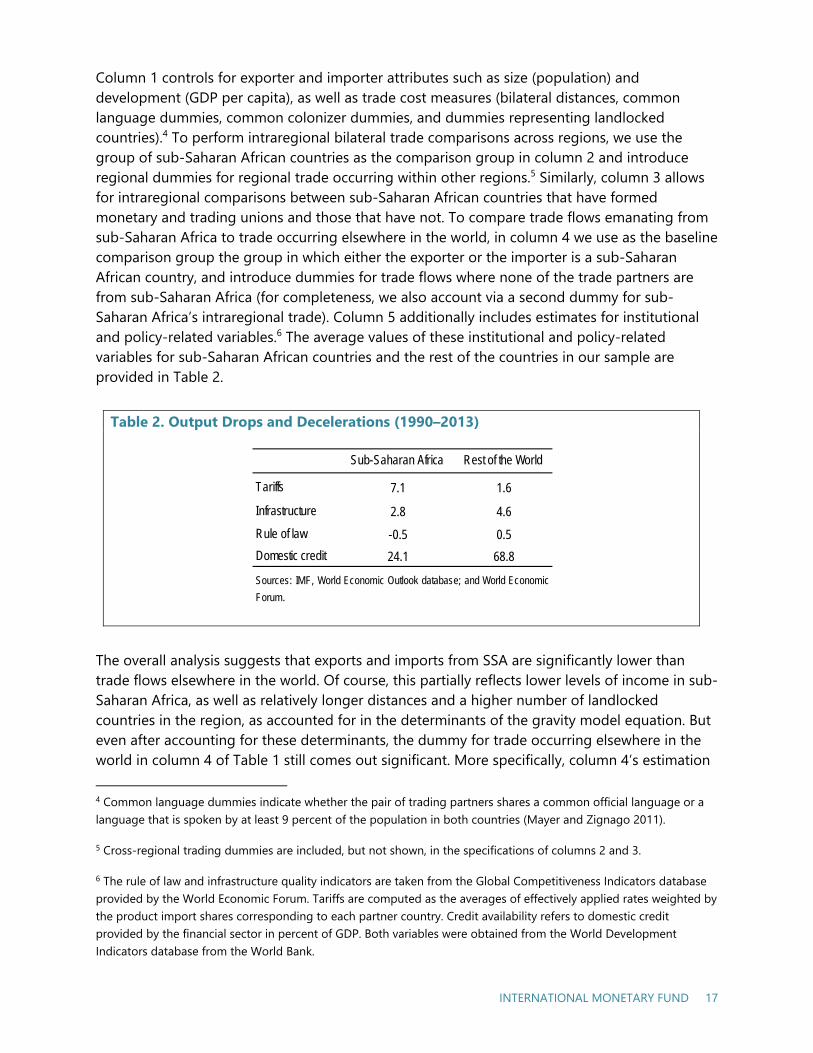
Column 1 controls for exporter and importer attributes such as size (population) and development (GDP per capita), as well as trade cost measures (bilateral distances, common language dummies, common colonizer dummies, and dummies representing landlocked countries).4 To perform intraregional bilateral trade comparisons across regions, we use the group of sub-Saharan African countries as the comparison group in column 2 and introduce regional dummies for regional trade occurring within other regions.5 Similarly, column 3 allows for intraregional comparisons between sub-Saharan African countries that have formed monetary and trading unions and those that have not. To compare trade flows emanating from sub-Saharan Africa to trade occurring elsewhere in the world, in column 4 we use as the baseline comparison group the group in which either the exporter or the importer is a sub-Saharan African country, and introduce dummies for trade flows where none of the trade partners are from sub-Saharan Africa (for completeness, we also account via a second dummy for sub-Saharan Africa’s intraregional trade). Column 5 additionally includes estimates for institutional and policy-related variables.6 The average values of these institutional and policy-related variables for sub-Saharan African countries and the rest of the countries in our sample are provided in Table 2.
Table 2. Output Drops and Decelerations (1990–2013)
The overall analysis suggests that exports and imports from SSA are significantly lower than trade flows elsewhere in the world. Of course, this partially reflects lower levels of income in sub-Saharan Africa, as well as relatively longer distances and a higher number of landlocked countries in the region, as accounted for in the determinants of the gravity model equation. But even after accounting for these determinants, the dummy for trade occurring elsewhere in the world in column 4 of Table 1 still comes out significant. More specifically, column 4’s estimation
4 Common language dummies indicate whether the pair of trading partners shares a common official language or a language that is spoken by at least 9 percent of the population in both countries (Mayer and Zignago 2011).
5 Cross-regional trading dummies are included, but not shown, in the specifications of columns 2 and 3.
6 The rule of law and infrastructure quality indicators are taken from the Global Competitiveness Indicators database provided by the World Economic Forum. Tariffs are computed as the averages of effectively applied rates weighted by the product import shares corresponding to each partner country. Credit availability refers to domestic credit provided by the financial sector in percent of GDP. Both variables were obtained from the World Development Indicators database from the World Bank.
Tariffs 7.1 1.6
Infrastructure 2.8 4.6
Rule of law -0.5 0.5
Domestic credit 24.1 68.8
Sub-Saharan Africa Rest of the World
Sources: IMF, World Economic Outlook database; and World Economic
Forum.
18 INTERNATIONAL MONETARY FUND
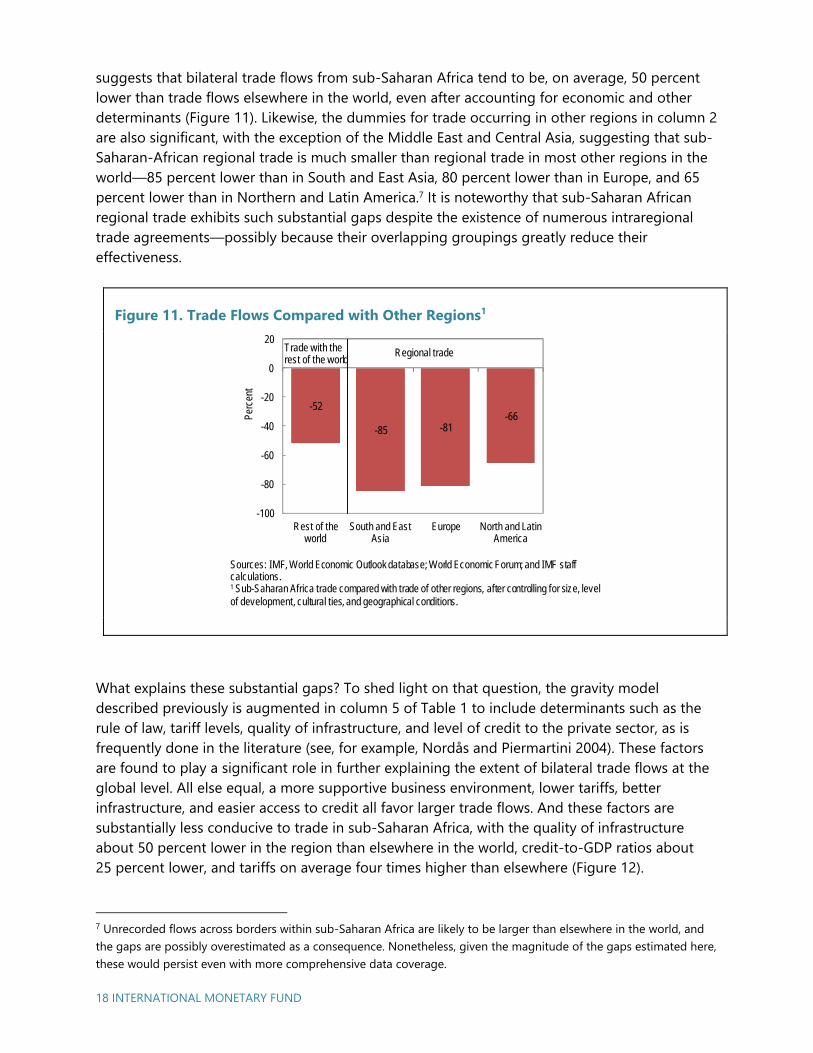
suggests that bilateral trade flows from sub-Saharan Africa tend to be, on average, 50 percent lower than trade flows elsewhere in the world, even after accounting for economic and other determinants (Figure 11). Likewise, the dummies for trade occurring in other regions in column 2 are also significant, with the exception of the Middle East and Central Asia, suggesting that sub-Saharan-African regional trade is much smaller than regional trade in most other regions in the world—85 percent lower than in South and East Asia, 80 percent lower than in Europe, and 65 percent lower than in Northern and Latin America.7 It is noteworthy that sub-Saharan African regional trade exhibits such substantial gaps despite the existence of numerous intraregional trade agreements—possibly because their overlapping groupings greatly reduce their effectiveness.
Figure 11. Trade Flows Compared with Other Regions1
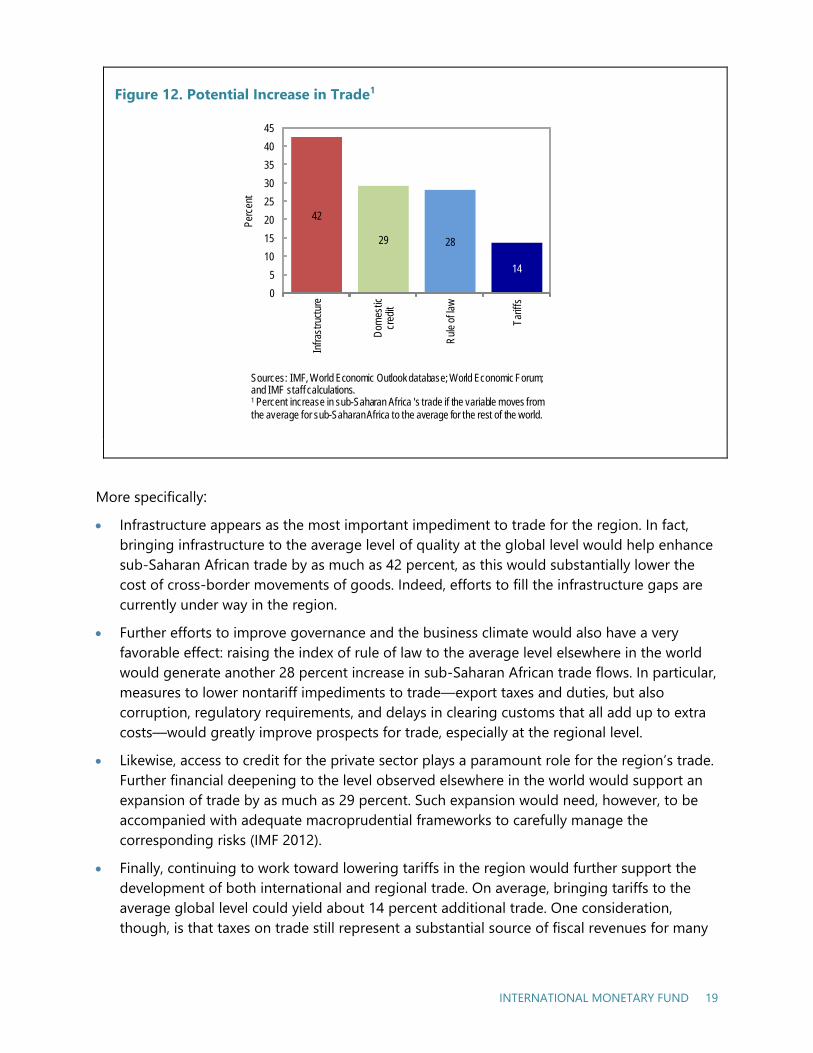
What explains these substantial gaps? To shed light on that question, the gravity model described previously is augmented in column 5 of Table 1 to include determinants such as the rule of law, tariff levels, quality of infrastructure, and level of credit to the private sector, as is frequently done in the literature (see, for example, Nordås and Piermartini 2004). These factors are found to play a significant role in further explaining the extent of bilateral trade flows at the global level. All else equal, a more supportive business environment, lower tariffs, better infrastructure, and easier access to credit all favor larger trade flows. And these factors are substantially less conducive to trade in sub-Saharan Africa, with the quality of infrastructure about 50 percent lower in the region than elsewhere in the world, credit-to-GDP ratios about 25 percent lower, and tariffs on average four times higher than elsewhere (Figure 12).
7 Unrecorded flows across borders within sub-Saharan Africa are likely to be larger than elsewhere in the world, and the gaps are possibly overestimated as a consequence. Nonetheless, given the magnitude of the gaps estimated here, these would persist even with more comprehensive data coverage.
Sources: IMF, World Economic Outlook database; World Economic Forum; and IMF staff calculations.1 Sub-Saharan Africa trade compared with trade of other regions, after controlling for size, level of development, cultural ties, and geographical conditions.
-52
-85 -81-66
-100
-80
-60
-40
-20
0
20
Rest of the world
South and East Asia
Europe North and Latin America
Perc
ent
Trade with the rest of the world
Regional trade
INTERNATIONAL MONETARY FUND 19
Figure 12. Potential Increase in Trade1
More specifically: Infrastructure appears as the most important impediment to trade for the region. In fact,
bringing infrastructure to the average level of quality at the global level would help enhancesub-Saharan African trade by as much as 42 percent, as this would substantially lower thecost of cross-border movements of goods. Indeed, efforts to fill the infrastructure gaps arecurrently under way in the region.
Further efforts to improve governance and the business climate would also have a veryfavorable effect: raising the index of rule of law to the average level elsewhere in the worldwould generate another 28 percent increase in sub-Saharan African trade flows. In particular,measures to lower nontariff impediments to trade—export taxes and duties, but alsocorruption, regulatory requirements, and delays in clearing customs that all add up to extracosts—would greatly improve prospects for trade, especially at the regional level.
Likewise, access to credit for the private sector plays a paramount role for the region’s trade.Further financial deepening to the level observed elsewhere in the world would support anexpansion of trade by as much as 29 percent. Such expansion would need, however, to beaccompanied with adequate macroprudential frameworks to carefully manage thecorresponding risks (IMF 2012).
Finally, continuing to work toward lowering tariffs in the region would further support thedevelopment of both international and regional trade. On average, bringing tariffs to theaverage global level could yield about 14 percent additional trade. One consideration,though, is that taxes on trade still represent a substantial source of fiscal revenues for many
42
29 28
14
0
5
10
15
20
25
30
35
40
45
Infra
stru
ctur
e
Dom
estic
cr
edit
Rul
e of
law
Tarif
fs
Perc
ent
Sources: IMF, World Economic Outlook database; World Economic Forum; and IMF staff calculations.1 Percent increase in sub-Saharan Africa 's trade if the variable moves from the average for sub-Saharan Africa to the average for the rest of the world.

20 INTERNATIONAL MONETARY FUND
countries in the region, and policies to lower tariffs need to be accompanied by continued efforts to increase revenue mobilization from other sources.
At the regional level, deepening existing customs unions with further economic integrationwould help, as the examples of the EAC and WAEMU illustrate in column 3 of Table 1: all elseequal, cross-border exchanges within the EAC are found to be five times larger than averageregional trade flows within sub-Saharan Africa; in the WAEMU, they are about three timeslarger. But having a single currency by itself is not enough, as evidenced in the CentralAfrican Economic and Monetary Community (CEMAC), where intracurrency union trade flowsare not found to be significantly higher than regional flows outside the currency union.
INTERNATIONAL MONETARY FUND 21
Global Value Chains
Beyond the pure expansion of trade, an additional dimension of globalization over the past two decades has been the emergence of global value chains (GVCs). In an increasingly integrated world economy fueled by technological progress, cheaper transportation and communication costs, and policy reforms in support of trade, production processes have been more dispersed across the globe. This has given rise to systems of supply chains in which value is added at each stage before crossing the border to be passed on to the next stage—GVCs. This process has allowed countries to better exploit their comparative advantages, by giving them the opportunity to join a production chain without having to provide all the other upstream capabilities, and has been particularly at play in South and East Asia around Japan and China and in Eastern Europe around Germany (IMF 2013, 2014b, 2015b; Chapter 3 of IMF 2014a).
For countries with a limited existing manufacturing or service export basis and a large pool of labor such as in those in sub-Saharan Africa, this development can provide a golden opportunity. By specializing on a specific segment of a production chain, each participating country can generate a portion of the goods’ or services’ value added—while producing the whole product from scratch would never have been within reach in an increasingly competitive world—even if that means that a lower share of the value added of exports is captured locally. While certain preconditions such as sufficient levels of capacity, quality, and efficiency are required to join GVCs (Baldwin 2011; WTO 2014), these threshold levels can be exceeded over time through technology and knowledge transfers from other countries—most often in the form of foreign direct investment (FDI). Furthermore, knowledge transfers from other producers in the value chain, and, eventually, upgrading to higher value-added segments of the production chain can support productivity and income growth. Asian countries have championed this model, initially contributing to the most labor-intensive activities in the production process and gradually moving into more sophisticated portions of the value chain.
To measure a country’s extent of international integration in GVCs, it is necessary to know the sources and destinations of the value added embodied in the products. A budding literature on trade in value added has emerged that relies on data using intercountry input-output (IO) tables. Until very recently, the coverage on sub-Saharan African countries in IO tables was sparse. We use here the newly created Eora database, which provides global multiregion IO tables, to derive value-added trade for 189 countries from 1990 to 2012 (Lenzen and others 2012; Lenzen and others 2013). The main advantage of using the Eora database is the depth of its coverage, in terms of countries (189), industries (about 16,000), and years (23 years); it is
5
22 INTERNATIONAL MONETARY FUND
virtually unmatched by any existing database. It covers 42 out of the 45 countries in sub-Saharan Africa. While this extended coverage makes the database invaluable for the analysis conducted here, it should be remembered, however, that some missing data in the IO tables are filled through optimization procedures using existing national and global statistics: this means that our results should not be taken as exact and precise measures, although we believe the gist of the results to be robust.
The literature traditionally decomposes exports into three distinct components, which are used to measure GVC participation8:
Foreign value added (FVA) that has been imported from foreign suppliers upstream in theGVC. This share is referred to as backward integration, and reflects the extent to which acountry is integrated relatively downstream of the value chain.
Domestic value added (DVA) of products consumed directly in the country where it isexported.
DVA of products that enter themselves into the production of other countries’ exports. Thisshare is referred to as forward integration, and reflects the extent to which a country isintegrated relatively upstream of the value chain.
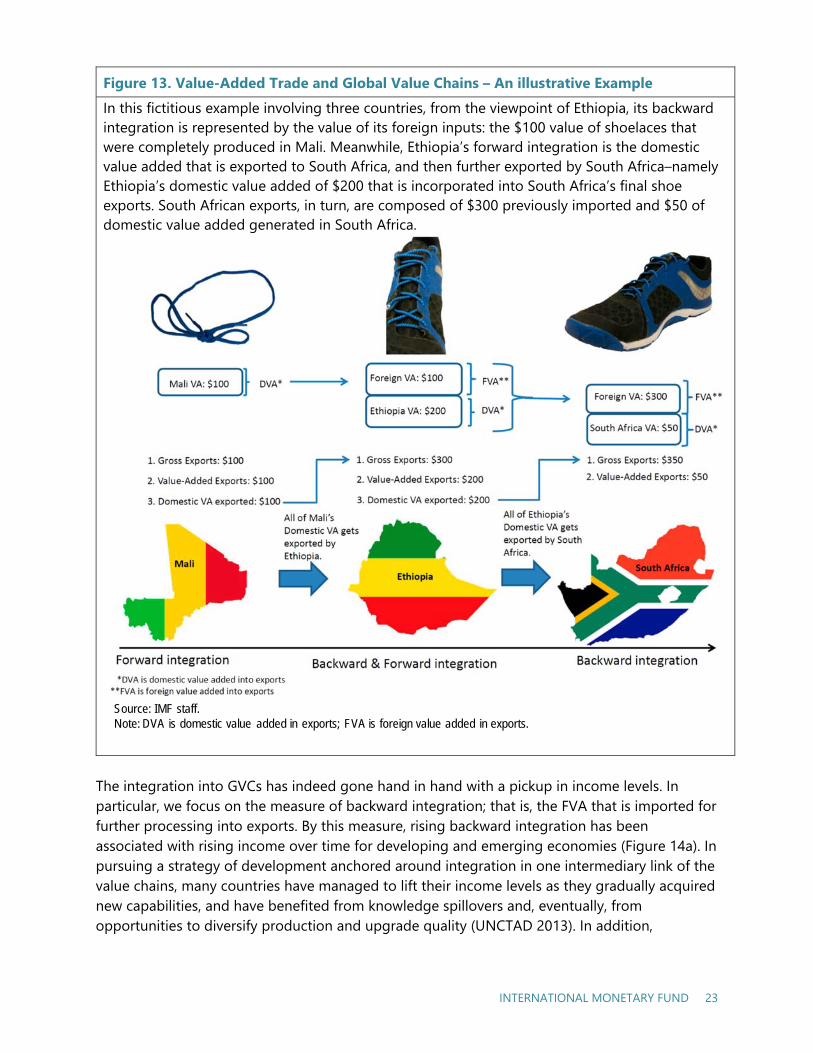
The sum of the last two components corresponds to the DVA, and contributes toward its GDP. The sum of FVA and DVA results in the total value of gross exports. Figure 13 provides an illustrative example of a hypothetical value chain production of a shoe dispersed in different countries.
8 For the numerical calculations, we follow the mathematical calculations as described in UNCTAD 2014, pp. 26–9.
INTERNATIONAL MONETARY FUND 23
Figure 13. Value-Added Trade and Global Value Chains – An illustrative Example In this fictitious example involving three countries, from the viewpoint of Ethiopia, its backward integration is represented by the value of its foreign inputs: the $100 value of shoelaces that were completely produced in Mali. Meanwhile, Ethiopia’s forward integration is the domestic value added that is exported to South Africa, and then further exported by South Africa–namely Ethiopia’s domestic value added of $200 that is incorporated into South Africa’s final shoe exports. South African exports, in turn, are composed of $300 previously imported and $50 of domestic value added generated in South Africa.
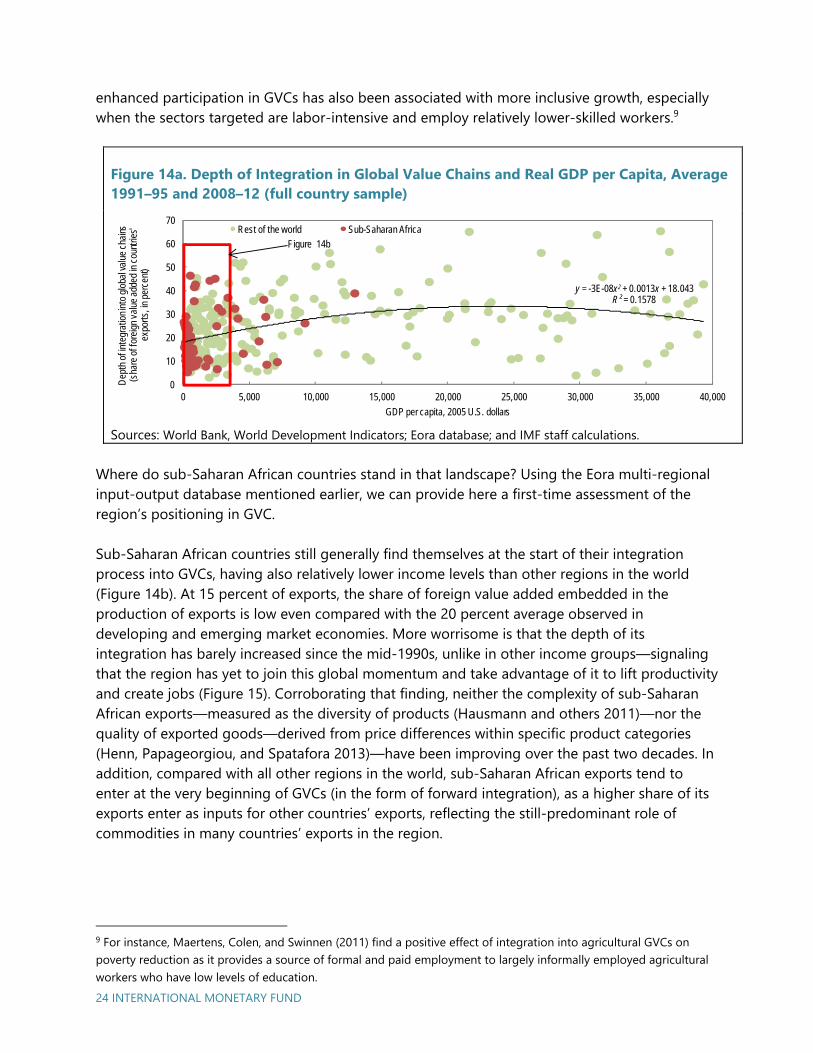
The integration into GVCs has indeed gone hand in hand with a pickup in income levels. In particular, we focus on the measure of backward integration; that is, the FVA that is imported for further processing into exports. By this measure, rising backward integration has been associated with rising income over time for developing and emerging economies (Figure 14a). In pursuing a strategy of development anchored around integration in one intermediary link of the value chains, many countries have managed to lift their income levels as they gradually acquired new capabilities, and have benefited from knowledge spillovers and, eventually, from opportunities to diversify production and upgrade quality (UNCTAD 2013). In addition,
Source: IMF staff.Note: DVA is domestic value added in exports; FVA is foreign value added in exports.
24 INTERNATIONAL MONETARY FUND
enhanced participation in GVCs has also been associated with more inclusive growth, especially when the sectors targeted are labor-intensive and employ relatively lower-skilled workers.9
Figure 14a. Depth of Integration in Global Value Chains and Real GDP per Capita, Average 1991–95 and 2008–12 (full country sample)
Sources: World Bank, World Development Indicators; Eora database; and IMF staff calculations.
Where do sub-Saharan African countries stand in that landscape? Using the Eora multi-regional input-output database mentioned earlier, we can provide here a first-time assessment of the region’s positioning in GVC.
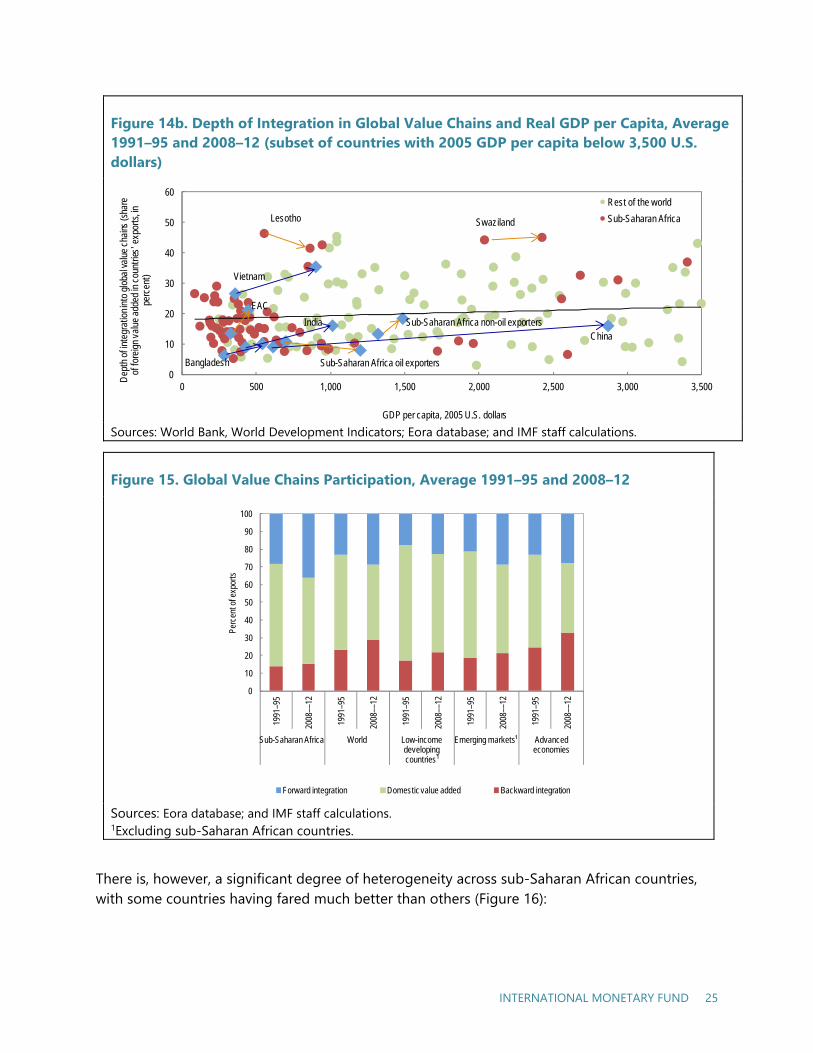
Sub-Saharan African countries still generally find themselves at the start of their integration process into GVCs, having also relatively lower income levels than other regions in the world (Figure 14b). At 15 percent of exports, the share of foreign value added embedded in the production of exports is low even compared with the 20 percent average observed in developing and emerging market economies. More worrisome is that the depth of its integration has barely increased since the mid-1990s, unlike in other income groups—signaling that the region has yet to join this global momentum and take advantage of it to lift productivity and create jobs (Figure 15). Corroborating that finding, neither the complexity of sub-Saharan African exports—measured as the diversity of products (Hausmann and others 2011)—nor the quality of exported goods—derived from price differences within specific product categories (Henn, Papageorgiou, and Spatafora 2013)—have been improving over the past two decades. In addition, compared with all other regions in the world, sub-Saharan African exports tend to enter at the very beginning of GVCs (in the form of forward integration), as a higher share of its exports enter as inputs for other countries’ exports, reflecting the still-predominant role of commodities in many countries’ exports in the region.
9 For instance, Maertens, Colen, and Swinnen (2011) find a positive effect of integration into agricultural GVCs on poverty reduction as it provides a source of formal and paid employment to largely informally employed agricultural workers who have low levels of education.
y = -3E-08x2 + 0.0013x + 18.043R² = 0.1578
0
10
20
30
40
50
60
70
0 5,000 10,000 15,000 20,000 25,000 30,000 35,000 40,000
Dep
th o
f int
egra
tion i
nto
glob
al va
lue
chai
ns
(sha
re o
f for
eign
val
ue a
dded
in c
ount
ries'
expo
rts, i
n pe
rcen
t)
GDP per capita, 2005 U.S. dollars
Rest of the world Sub-Saharan Africa
Figure 14b
INTERNATIONAL MONETARY FUND 25
Figure 14b. Depth of Integration in Global Value Chains and Real GDP per Capita, Average 1991–95 and 2008–12 (subset of countries with 2005 GDP per capita below 3,500 U.S. dollars)
Sources: World Bank, World Development Indicators; Eora database; and IMF staff calculations.
Figure 15. Global Value Chains Participation, Average 1991–95 and 2008–12
Sources: Eora database; and IMF staff calculations. 1Excluding sub-Saharan African countries.
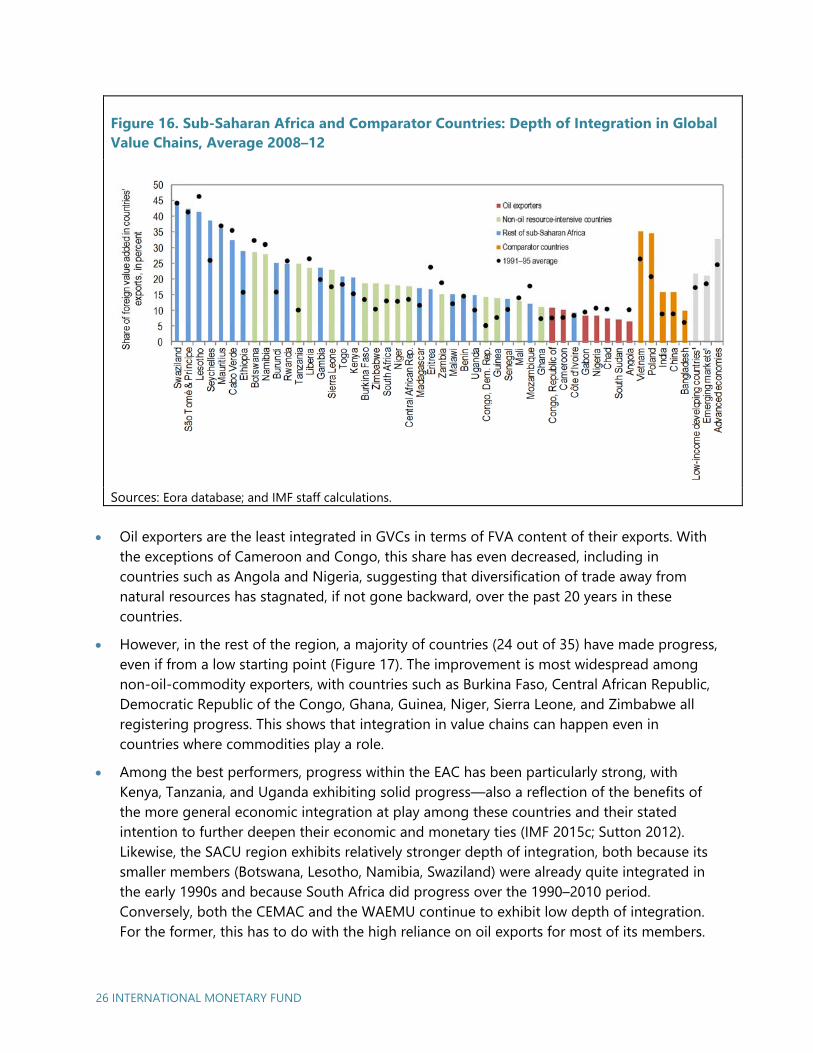
There is, however, a significant degree of heterogeneity across sub-Saharan African countries, with some countries having fared much better than others (Figure 16):
0
10
20
30
40
50
60
0 500 1,000 1,500 2,000 2,500 3,000 3,500
Dep
th o
f int
egra
tion i
nto
glob
al va
lue
chai
ns (s
hare
of
fore
ign
valu
e ad
ded
in c
ount
ries'
exp
orts
, in
perc
ent)
GDP per capita, 2005 U.S. dollars
Rest of the world
Sub-Saharan Africa
Sub-Saharan Africa non-oil exporters
Sub-Saharan Africa oil exporters
ChinaIndia
Vietnam
Bangladesh
SwazilandLesotho
EAC
0
10
20
30
40
50
60
70
80
90
100
1991
–95
2008
––12
1991
–95
2008
––12
1991
–95
2008
––12
1991
–95
2008
––12
1991
–95
2008
––12
Sub-Saharan Africa World Low-income developing countries¹
Emerging markets¹ Advanced economies
Perc
ent o
f exp
orts
Forward integration Domestic value added Backward integration
26 INTERNATIONAL MONETARY FUND
Figure 16. Sub-Saharan Africa and Comparator Countries: Depth of Integration in Global Value Chains, Average 2008–12
Sources: Eora database; and IMF staff calculations.
Oil exporters are the least integrated in GVCs in terms of FVA content of their exports. Withthe exceptions of Cameroon and Congo, this share has even decreased, including incountries such as Angola and Nigeria, suggesting that diversification of trade away fromnatural resources has stagnated, if not gone backward, over the past 20 years in thesecountries.
However, in the rest of the region, a majority of countries (24 out of 35) have made progress,even if from a low starting point (Figure 17). The improvement is most widespread amongnon-oil-commodity exporters, with countries such as Burkina Faso, Central African Republic,Democratic Republic of the Congo, Ghana, Guinea, Niger, Sierra Leone, and Zimbabwe allregistering progress. This shows that integration in value chains can happen even incountries where commodities play a role.
Among the best performers, progress within the EAC has been particularly strong, withKenya, Tanzania, and Uganda exhibiting solid progress—also a reflection of the benefits ofthe more general economic integration at play among these countries and their statedintention to further deepen their economic and monetary ties (IMF 2015c; Sutton 2012).Likewise, the SACU region exhibits relatively stronger depth of integration, both because itssmaller members (Botswana, Lesotho, Namibia, Swaziland) were already quite integrated inthe early 1990s and because South Africa did progress over the 1990–2010 period.Conversely, both the CEMAC and the WAEMU continue to exhibit low depth of integration.For the former, this has to do with the high reliance on oil exports for most of its members.

INTERNATIONAL MONETARY FUND 27
For the latter, this suggests that the relatively high level of interregional trade with the currency union does not reflect the emergence of a regional value chain, but rather trade on final goods and services, with the depth of integration particularly low for the two largest countries of the union—Côte d’Ivoire and Senegal.
Figure 17. Depth of Integration in Global Value Chains, Average 1991–95 and 2008–12
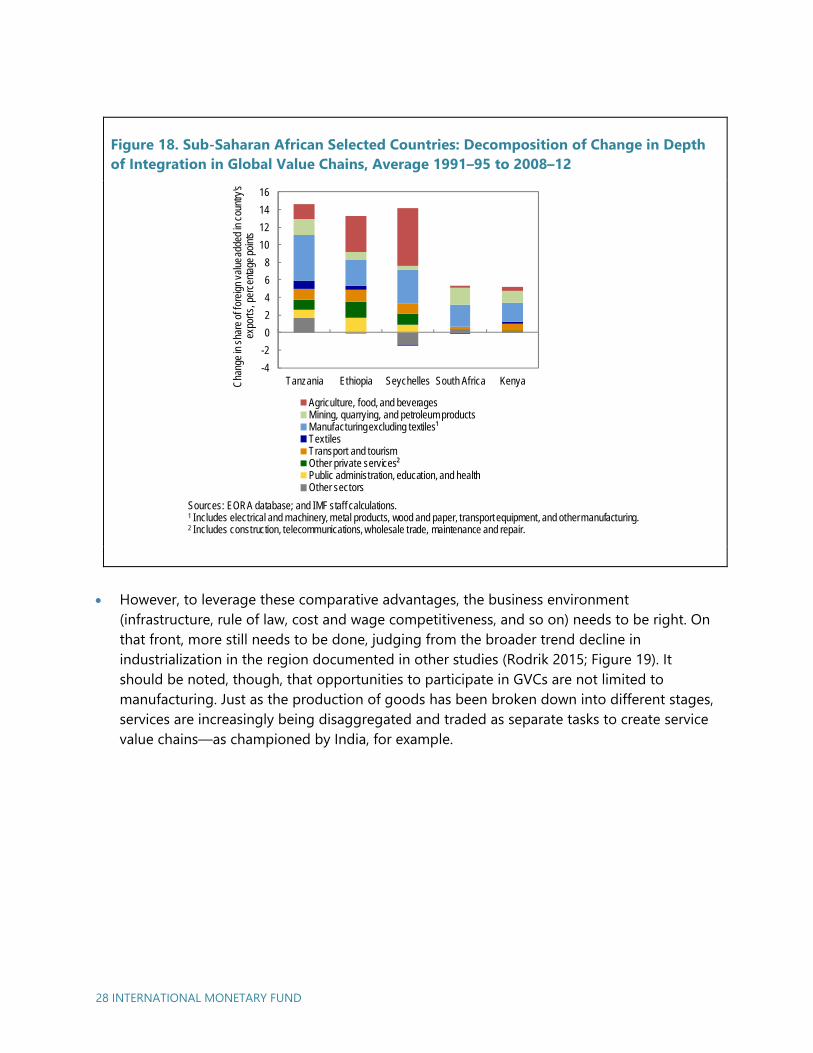
Five countries in particular stand out, having seen the share of FVA in their exports increaseby 5 percentage points or more in the past two decades: Ethiopia, Kenya, Seychelles, SouthAfrica, and Tanzania (Figure 18). In these countries, the sectors that have benefited the mostfrom the deepening of integration include agriculture and agro-business (especially inEthiopia and Seychelles), and manufacturing (particularly in Tanzania), but also textiles,transport, and tourism, although to a lesser extent. These experiences bode well for theregion: for one, the increase in depth of integration in some of these countries, at 10percentage points or more, is of a similar magnitude to that experienced by countries suchas Poland or Vietnam that are now success stories within large GVCs. The examples alsohighlight the sectors—agro-business, light manufacturing, tourism, and textile—in whichsub-Saharan Africa has the potential to leverage its comparative advantages.
COGCMRGABNGATCHAGO
LBR
BFA
MOZ
BWANAM
TZASLE
ZWEZAFNERCAFZMBCODGIN MLI
GHA
SWZSTP
LSO
SYC
MUS
CPV
ETH
BDI RWAGMB
TGOKEN
MDG ERIMWIBENUGASEN
CIV
VNMPOL
INDCHN
BGD
0
10
20
30
40
50
0 10 20 30 40 50
Shar
e of
fore
ign
valu
e ad
ded
in c
ount
ries'
expo
rts, a
vera
ge 2
008–
12
Share of foreign value added in countries' exports, average 1991–95
Oil exporters
Resource-intensive non-oil
Rest of the region
Comparator countries
Sources: Eora database; and IMF staff calculations.Note: See Annex 3.2 fCountry Groups for a list of countries in each group.
28 INTERNATIONAL MONETARY FUND
Figure 18. Sub-Saharan African Selected Countries: Decomposition of Change in Depth of Integration in Global Value Chains, Average 1991–95 to 2008–12
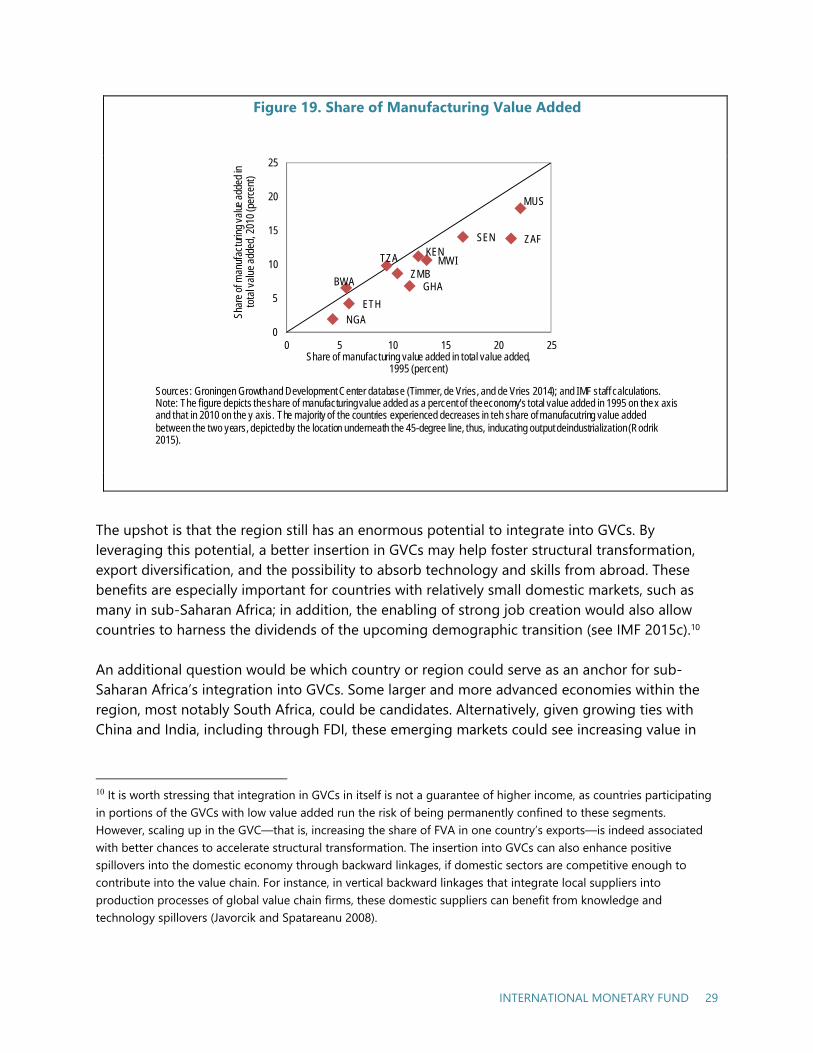
However, to leverage these comparative advantages, the business environment(infrastructure, rule of law, cost and wage competitiveness, and so on) needs to be right. Onthat front, more still needs to be done, judging from the broader trend decline inindustrialization in the region documented in other studies (Rodrik 2015; Figure 19). Itshould be noted, though, that opportunities to participate in GVCs are not limited tomanufacturing. Just as the production of goods has been broken down into different stages,services are increasingly being disaggregated and traded as separate tasks to create servicevalue chains—as championed by India, for example.
-4
-2
0
2
4
6
8
10
12
14
16
Tanzania Ethiopia Seychelles South Africa KenyaCha
nge
in s
hare
of f
orei
gn v
alue
add
ed in
cou
ntry
'sex
ports
, per
cent
age
poin
ts
Agriculture, food, and beveragesMining, quarrying, and petroleum productsManufacturing excluding textiles¹TextilesTransport and tourismOther private services²Public administration, education, and healthOther sectors
Sources: EORA database; and IMF staff calculations.1 Includes electrical and machinery, metal products, wood and paper, transport equipment, and other manufacturing.2 Includes construction, telecommunications, wholesale trade, maintenance and repair.
INTERNATIONAL MONETARY FUND 29
Figure 19. Share of Manufacturing Value Added
The upshot is that the region still has an enormous potential to integrate into GVCs. By leveraging this potential, a better insertion in GVCs may help foster structural transformation, export diversification, and the possibility to absorb technology and skills from abroad. These benefits are especially important for countries with relatively small domestic markets, such as many in sub-Saharan Africa; in addition, the enabling of strong job creation would also allow countries to harness the dividends of the upcoming demographic transition (see IMF 2015c).1011
An additional question would be which country or region could serve as an anchor for sub-Saharan Africa’s integration into GVCs. Some larger and more advanced economies within the region, most notably South Africa, could be candidates. Alternatively, given growing ties with China and India, including through FDI, these emerging markets could see increasing value in
10 It is worth stressing that integration in GVCs in itself is not a guarantee of higher income, as countries participating in portions of the GVCs with low value added run the risk of being permanently confined to these segments. However, scaling up in the GVC—that is, increasing the share of FVA in one country’s exports—is indeed associated with better chances to accelerate structural transformation. The insertion into GVCs can also enhance positive spillovers into the domestic economy through backward linkages, if domestic sectors are competitive enough to contribute into the value chain. For instance, in vertical backward linkages that integrate local suppliers into production processes of global value chain firms, these domestic suppliers can benefit from knowledge and technology spillovers (Javorcik and Spatareanu 2008).
BWA
ETH
GHA
KENMWI
MUS
NGA
SEN ZAF
TZA
ZMB
0
5
10
15
20
25
0 5 10 15 20 25
Shar
e of
man
ufac
turin
g va
lue a
dded
in
tota
l val
ue a
dded
, 201
0 (p
erce
nt)
Share of manufacturing value added in total value added,1995 (percent)
Sources: Groningen Growth and Development Center database (Timmer, de Vries, and de Vries 2014); and IMF staff calculations. Note: The figure depicts the share of manufacturing value added as a percent of the economy's total value added in 1995 on the x axis and that in 2010 on the y axis. The majority of the countries experienced decreases in teh share of manufacutring value addedbetween the two years, depicted by the location underneath the 45-degree line, thus, inducating output deindustrialization (Rodrik2015).

30 INTERNATIONAL MONETARY FUND
outsourcing some of their economic activities to sub-Saharan Africa, especially as rising wages in the Asian countries could make the region more cost-competitive.
In that context, an econometric analysis investigates the policy measures likely to support a stronger insertion for the region into GVCs. We mimic the gravity equation in the previous section in terms of the control variables, but instead of bilateral trade, we use backward integration as the dependent variable:
ln FVA β β X γ θ ε ,
where FVA is the share of FVA in country i’s exports in year t, and where X are control variables. For the latter, we use GDP per capita as well as the same term in squared term to capture the negative portion of the relationship. For policy variables, we include domestic credit provided by the financial sector as share of GDP, spending on education as share of GDP, quality of infrastructure, the weighted average of tariff rates applied to all products in a given country and year, and, last, a measure on the rule of law. All variables, with the exception of index variables, are in logs to eliminate potential outliers, and they are lagged by one year to avoid simultaneity bias. Moreover, we control for time, θ , and country, γ ,fixed effects. As a robustness check, we also run a separate regression using the subsample of countries and years with only $22,000 GDP per capita, thus capturing only the portion in which backward integration and income levels are positively related, as evidenced in Table 3. The variables show similar magnitudes and levels of statistical significance.
We conduct the estimation on an unbalanced panel for 185 countries and over the period 2007–11. After controlling for the level of development and the size of the economy (as smaller countries tend to be more internationally integrated, all else equal), deeper integration in GVCs—as measured by a higher share of FVA in one country’s exports—is found to be associated with improved indicators of human capital and availability, while it is hampered by higher tariff levels and difficult business environments (Table 3). More specifically, a reduction in tariff rates across sub-Saharan Africa toward the average prevailing in non-sub-Saharan African countries could increase the share of FVA in exports by about 3 percentage points, an increase in access to credit by 2 percentage points, and an increase in education spending and rule of law to levels seen elsewhere in the world by another 1 percentage point each. While such changes would likely occur over time, together they would bring the depth of integration of the region to levels currently seen in other low-income and emerging markets. This suggests that actions on these policy levers would go a long way to positioning the region well to participate in GVCs.

INTERNATIONAL MONETARY FUND 31
Table 3. Panel Regression of Backward Integration and Policy Variables
(1) (2)
Entire Sample
Capita < $22,000
Real GDP per capita (lag1) 0.326** -0.085*(0.161) (0.047)
Real GDP per capita^2 (lag1) -0.029**(0.011)
GDP (lag1) -0.060*** -0.059***(0.017) (0.020)
Domestic credit to private sector (percent of GDP) (lag1) 0.082* 0.080
(0.043) (0.054)
Education (percent of GDP) (lag1) 0.413*** 0.349***(0.081) (0.082)
Rule of law (lag1) 0.287*** 0.328***(0.063) (0.063)
Quality of infrastructure (lag1) 0.047 0.063(0.041) (0.048)
Tariff_weighted (lag1) -0.296*** -0.254***(0.037) (0.041)
Constant -2.672*** -1.216***(0.636) (0.380)
Number of observations 385 236
Time fixed effects Yes Yes
Country fixed effects Yes Yes
R -Squared 0.39 0.57
Dependent Variable: Backward Integration as Share of Total Exports
Source: Eora database; World Bank, World Development Indicators ; Global
Competitiv eness Index ; and IMF staff calculations.
Note: All v ariables are in natural log, ex cept for rule of law and quality of infrastructure;
the independent v ariables are lagged by one y ear. Robust standard errors in
parentheses; * indicate significance at 10 percent, ** at 5 percent, and *** at 1 percent.

INTERNATIONAL MONETARY FUND 33
Conclusion
Sub-Saharan Africa has experienced a formidable expansion of its trade flows over the past 20 years, helping propel its growth engine. Strong demand for commodities has undeniably played a role in supporting the increase in trade, in particular with emerging markets, but it is far from the entire story, as even non-oil commodity exporters have managed to diversify their export structure and start to integrate in value chains.
Nonetheless, the current global environment—a slowing China, anemic growth in Europe, faltering commodity prices, and the risks of global financial volatility as some advanced economies normalize monetary policy conditions—will be more challenging than in the recent past. This environment, however, provides a unique opportunity to refocus policies on economic diversification and on fostering structural transformation. Further and better integration into global trade can provide such an opportunity. Despite the strong growth in trade flows, sub-Saharan Africa still trades below its potential, in terms of both total flows and positioning in GVCs. Some countries have started to leverage their comparative advantages, either in agriculture and agro-business or, in some cases, in manufacturing. Yet, more broadly, much more could be done to arrest the gradual deindustrialization in the region.
Addressing the barriers to trade could therefore unlock untapped productivity gains, bringing with it more jobs, higher income levels, more diversified economies, and eventually more sustainable growth. Supporting the development of regional trade flows would also better shelter the region from exogenous external shocks. The need to improve infrastructure is one of the most important impediments to trade flows. But lower tariffs, better access to credit for the private sector, and a more conducive business climate are all found to support more intense trade flows and better insertion into GVCs, as do efforts to improve education outcomes. Those are levers on which the authorities have control and have started to work. The efforts should be sustained and even accelerated to leverage the region’s remarkable assets, including sound macroeconomic policies, improving economic institutions, and a young and growing workforce.
6

INTERNATIONAL MONETARY FUND 35
References
Baldwin R. 2004. “Openness and Growth: What’s the Empirical Relationship?” In Challenges to Globalization: Analyzing the Economics, edited by Richard E. Baldwin and L. Alan Winters. National Bureau of Economic Research, University of Chicago Press, Chicago.
———. 2011. “Trade and Industrialization after Globalization’s 2nd Unbundling: How Building and Joining a Supply Chain Are Different and Why It Matters.” Working Paper No. 17716, National Bureau of Economic Research, Cambridge, Massachusetts.
Brin, S., and L. Page. 1998. “The Anatomy of a Large-Scale Hypertextual Web Search Engine.” Proceedings of the 7th World-Wide Web Conference, Brisbane, Australia.
De Benedictis, L., S. Nenci, G. Santoni, L. Tajoli, and C. Vicarelli. 2014. “Network Analysis of World Trade Using the BACI-CEPII Dataset.” Global Economy Journal 14 (3–4): 287–343.
Dollar, D., and A. Kraay. 2003. “Institutions, Trade and Growth.” Journal of Monetary Economics 50 (1): 133–62.
Head, K., and T. Mayer. 2014. “Chapter 3—Gravity Equations: Workhorse, Toolkit, and Cookbook.” In Handbook of International Economics, edited by Elhanan Helpman, Kenneth Rogoff, and Gita Gopinath. Elsevier 4 (2014): 131–95.
Henn, C., C. Papageorgiou, and N. Spatafora. 2013. “Export Quality in Developing Countries.” Working Paper 13/108, International Monetary Fund, Washington.
International Monetary Fund. 2011. “Implications of Asia’s Regional Supply Chain for Rebalancing Growth.” In Regional Economic Outlook: Asia and Pacific Department, Chapter III. Washington, April.
———. 2012. Regional Economic Outlook: Sub-Saharan Africa. Washington, October.
———. 2013. “Trade Interconnectedness—The World with Global Value Chains.” Paper SM/13/248, Washington.
———. 2014a. Regional Economic Outlook: Asia and Pacific Department. Washington, May.
———. 2014b. “Baltic Cluster Report.” Washington, May.
———. 2014c. Regional Economic Outlook: Sub-Saharan Africa. Washington, October.
———. 2015a. “Pan-African Banks–Opportunities and Challenges for Cross-Border Oversight.” Unpublished, Washington.
36 INTERNATIONAL MONETARY FUND
———. 2015b. “Staff Report on Review of the Role of Trade in the Work of the Fund.”, Washington.
———. 2015c. “The Quest for Regional Integration in the East African Community.” Edited by P. Drummonds, S. Kal Wajid, and O. Williams. Washington, February.
Javorcik, B. S., and M. Spatareanu. 2008. “To Share or Not to Share: Does Local Participation Matter for Spillovers from Foreign Direct Investment?” Journal of Development Economics 85 (1): 194–217.
Lenzen, M., K. Kanemoto, D. Moran, and A. Geschke. 2012. “Mapping the Structure of the World Economy.” Environmental Science & Technology 46 (15): 8374–81.
———. 2013. “Building Eora: A Global Multi-Regional Input-Output Database at High Country and Sector Resolution.” Economic Systems Research 25:1.
Maertens, M., L. Colen, and J.F.M. Swinnen. 2011. “Globalisation and Poverty in Senegal: A Worst Case Scenario?” European Review of Agricultural Economics 38 (1): 31–54.
Mayer, T., and S. Zignago. 2011. “Notes on CEPII’s Distances Measures: The GeoDist Database.” Working Paper 2011–25, Centre d’Etudes Prospectives et d’Informations Internationales (CEPII), Paris.
Moral-Benito, E. 2012. “Determinants of Economic Growth: A Bayesian Panel Data Approach.” Review of Economics and Statistics 94 (2): 566–79.
Nordås, H. K., and R. Piermartini. 2004. “Infrastructure and Trade.” Staff Working Paper ERSD-2004-04, World Trade Organization, Geneva, August.
Rodrik, D. 2015. “Premature Deindustrialization.” Working Paper 20935, National Bureau of Economic Research, Cambridge, Massachusetts.
Sutton, J. 2012. “Competing in Capabilities: The Globalization Process.” Oxford University Press, Oxford.
United Nations Conference on Trade and Development (UNCTAD). 2013. “World Investment Report 2013: Global Value Chains: Investment and Trade for Development.” United Nations Publishing, New York and Geneva.
———. 2014. “World Investment Report 2014: Investing in the SDGs: An Action Plan.” United Nations Conference on Trade and Development. United Nations Publishing, New York and Geneva.
World Trade Organization (WTO). 2014. World Trade Report 2014: Trade and Development: Recent Trends and the Role of the WTO. World Trade Organization, Geneva.