“trade integration in the east african community: an ... · trade integration in the east african...
TRANSCRIPT

WP/05/143
Trade Integration in the East African Community: An Assessment for Kenya
Meredith A. McIntyre

© 2005 International Monetary Fund WP/05/143
IMF Working Paper
African Department
Trade Integration in the East African Community: An Assessment for Kenya
Prepared by Meredith A. McIntyre1
Authorized for distribution by Godfrey Kalinga
July 2005
Abstract
This Working Paper should not be reported as representing the views of the IMF. The views expressed in this Working Paper are those of the author(s) and do not necessarily represent those of the IMF or IMF policy. Working Papers describe research in progress by the author(s) and are published to elicit comments and to further debate.
The paper analyses the potential trade impact of the forthcoming East African Community (EAC) customs union. It examines the trade linkages among the member countries of the EAC and the extent to which the introduction of the EAC common external tariff will liberalize their trade regimes. To gauge the potential trade impact of the formation of the customs union, simulations are conducted for Kenya. The empirical results indicate that the customs union will have a beneficial effect on Kenya’s trade. The paper does not draw any conclusions on the potential welfare impact of the customs union. Finally, factors other than enhanced trade might influence Kenyan policymakers to pursue regional integration, and these include regional cooperation in “behind the border” reforms and the provision of public goods. JEL Classification Numbers: F15 Keywords: EAC, CET, regional integration Author(s) E-Mail Address: [email protected]
1 I am grateful for the unfailing support of Mr. Olivier Jammes (World Bank) and Marcelo Olarreaga (World Bank) for their assistance in conducting the SMART simulation using the WITS software. Mr. Yongzheng Yang (African Department) and my colleagues Mr. Kevin Cheng (Africa Department) and Ms. Lynn Aylward (Policy Development and Review Department) provided valuable comments.

- 2 -
Contents Page
I. Introduction....................................................................................................................3
II. Trade Flows and Trade Regimes in the EAC ................................................................5 A. Trade Flows...............................................................................................................5 B. Trade Regimes...........................................................................................................6
III. The EAC Customs Union ..............................................................................................9 A. The EAC Common External Tariff...........................................................................9
IV. Trade Impact: An Assessment for Kenya ....................................................................13 A. Economic Integration Theory .................................................................................13
The Trade Simulation Model ...........................................................................14 Transitional Costs ............................................................................................17
V. Other Reasons for East African Integration.................................................................18 “Widening and deepening” of regional integration .........................................18 Trade Facilitation and “Behind the Border” Reforms .....................................19 Public Goods....................................................................................................19
VI. Conclusions..................................................................................................................20 Tables 1. EAC Countries: Exports and Imports, 2001 ..................................................................5 2. EAC Countries: Regional Trade by Commodities, 2001...............................................7 3. Features of Trade Regimes of Kenya, Tanzania, and Uganda.......................................8 4. EAC Countries: Evolution of Tariff Regimes, 1997-2002 ............................................9 5. EAC Countries: Estimated Effects of Proposed Tariff Changes .................................12 6. Trade Simulation Results.............................................................................................16 Figure 1. Regional Integration Arrangements in Africa................................................................4 Appendix I. The Smart Simulation Model.......................................................................................21 A. Simplest Version .........................................................................................21 B. Constraining Trade Diversion .....................................................................24 References ..........................................................................................................................26

- 3 -
I. INTRODUCTION
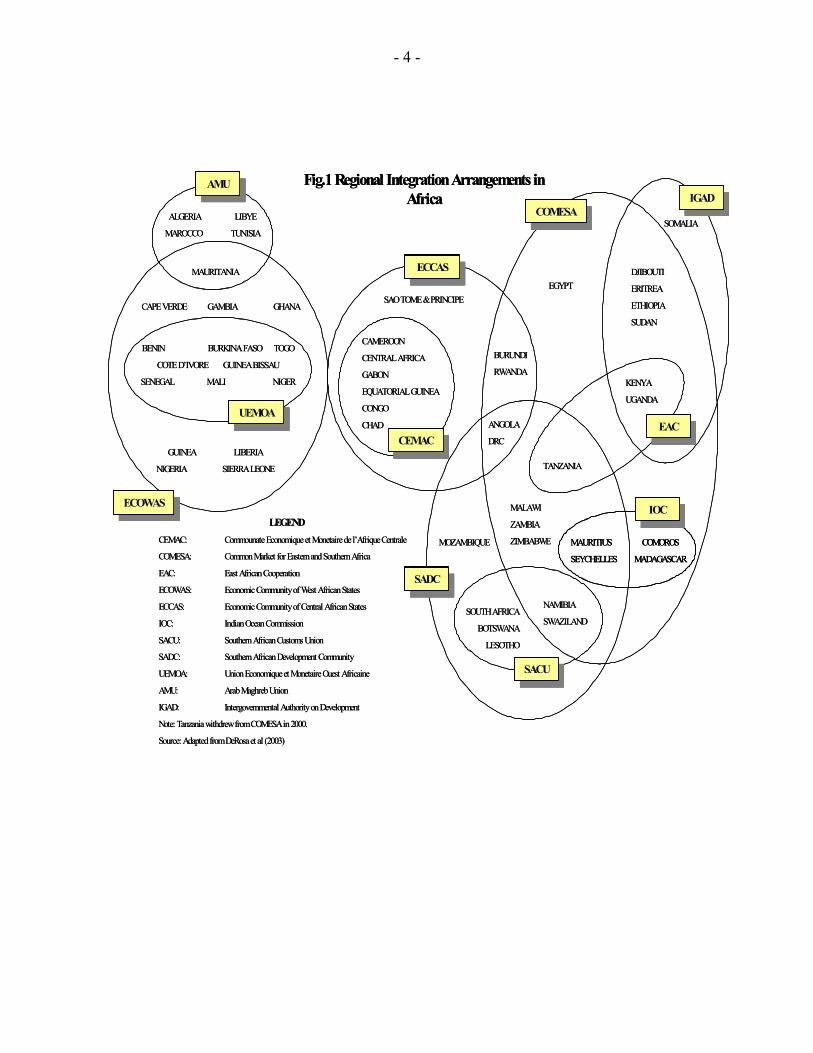
Among the regional trading arrangements (RTAs) that have proliferated in Africa (see Figure 1), the East African Community (EAC) is a preferential trading area consisting of Kenya, Tanzania, and Uganda. The present or “new” EAC is a revival of the original EAC, a customs union that was established in 1967, at the end of the colonial era and that, for a variety of political and economic reasons, collapsed in 1977. The “new” EAC is aiming to achieve deeper regional integration among the three member states with the establishment of a customs union, then a common market, a monetary union, and ultimately a political federation.
The three EAC member states had a combined GDP of $31.4 billion in 2003. Kenya is the largest of the three economies with a GDP of $14.1 billion in 2003, a population of 31.9 million, and a per capita GDP of $445; Tanzania’s GDP is $10.3billion, its population is 35.9 million, and per capita GDP is $286.6; Uganda’s GDP is $7.0 billion, its population is 25 million, and per capita GDP is $280.8. The differences in overall GDP and per capita GDP have narrowed in the past decade, with stronger economic performance in Tanzania and Uganda and sluggish growth in Kenya. During 1990-2001, Kenya’s real GDP grew at an annual average rate of 2.2 percent. This was well below the average GDP growth rate of Uganda (6.8 percent), Tanzania (3.1 percent), and the sub-Saharan Africa regional average (2.6 percent).
All three countries share a number of similarities, resulting from their common location, climate, and history. Notably, Uganda is landlocked, relying on access to seaports in Kenya (Mombasa) and Tanzania (Dar-es-Salaam). They are members of the World Trade Organization (WTO) and belong to other RTAs—Kenya and Uganda are members of COMESA, and Tanzania is a member of SADC (see Fig.1).
All three countries view regional integration as an essential plank of their development strategy and an important ingredient in stimulating increased trade and investment. Policymakers are expecting the creation of the EAC customs union to facilitate higher trade and investment flows between member states and through increased competition to improve the efficiency and competitiveness of the exports sectors in the individual countries. The purpose of this paper is to gauge the effects of the EAC customs union on the trade flows and trade regimes of EAC member states. In addition, with the introduction of the EAC common external tariff (CET) lowering tariffs in Kenya, the paper analyzes whether there is a positive impact on trade. The paper is structured as follows. First, it identifies the key features of EAC member countries’ trade flows and trade regimes (Section II). In Section III the paper describes the new EAC customs union, particularly the EAC CET, analyzes its impact on the trade regimes in EAC member countries, and attempts to gauge its potential impact on trade by conducting simulations for Kenya (Section IV). Finally, in Section V, it discusses factors other than trade integration, that support deeper regional integration in the East African region. Section VI offers conclusions.
- 4 -
SAO TOME & PRINCIPE
ANGOLA
DRC
CAMEROON
CENTRAL AFRICA
GABON
EQUATORIAL GUINEA
CONGO
CHAD
BURUNDI
RWANDA
EGYPT
MALAWI
ZAMBIA
ZIMBABWEMOZAMBIQUE
NAMIBIA
SWAZILANDSOUTH AFRICA
BOTSWANA
LESOTHO
KENYA
UGANDA
TANZANIA
MAURITIUS
SEYCHELLES
COMOROS
MADAGASCAR
SOMALIA
DJIBOUTI
ERITREA
ETHIOPIA
SUDAN
ALGERIA LIBYE
MAROCCO TUNISIA
MAURITANIA
CAPE VERDE GAMBIA GHANA
GUINEA LIBERIA
NIGERIA SIERRA LEONE
BENIN BURKINA FASO TOGO
COTE D’IVORE GUINEA BISSAU
SENEGAL MALI NIGER
AMUAMU
UEMOAUEMOA
ECOWASECOWAS
IGADIGAD
COMESACOMESA
ECCASECCAS
CEMACCEMAC EACEAC
IOCIOC
SACUSACU
SADCSADC
LEGEND
CEMAC: CommounateEconomiqueet Monetairede l’AfriqueCentrale
COMESA: Common Market for Eastern and Southern Africa
EAC: East African Cooperation
ECOWAS: Economic Community of West African States
ECCAS: Economic Community of Central African States
IOC: Indian Ocean Commission
SACU: Southern African Customs Union
SADC: Southern African Development Community
UEMOA: Union Economiqueet MonetaireOuest Africaine
AMU: Arab MaghrebUnion
IGAD: Intergovernmental Authority on Development
Note: Tanzania withdrew from COMESA in 2000.
Source: Adapted from DeRosaet al (2003)
Fig.1 Regional Integration Arrangements in Africa
SAO TOME & PRINCIPE
ANGOLA
DRC
CAMEROON
CENTRAL AFRICA
GABON
EQUATORIAL GUINEA
CONGO
CHAD
BURUNDI
RWANDA
EGYPT
MALAWI
ZAMBIA
ZIMBABWEMOZAMBIQUE
NAMIBIA
SWAZILANDSOUTH AFRICA
BOTSWANA
LESOTHO
KENYA
UGANDA
TANZANIA
MAURITIUS
SEYCHELLES
COMOROS
MADAGASCAR
MAURITIUS
SEYCHELLES
COMOROS
MADAGASCAR
SOMALIA
DJIBOUTI
ERITREA
ETHIOPIA
SUDAN
ALGERIA LIBYE
MAROCCO TUNISIA
MAURITANIA
CAPE VERDE GAMBIA GHANA
GUINEA LIBERIA
NIGERIA SIERRA LEONE
BENIN BURKINA FASO TOGO
COTE D’IVORE GUINEA BISSAU
SENEGAL MALI NIGER
AMUAMU
UEMOAUEMOA
ECOWASECOWAS
IGADIGAD
COMESACOMESA
ECCASECCAS
CEMACCEMAC EACEAC
IOCIOC
SACUSACU
SADCSADC
LEGEND
CEMAC: CommounateEconomiqueet Monetairede l’AfriqueCentrale
COMESA: Common Market for Eastern and Southern Africa
EAC: East African Cooperation
ECOWAS: Economic Community of West African States
ECCAS: Economic Community of Central African States
IOC: Indian Ocean Commission
SACU: Southern African Customs Union
SADC: Southern African Development Community
UEMOA: Union Economiqueet MonetaireOuest Africaine
AMU: Arab MaghrebUnion
IGAD: Intergovernmental Authority on Development
Note: Tanzania withdrew from COMESA in 2000.
Source: Adapted from DeRosaet al (2003)
Fig.1 Regional Integration Arrangements in Africa

- 5 -
II. TRADE FLOWS AND TRADE REGIMES IN THE EAC
A. Trade Flows
Overall, the trade data in Table 1 indicate that the direction and pattern of trade of the three EAC members are consistent with their level of development. They export primary products,2 mainly to Europe and, to a lesser extent, the Middle East. In 2001, the European Union (EU) received 37.1 percent and 64.5 percent of Tanzania’s and Uganda’s exports. The exception is Kenya whose exports to African countries, particularly Tanzania and Uganda, are substantial. Kenya’s exports to the EU were 31.9 percent of its total exports, whereas exports to other African countries accounted for 35.9 percent and to the EAC 22.6 percent.
Table 1. EAC Countries: Exports and Imports, 2001(In million of U.S. dollars)
Kenya Tanzania Uganda EACExports Imports Exports Imports Exports Imports Exports Imports
Total 2,301 3,631 764 1,636 334 1,009 3,400 6,276
Share of industrial countries 41 42 53 38 76 28 50 39European Union 32 27 37 25 65 22 39 26United States 8 8 3 4 5 3 6 6Japan 1 5 12 4 4 3 4 5Other 2 1 5 2 0 1.1 2.4
Developing countries 58 57 47 62 25 72 49 61Africa 36 10 19 23 8 57 27 21East African Community 23 1 10 7 2 49 16 11South Africa 1 7 1 13 1 7 1 9Asia 12 18 23 25 9 11 14 19Europe 1 1 2 1 7 1 2 1Middle East 7 26 3 12 2 3 5 19Western Hemisphere 0 2 1 1 0 0 0 1
Source: World Bank estimates. Imports from Africa and the Middle East (mainly Egypt) account for 35.7 percent of Kenya’s total imports, and EU imports, 27.3 percent. Tanzania and Uganda received a large share of
2 EAC exports to the EU are principally agricultural commodities and minerals. Kenya’s exports are coffee, tea, cut flowers, and vegetables; Tanzania’s are gold, fish fillets, nuts (coconuts, brazil nuts and cashews), and coffee; and Uganda’s are fish fillets, gold, tobacco, and tea.

- 6 -
their imports from Africa and the Middle East (35.0 percent and 60.2 percent, respectively, of total imports). In the past decade intraregional trade has grown, with the share of intraregional exports increasing from about 6 percent in 1991 to 16 percent in 2001, and imports rising from 2.7 percent in 1991 to 10.5 percent in 2001. Despite these gains, the trade linkages between the countries could be stronger. Although Kenya sends a significant share of its exports to the EAC, it takes in only 1.4 percent of total imports from the subregion (Table 1).
Tanzania sends only 9.9 percent of its total exports to the subregion and receives from it 7.2 percent of its total imports. However, while Uganda’s exports to the EAC are similarly low, it receives a substantial 48.8 percent of total imports from the EAC (mainly from Kenya).
The commodity composition of intraregional trade reveals that unlike trade with the rest of the world, manufactures play an important role. Table 2 indicates that for Kenya 11.5 percent and 43.4 percent of its imports from Uganda and Tanzania, respectively, are manufactures. For Uganda, 33.8 percent and 71.3 percent of its imports are manufactures from Kenya and Tanzania, and for Tanzania 56.8 percent and 16.6 percent of its imports are manufactures from Kenya and Uganda. In short, the expansion of intraregional trade has provided a market for the manufacturing sectors in the EAC member states, particularly Kenya. The challenge is to transform these industries to produce internationally competitive exports and go beyond the regional market.
B. Trade Regimes
The trade regimes of the EAC member countries are characterized by a “cascading tariff” structure. In such a tariff regime3 the lowest rates are imposed on raw materials and capital goods, moderate rates on intermediate goods, and the highest rates on consumer goods. These structures reflect the historical pattern of tariffs in many countries, with high rates being placed on consumer goods partly to restrain demand and collect revenue but also to protect or stimulate domestic producers of final consumer goods from foreign competition. Trade liberalization in recent years, however, has brought about considerable reductions in the top rates and rationalized the structure of tariff regimes so that the differences between rates has narrowed considerably. Table 3 provides detailed information on the key features of the trade regimes of the three EAC member countries. 3 Generally, it is felt that such a tariff structure promotes anti-export bias in the structure of economic incentives. This is one aspect of the general distortion to relative domestic prices, and hence to resource allocation, caused by differentiated tariff rates. In theory, a uniform tariff applied to all imports or all exports (or both) will minimize domestic distortions, particularly if the exchange rate is market-determined. But the preferential rates accorded to consumer goods at the expense of capital goods and intermediate inputs will tend to bias domestic production toward consumer goods and away from exports, capital, and intermediate goods.

- 7 -
Table 2. EAC Countries: Regional Trade by Commodities, 2001 (Percent of total)
Imports from: Exports to:
Uganda Tanzania Uganda TanzaniaKenya
Food products 79.8 21.6 8.4 18.8Agricultural materials 6.1 19.3 8.4 2.8Textiles fibres 2.4 2.0 0.0 0.0Ores, minerals, and metals 0.1 11.8 3.9 3.6Energy 0.1 2.0 26.4 15.7Petroleum, petroleum products 0.0 2.0 26.1 15.7Gas, natural and manufactured 0.0 0.0 0.3 0.0Manufacturing 11.5 43.4 52.9 59.1
Kenya Tanzania Kenya TanzaniaUganda
Food products 3.6 18.3 64.5 34.6Agricultural materials 6.3 8.6 11.7 0.5Textiles fibres 0.1 0.2 4.7 0.4Ores, minerals, and metals 3.5 0.3 2.8 0.0Energy 52.7 1.4 12.9 26.4Petroleum, petroleum products 52.4 1.4 0.1 0.0Gas, natural and manufactured 0.3 0.0 0.0 0.0Electric current 0.0 0.0 12.8 26.4Manufacturing 33.8 71.3 3.3 38.2
Kenya Uganda Kenya UgandaTanzania
Food products 10.8 23.1 68.4 20.0Agricultural materials 2.6 0.1 10.9 5.4Textiles fibres 0.2 0.1 6.0 0.6Ores, minerals, and metals 2.9 0.0 0.3 3.3Energy 26.7 60.0 0.5 11.8Petroleum, petroleum products 26.7 60.0 0.5 11.8Manufacturing 56.8 16.6 13.9 58.8
Source: United Nations, Commodity Trade Statistics Database, 2003.

- 8 -
Tabl
e 3.
Fea
ture
s of T
rade
Reg
imes
of K
enya
, Tan
zani
a, a
nd U
gand
a
Ken
ya 1
/Ta
nzan
iaU
gand
aB
ands
=0, 2
.5, 5
, 15,
20,
25,
30,
35,
40,
100
Ban
ds=0
, 5, 1
0, 2
0, 2
5B
ands
=0, 7
, 15,
30
00
0 (p
lant
and
mac
hine
ry)
2.5
(prim
ary
stag
e ra
w m
ater
ials
)5
(raw
mat
eria
ls, c
apita
l goo
ds)
7 (r
aw m
ater
ials
)5
10 (s
emi-p
roce
ss in
puts
& sp
are
parts
)15
(con
sum
er g
oods
)15
(mos
t int
erm
edia
te g
oods
)20
(pro
cess
ed in
put &
veh
icle
par
ts)
2025
(fin
al c
onsu
mer
goo
ds)
25 30 35
40 (p
roce
ssed
and
pre
serv
ed fr
uits
and
ve
geta
bles
, fru
it ju
ices
, pap
er a
nd p
aper
boar
d ite
ms)
100
(sug
ar)
Unw
eigh
ted
aver
age
tarif
f16
.614
.39
Wei
ghte
d av
erag
e ta
riff
13.5
6…
…Pr
efer
entia
l tar
iff g
iven
to o
ther
EA
C m
embe
rs90
per
cent
80 p
erce
nt0,
4 a
nd 6
per
cent
Susp
ende
d du
ties
Oil
prod
ucts
4 pr
oduc
ts
Toba
cco
(30
perc
ent)
and
impo
rted
suga
r for
fin
al c
onsu
mpt
ion
(15
perc
ent o
f dec
reed
va
luat
ion
of $
410
per t
onne
)
Alte
rnat
ive
min
imum
spec
ific
dutie
s and
min
imum
du
ty v
alue
s (M
DV
s)
Mai
ze, w
heat
, sug
ar, r
ice,
milk
, alc
ohol
pr
oduc
ts, t
obac
co p
rodu
cts,
text
iles,
clot
hing
, fo
otw
ear,
som
e m
anuf
actu
red
prod
ucts
. 2/
All
MD
Vs h
ave
been
abo
lishe
d in
Janu
ary
2001
exc
ept s
ugar
.N
one
Oth
er c
harg
es o
n im
ports
Impo
rt de
clar
atio
n fe
e of
Ksh
500
0 or
2.7
5 pe
rcen
t, w
hich
ever
is h
ighe
r.
VA
T@17
per
cent
; exc
ise
tax
on se
lect
ed
prod
ucts
(som
e sp
ecifi
c an
d so
me
ad
valo
rem
).
Impo
rt ex
empt
ions
Goo
ds u
sed
by sp
ecia
l pub
lic se
ctor
s (ar
med
fo
rces
, pol
ice)
; mot
or v
ehic
les f
or m
embe
rs o
f th
e N
atio
nal A
ssem
bly,
Per
man
ent S
ecre
tarie
s, ju
dges
, uni
vesi
ty le
ctur
ers.
Publ
ic se
ctor
impo
rtsIm
ports
for P
resi
dent
s's u
se, i
mpo
rts b
y di
plom
ats,
impo
rts o
f per
sona
l effe
cts,
and
duty
-free
allo
wan
ces
Trad
e re
stric
tiven
ess i
ndic
ator
65
2Ex
port
duty
dra
wba
cks
Yes
Yes
Yes
Expo
rt ta
xes
Non
eN
one
(at c
enta
l lev
el)
Non
eM
embe
rshi
p in
CO
MES
AY
esN
o (w
ithdr
ew in
200
0)Y
esM
embe
rshi
p in
CO
MES
A F
TAY
esN
oN
oR
estri
ctio
ns o
n se
rvic
esLi
mita
tion
on fo
reig
n ow
ners
hip
of sh
ares
.
1/
Ken
ya h
as a
sele
ct g
roup
of p
rodu
cts t
hat a
re g
rant
ed h
ighe
r rat
es th
an in
the
tarif
f stru
ctur
e 0-
35.
2/
For
Ken
ya, t
he a
ltern
ativ
e m
inim
um d
uty
rate
s are
set a
s flo
or ra
tes b
ased
on
the
low
est e
xpec
ted
pric
es.
Cur
rent
tarif
f stru
ctur
e

- 9 -
Table 4. EAC Countries: Evolution of Tariff Regimes, 1997-2002(In percent)
1997 1999 2002
Kenya Tariff bands 5.0 5.0 5.0Maximum rate 35.0 35.0 35.0Simple average 18.4 16.3 16.6
Tanzania 1/Tariff bands 9.0 5.0 4.0Maximum rate 50.0 25.0 25.0Simple average 21.8 16.1 14.3
UgandaTariff bands 4.0 3.0 3.0Maximum rate 20.0 15.0 15.0Simple average 13.2 9.0 9.0
Sources: World Trade Organization and United Nations Conference on Trade and Development. 1/ Data for Tanzania are for 2001.
All three countries had progressively reduced their tariffs since the mid-1990s (see Table 4).4 The most significant changes were in Uganda and, to some extent Tanzania. This was manifested by the fall in the maximum rates, the number of tariff bands, and the simple average tariff. In addition, Uganda has narrowed the differences between the top rate on consumer goods and the lower rates on raw materials and capital goods. In contrast, Kenya has not made progress in liberalizing its tariff schedule, but its simple average tariff has marginally declined as a consequence of modifications in tariff classifications.
III. THE EAC CUSTOMS UNION
A. The EAC Common External Tariff
The treaty establishing the EAC, comprising Kenya, Tanzania, and Uganda, was signed by the three member governments in November 1999. Formally launched in 2001, the EAC
4 These are applied rather than bound rates, which are typically higher.

- 10 -
treaty provides for the establishment of a customs union by January 1, 2005.5 To form the customs union, the three countries would have to remove all internal tariffs and establish a CET, introduce rules of origin, and a variety of administrative arrangements, including a harmonized customs administration, a customs valuation system, and customs procedures and documentation. On June 23, 2003, the presidents of Kenya, Tanzania, and Uganda reached an agreement on the CET for the planned customs union6. The CET has three tariff bands:7 0 percent for meritorious goods, raw materials, and capital goods; 10 percent for intermediate goods; and 25 percent for consumer goods.
The treaty establishing the EAC recognizes asymmetry as a core principle underpinning the formation of the EAC customs union. Its inclusion in the treaty is justified on the basis of the understanding that the three EAC member states are at different levels of economic development and that the existing imbalances, which could, in fact, be exacerbated by the customs union, need to be addressed. Under the EAC CET, Tanzania and Uganda eliminate tariffs on all imports except for an agreed list of commodities8—906 tariff lines for Tanzania and 426 for Uganda—for which the tariff will be reduced gradually to zero, within a period of up to five years. In Uganda, the items on that list will initially attract a 10 percent tariff that over five years will be reduced uniformly. Tanzania has a more complicated arrangement for tariff reduction, with each product group having a different schedule for reducing tariffs; however, no tariff will initially be higher than 25 percent, and the reduction to zero will be within five years. In short, the EAC CET will be implemented in two phases: first, all three countries will adopt the three-band structure, but Tanzania and Uganda will maintain internal tariffs on select Kenyan imports; second, after five years all internal tariffs will be removed, and all Kenyan imports will enter Tanzania and Uganda free of tariffs.
5 As illustrated in Figure 1, EAC members also belong to other regional trade arrangements including COMESA (Kenya and Uganda) and SADC (Tanzania), and this could create conflicting commitments with the EAC customs union.
6 The CET was introduced on January 1, 2005 but has not been fully implemented because the countries needed additional time to finalize the administrative arrangements including reprinting and circulating the ‘tariff books’ to reflect the new rates.
7 A 1999 report adopted by the EAC Secretariat had recommended that EAC countries adopt the Uganda tariff structure (of 0, 7, 15).
8 These temporary protection arrangements are designed to allow producers in Tanzania and Uganda sufficient time to restructure their operations to face increased competition from Kenyan imports.

- 11 -
A major issue in the negotiations on the CET was reaching agreement on the classification of about 20 percent of the tariff lines defined as “sensitive items.” The EAC members state that they want to protect the following products from import competition:
• subsidized exports, mainly agricultural products, from industrial countries; and
• secondhand items.
According to the World Bank (2003), the sensitive items included cigarettes, dry cells, fabrics, garments, matches, milk, cement, packing materials of plastic, palm oil, sugar, tires, used clothes, vehicles (reconditioned cars), vehicle chassis, rice, wheat and wheat flour. These items are equivalent to 361 tariff lines and are estimated at about 20 percent of total imports.9 As of September 2004, after rounds of negotiation, agreement was reached on the classification of sensitive products and the applicable rates of duty, with the exception of jute bags, rice, and wheat. Further, it was agreed that sensitive products could not be “protected” by the maximum rate and therefore required special policy measures. The EAC member states agreed that the sensitive items would attract rates of more than 25 percent and, in some instances, a mixture of specific duty and ad valorem rates.
The new CET will have different effects on the trade regimes in the member countries. The introduction of the three-band tariff structure will increase tariffs in Uganda and, to a lesser degree, Tanzania, and reduce tariffs in Kenya. In Uganda, 3,066 tariff lines are likely to increase compared with 1,224 in Tanzania and 1,144 in Kenya (see Table 5). In contrast, the EAC CET is likely to lower significantly more tariffs in Kenya (3,216) than in Tanzania (2,364) or Uganda (1,353). In addition, the World Bank (2003) estimates that, with the full implementation of the CET, the simple average tariff in the three countries will be 10.9 percent, which represents a significant decline for Kenya from a simple average tariff of 16.6 percent and a smaller decline for Tanzania from a simple average tariff of 14.3 percent. However, Uganda’s simple average tariff10 will increase by about 20 percent.
Tanzania and Uganda apply excise duties and other discriminatory charges to protect their products from Kenyan imports.11 Tanzania applies excise taxes on 55 items at specific or ad valorem rates of 10-30 percent with peaks of over 50 percent, mostly on Ugandan and
9 Based on 2001 data the sensitive items are 16.1 percent of total imports in Kenya, 25.9 percent for Uganda, and 30.0 percent for Tanzania. 10 With a maximum tariff rate of 25 percent and low (or zero) rates on inputs, combined with the possibility that many sensitive goods may have higher rates, the distortions in the effective rate of protection can be large. This represents a major step backwards for Uganda. 11 This means that while tariffs are currently lower in Tanzania and Uganda, the nominal rates of protection may not vary considerably among EAC members.

- 12 -
Kenya Tanzania Uganda
Bands Changed to 0, 10, 25Number of tariffs lowered 3,216 2,364 1,353Number of tariffs increased 1,144 1,224 3,066Number unchanged 753 1,525 694
Bands Changed to 0,10,15Number of tariffs lowered 3,944 3,928 1,353Number of tariffs increased 636 952 1,859Number unchanged 533 233 1,901
Note: Estimated at six-digit level of HS-classification.
Table 5. EAC Countries: Estimated Effects of Proposed Tariff Changes
rates of 10 percent on 467 items increasing substantially to 75 percent for beverages and 130 percent for tobacco.12 With the implementation of the EAC CET, all discriminatory excise duties (except those applied to mineral water, tobacco, beer and other alcoholic beverages) together with suspended duties will be eliminated. In the other areas required for the establishment of an EAC customs union, progress has been made but there are still some outstanding issues. The current situation can be summarized as follows:
• The WTO Customs Valuation Agreement has been adopted;13
• The EAC Customs Management Bill is expected to be approved by the EAC Council;
• Preparations are ongoing to complete the customs regulations and forms;
• Rules of origin14 have been agreed that adopt the COMESA rules with some product-specific rules, mainly for garments; and
12 Kenya imposes excise taxes on 459 items in the top tariff bracket with peaks of 50 and 70 percent. Suspended duties are applied to sugar, maize flour, and milk in the top tariff bracket.
13 The WTO agreement on customs valuation aims for a fair, uniform, and neutral system for the valuation of goods for customs purposes. The agreement provides a set of valuation rules, expanding and giving greater precision to the provisions on customs valuation in the original GATT.
14 Rules of origin are the criteria used to define where a product is made. Typically, they require that sufficient transformation occurs so that a product changes tariff line or a minimum of value added (for example, 35 percent within the region).

- 13 -
• The Customs Union Protocol is yet to be ratified by the member states.
IV. TRADE IMPACT: AN ASSESSMENT FOR KENYA
The analysis of the patterns of intraregional trade indicate that the trade linkages between the EAC member states are not strong, except possibly for the trade between Kenya and Uganda. In addition, the EAC CET will reduce Kenya’s external tariffs and therefore, lower the price of imports. In these circumstances, one might expect the EAC customs union to have a positive impact on Kenya’s trade. Economic integration theory provides insights into the likely effects on a country’s trade from participating in a customs union. We summarize the essential elements of economic integration theory to provide a theoretical background for the empirical analysis.
A. Economic Integration Theory
Regional trading arrangements (RTAs) alter the prices of imports from members (as tariffs are phased out) relative to imports from the rest of the world. Consequently, demand patterns will change, resulting in adjustments in trade and output flows. Will these changes be beneficial to participants in an RTA? Alternatively, will an RTA generate gains from trade? Viner (1950) investigated this question and found that the welfare impact of an RTA is ambiguous. Gains will occur if higher-cost domestic production is replaced by cheaper imports from a partner country—trade creation. But if partner-country production replaces lower-cost imports from the rest of the world—trade diversion—there will be losses. Therefore, membership in an RTA will have positive and negative effects on an economy, and it is the net impact that will determine whether a member experiences welfare gains or losses.
In assessing the static effects of forming an effective RTA three important principles from the theory of integration must be considered. First, the allocative or efficiency gains of economic integration depend on whether the products produced by members of the RTA are in direct competition with, or complementary to, each other.15 For there to be competitive economies or efficiency gains in an RTA, there must be a considerable overlap in the range of commodities that members of the RTA produce. The creation of an RTA where there exists overlapping production with significant differences in production costs between members can lead to large gains from trade as resources are allocated more efficiently among member countries. Intra-industry trade (for example, Ford cars for Honda) characterizes most trade between industrial economies, and the formation of an RTA is likely to lead to competitive gains. For example, it can be argued that the members of the EU, the United 15 The economies of members of an RTA can also be both competitive and complementary. For example, in the North American Free Trade Agreement (NAFTA), the United States and Mexico have important industries but compete directly against each other; for example, textiles and clothing and consumer electronics. To some extent, the two economies are also complementary. In these circumstances, members can derive efficiency gains from an RTA but, to avoid trade diversion, must keep their external tariffs low.

- 14 -
States and Canada (members of a free trade agreement (FTA)), and Australia and New Zealand (also members of an FTA) are competitive economies and that there were significant gains from trade. It is questionable whether the developing country members of a large number of RTAs can be characterized as competitive economies. Typically, members of developing country RTAs have a narrow range of exports of goods and services, invariably primary commodities that are exported to industrial countries often under unilateral preferential arrangements. Therefore, there is little scope for efficiency gains.
Economies whose structure of production is not competitive tend to be complementary and both benefit and lose from RTAs. Complementarity exists when members of RTAs produce commodities or products that do not compete much with the local production of other RTA members. Traditional integration theory contends that, in the case of complementary economies, economic integration will have the usual trade diversion and trade creation effects; the higher the barriers to trade with nonmembers, the higher the risk of trade diversion. Intuitively, one can argue that complementarity exists between developed and developing country members in an RTA (that is, North/South RTAs). Trade between industrial countries and many developing countries is often characterized as trade in homogeneous products, for example, wheat for textiles. In this case, each country will have a comparative advantage in the export of a different type of goods, while all goods will be consumed by all member countries. The proposed regional economic partnership agreements that are part of the Cotonou Agreement between the EU and the member states of the Africa, Caribbean and Pacific (ACP) region might be characterized as RTAs between complementary economies.
The trading patterns of the EAC members indicate that trade linkages are relatively weak (Table 2). Therefore, one cannot really characterize the economies as either complementary or competitive. Khandelwal (2004) developed estimates of bilateral product complementary indices16 in COMESA and SADC. The results indicate that, within COMESA, product complementarities between Kenya’s exports and the imports of the other member countries average 38.6. For all other countries, except Egypt, average product complementarity for exports is far lower. Another EAC member, Uganda, had an average of 19.8. The results reinforce the observation that the economies of the EAC are neither complementary nor competitive.
The Trade Simulation Model Partial equilibrium models are widely used to simulate and measure the effects of changes in trade policy. The models assess the effects of specific changes in tariffs or other trade taxes
16 The index is a measure of similarities between the export basket of one country and the import basket of another country. The value of the complementarity index can range from 0, which represents no complementarity between the exports and imports of two countries, to 100, which implies a perfect match. The higher the index between two countries, the greater the product complementarity.

- 15 -
on trade flows, revenue, prices, and some measures of welfare (consumer surplus) at a given point in time. Typically, a simulation model based on simple Vinerian customs union theory is employed. To gauge the likely effects of introducing the new EAC CET, including the removal of tariffs on imports from Tanzania and Uganda, that will lower external tariff rates, a static partial equilibrium methodology—SMART17 (see Appendix I)18—was employed. Notably, SMART, unlike some partial equilibrium models, assumes that products imported from different regions are imperfect substitutes for each other.19
The World Integrated Trade Solution (WITS) software developed by the World Bank was used to conduct the simulations.20 WITS utilizes the UN Statistics Division COMTRADE and the UNCTAD Trade Analysis and Information System (TRAINS) databases that provide access to data on trade flows21 and most-favored nation (MFN) tariff rates at the HS six-digit level of disaggregation. World Bank staff and the Kenya Revenue Authority provided information on the tariff preferences offered to COMESA partners and the negotiated CET. The SMART simulations were done using the WITS software.
The simulation results produced by SMART indicate that the move from the current MFN tariff rates to the three-band EAC CET is likely to have a positive impact on trade with an increase in trade of $193.5 million22 with trade creation estimated at $193.9 million and trade
17 SMART was jointly developed by the United Nations Conference on Trade and Development (UNCTAD) and the World Bank and has been widely used by negotiators of both bilateral and multilateral trade agreements.
18 SMART is a static partial equilibrium model operable under strict ceteris paribus conditions. It provides a snapshot of the projected impact of tariff reductions while disregarding any adjustment process accompanying this change. Thus, the dynamics that affect the change are not explicitly modeled, nor can complex variations in the setup be considered.
19 Some partial equilibrium models—e.g., Hoekman and others (2001)—assume products imported from different regions are perfect substitutes. In these models, the number of parameters to be estimated is smaller than in SMART. SMART provides baseline estimates of the elasticity of substitution of imports from different sources.
20 I am grateful to Olivier Jammes of the World Bank for helping me use WITS to conduct the simulations. In addition, Marcelo Olarreaga (World Bank) assisted in the derivation of the SMART equations for trade creation and trade diversion.
21 HS 1 (1996) nomenclature.
22 The EAC CET will significantly increase tariffs in Uganda and to some extent Tanzania and may not have a similar positive trade impact.

- 16 -
diversion at $0.3 million.23 Table 6 shows the impact on trade and the estimated trade-creating and trade-diverting trade flows for all products in each tariff band (i.e., 0 percent and 25 percent). The results reveal that 81.2 percent ($157.5 million) of trade-creating flows resulting from the move to the new EAC CET are accounted for by products that
Table 6. Trade Simulation Results
Item Total Trade Trade Trade Effect Diversion Creation
All product lines 193.54 -0.32 193.86Product lines at 0% 157.37 -0.12 157.49Product lines at 10% 45.28 -0.16 45.44Product lines at 25% -9.11 -0.04 -9.07
Source: Fund Staff Estimates attract a 0 percent tariff rate.24 Trade creation has a positive effect on welfare because consumers can purchase cheaper imports instead of more expensive local goods. However, it means import-competing producers will need to become more competitive or move into new product lines. These sectoral adjustments are the transitional or adjustment costs of lowering trade barriers. The move to the maximum tariff rate of the EAC CET results in trade creation estimated at $9.1 million. The model reports the results as negative trade creation, but this really reflects lower trade flows resulting from higher tariff rates. In other words, this means that the new EAC CET led to higher tariff rates for some of these product lines, and that with higher import prices, import flows declined.25 Further examination of the individual product tariff lines, revealed that many products that attracted a 15 percent MFN tariff rate now face the maximum tariff rate. Notably, some of these products—fish, pigs, other black tea, yeasts, pictures and designs, and steel products—are produced locally, hence there is a protectionist objective.
23 Note that the simulations are intended to analyze the effects on trade flows, and the results should not be used to make judgments about the potential impact on welfare.
24 A lot of these products are raw materials, capital goods, and to a lesser extent intermediate goods that moved from 5 percent and 10 percent to 0 percent.
25 This finding illustrates a weakness of static partial equilibrium because with higher tariff rates one would expect this would encourage regional producers to move into some of these product lines over time.

- 17 -
Another important feature of the results reported in Table 6 is the negligible trade diversion resulting from the new EAC CET. An important factor that might be affecting the quantitative results is that the baseline imports from Tanzania and Uganda reported in the official statistics significantly underestimate intraregional trade because of the prevalence of unrecorded informal cross-border trade. Mkenda (2001) cites surveys that indicated that in the 1994-95 period, unofficial cross-border trade between Kenya and Uganda was about 49 percent of official trade. Between Tanzania and Kenya, cross-border trade as a percentage of official trade in the 1995-96 period was about 12 percent, and between Tanzania and Uganda it was about 45 percent.
The simulation results provide preliminary evidence that the EAC customs union will have positive trade benefits for Kenya because the adoption of the EAC CET will lead to increased flows of cheaper extraregional imports that are likely to lower consumer prices with positive welfare effects. Note that in the simulation, the removal of internal tariffs was accompanied by a lowering of MFN tariffs with the adoption of the EAC CET. A World Bank (2000) study concluded that regional integration arrangements (RIAs) between developing countries (South-South RIAs) that provide preferential access to member states but keep external trade policy with respect to the rest-of-the-world unchanged are likely to lower welfare for the bloc as a whole. High external tariffs encourage trade diversion and provide strong incentives for inefficient firms to expand. Fundamentally, high external barriers negate the benefits from increased competition. Therefore, to ensure that an RTA does not encourage inefficiency, facilitate trade diversion, and ultimately reduce economic welfare, it is essential to lower MFN tariffs as barriers to intra-RTA trade are eliminated.26 Therefore, Kenya could continue to derive benefits from progressively lowering trade barriers, specifically the EAC CET.
Transitional Costs Despite the potential benefits from liberalization of the trade regime, there are costs that would have to be addressed. As noted earlier, trade creation means that the import-competing sectors would face increased competition and would need to make adjustments to improve efficiency and overall competitiveness. Consequently, there may be transitional output and employment losses associated with the EAC customs union. Policies would need to be put in place to minimize the dislocations caused by the lowering of tariffs. For import-competing sectors to respond to increased competition from cheaper imports, it is vital that Kenya, over the medium term, sustain the implementation of a comprehensive package of macroeconomic and structural reforms to improve efficiency and international competitiveness. This would include:
• strong governance policies to improve transparency and accountability and eliminate corruption;
• strengthening the efficiency of the financial system;
26 Such an approach has been characterized as a strategy of “open regionalism.”

- 18 -
• labor market reforms to increase labor market flexibility;
• an accelerated program of parastatal reform and privatization to increase efficiency and private sector involvement in the economy; and
• prudent fiscal policies to ensure that adequate resources are devoted to infrastructural development and improving the levels of education and health.
A poverty and social impact analysis (PSIA) of trade reforms is planned by the authorities and could provide the basis for programs to address these concerns. The customs union is expected to result in revenue losses. The SMART simulations estimated that the full implementation of the EAC CET in Kenya would result in customs revenue losses of US$113.3 million. An earlier analysis by the World Bank (2003) estimated the revenue losses from the proposed three-band structure(0,10,25) of approximately US$150 million for Kenya.27 The empirical evidence thus suggests there will be short-run revenue losses from the full implementation of the EAC customs union and policymakers have to design policy responses to recoup revenue losses. World Bank (2003) estimated that in Kenya customs exemptions amount to 22 percent of potential customs revenue, so to compensate for revenue losses, policymakers could streamline exemptions, widening the tax base and increasing revenues.
V. OTHER REASONS FOR EAST AFRICAN INTEGRATION
Trade integration is not the only reason that policymakers in Kenya might find regional integration in the East African region a desirable policy. Other factors are described below.
“Widening and deepening” of regional integration From a Kenyan perspective, some commentators see the recently established EAC customs union as providing an impetus to the COMESA customs union. Although Tanzania is not a member of COMESA,28 it is felt that the EAC group led by Kenya could set the EAC CET as the goal for the COMESA customs union and be the prime force in the negotiations. A wider COMESA customs union is attractive to Kenya because it provides a larger market to encourage the expansion of its manufactured or nontraditional exports to the region.
Another important factor might be the “Economic Partnership Agreements” (EPAs) that are to be negotiated between the European and sub-Saharan Africa countries.29 The Cotonou 27 World Bank (2003) estimated the revenue effects calculating a baseline using data on import flows, tariff schedules, excises, and VAT rates. The SMART simulations only used import flows and the tariff schedule for Kenya.
28 Tanzania has not publicly expressed its intention to join COMESA.
29 The Cotonou Agreement replaced the Lomé Convention after the latter expired in 2000. The agreement provides for the continuation of nonreciprocal trade preferences between the
(continued…)

- 19 -
Agreement provides for the negotiation of reciprocal trade agreements between various geographical configurations in sub-Saharan Africa and the EU covering trade in goods and services and some trade-related areas. Currently, the regional groupings identified to negotiate EPAs include COMESA. The EAC has not been identified as a regional grouping for the negotiations. However, if the EAC is able to drive the negotiations for a COMESA customs union, it could be an important partner in the negotiations with the EU. Potentially, this is the most important regional agreement Kenya will negotiate because it offers a favorable opportunity for sub-Saharan Africa countries to integrate into the global economy and to benefit from deeper integration with a developed region.30
Trade Facilitation and “Behind the Border” Reforms Small and/or poor developing countries can pursue enhanced trading arrangements including outside the framework of an RTA by deepening cooperation in trade facilitation and “behind the border” reforms. An important question is whether more intensive regional cooperation in trade-related areas such as trade facilitation and “behind the border” reforms—those areas include sanitary and phyto-sanitary (SPS) standards, technical standards, investment code, competition law and intellectual property rights—is likely to expand trade and raise economic growth by increasing efficiency as well as private investment (domestic and foreign). Conceptually, adopting and implementing simple, transparent import and export regulations and efficient procedures for customs clearance will reduce transaction costs and enhance efficiency in EAC member countries and improve the environment for trade expansion. “Behind the border” reforms are increasingly an important part of the international trade architecture and of growing importance in the multilateral trade negotiations in the WTO. These reforms place great demands on a country’s human resource and institutional capacity, and it seems intuitive that regional approaches will be beneficial for sub-Saharan Africa countries with limited human resources and weak administrative capacity.
Public Goods Schiff (2000) argued that regional cooperation on public goods—such as water basins (lakes, rivers), infrastructure (roads, railways, dams), the environment, hydroelectric and other sources of energy, and fisheries—can generate benefits for member states. In the case of the EAC member states there is a lot scope for cooperation in these areas and support can be received from the World Bank together with other multilateral, regional, and bilateral agencies.
EU and the African, Caribbean, and Pacific countries until 2008, when they will be replaced by EPAs to be negotiated between 2004-2007.
30 World Bank (2000) argued that RTAs between developed and developing countries were potentially the most developmentally advantageous for developing countries.

- 20 -
VI. CONCLUSIONS
Kenya, Tanzania, and Uganda have undertaken trade policy reforms that have consisted of liberalization of their trade regimes at both the regional and global levels. As they have promoted more open and liberal trade policies the three countries have simultaneously embarked upon a process to integrate their economies through the creation of the East African Community (EAC). The formation of the EAC customs union is an important step in the process of deepening regional integration. Generally, RTAs between competitive and/or complementary economies have resulted in positive static and dynamic benefits for the participating countries. However, many RTAs between developing countries are not between economies that have these characteristics, and the results have been disappointing. The trade linkages among the three EAC member states are not strong. However, the establishment of the EAC customs union and the introduction of the EAC CET do seem to have potentially positive benefits for Kenya. The results from a SMART trade simulation model suggest that the EAC CET, by lowering tariffs, has a positive impact on trade largely from trade creation. Lower tariffs result in lower import prices and increased flows of cheaper imports that improve consumer welfare.
The preliminary evidence from the simulations supports the pursuit of more liberal trade policies. However, there are transitional costs that must be addressed to minimize economic dislocation, including revenue losses. Furthermore, trade creation means the import-competing sectors will face increased competition from cheaper imports, and producers will have to improve efficiency and competitiveness. Sustained macroeconomic and structural reforms will be needed to ensure that a favorable enabling environment is created that will facilitate internationally competitive production.
There are other factors beyond trade integration that Kenyan policymakers may consider in pursuing closer East African integration. These include, first, the widening and deepening of regional integration with other countries in the Eastern and Southern African region through COMESA and the negotiation of an EPA between COMESA and the EU, with its centerpiece being a comprehensive regional trade agreement. Second, regional cooperation in trade facilitation and “behind the border” reforms offer potential benefits to Kenya. Improvements in trade facilitation can improve transparency, reduce the costs of doing business, and promote trade. Regional cooperation in implementing “behind the borders” reforms, which are an increasingly important part of the architecture of the international trading system, can improve efficiency and facilitate trade in goods and services. Finally, regional cooperation in public goods can, among other things, lower the cost of infrastructural development, promoting growth and development.

- 21 - APPENDIX I
THE SMART SIMULATION MODEL
The simplest version of SMART and its definition of trade creation and trade diversion is presented below.
A. Simplest Version
Assumptions: 1) Partial Equilibrium: no income effects 2) Armington Assumption: HS 6 digit goods imported from different countries are
imperfect substitutes, that is, bananas from Ecuador are an imperfect substitute for bananas from Saint Lucia.
3) Export supplies are perfectly elastic: world prices of each variety (for example, bananas from Ecuador) are given.
Analytical setup One possible analytical setup for the demand structure in SMART is to assume a two-stage budgeting procedure (where income is kept exogenous). A better alternative is to assume a quasi-linear an additive utility function that is also additive on a composite numéraire good. More formally:
( ) nmuUg
gg += ∑ (1)
where n is the consumption of the composite numéraire good, gm is the consumption of the aggregate import good g (aggregate in the sense that it is a function of imports of good g from different countries); and gu is the sub-utility function of good g. The fact that the utility function is additive ensures that there are not substitution effects across goods g, and the linearity on the composite and numéraire good n ensures that there are no income effects. Maximization of (1) subject to a budget constraint yields:
( )cg
c g
dcg
dcg
dcgcg
mpyn
cgppfm
,,
,,, ,,;
∑∑−=
∀= ≠
(2)
where cgm , are imports of good g from country c, dcgp , is the domestic price of imported good
g from country c, dcgp ≠, is the domestic price of good g imported from all countries other than
c, and y is national income. Thus consumption of the composite and numéraire good, n absorbs all income effects. Domestic prices are given by:

- 22 - APPENDIX I
( )cgw
cgd
cg tpp ,,, 1+= (3) where w
cgp , is the world price of good g imported from c, cgt , is the tariff imposed on imports of good g imported from c, and is defined as:
( )cgMFNgcg tt ,, 1 θ−= (4)
where MFN
gt is the most-favored-nation (MFN) tariff imposed on good g, and cg ,θ is the tariff preference ratio on good g when imported from country c.31 Trade creation Trade creation is defined as the direct increase in imports following a reduction on the tariff imposed on good g from country c. To obtain this, SMART uses the definition of price elasticity of import demand:
0,,
,,, <= d
cgd
cg
cgcgcg pdp
mdmε (5)
Solving (5) for cgdm , we obtain the trade creation ( cgTC , ) evaluated at world prices and associated with the tariff reduction on good g when imported from country c:32
dcg
dcg
cgcgw
cgcgw
cgcg pdp
mpdmpTC,
,,,,,,, ε== (6)
Note that using (3), we have cg
wcg
dcg dtpdp ,,, = . Substituting this and (3) into (6) yields:
( ) ( )cg
cgcgcg
cg
cgcgcg
wcgcg
wcgcg t
dtm
tdt
mpdmpTC,
,,,
,
,,,,,,, 11 +
=+
== εε (7)
Equation (7) defines the extent of trade creation on imports of good g from country c.
31 By (4), MFN
gcgcg tt ,, 1−=θ .
32 Recall that world prices are assumed to be fixed given the assumption of perfectly elastic export supplies in every country c for every good g.

- 23 - APPENDIX I
Note that in the last equality we simply choose units of all goods so that the world prices are equal to 1. One can then interpret cgm , as import value of good g from country c measured at world prices. This normalization of units is undertaken from now on in order to simplify the expressions, so that cgm , represents both imported quantities and value of good g from country c. As long as world prices are kept exogenous( that is., export supply functions are perfectly elastic), this normalization has no implications for the derivations above and below.
To obtain the overall level of trade creation across goods or countries, one simply needs to sum equation (7) along the relevant dimensions:
∑∑
∑
∑
=
=
=
g ccg
gcgc
ccgg
TCTC
TCTC
TCTC
,
,
,
(8)
Trade diversion If the tariff reduction on good g from country c is a preferential tariff reduction (i.e., it does not apply to other countries, c≠ , then imports from country), then imports of good g from country c are further going to increase due to the substitution away from imports of good g from other countries that becomes relatively more expensive. This is the definition of trade diversion in the SMART model. In order to measure trade diversion, let us use the definition of the elasticity of substitution, ( )ccg ≠,,σ across imports of good g from country c and all other countries ( c≠ ):
0
,
,
,
,
,
,
,
,
,, <
⎟⎟⎠
⎞⎜⎜⎝
⎛
⎟⎟⎠
⎞⎜⎜⎝
⎛
=
≠≠
≠≠≠
dcg
dcg
dcg
dcg
cg
cg
cg
cg
ccg
pp
pp
d
mm
mm
d
σ (9)

- 24 - APPENDIX I
Note that:
( )( )( )
( ) ( )cg
cg
cgw
cg
cgw
cg
cgw
cg
cgw
cg
cgw
cg
cgw
cg
dcg
dcg
dcg
dcg
tdt
tpdtp
tptptp
dtp
pp
pp
d,
,
,,
,,
,,
,,
,,
,,
,
,
,
,
11111
+=
+=
+
+
+=⎟
⎟⎠
⎞⎜⎜⎝
⎛
≠≠
≠≠
≠≠
(10)
Recalling that by definition of trade diversion cgcg dmdm ≠−= ,, , we have:
( )2
,
,,,2
,
,,
,
,
,
,
cg
cgcgcg
cg
cgcg
cg
cg
cg
cg
m
mmdm
m
dmmmdm
mm
d≠
≠
≠
≠
≠≠
+=−=⎟
⎟⎠
⎞⎜⎜⎝
⎛ (11)
Substituting (11) and (10) into (9) and solving for cgdm , yields the expression for trade diversion, cgTD , :
ccgcg
cg
cgcg
cgcgcgcg t
dtmm
mmdmTD ≠
≠
≠
++== ,,
,
,
,,
,,,, 1
σ (12)
B. Constraining Trade Diversion
There is one additional problem associated with the measurement of trade diversion. Indeed, by definition of trade diversion it cannot be larger than the original imports of good g from other countries c≠ , i.e., cgcgcgcg mdmdmTD ≠≠ ≤−== ,,,, . A simple way of introducing this constraint is to defined trade diversion as follows:
⎪⎩
⎪⎨
⎧
>−
≤−++=−==
≠≠≠
≠≠≠≠
≠
≠
cgcgcg
cgcgccgcg
cg
cgcg
cgcg
cgcgcg
mdmm
mdmt
dtmm
mm
dmdmTD
,,,
,,,,,
,
,,
,,
,,,
if
if 1
σ (13)
So the constraint is binding only when it is necessary. An alternative to the simple constraint in (13) is the one currently used by SMART. It introduces the constraint for all observations independently of whether the constraint is binding or not. This is done by transforming (12), so that cgmdmTD cgcgcg ,,,,, ∀≤= ≠ :

- 25 - APPENDIX I
⎥⎥⎦
⎤
⎢⎢⎣
⎡
+++
+=−==
≠≠
≠≠
≠
ccgcg
cgcgcgcg
ccgcg
cgcgcg
cgcgcg
tdt
mmm
tdt
mmdmdmTD
,,,
,,,,
,,,
,,,
,,,
1
1
σ
σ (14)
By adding the term in (14) the term in square brackets to equation (12), SMART constraints trade diversion to be equal to cgm ≠, when the term in square brackets (the change in tariffs multiplied by the change in relative prices and the elasticity of substitution) tends to infinity (or minus infinity). Indeed:
cgcg
tdt
m
mTDccg
cg
cgcg
≠−∞→
⎥⎥⎦
⎤
⎢⎢⎣
⎡
+
=≠
,,
1 ,,,
,,
limσ
(15)
Equation (14) is clearly an underestimation of the trade diversion effect (we add a positive term to the denominator), whenever the term in squared brackets does not tend to infinity (e.g., for small tariff changes). More problematic is the fact that the terms in square brackets cannot tend to infinity unless either imports from c ( )cgm , or the elasticity of substitution are initially infinitely large. In which there is either no reason to worry about trade diversion or we are in a world with perfectly homogeneous goods in which case the constraint is always binding. Under more reasonable assumptions, the term in squared brackets can only tend to
ccgcg
cgcg t
tm ≠+
− ,,,
,, 1
σ as cgdt , tends to cgt ,− when the tariff on good g from country c is
eliminated. It is then not clear to which value the trade diversion term tends to, apart from the fact that it is clearly an underestimation of the true trade diversion for most values. For these reasons, we suggest the use of (13) rather than (14) to measure trade diversion. Again the expression in (13) or (14) could be added across different dimensions (goods, countries or both) to obtain total trade diversion terms as we did for trade creation in equation (8). Finally, the total increase in exports of good g from country c associated with a preferential tariff granted to good g originating in country c is given by the sum of the trade diversion and trade creation terms.

- 26 -
REFERENCES
DeRosa, D; Obwona, M and Roningen, V., 2003, “The New EAC Customs Union: Implications for Trade, Industry Competitiveness, and economic Welfare in East Africa” (USAID, Washington D.C.).
Khandelwal, P., 2004, “COMESA and SADC: Prospects and Challenges for Regional Integration” (Draft Working Paper, IMF, Washington D.C.).
Ng’eno, N.,2002, “The Status of Regional Trade Liberalization in East Africa” (African Centre for Economic Growth; Nairobi).
Mkenda, B., 2001, “Is East Africa an Optimum Currency Area” (Working papers in Economics no. 41, Department of Economics, Goteborg University).
Panagariya, A., 2000, “Preferential Trade Liberalization: The Traditional Theory and New Developments,” Journal of Economic Literature, Vol. XXXVIII (June), pp.287–331.
Schiff, L., 1999, “Will the Real ‘Natural Trading Partner’ Please Stand Up?” World Bank
Policy Research Working Paper No. 2161 (Washington, D.C.: World Bank). Schiff, L., 2000, “Regional Integration and Development in Small States” (Development
Research Group; World Bank, Washington D.C.) Viner, J., 1950, The Customs Union Issue (New York: Carnegie Endowment for International
Peace).
Venables, A., 2000, “Winners and Losers From Regional Integration Agreements” (Center for Economic Policy Research; London, UK).
Wonnacott, P., and M. Lutz, 1989, “ Is There a Case for Free Trade Areas?” in Free Trade
Areas and U.S. Trade Policy, ed. by Jeffrey Schott (Washington, DC: Institute for International Economics).
World Bank (2003). “Regional Trade Integration in East Africa—Trade and Revenue.