trade performance hs - tpic€¦ · benchmarking national and sectoral trade performance trade...
TRANSCRIPT

TECHNICAL NOTES
TRADE COMPETITIVENESS MAP
Benchmarking national and sectoral trade performance
TRADE PERFORMANCE HS
Market Analysis and Research
Division of Market Development
International Trade Centre

ITC‟s Market Analysis and Research – TP HS Technical Notes
International Trade Centre (ITC) i
Table of Contents
11.. SSuummmmaarryy .......................................................................................................... 2
22.. IInnttrroodduuccttiioonn ...................................................................................................... 2
33.. MMoottiivvaattiioonn ffoorr ddeevveellooppiinngg tthhee TTrraaddee PPeerrffoorrmmaannccee HHSS ................................. 4
44.. DDaattaa uusseedd .......................................................................................................... 5
55.. CCoonntteenntt ooff tthhee TTPP HHSS ....................................................................................... 8
66.. DDeessccrriippttiioonn ooff iinnddiiccaattoorrss ................................................................................. 8
EXPORTS IN VALUE ................................................................................................................................... 9
EXPORTS AS SHARE OF TOTAL EXPORTS (%) .................................................................................... 11
EXPORTS AS SHARE OF WORLD EXPORTS (%) .................................................................................. 13
GROWTH OF EXPORTS IN VALUE (% P.A.) ........................................................................................... 15
GROWTH OF EXPORTS IN VOLUME (% P.A.) ........................................................................................ 17
GROWTH OF WORLD EXPORTS IN VALUE (% P.A.) ............................................................................. 19
GROWTH OF WORLD EXPORTS IN VOLUME (% P.A.) .......................................................................... 21
GROWTH OF SHARE IN WORLD EXPORTS (% P.A.) ............................................................................ 23
NUMBER OF EXPORTED PRODUCTS .................................................................................................... 25
SHARE OF TOP 3 EXPORTED PRODUCTS (%) ..................................................................................... 27
SHARE OF TOP 3 EXPORT MARKETS (%) ............................................................................................. 31
NET TRADE ............................................................................................................................................... 33
SPECIALISATION (Balassa Index / RCA Index) ........................................................................................ 35
SPECIALISATION (Lafay Index) ................................................................................................................ 37

ITC‟s Market Analysis and Research – TP HS Technical Notes
International Trade Centre (ITC) 2
11.. SSuummmmaarryy
The International Trade Centre (ITC) developed the Trade Performance HS within
the Trade Competitiveness Map with the aim of assessing and monitoring the multi-
faceted dimensions of export competitiveness by industry and by county.
At present, the TP HS covers basically all member countries of the United Nations
and 99 product categories grouped in 21 different export industries. With this
module, the user can investigate the level of competitiveness and diversification of
a particular export industry using comparisons with other countries. In particular, it
brings out comparative advantages/disadvantages in world market and sheds light
on the factors causing these situations.
For each country and each industry, the TP HS provides several indicators that
show the static and dynamic picture of exports in the world markets. Moreover, for
ease of analysis, the user can chose the favourite currency and unit of measure
among those available.
22.. IInnttrroodduuccttiioonn
The trade performance of individual countries tends to be a good indicator of
economic performance since well performing countries tend to record higher rates
of GDP growth. The majority of developing countries have joined the World Trade
Organization (WTO) and have taken initiatives aimed at opening their economies.
Nevertheless, the outcome has not always been systematically positive with export
performance sometimes remaining disappointing. It is difficult to establish an all-
embracing definition of successful trade performance.
Trade champions contrast with certain specialised exporters that suffer from
deterioration in their terms of trade. For example, some developing countries record
high growth rates by specialising in niche markets and concentrating their export

ITC‟s Market Analysis and Research – TP HS Technical Notes
International Trade Centre (ITC) 3
markets, while other developing countries record more moderate rates of growth
with a well diversified array of products and partner countries. In other cases,
successful performance is the result of a favourable product or market penetration
since the beginning. Successful performance can also be gauged in terms of a
country‟s ability to adapt its export profile to changing patterns of world demand.
The last approach is the most dynamic and demand-driven trade policy stance.
The Trade Performance HS (TP HS thereafter) designed by ITC aims to tackle the
complex and multidimensional nature of trade patterns. This index is computed
using the world‟s largest trade database, COMTRADE (of the United Nations
Statistics Division), covering around 180 countries1, where more than 95% of world
trade in 5,000 products is reported at the 6-digit level of the Harmonized System
(HS). Since COMTRADE captures around 95 % of world trade, the TP HS is
calculated not only for countries that report their own trade data, but also for over
one hundred primarily low-income countries that do not report national trade
statistics.
Given that such an amount of information would be overwhelming to the final user,
products are grouped into 21 industries. For each country and each industry, the TP
HS provides several indicators that show general trade profile and changes in
export competitiveness in recent years.
The rest of the paper covers the objectives, methodology and results of the TPI
framework.
1 In the case of non-reporting countries, the trade is reconstituted on the basis of partner country
statistics (mirror statistics). This approach does not capture trade among non-reporting countries

ITC‟s Market Analysis and Research – TP HS Technical Notes
International Trade Centre (ITC) 4
33.. MMoottiivvaattiioonn ffoorr ddeevveellooppiinngg tthhee TTrraaddee PPeerrffoorrmmaannccee
HHSS
Generally, trade performance is characterised by rough indicators, such as the level
of openness (total trade in goods and services divided by GDP) or growth of
exports over a given period (such as the World Bank‟s World Development
Indicators).
Recent research on the relationship between trade and growth suggests that
openness alone is not a sufficient criterion for determining high levels of growth.
Other factors, such as the type of product available, the level of market and
economic diversification, the positioning on quality ladders, are also significant in
explaining growth. In addition, it is important to determine the reasons for country
differences in export growth and to determine the redistributive process of market
shares among competitors.
Departing from the rough indicators referred to above, microeconomic and
generally qualitative indicators are used to characterise the competitiveness of
nations. In this light, the “Microeconomic index of competitiveness” (Porter and
Christensen, 1999), is based on the micro-foundations of a country‟s
competitiveness. Launched in 1998 as part of the Global Competitiveness Report,
this index is based on a survey of some 4,000 businessmen and government
officials in 58 countries, including OECD countries2. Regressing income per capita
on this index explains more than 80% of the variance of income in the sample. A
quantitative method was developed in order to complement the qualitative
approach, which may be criticised on the ground of being limited to a small number
of developing countries.
It appears that the relative position of a country or product on the international
market, and its development over time, is a good indicator of competitiveness.
Trade statistics capture these changes. Trade statistics have the advantage of
being available for a substantial number of countries. For those countries which do
2 Indicators range from the overall infrastructure quality to administrative infrastructure, information
infrastructure, capital availability, human resources etc.

ITC‟s Market Analysis and Research – TP HS Technical Notes
International Trade Centre (ITC) 5
not report trade statistics, their trade profile can be (partially) completed by using
mirror statistics. Lastly, trade data is broken down at the industry and product
levels, which provides a disaggregated insight into trade performances.
On this basis, developing countries can be ranked according to their trade
performance, based on various criteria. A ranking can be provided by country,
sector, or a combination of different criteria.
It must be stressed that the performance of individual countries cannot be
determined on the basis of a restricted sample of countries or products. The
derivation of the relative export performance is achieved by including a significant
number of countries, together with a detailed product breakdown.
44.. DDaattaa uusseedd
The raw trade data used for calculating the indicators are defined at the 6-digit level
of the Harmonized System, 1996 edition, which includes more than 5'000 product
items. The data are extracted from COMTRADE (http://comtrade.un.org), the
United Nations Commodity Trade Statistics Database, maintained by the Statistics
Division of the U.N.
Around 100 countries have reported their trade data systematically over the last five
years in the 1996 edition of the HS. For the other countries (around 90), we are
using mirror estimates, which are derived from partner countries‟ statistics. Since
COMTRADE captures around 95 % of world trade, mirror estimates usually give
fairly reliable results. See Box 1 for a description of problems encountered using
trade data.
In order to obtain more robust rankings of trade performance, we have only
considered, for each industry, countries whose exports are superior to US$ 1 million
for each year of the five-year period under review and whose total exports for the
same period are superior to US$ 25 million.

ITC‟s Market Analysis and Research – TP HS Technical Notes
International Trade Centre (ITC) 6
Box 1: Foreign Trade Statistics: what Users Should Take into Consideration
Foreign trade statistics provide a differentiated picture of trade flows among
countries. They are comprehensive in terms of product coverage (more than 5,000
products under the Harmonized System), geographical coverage (over 100
countries covering 95 per cent of world trade) and time series (data under the
Harmonized System are available for the last decade). Moreover, they are readily
available at moderate costs. This makes them an attractive source for market
research and the assessment of trade performance. Against this background, ITC
has developed a number of tools for international marketing and trade promotion,
based on trade statistics. The Trade Performance Index and Trade Maps are cases
in point. All of these tools strive to present trade statistics in an analytical and user
friendly format. Notwithstanding the attractiveness of this comprehensive source of
information, users should factor in the following weak points of foreign trade
statistics.
i) Trade data are never complete. Smuggling and non-reporting represent a serious
problem in a number of countries. In addition, trade statistics as any source of
information are not free of mistakes and omissions.
ii) Most countries include imports for re-exports and re-exports in their trade
statistics. A low income country may be an exporter of airplanes simply because its
national airline has sold second hand planes.
iii) According to international conventions for reporting trade statistics, the export
value refers to the total or contract value, which may, of course, be very different
from local value added for many processing activities. For instance, the local value
added remains below 20 per cent of the export value.
iv) Detailed trade statistics are available only for merchandise trade and not for
services, although the latter may account for a sizeable share of national exports.
v) Even at the lowest level of disaggregation, product groups in the trade
nomenclatures do not necessarily reflect trade names and often contain a wide
spread of different products. Moreover, the product nomenclature is sometimes
ITC‟s Market Analysis and Research – TP HS Technical Notes
International Trade Centre (ITC) 7
misleading. The labels of aggregated product groups are often very general and
provide at times only limited guidance on the leading items within the group of
products concerned.
vi) Exchange rates‟ fluctuations are not always properly recorded in international
trade statistics. Values are normally aggregated over the period of one year in local
currency and converted into US dollars.
vii) For countries that do not report trade data to the United Nations, ITC uses
partner country data, an approach referred to as mirror statistics. Mirror statistics
are a second best solution (better than having no data at all). At the same time,
they have a number of shortcomings when compared to the first best solution of
nationally reported data. First and foremost, they do not cover trade with other non-
reporting countries. As a result, mirror statistics hardly cover South trade. For an
assessment of intra African trade, for instance, mirror statistics are not a suitable
source of information. Second, there is the problem of transhipments, which may
hide the actual source of supply. Third, mirror statistics invert the reporting
standards by valuing exports in CIF terms (i.e. including transport cost and
insurance) and imports in FOB terms (excluding these items).
In view of the above shortcomings, trade statistics should never be the sole source
of insight but need to be complemented by other sources, and in particular cross-
checked by product specialists and industry insiders. Overall, ITC's experience
suggests that trade statistics represent a very useful source of information and a
valid point of departure for strategic market research, if analysed with a healthy mix
of scepticism and pragmatism vis-à-vis their strength and shortcomings.

ITC‟s Market Analysis and Research – TP HS Technical Notes
International Trade Centre (ITC) 8
55.. CCoonntteenntt ooff tthhee TTPP HHSS
For each country and each industry, the TP HS provides indicators on a country‟s
general trade profile, on an industry‟s competitiveness and on the evolution of a
country‟s/industry‟s position on the world market. Altogether, the TP HS consists of
14 quantitative indicators of trade performance. For ease of reference, these
indicators are presented in absolute terms, but the user can sort the result in order
to obtain a ranking among the countries/industries.
66.. DDeessccrriippttiioonn ooff iinnddiiccaattoorrss
This section examines the rationale and the calculation of each indicator entering in
the TP HS module for the export side. General profile indicators and change-related
indicators are surveyed respectively. All indicators are calculated for each of the HS
classification industry.
The following table summarizes the indicators of TP HS module.
GENERAL PROFILE
CHANGE RELATED (LAST 5-YEAR PERIOD)
Exports in value Growth of exports in value (% p.a.)
Exports as share of total exports (%) Growth of exports in volume (% p.a.)
Exports as share of world exports (%) Growth of world exports in volume (% p.a.)
Number of exported products Growth of world exports in value (% p.a.)
Share of top 3 exported products (%) Growth of share in world exports (% p.a.)
Share of top 3 export markets (%)
Net trade
Specialisation (Balassa index / RCA index)
Specialisation (Lafay index)

ITC‟s Market Analysis and Research – TP HS Technical Notes
International Trade Centre (ITC) 9
EXPORTS IN VALUE
• What does it tell us?
This index shows, for the selected industry, the value of total exports in the chosen year. High values indicate great importance in the national export portfolio.
Exports are given in FOB terms (free on board) if the country is a direct reporter to the United Nations‟ COMTRADE database, otherwise in CIF terms (cost, insurance, freight) as mirror statistics (based on the partners‟ declarations of imports) are used.
• Definition:
The sum of exports of a selected industry in the chosen year.
• Range of values:
Takes value between 0 and +∞, with higher values indicating greater importance of the industry under review.
Example: The above figure depicts the “Miscellaneous edible preparations” industry„s exports (value in thousand US$) for selected economies in a given year (t).
0
1,000,000
2,000,000
3,000,000
4,000,000
5,000,000
6,000,000EXPORTS IN VALUE

ITC‟s Market Analysis and Research – TP HS Technical Notes
International Trade Centre (ITC) 10
TECHNICAL NOTES
• Mathematical definition:
∑
where d is the country under study, i refers to a specific industry, j country‟s export destinations, and X are the exports.
• Data sources:
Trade data can be obtained from the ITC Trade Map and the United Nations Commodity Trade database (COMTRADE).
RANK COUNTRY EXPORTS IN VALUE
MIRROR EXPORT
1 United States of America 4,994,065 13 Spain 1,033,900 Yes
33 Indonesia 238,492 42 Argentina 130,765 54 Swaziland 83,997 Yes
65 Senegal 45,025
Sample calculation: The table above shows, for the industry under review, total exports data of some countries and their ranking on the world markets. The trade data is from ITC Trade Map. All of the data is in compatible units (thousands current US dollars).

ITC‟s Market Analysis and Research – TP HS Technical Notes
International Trade Centre (ITC) 11
SHARE IN NATIONAL EXPORTS (%)
• What does it tell us?
This indicator refers to the share of industry‟s exports in relation to total country exports; hence, it shows the importance of the industry under review in national exports, as well as in the national balance of trade.
• Definition:
The percentage ratio between total industry‟s exports to total country‟s exports.
• Range of values:
Takes value between 0 and 100 per cent, with higher values indicating greater importance of the industry under review in the selected country‟s export portfolio.
Example: The above figure depicts the exports‟ shares of some industries of Congo in relation to its total exports in a given year (t).
90.7
3.32 3.02 1.24 0
25
50
75
100
27 - Mineral fuels,oils, distillationproducts, etc
44 - Wood andarticles of wood,wood charcoal
26 - Ores, slagand ash
74 - Copper andarticles thereof
Exports as a share of total exports (%)
ITC‟s Market Analysis and Research – TP HS Technical Notes
International Trade Centre (ITC) 12
TECHNICAL NOTES
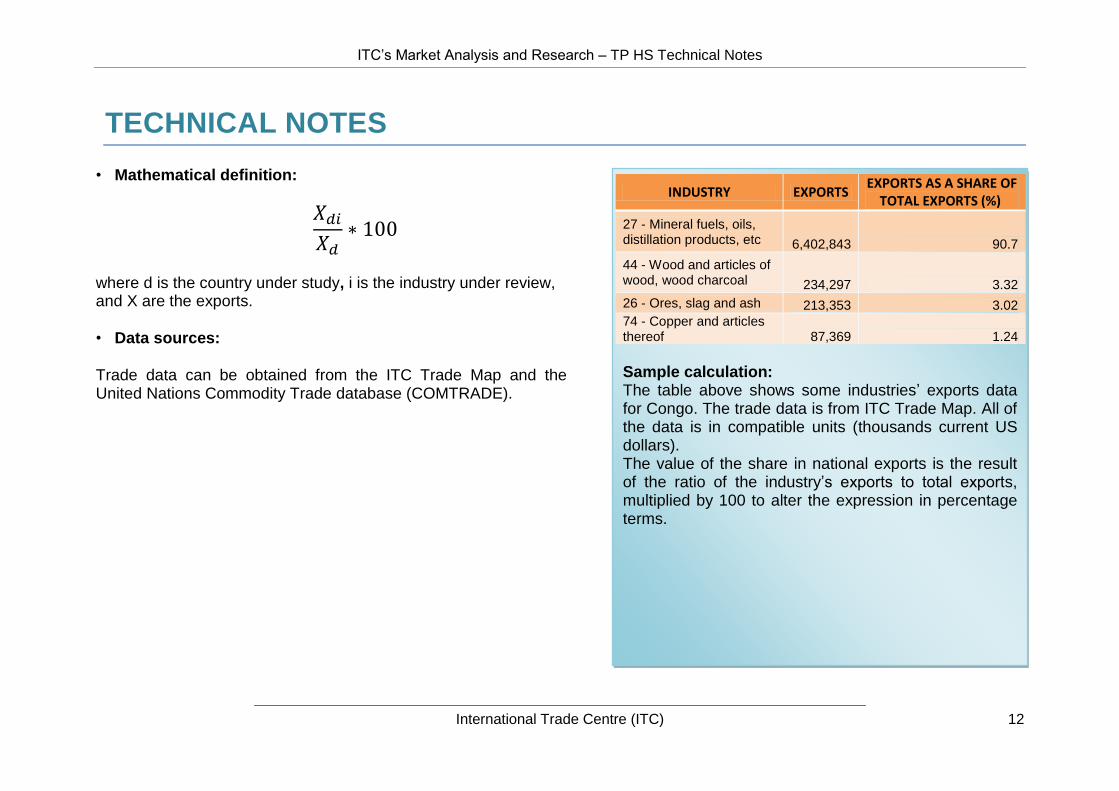
• Mathematical definition:
where d is the country under study, i is the industry under review, and X are the exports.
• Data sources:
Trade data can be obtained from the ITC Trade Map and the United Nations Commodity Trade database (COMTRADE).
INDUSTRY EXPORTS EXPORTS AS A SHARE OF
TOTAL EXPORTS (%)
27 - Mineral fuels, oils, distillation products, etc 6,402,843 90.7
44 - Wood and articles of wood, wood charcoal 234,297 3.32
26 - Ores, slag and ash 213,353 3.02
74 - Copper and articles thereof 87,369 1.24
Sample calculation: The table above shows some industries‟ exports data for Congo. The trade data is from ITC Trade Map. All of the data is in compatible units (thousands current US dollars). The value of the share in national exports is the result of the ratio of the industry‟s exports to total exports, multiplied by 100 to alter the expression in percentage terms.

ITC‟s Market Analysis and Research – TP HS Technical Notes
International Trade Centre (ITC) 13
EXPORTS IN WORLD EXPORTS (%)
• What does it tell us?
This indicator refers, for each industry, to the share of selected country‟s exports in relation to total world exports; hence, it indicates how important a specific national industry is in terms of global export and world‟s supply.
• Definition:
The percentage ratio between country‟s exports to total world‟s exports.
• Range of values:
Takes value between 0 and 100 per cent, with higher values indicating greater importance of the selected country in the world‟s supply.
• Strengths-limitations:
The more a country exports in a particular industry, the higher is its world market share. This indicator thus favours the biggest exporters, but introduces at the same time a bias towards large countries, as large countries tend to export more in absolute terms than smaller countries.
Example: The above figure depicts the world market shares of some Swedish industries in a given year (t).
6.94
4.53
2.92
1.69
0 2 4 6 8
48 Paper &paperboard, articlesof pulp, paper and
board
44 Wood andarticles of wood,wood charcoal
03 Fish,crustaceans,
molluscs, aquaticinvertebrates nes
32 Tanning, dyeingextracts, tannins,
derivs,pigments etc
Exports as a share of world exports (%)

ITC‟s Market Analysis and Research – TP HS Technical Notes
International Trade Centre (ITC) 14
TECHNICAL NOTES
• Mathematical definition:
where d is the country under study, i is the industry under review, w is the set of all exporting countries and X are the exports.
• Data sources:
Trade data can be obtained from the ITC Trade Map and the United Nations Commodity Trade database (COMTRADE).
INDUSTRY EXPORTS WORLD
EXPORTS
EXPORTS AS A SHARE OF
WORLD EXPORTS (%)
48 - Paper & paperboard, articles of pulp, paper and board 10,142,155 146,140,562 6.94
44 - Wood and articles of wood, wood charcoal 3,959,934 87,415,762 4.53
03 - Fish, crustaceans, molluscs, aquatic invertebrates nes 1,874,360 64,190,411 2.92
32 - Tanning, dyeing extracts, tannins, derivs,pigments etc 927,980 54,910,059 1.69
16 - Meat, fish and seafood food preparations nes 272,870 33,276,829 0.82
Sample calculation: The table above shows some industries‟ exports data for Sweden in a given year (t). The trade data is from ITC Trade Map. All of the data is in compatible units (thousands current US dollars). The value of the share in world exports is the result of the ratio of the industry‟s exports to total world exports, multiplied by 100 to alter the expression in percentage terms.

ITC‟s Market Analysis and Research – TP HS Technical Notes
International Trade Centre (ITC) 15
GROWTH OF EXPORTS IN VALUE (% P.A.)
• What does it tell us?
The export growth in value shows the development of industry‟s exports from time t0 time t (last five years). A positive value shows that the exports (in value) have increased: a positive growth rate suggests that the country under review is competitive on the world markets.
• Definition:
The weighted trend (compound growth rates) measures, for each industry, the annual percentage growth of exports in value over the most recent 5-year period.
• Range of values:
It takes values between -∞ and +∞ (per cent), with positive values indicating a positive trend.
• Strengths-limitations:
Example: The above figure shows the exports (in value) growth rate of some countries in the “Plastics and articles
thereof” industry in a given 5-year period ( , t).
2
-6
29
-5
53
-10 0 10 20 30 40 50 60
Belgium
Canada
Lithuania
Costa Rica
Yemen
Growth of exports invalue (% p.a.)

ITC‟s Market Analysis and Research – TP HS Technical Notes
International Trade Centre (ITC) 16
TECHNICAL NOTES
• Mathematical definition:
((
)
⁄
)
where t and t0 are respectively the last and the first years considered, d is the country under study, i is the industry under review, and X are the exports in value.
• Data sources:
Trade data can be obtained from the ITC Trade Map and the United Nations Commodity Trade database (COMTRADE).
COUNTRY EXPORTS IN
VALUE (t) GROWTH OF EXPORTS
IN VALUE (% p.a.)
Belgium 24,191,505 2
Canada 9,089,918 -6
Lithuania 1,036,799 29
Costa Rica 146,122 -5
Yemen 13,098 53
Sample calculation: The table above presents some countries‟ exports in value data for selected economies for the period under review. The trade data is from ITC Trade Map. All of the data is in compatible units (thousands current US dollars). The value of the exports growth is the result of the ratio of industry‟s exports in the last year of the period under analysis to the exports of the first year considered, normalised for a given factor, and multiplied by 100 to alter the expression in percentage terms.

ITC‟s Market Analysis and Research – TP HS Technical Notes
International Trade Centre (ITC) 17
GROWTH OF EXPORTS IN VOLUME (% P.A.)
• What does it tell us?
The export growth in volume shows the average annual percentage growth of export quantities over the last 5 years. A positive value shows that the exports (in volume) have increased.
• Definition:
The weighted trend (compound growth rates) measures, for each industry, the annual percentage growth of exports in volume over the most recent 5-year period.
• Range of values:
It takes values between -∞ and +∞ (per cent), with positive values indicating a positive trend.
• Strengths-limitations:
To avoid a misleading conclusion on a country‟s results in terms of competitiveness, the user should consider at the same time this index and the “growth of exports in value” since they are not linked: it is possible that an industry could increase exports in volume and, at the same time, decrease exports in value because of, for example, the prices dynamic.
Example: The above figure shows the exports (in volume) growth rate of some countries in the “Carpets and other textile
floor coverings” industry in a given 5-year period ( , t).
0
-2
9
1
12
10
6
-4
-5 0 5 10 15
GROWTH OF EXPORTS IN VOLUME
GROWTH OF EXPORTS IN VALUE

ITC‟s Market Analysis and Research – TP HS Technical Notes
International Trade Centre (ITC) 18
TECHNICAL NOTES
• Mathematical definition:
((
)
⁄
)
where t and 0 are respectively the last and the first years considered, d is the country under study, i is the industry under review, and X are the exports in volume.
• Data sources:
Trade data can be obtained from the ITC Trade Map and the United Nations Commodity Trade database (COMTRADE).
COUNTRY EXPORTS IN VALUE
GROWTH OF EXPORTS IN
VALUE (% p.a.)
GROWTH OF EXPORTS IN
VOLUME (% p.a.)
World 11,067,696 0 12
India 978,183 -2 10
Egypt 272,308 9 6
Switzerland 118,247 1 -4
Sample calculation: The table above presents some Countries‟ exports in volume data for selected economies in the period under review. The trade data is from ITC Trade Map. All of the data is in compatible units (thousands current US dollars). The value of the exports growth is the result of the ratio of the industry‟s exports in the last year of the period being reviewed to the exports of the first year considered, normalised for a given factor and multiplied by 100 to alter the expression in percentage terms.

ITC‟s Market Analysis and Research – TP HS Technical Notes
International Trade Centre (ITC) 19
GROWTH OF WORLD EXPORTS IN VALUE (% P.A.)
• What does it tell us?
This index shows the average annual percentage growth of world exports (in value) of the industry under review over the most recent 5-year period. A positive growth rate suggests that the industry under review is in expansion and has a particular future export potential.
• Definition:
The weighted trend (compound growth rates) measures, for each industry, the annual percentage growth of world‟s exports in value over the most recent 5-year period.
• Range of values:
It takes values between -∞ and +∞ (per cent), with positive values indicating a positive trend.
Example: The above figure shows the world exports (in value) growth rate of some industries in a given 5-year period
( , t).
20
7 5
-2
-6 -10
-5
0
5
10
15
20
25
89 Ships,boats and
other floatingstructures
36 Explosives,pyrotechnics,
matches,pyrophorics,
etc
03 Fish,crustaceans,
molluscs,aquatic
invertebratesnes
54 Manmadefilaments
51 Wool,animal hair,
horsehair yarnand fabric
thereof
Growth of world exports in value (% p.a.)
ITC‟s Market Analysis and Research – TP HS Technical Notes
International Trade Centre (ITC) 20
TECHNICAL NOTES
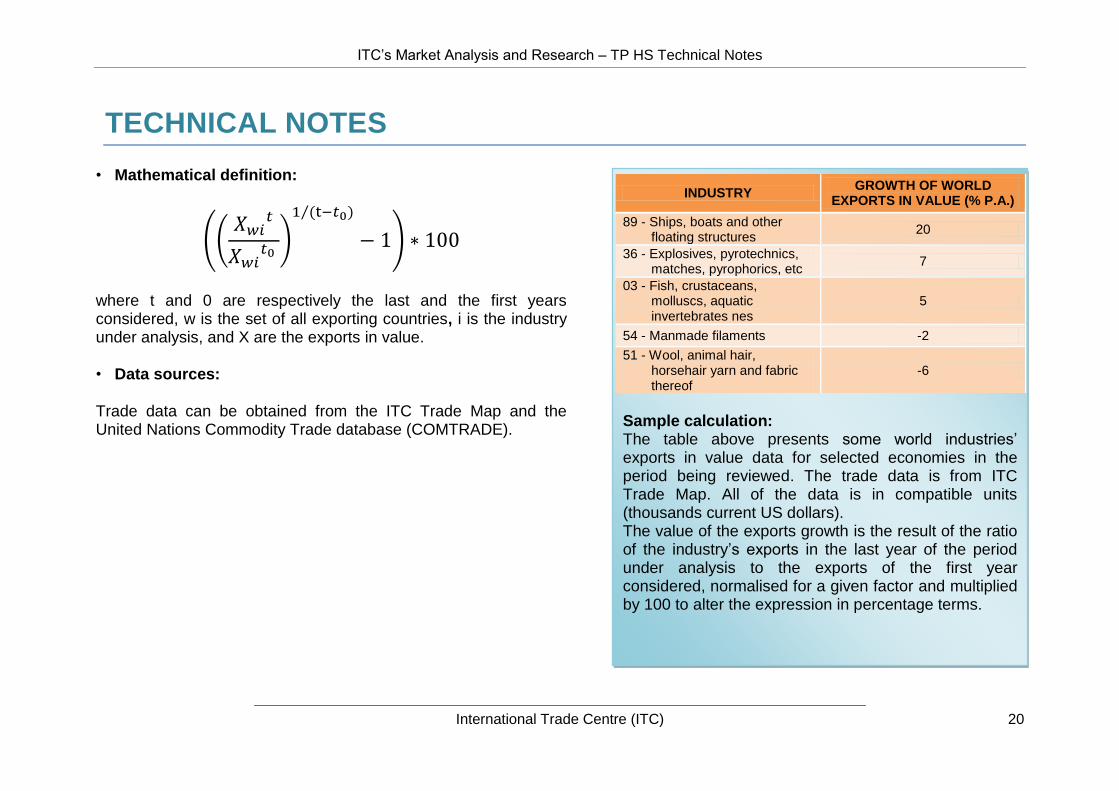
• Mathematical definition:
((
)
⁄
)
where t and 0 are respectively the last and the first years considered, w is the set of all exporting countries, i is the industry under analysis, and X are the exports in value.
• Data sources:
Trade data can be obtained from the ITC Trade Map and the United Nations Commodity Trade database (COMTRADE).
INDUSTRY GROWTH OF WORLD
EXPORTS IN VALUE (% P.A.)
89 - Ships, boats and other floating structures
20
36 - Explosives, pyrotechnics, matches, pyrophorics, etc
7
03 - Fish, crustaceans, molluscs, aquatic invertebrates nes
5
54 - Manmade filaments -2
51 - Wool, animal hair, horsehair yarn and fabric thereof
-6
Sample calculation: The table above presents some world industries‟ exports in value data for selected economies in the period being reviewed. The trade data is from ITC Trade Map. All of the data is in compatible units (thousands current US dollars). The value of the exports growth is the result of the ratio of the industry‟s exports in the last year of the period under analysis to the exports of the first year considered, normalised for a given factor and multiplied by 100 to alter the expression in percentage terms.

ITC‟s Market Analysis and Research – TP HS Technical Notes
International Trade Centre (ITC) 21
GROWTH OF WORLD EXPORTS IN VOLUME (% P.A.)
• What does it tell us?
This index shows the average annual percentage growth of world exports (in volume) of the industry under review over the last 5 years. A positive growth rate suggests that the industry being reviewed is in expansion because of an increase of the world demand.
• Definition:
The weighted trend (compound growth rates) measures, for each industry, the annual percentage growth of world‟s exports in volume over the most recent 5-year period.
• Range of values:
It takes values between -∞ and +∞ (per cent), with positive values indicating a positive trend.
• Strengths-limitations:
To avoid a misleading conclusion on a country‟s results in terms of competitiveness, the user should consider at the same time this index and the “growth of world exports in value”, since they are not linked: it is possible that an industry could increase world exports in volume and, at the same time, decrease exports in value because of, for example, the prices dynamic.
Example: The above figure shows the world exports (in volume)
growth rate of some industries in a given 5-year period ( , t).
18
7
2
-2
5
-3 -4
-7 -10
-5
0
5
10
15
20
12 - Oil seed,oleagic fruits,
grain, seed, fruit,etc, nes
73 - Articles ofiron or steel
69 - Ceramicproducts
87 - Vehiclesother than
railway, tramway
GROWTH OF WORLD EXPORTS IN VALUE (% p.a.)
GROWTH OF WORLD EXPORTS IN VOLUME (% p.a.)

ITC‟s Market Analysis and Research – TP HS Technical Notes
International Trade Centre (ITC) 22
TECHNICAL NOTES
• Mathematical definition:
((
)
⁄
)
where t and 0 are respectively the last and the first years considered, w is the set of all exporting countries, i is the industry under review, and X are the exports in volume.
• Data sources:
Trade data can be obtained from the ITC Trade Map and the United Nations Commodity Trade database (COMTRADE).
INDUSTRY GROWTH OF
WORLD EXPORTS IN VALUE (% p.a.)
GROWTH OF WORLD EXPORTS IN VOLUME (% p.a.)
12 - Oil seed, oleagic fruits, grain, seed, fruit, etc, nes
18 5
73 - Articles of iron or steel
7 -3
65 - Headgear and parts thereof
5 -5
69 - Ceramic products
2 -4
87 - Vehicles other than railway, tramway
-2 -7
Sample calculation: The table above shows some world industries‟ growth of exports rate for selected economies in the period under analysis. The value of the exports growth is the result of the ratio of the industry‟s exports in the last year of the period being reviewed to the exports of the first year considered, normalised for a given factor, and multiplied by 100 to alter the expression in percentage terms.

ITC‟s Market Analysis and Research – TP HS Technical Notes
International Trade Centre (ITC) 23
GROWTH OF SHARE IN WORLD EXPORTS (% P.A.)
• What does it tell us?
This indicator refers, for each industry, to the average annual percentage growth of the selected country‟s share in world exports over the most recent 5-year period. It allows us to assess the industry‟s competitiveness progress on the world market, and can also indicate long term comparative advantage (disadvantage).
• Definition:
The weighted trend (compound growth rates) measures the annual percentage growth of the selected country‟s share in world exports over the most recent 5-year period.
• Range of values:
It takes values between -∞ and +∞ (per cent), with positive values indicating a positive trend.
Example: The above figure shows the share in world exports growth rate of some countries for the “Milling products, malt, starches, ..., wheat gluten” industry in a given 5-year period
( , t). The red line indicates the world exports (in value) growth rate.
10
18
-5
18
14
-4
4
-19
4
-25
-20
-15
-10
-5
0
5
10
15
20
France Thailand South Africa Mexico World
Growth of exports in value (% p.a.)Growth of share in world exports (% p.a.)
ITC‟s Market Analysis and Research – TP HS Technical Notes
International Trade Centre (ITC) 24
TECHNICAL NOTES
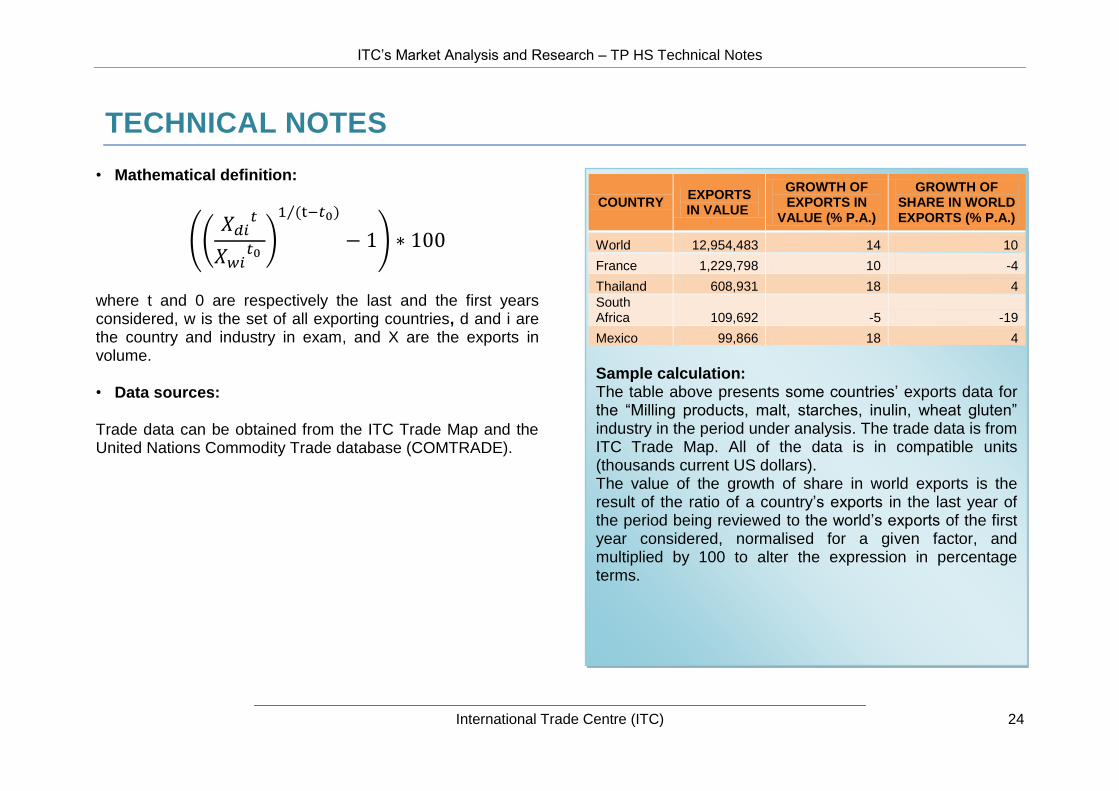
• Mathematical definition:
((
)
⁄
)
where t and 0 are respectively the last and the first years considered, w is the set of all exporting countries, d and i are the country and industry in exam, and X are the exports in volume.
• Data sources:
Trade data can be obtained from the ITC Trade Map and the United Nations Commodity Trade database (COMTRADE).
COUNTRY EXPORTS IN VALUE
GROWTH OF EXPORTS IN
VALUE (% P.A.)
GROWTH OF SHARE IN WORLD EXPORTS (% P.A.)
World 12,954,483 14 10
France 1,229,798 10 -4
Thailand 608,931 18 4
South Africa 109,692 -5 -19
Mexico 99,866 18 4
Sample calculation: The table above presents some countries‟ exports data for the “Milling products, malt, starches, inulin, wheat gluten” industry in the period under analysis. The trade data is from ITC Trade Map. All of the data is in compatible units (thousands current US dollars). The value of the growth of share in world exports is the result of the ratio of a country‟s exports in the last year of the period being reviewed to the world‟s exports of the first year considered, normalised for a given factor, and multiplied by 100 to alter the expression in percentage terms.

ITC‟s Market Analysis and Research – TP HS Technical Notes
International Trade Centre (ITC) 25
NUMBER OF EXPORTED PRODUCTS
• What does it tell us?
This index simply shows how many products within an industry are exported by the country under analysis. It indicates the product‟s variety (supply diversification) as well as the level of development of the industry.
• Definition:
Sum of different exported products‟ categories within a specific industry in the chosen year.
• Range of values:
Takes value between 0 and +∞, with higher values indicating greater products diversification, and hence importance of the industry being examined.
Example: The above figure shows the different sizes in supply (through the number of exported products) of some exporting industries of Philippines in a given year (t).
145
202
23
108
0
50
100
150
200
250
85 - Electrical,electronicequipment
84 - Boilers,machinery;
nuclear reactors,etc
74 - Copper andarticles thereof
62 - Articles ofapparel,
accessories, notknit or crochet
Number of exported products

ITC‟s Market Analysis and Research – TP HS Technical Notes
International Trade Centre (ITC) 26
TECHNICAL NOTES
• Mathematical definition:
where d is the country under study, i refers to a specific industry and P is the sum of the different products categories exported.
• Data sources:
Trade data can be obtained from the ITC Trade Map and the United Nations Commodity Trade database (COMTRADE).
INDUSTRY EXPORTS IN
VALUE
NUMBER OF EXPORTED PRODUCTS
85 - Electrical, electronic equipment 15,546,643 145
84 - Boilers, machinery; nuclear reactors, etc 8,683,450 202
74 - Copper and articles thereof 813,304 23
62 - Articles of apparel, accessories, not knit or crochet 802,819 108
Sample calculation: The table above shows exports data and the number of products exported of some exporting industries for the country under analysis. The trade data is from ITC Trade Map. All of the data is in compatible units (thousands current US dollars).

ITC‟s Market Analysis and Research – TP HS Technical Notes
International Trade Centre (ITC) 27
SHARE OF TOP 3 EXPORTED PRODUCTS (%)
• What does it tell us?
This index shows the share of the three most exported products within the selected industry in a specific year. It gives a simple picture of products‟ differentiation: high values indicate only some differentiation and variety of products‟ supply, hence high supply concentration (the country/industry exports a limited variety of products).
• Definition:
The ratio of the sum of the top 3 exported products‟ exports to total industry‟s exports (expressed in percentage).
• Range of values:
Takes value between 0 and 100 per cent, with lower values indicating greater products‟ differentiation.
Example: The above figure depicts the share of the top 3 exported products for different exporting industries of Sierra Leone in the chosen year (t).
95.9
85.9
53
42.1
0
20
40
60
80
100
71 - Pearls,precious stones,
metals, coins,etc
90 - Optical,photo, technical,
medical, etcapparatus
39 - Plastics andarticles thereof
62 - Articles ofapparel,
accessories, notknit or crochet
Share of top 3 exported products (%)

ITC‟s Market Analysis and Research – TP HS Technical Notes
International Trade Centre (ITC) 28
TECHNICAL NOTES
• Mathematical definition:
where refers to the top 3 exported product, i is the
industry being analysed and X are the exports.
• Data sources:
Trade data can be obtained from the ITC Trade Map and the United Nations Commodity Trade database (COMTRADE).
INDUSTRY EXPORTS IN VALUE
NUMBER OF EXPORTED PRODUCTS
SHARE OF TOP 3 EXPORTED
PRODUCTS (%)
71 - Pearls, precious stones, metals, coins, etc 71,098 16 95.9
90 - Optical, photo, technical, medical, etc apparatus 3,340 28 85.9
39 - Plastics and articles thereof 1,597 31 53
62 - Articles of apparel, accessories, not knit or crochet 604 43 42.1
Sample calculation: The table above shows some of Sierra Leone‟s industries‟ exports data, as well as the number of exported products in a given year (t) for each of those industries. The trade data is from ITC Trade Map. The value of the share of the top 3 exported products is the result of the ratio of the top 3 exported products‟ exports to total industry‟s exports, multiplied by 100 to alter the expression in percentage terms.

ITC‟s Market Analysis and Research – TP HS Technical Notes
International Trade Centre (ITC) 29
NUMBER OF EXPORT MARKETS
• What does it tell us?
This index simply shows how many products within an industry are exported by the country being reviewed. It indicates the product‟s variety (supply diversification) as well as the level of development of the industry.
• Definition:
Sum of the destination markets for a country‟s export in a given year.
• Range of values:
Takes value between 0 and +∞, with higher values indicating greater products‟ diversification, and hence greater importance of the industry under analysis.
Example: The above figure shows the supply‟s differentiation (through the number of destination markets) of some exporting countries for the “Animal origin, nes” industry in a given year (t).
252
89
65 77 70
0
50
100
150
200
250Number of exports markets
ITC‟s Market Analysis and Research – TP HS Technical Notes
International Trade Centre (ITC) 30
TECHNICAL NOTES
• Mathematical definition:
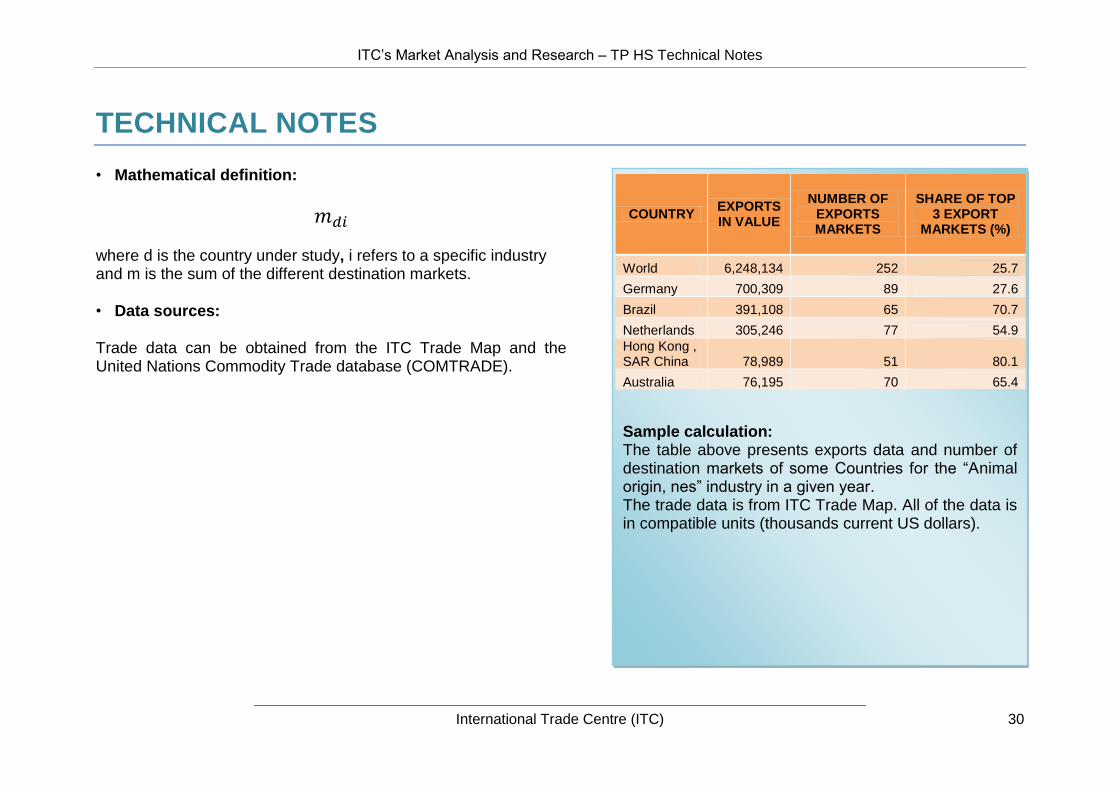
where d is the country under study, i refers to a specific industry and m is the sum of the different destination markets.
• Data sources:
Trade data can be obtained from the ITC Trade Map and the United Nations Commodity Trade database (COMTRADE).
COUNTRY EXPORTS IN VALUE
NUMBER OF EXPORTS MARKETS
SHARE OF TOP 3 EXPORT
MARKETS (%)
World 6,248,134 252 25.7
Germany 700,309 89 27.6
Brazil 391,108 65 70.7
Netherlands 305,246 77 54.9
Hong Kong , SAR China 78,989 51 80.1
Australia 76,195 70 65.4
Sample calculation: The table above presents exports data and number of destination markets of some Countries for the “Animal origin, nes” industry in a given year. The trade data is from ITC Trade Map. All of the data is in compatible units (thousands current US dollars).

ITC‟s Market Analysis and Research – TP HS Technical Notes
International Trade Centre (ITC) 31
SHARE OF TOP 3 EXPORT MARKETS (%)
• What does it tell us?
This index shows, for the country under review, the share of the top three export markets of each active industry. It gives a simple picture of destination markets‟ diversification, with high values indicating high supply‟s concentration as well as great importance of the top 3 markets for the country‟s exports.
• Definition:
The ratio of the sum of the top 3 destination markets‟ exports to total industry‟s exports (expressed in percentage).
• Range of values:
Takes value between 0 and 100 per cent, with lower values indicating greater destination markets‟ diversification.
Example: The above figure depicts the share of the top 3 destination markets for the exports of some Israeli industries in a given year (t).
51.3
85.4
97.5
36.1
0
20
40
60
80
100
120
85 Electrical,electronicequipment
30Pharmaceutical
products
88 Aircraft,spacecraft, and
parts thereof
29 Organicchemicals
Share of top 3 export markets (%)

ITC‟s Market Analysis and Research – TP HS Technical Notes
International Trade Centre (ITC) 32
TECHNICAL NOTES
• Mathematical definition:
where refers to the top 3 export markets, i is the industry
under review and X are the exports.
• Data sources:
Trade data can be obtained from the ITC Trade Map and the United Nations Commodity Trade database (COMTRADE).
INDUSTRY EXPORTS IN VALUE
SHARE OF TOP 3 EXPORT MARKETS (%)
85 - Electrical, electronic equipment 8,447,459 51.3
30 - Pharmaceutical products 4,524,284 85.4
88 - Aircraft, spacecraft, and parts thereof 1,757,689 97.5
29 - Organic chemicals 1,252,582 36.1
Sample calculation: The table above shows some of Israel‟s industries‟ exports data in a given year (t). The trade data is from ITC Trade Map. The value of the share of the top 3 export markets is the result of the ratio of the top 3 export markets‟ exports to total industries‟ exports, multiplied by 100 to alter the expression in percentage terms.

ITC‟s Market Analysis and Research – TP HS Technical Notes
International Trade Centre (ITC) 33
NET TRADE
• What does it tell us?
This index shows, for the selected industry, the balance of trade in the chosen year. A positive value indicates that the country exports more than it imports and that it has a surplus, while a negative value means that the country is a net importing country (imports being higher than exports).
• Definition:
The algebraic sum of exports less imports.
• Range of values:
Takes values between -∞ and +∞.
• Strengths-limitations:
Net exports eliminate re-exports, which would otherwise introduce a bias into the raw data. Hence, net exports provide a very simple but reliable correction for dealing with the globalisation of production processes and the induced vertical specialisation of countries at various stages of production.
For non-reporting countries, mirror estimates are used and net exports should be considered as indicative only.
Example: The above figure shows the balance of trade for the “Aluminium and articles thereof” industry of some countries in a given year (t).
-4,000,000
-3,000,000
-2,000,000
-1,000,000
0
1,000,000
2,000,000
Germany UnitedStates ofAmerica
Korea,Republic of
Oman Tajikistan
Net trade

ITC‟s Market Analysis and Research – TP HS Technical Notes
International Trade Centre (ITC) 34
TECHNICAL NOTES
• Mathematical definition:
where d is the country under study, i refers to a specific industry, X are the exports and M the imports.
• Data sources:
Trade data can be obtained from the ITC Trade Map and the United Nations Commodity Trade database (COMTRADE).
COUNTRY EXPORTS IN
VALUE IMPORTS IN
VALUE NET TRADE
Germany 12,081,563 10,352,230 1,729,333
United States of America 8,362,995 12,003,366 -3,640,371
Republic of Korea 1,453,035 2,446,602 -993,567
Oman 683,514 177,133 506,381
Tajikistan 416,435 13,104 403,331
Sample calculation: The table above shows some countries‟ exports and imports data in the “Aluminium and articles thereof” industry. The trade data is from ITC Trade Map. All of the data is in compatible units (thousands current US dollars). The value of the net exports is simply obtained by subtracting imports from exports.

ITC‟s Market Analysis and Research – TP HS Technical Notes
International Trade Centre (ITC) 35
SPECIALISATION (Balassa Index / RCA Index)
• What does it tell us?
This index helps the user identify industries where the targeted country has an obvious advantage in international competition. This is of special importance in order to promote trade of products that are more likely to be competitive.
• Definition:
The ratio of the industry‟s share in the country‟s exports relative to its share in world trade.
• Range of values:
Takes values between 0 and +∞. If it takes a value of more (less) than one, the country under review is (not) specialized in exporting selected industry‟s products.
• Strengths-limitations:
This index should be used in industries where trade is not distorted by export incentives and trade barriers, because they are likely to obscure whether a country has a real comparative advantage (disadvantage) in these goods.
Example: The above figure shows the Balassa index for the “Electrical, electronic equipment” industry of some countries in a given year (t). The red line indicates the level of specialisation on the world average. If a country exceeds this line, it means that its industry has competitive advantage on the world markets due to its specialization.
3.1
0.6
2.9
0.3 0.5
0
0.5
1
1.5
2
2.5
3
3.5
Hong Kong ,SAR China
France Philippines Belgium Turkey
Specialisation (Balassa Index)

ITC‟s Market Analysis and Research – TP HS Technical Notes
International Trade Centre (ITC) 36
TECHNICAL NOTES
• Mathematical definition:
⁄
where d is the country under study, w is the set of all exporting countries, i refers to a specific industry and X are the exports.
• Data sources:
Trade data can be obtained from the ITC Trade Map and the United Nations Commodity Trade database (COMTRADE).
COUNTRY EXPORTS IN
VALUE SPECIALISATION (BALASSA INDEX)
Hong Kong , SAR China 141,848,748 3.1
France 38,306,405 0.6
Philippines 15,546,643 2.9
Belgium 15,065,943 0.3
Turkey 6,650,125 0.5
Sample calculation: The table above shows some countries‟ exports data in the “Electrical, electronic equipment” industry. The trade data is from ITC Trade Map. All of the data is in compatible units (thousands current US dollars). The value of the Balassa Index is the result of the ratio of the share of national industry‟s exports in total national exports to the share of world industry‟s export in total world‟s exports.
ITC‟s Market Analysis and Research – TP HS Technical Notes
International Trade Centre (ITC) 37
SPECIALISATION (Lafay Index)
• What does it tell us?
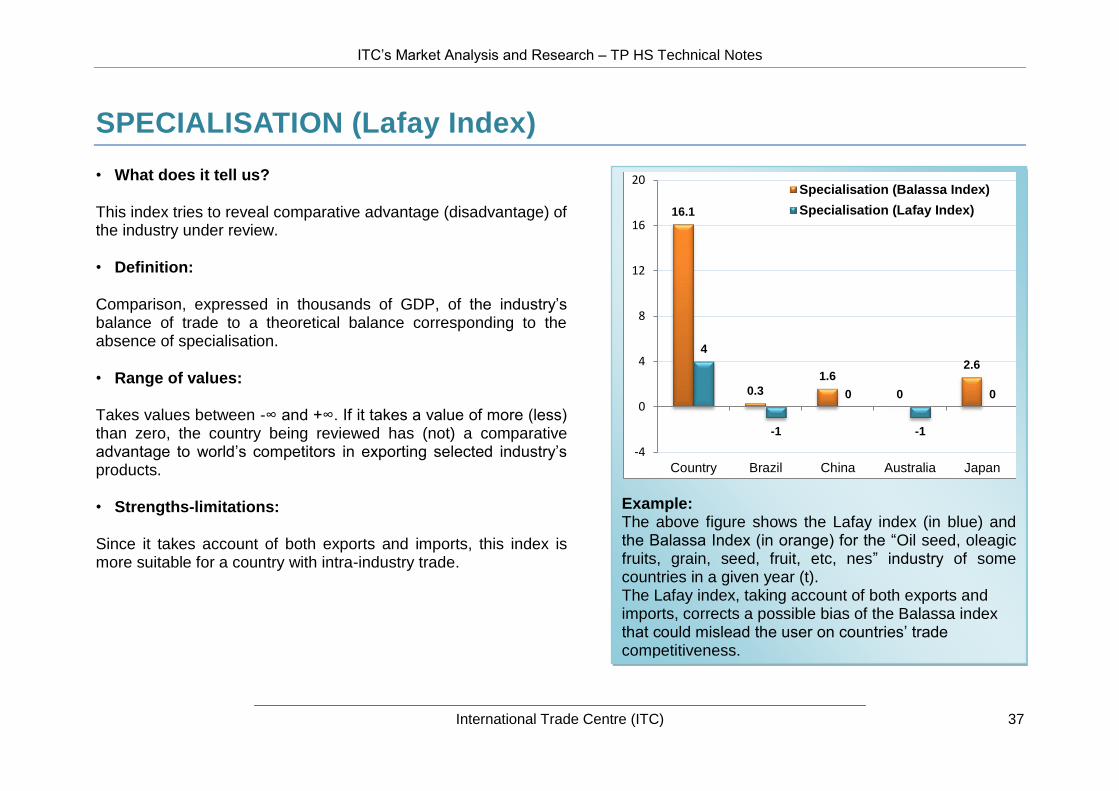
This index tries to reveal comparative advantage (disadvantage) of the industry under review.
• Definition:
Comparison, expressed in thousands of GDP, of the industry‟s balance of trade to a theoretical balance corresponding to the absence of specialisation.
• Range of values:
Takes values between -∞ and +∞. If it takes a value of more (less) than zero, the country being reviewed has (not) a comparative advantage to world‟s competitors in exporting selected industry‟s products.
• Strengths-limitations:
Since it takes account of both exports and imports, this index is more suitable for a country with intra-industry trade.
Example: The above figure shows the Lafay index (in blue) and the Balassa Index (in orange) for the “Oil seed, oleagic fruits, grain, seed, fruit, etc, nes” industry of some countries in a given year (t). The Lafay index, taking account of both exports and imports, corrects a possible bias of the Balassa index that could mislead the user on countries‟ trade competitiveness.
16.1
0.3
1.6
0
2.6
4
-1
0
-1
0
-4
0
4
8
12
16
20
Country Brazil China Australia Japan
Specialisation (Balassa Index)
Specialisation (Lafay Index)

ITC‟s Market Analysis and Research – TP HS Technical Notes
International Trade Centre (ITC) 38
TECHNICAL NOTES
• Mathematical definition:
[( ) (
) ]
where d is the country under study, i refers to a specific industry, X are the exports, M are the imports and K is a constant
K =
• Data sources: Trade data can be obtained from the ITC Trade Map and the
United Nations Commodity Trade database (COMTRADE).
COUNTRY
EXPORTS IN VALUE
SPECIALISATION (BALASSA INDEX)
SPECIALISATION (LAFAY INDEX)
Brazil 11,565,088 16.1 4
China 1,843,542 0.3 -1
Australia 1,159,188 1.6 0
Japan 120,262 0 -1
Sudan 76,315 2.6 0
Sample calculation: The table above shows some countries‟ exports data in the “Oil seed, oleagic fruits, grain, seed, fruit, etc, nes” industry. The trade data is from ITC Trade Map. All of the data is in compatible units (thousands current US dollars). The value of the Lafay index is the result of the expression next to this box.

ITC‟s Market Analysis and Research – TP HS Technical Notes
International Trade Centre (ITC) 39