trade performance review of the agricultural sector of
TRANSCRIPT
Trade Performance Review of the Agricultural sector of
South Africa: 2019
Author: Ms. Samkelisiwe Ngwenya
Enquiries: Department of Agriculture, Land Reform and Rural Development
Directorate: International Trade
Data Source: Global Trade Atlas

One Billion (Bn) = 1 000 000 000
Executive Summary
The purpose of this annual report is to inform sector stakeholders about the status of South
Africa’s import and export performance of agricultural products by analysing trade flows for
2019 compared to 2018.
Key observations on export performance in 2019 (variations 2018-2019):
South Africa’s exports of agricultural products increased by 2.2 % in value terms.
The total export value of agricultural products was R141.87 billion for the 2019
calendar year.
o South Africa’s total export value for primary agricultural products was R74.16
billion. (52.3% of total agricultural exports)
o The total export value for secondary Agricultural products was R67.71 billion.
(47.7% of agricultural exports)
Edible fruits and nuts (HS08) were South Africa’s largest product grouping export
category with a value of R49.42 billion. (36.2% of total agricultural export basket)
Exports of sugars and sugar confectionary (HS17) had the highest growth rate of
34.2% per annum from 2018 to 2019. (mostly weather dependant variations)
Netherlands was the largest export destination market; with an export value of R12.02
billion. The main products that were exported to the Netherlands were: fresh grapes,
fresh oranges and wine.
Among the top 10 destination markets identified, South Africa’s export growth of
agricultural products to China decreased by 11%. The three major products exported
to China were: wool, fresh or dried nuts and fresh oranges.
South Africa’s exports to Malaysia increased 89.6% p.a. in growth. The main exports
were: cane sugar, fresh apples and fresh oranges.
Key observations on imports in 2019 (variations 2018-2019)
South Africa’s imports of agricultural products increased by 6% p.a. in value terms.
South Africa’s total import value of agricultural products amounted to R90.98 billion for
the 2019 calendar year.
o South Africa’s total import value of primary agricultural products was R30.06
billion.(33% of total agricultural imports)
o The total import value for secondary agricultural products was R60.92 billion.
(67% of total agricultural imports)
Cereals (HS10) were South Africa’s largest import product grouping with a value of
R14.45 billion (15.9% share).
Imports of beverages, spirits and vinegar (HS22) had the highest annual import growth
rate of 24.9% p.a.
Argentina was the largest country supplier of agricultural products to South Africa, with
an imported value of R5.97 billion (6.6% of total the agricultural import basket). The
main products that were imported from Argentina were: soybean oilcake, maize corn,
other than seeds and sunflower seed or safflower oil.
Argentina also reported the highest annual import growth of 35.3% p.a.
One Billion (Bn) = 1 000 000 000
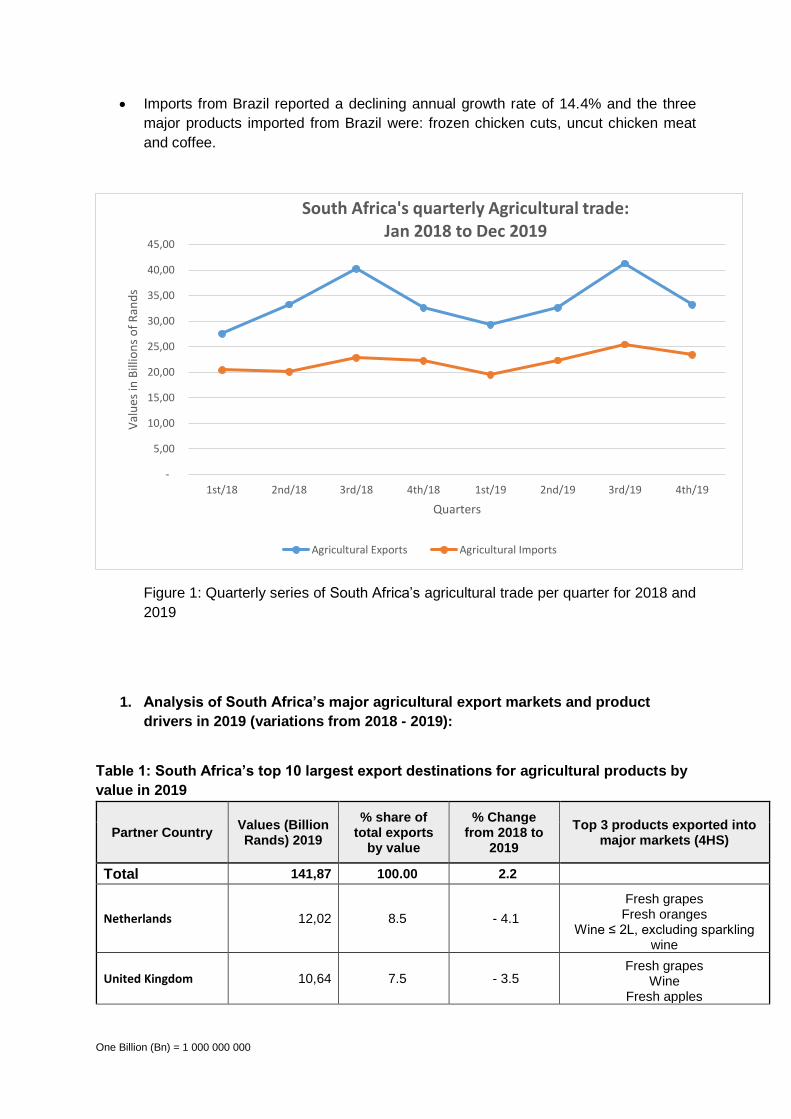
Imports from Brazil reported a declining annual growth rate of 14.4% and the three
major products imported from Brazil were: frozen chicken cuts, uncut chicken meat
and coffee.
Figure 1: Quarterly series of South Africa’s agricultural trade per quarter for 2018 and
2019
1. Analysis of South Africa’s major agricultural export markets and product
drivers in 2019 (variations from 2018 - 2019):
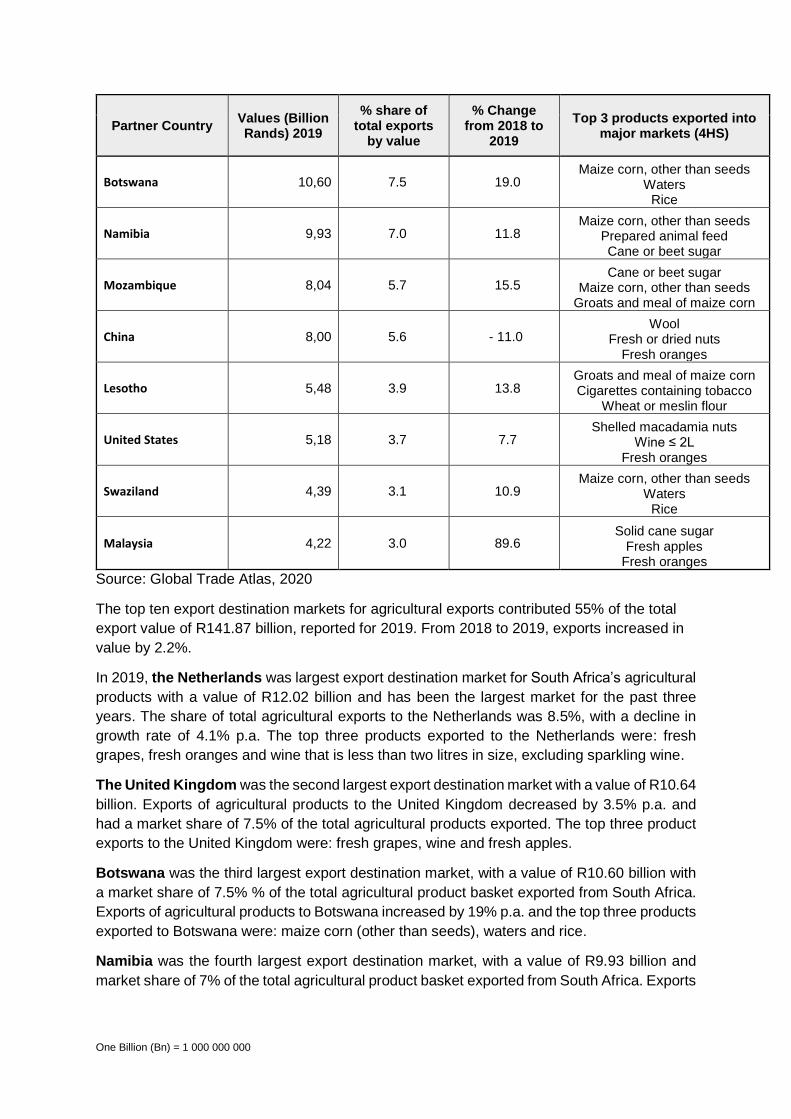
Table 1: South Africa’s top 10 largest export destinations for agricultural products by
value in 2019
Partner Country Values (Billion Rands) 2019
% share of total exports
by value
% Change from 2018 to
2019
Top 3 products exported into major markets (4HS)
Total 141,87 100.00 2.2
Netherlands 12,02 8.5 - 4.1
Fresh grapes Fresh oranges
Wine ≤ 2L, excluding sparkling wine
United Kingdom 10,64 7.5 - 3.5 Fresh grapes
Wine Fresh apples
-
5,00
10,00
15,00
20,00
25,00
30,00
35,00
40,00
45,00
1st/18 2nd/18 3rd/18 4th/18 1st/19 2nd/19 3rd/19 4th/19
Val
ues
in B
illio
ns
of
Ran
ds
Quarters
South Africa's quarterly Agricultural trade: Jan 2018 to Dec 2019
Agricultural Exports Agricultural Imports
One Billion (Bn) = 1 000 000 000
Partner Country Values (Billion Rands) 2019
% share of total exports
by value
% Change from 2018 to
2019
Top 3 products exported into major markets (4HS)
Botswana 10,60 7.5 19.0 Maize corn, other than seeds
Waters Rice
Namibia 9,93 7.0 11.8 Maize corn, other than seeds
Prepared animal feed Cane or beet sugar
Mozambique 8,04 5.7 15.5 Cane or beet sugar
Maize corn, other than seeds Groats and meal of maize corn
China 8,00 5.6 - 11.0 Wool
Fresh or dried nuts Fresh oranges
Lesotho 5,48 3.9 13.8 Groats and meal of maize corn Cigarettes containing tobacco
Wheat or meslin flour
United States 5,18 3.7 7.7 Shelled macadamia nuts
Wine ≤ 2L Fresh oranges
Swaziland 4,39 3.1 10.9 Maize corn, other than seeds
Waters Rice
Malaysia 4,22 3.0 89.6 Solid cane sugar
Fresh apples Fresh oranges
Source: Global Trade Atlas, 2020
The top ten export destination markets for agricultural exports contributed 55% of the total
export value of R141.87 billion, reported for 2019. From 2018 to 2019, exports increased in
value by 2.2%.
In 2019, the Netherlands was largest export destination market for South Africa’s agricultural
products with a value of R12.02 billion and has been the largest market for the past three
years. The share of total agricultural exports to the Netherlands was 8.5%, with a decline in
growth rate of 4.1% p.a. The top three products exported to the Netherlands were: fresh
grapes, fresh oranges and wine that is less than two litres in size, excluding sparkling wine.
The United Kingdom was the second largest export destination market with a value of R10.64
billion. Exports of agricultural products to the United Kingdom decreased by 3.5% p.a. and
had a market share of 7.5% of the total agricultural products exported. The top three product
exports to the United Kingdom were: fresh grapes, wine and fresh apples.
Botswana was the third largest export destination market, with a value of R10.60 billion with
a market share of 7.5% % of the total agricultural product basket exported from South Africa.
Exports of agricultural products to Botswana increased by 19% p.a. and the top three products
exported to Botswana were: maize corn (other than seeds), waters and rice.
Namibia was the fourth largest export destination market, with a value of R9.93 billion and
market share of 7% of the total agricultural product basket exported from South Africa. Exports

One Billion (Bn) = 1 000 000 000
from South Africa to Namibia increased by 11.8% per annum. The top three products exported
to Namibia were: maize corn (other than seeds), prepared animal feed and cane or beet sugar.
Mozambique reported the fifth largest export destination market for South Africa’s agricultural
products with a value of R8.04 billion, a share of 5.7% of the total agricultural exports. The
annual growth rate increased by 15.5% p.a. The top three products exported to Mozambique
were: cane or beet sugar, maize corn (other than seeds), groats and meals of maize corn.
1.1. Export market growth analysis during 2019 (variation 2018 – 2019)
Table 2: South Africa’s growing and declining agricultural export markets in 2019
Growing export markets during 2018/2019
Ranking Top 3
growing markets
Values (Billion Rands)
Export growth (%)
Top 3 products driving export growth and their individual growth percentage
1 India 1,55 91,8 Cane sugar (117,0%)
Wool (6,4%)
Fresh pears (1253,3%)
2 Malaysia 4,22 89,6 Cane sugar
(193,1%)
Fresh apples (17,4%)
Fresh oranges (21,1%)
3 Saudi Arabia 2,15 21,1 Fresh oranges
(0,6%)
Lemon and limes
(47,0%)
Lucerne meal and
pellets (46,8%)
Shrinking export markets during 2018/2019
Ranking Top 3
shrinking markets
Values (Billion Rands)
Export shrinkage
(%)
Top 3 products driving export shrinkage and their individual shrinkage percentage
1 Vietnam 1,24 - 60,9
In shell macadamia
nuts (- 50,3%)
Cotton (- 65.0%)
Frozen boneless meat of bovine
(- 18,3%)
2 Japan 1,96 - 21,1
Edible vegetable products (- 22,8%)
Fresh or dried
grapefruit (- 23,9%)
Inedible fish flours,
pellets and meals
(- 9,2%)
3 Zimbabwe 2,82 - 13,5
Animal feed preparations, excluding dog
or cat food (- 14,5%)
Soybean oil and
fractions (- 44,5%)
Sauces (- 30,2%)
Source: Global Trade Atlas, 2020
Table 2 shows growth and shrinkage from a selection of SA’s export destination markets with
a minimum export value that is greater than or equal to one billion Rand. South Africa’s export
of agricultural products to India, Malaysia and Saudi Arabia were the fastest growing markets

One Billion (Bn) = 1 000 000 000
in value terms. In 2019, exports of fresh pears and cane sugar to India had annual growth of
1253.3% and 117.0%, respectively. Export of cane sugar to Malaysia recorded an annual
growth rate of 193.3%. The table further shows a declining annual growth of exports to
Vietnam, Japan and Zimbabwe. The decline was mostly due to the exports of in shell
macadamia nuts and cotton from Vietnam, with a decline of 50.3% and 65.0% p.a.
respectively. Soybean oil and its fractions from Zimbabwe with declined with 44.5% p.a.
1.2. Export market analysis at product grouping level (HS2) in 2019 (variations
2018 – 2019)
Table 3: South Africa’s top 10 major agricultural product groupings by value in 2019
Sub-sector description
Exported value (Bill
Rands)
Sub-sector share in SA total
agriculture exports
(%)
Sub-sector growth
(%)
Top 3 products exported within the sub-
sector (4HS)
Top 3 export markets by value
HS08 Edible fruit and nuts
49,42
34,8 1,4
Fresh or dried citrus Fresh or dried grapes
Fresh apples, pears and quinces
Netherlands United Kingdom
China
HS22 Beverages, spirits and
vinegar
18,69
13,2 -0,3 Wine
Waters Ethyl alcohol
United Kingdom Namibia
Botswana
HS20 Prepared
vegetables, fruit and nuts
8,86
6,2 -0,4
Fruit or vegetable juices Prepared or preserved
fruit and nuts Prepared vegetables and
not frozen
Netherlands Botswana Namibia
HS17 Sugars and
sugar confectionary
8,55
6,0 34,2
Solid, pure sucrose cane or beet sugar
Sugar confection, excluding cocoa
Sugars and caramel
Malaysia Mozambique
Namibia
HS21 Miscellaneou
s edible preparations
6,47
4,6 8,4
Food preparations Sauces, mixed condiments and
seasonings and prepared mustard
Soups and broths
Mozambique Botswana Namibia
HS10 Cereals
5,79
4,1 -21,4 Maize corn
Rice Wheat and meslin
Botswana Namibia Eswatini
HS23 Food
industry residues and
prepared animal feed
4,29
3,0 1,5
Preparations used in animal feeding
Flours, meals and pellets of meat, not used for human consumption Soybean oilcake and
other residues
Namibia Botswana Eswatini
One Billion (Bn) = 1 000 000 000
Sub-sector description
Exported value (Bill
Rands)
Sub-sector share in SA total
agriculture exports
(%)
Sub-sector growth
(%)
Top 3 products exported within the sub-
sector (4HS)
Top 3 export markets by value
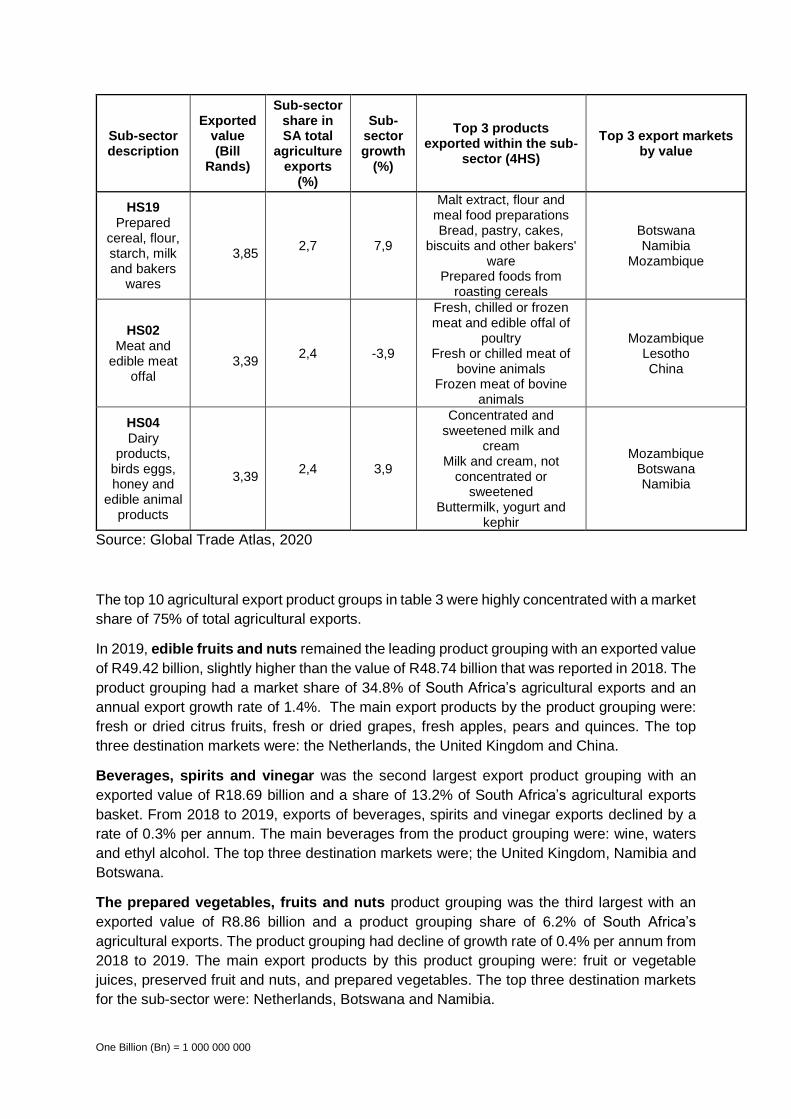
HS19 Prepared
cereal, flour, starch, milk and bakers
wares
3,85
2,7 7,9
Malt extract, flour and meal food preparations Bread, pastry, cakes,
biscuits and other bakers' ware
Prepared foods from roasting cereals
Botswana Namibia
Mozambique
HS02 Meat and
edible meat offal
3,39
2,4 -3,9
Fresh, chilled or frozen meat and edible offal of
poultry Fresh or chilled meat of
bovine animals Frozen meat of bovine
animals
Mozambique Lesotho China
HS04 Dairy
products, birds eggs, honey and
edible animal products
3,39
2,4 3,9
Concentrated and sweetened milk and
cream Milk and cream, not
concentrated or sweetened
Buttermilk, yogurt and kephir
Mozambique Botswana Namibia
Source: Global Trade Atlas, 2020
The top 10 agricultural export product groups in table 3 were highly concentrated with a market
share of 75% of total agricultural exports.
In 2019, edible fruits and nuts remained the leading product grouping with an exported value
of R49.42 billion, slightly higher than the value of R48.74 billion that was reported in 2018. The
product grouping had a market share of 34.8% of South Africa’s agricultural exports and an
annual export growth rate of 1.4%. The main export products by the product grouping were:
fresh or dried citrus fruits, fresh or dried grapes, fresh apples, pears and quinces. The top
three destination markets were: the Netherlands, the United Kingdom and China.
Beverages, spirits and vinegar was the second largest export product grouping with an
exported value of R18.69 billion and a share of 13.2% of South Africa’s agricultural exports
basket. From 2018 to 2019, exports of beverages, spirits and vinegar exports declined by a
rate of 0.3% per annum. The main beverages from the product grouping were: wine, waters
and ethyl alcohol. The top three destination markets were; the United Kingdom, Namibia and
Botswana.
The prepared vegetables, fruits and nuts product grouping was the third largest with an
exported value of R8.86 billion and a product grouping share of 6.2% of South Africa’s
agricultural exports. The product grouping had decline of growth rate of 0.4% per annum from
2018 to 2019. The main export products by this product grouping were: fruit or vegetable
juices, preserved fruit and nuts, and prepared vegetables. The top three destination markets
for the sub-sector were: Netherlands, Botswana and Namibia.
One Billion (Bn) = 1 000 000 000
Sugars and sugar confectionary products grouping was the fourth largest, with an exported
value of R8.55 billion and a share of 6.0% of South Africa’s agricultural exports. From 2018 to
2019, the value of exports of sugars increased by 34.2% per annum. The main export products
from this grouping were solid, pure sucrose cane or beet sugar, sugar confection, excluding
cocoa and sugars, not elsewhere specified or included (nesoi), and caramel. The three largest
destination markets were: Malaysia, Mozambique and Namibia.
The fifth largest exporting industry was miscellaneous edible preparations, with an exported
value of R6.47 billion and a product grouping share of 4.6% of South Africa’s total agricultural
exports basket. There was a positive export growth rate of 8.4% per annum between 2018
and 2019. The main products exported by the grouping were: food preparations, sauces,
mixed condiments and seasonings, and prepared mustard, soups and broths. The top market
destinations were: Mozambique, Botswana, and Namibia.
2. Analysis of South Africa’s major suppliers (imports) of agricultural products in
2019
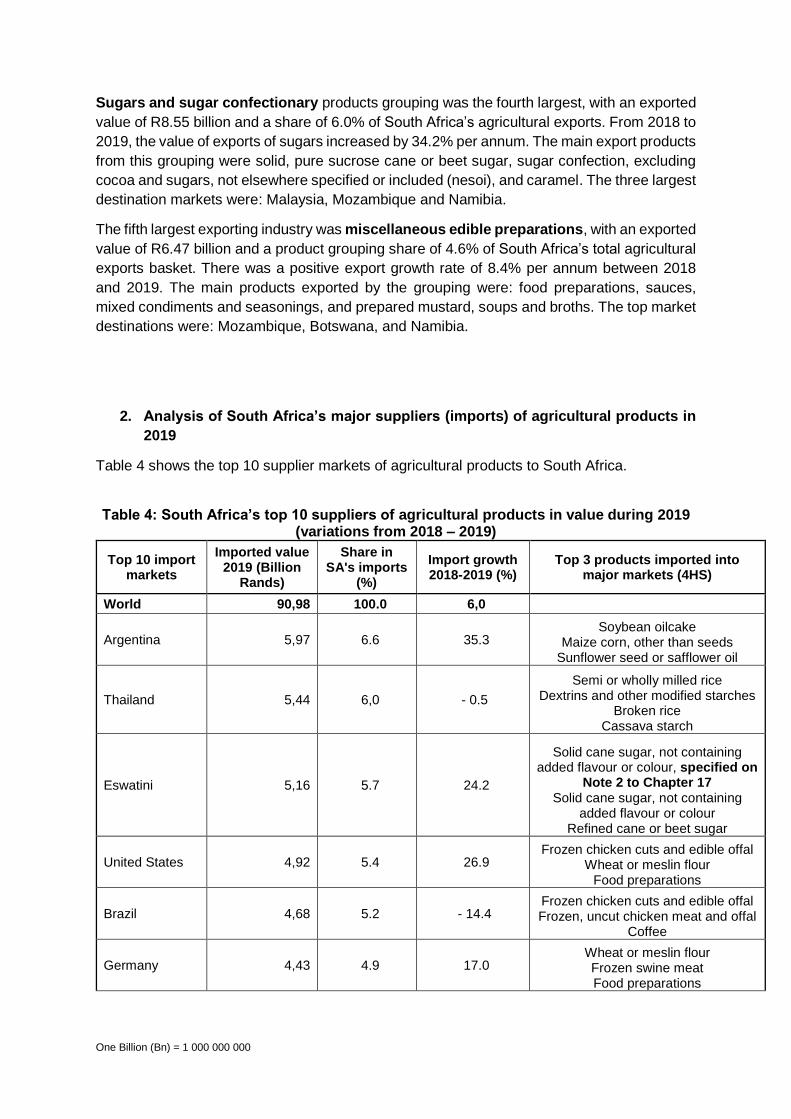
Table 4 shows the top 10 supplier markets of agricultural products to South Africa.
Table 4: South Africa’s top 10 suppliers of agricultural products in value during 2019 (variations from 2018 – 2019)
Top 10 import markets
Imported value 2019 (Billion
Rands)
Share in SA's imports
(%)
Import growth 2018-2019 (%)
Top 3 products imported into major markets (4HS)
World 90,98 100.0 6,0
Argentina 5,97 6.6 35.3 Soybean oilcake
Maize corn, other than seeds Sunflower seed or safflower oil
Thailand 5,44 6,0 - 0.5
Semi or wholly milled rice Dextrins and other modified starches
Broken rice Cassava starch
Eswatini 5,16 5.7 24.2
Solid cane sugar, not containing added flavour or colour, specified on
Note 2 to Chapter 17 Solid cane sugar, not containing
added flavour or colour Refined cane or beet sugar
United States 4,92 5.4 26.9 Frozen chicken cuts and edible offal
Wheat or meslin flour Food preparations
Brazil 4,68 5.2 - 14.4 Frozen chicken cuts and edible offal Frozen, uncut chicken meat and offal
Coffee
Germany 4,43 4.9 17.0 Wheat or meslin flour Frozen swine meat Food preparations
One Billion (Bn) = 1 000 000 000
Top 10 import markets
Imported value 2019 (Billion
Rands)
Share in SA's imports
(%)
Import growth 2018-2019 (%)
Top 3 products imported into major markets (4HS)
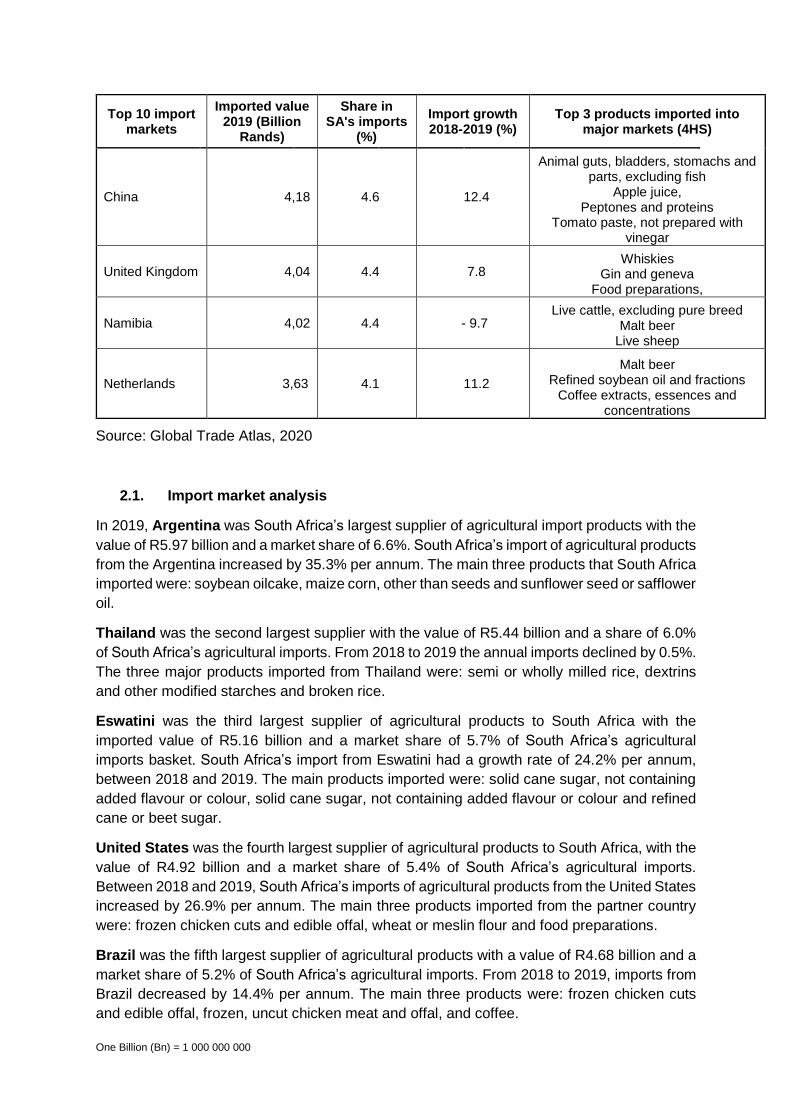
China 4,18 4.6 12.4
Animal guts, bladders, stomachs and parts, excluding fish
Apple juice, Peptones and proteins
Tomato paste, not prepared with vinegar
United Kingdom 4,04 4.4 7.8 Whiskies
Gin and geneva Food preparations,
Namibia 4,02 4.4 - 9.7 Live cattle, excluding pure breed
Malt beer Live sheep
Netherlands 3,63 4.1 11.2
Malt beer Refined soybean oil and fractions
Coffee extracts, essences and concentrations
Source: Global Trade Atlas, 2020
2.1. Import market analysis
In 2019, Argentina was South Africa’s largest supplier of agricultural import products with the
value of R5.97 billion and a market share of 6.6%. South Africa’s import of agricultural products
from the Argentina increased by 35.3% per annum. The main three products that South Africa
imported were: soybean oilcake, maize corn, other than seeds and sunflower seed or safflower
oil.
Thailand was the second largest supplier with the value of R5.44 billion and a share of 6.0%
of South Africa’s agricultural imports. From 2018 to 2019 the annual imports declined by 0.5%.
The three major products imported from Thailand were: semi or wholly milled rice, dextrins
and other modified starches and broken rice.
Eswatini was the third largest supplier of agricultural products to South Africa with the
imported value of R5.16 billion and a market share of 5.7% of South Africa’s agricultural
imports basket. South Africa’s import from Eswatini had a growth rate of 24.2% per annum,
between 2018 and 2019. The main products imported were: solid cane sugar, not containing
added flavour or colour, solid cane sugar, not containing added flavour or colour and refined
cane or beet sugar.
United States was the fourth largest supplier of agricultural products to South Africa, with the
value of R4.92 billion and a market share of 5.4% of South Africa’s agricultural imports.
Between 2018 and 2019, South Africa’s imports of agricultural products from the United States
increased by 26.9% per annum. The main three products imported from the partner country
were: frozen chicken cuts and edible offal, wheat or meslin flour and food preparations.
Brazil was the fifth largest supplier of agricultural products with a value of R4.68 billion and a
market share of 5.2% of South Africa’s agricultural imports. From 2018 to 2019, imports from
Brazil decreased by 14.4% per annum. The main three products were: frozen chicken cuts
and edible offal, frozen, uncut chicken meat and offal, and coffee.

One Billion (Bn) = 1 000 000 000
Table 5 below list growing and declining supplier markets of agricultural products. South
Africa’s import suppliers that had an import value greater or equal to one billion Rand was
listed. The top three growing import markets were: Mexico, Bulgaria and Poland. The top three
shrinking import markets were: Russia, Zimbabwe and Brazil.
Table 5: South Africa’s growing and declining suppliers (imports) of agricultural
products in 2019 (variations from 2018 – 2019)
Growing import markets
Ranking Top 3
growing markets
Values (Billion Rands)
Annual import
growth (%)
Top 3 products driving import growth and their individual growth percentage
1 Mexico 1.35 141,2 Malt beer (200,9%)
Cordials, Liqueurs,
Kirschwasser, ratafia, etc.
(34,8%)
Food preparations
(18,9%)
2 Bulgaria 1,31 67,8
Sunflower seed or
safflower oil (71,1%)
Refined sunflower seed or
safflower oil (118,8%)
Chocolate and other cocoa preparations
(108,5%)
3 Poland 1,81 51,3
Frozen chicken cuts and edible
offal (219,0%)
Food preparations
(10,2%)
Wheat and meslin
(67,9%)
Shrinking import markets
Ranking Top 3
shrinking markets
Values (Billion Rands)
Annual import
shrinkage (%)
Top 3 products driving import decline and their individual shrinkage percentage
1 Russia 1,46 - 37,5 Wheat and
meslin (- 38,5%)
Millet seed (- 48,3%)
Dried shelled peas
(- 45,3%)
2 Zimbabwe 1,22 - 26,8
Wholly or partly
stripped tobacco
(- 51,8%)
Cotton (- 15,8%)
Tobacco waste
(- 15,1%)
3 Brazil 4,68 - 14,4
Frozen chicken cuts and edible
offal (- 50,5%)
Wholly or partly stripped
tobacco (- 7,3%)
Frozen meat of swine (- 15,9%)
Source: Global Trade Atlas, 2020
In 2019, imports of malt beer from Mexico had annual import growth rate of 200.9%. Imports
of frozen chicken cuts and edible offal from Poland also hard high annual import growth rate
of 219.0%. Refined sunflower seed or safflower oil, and chocolate and other cocoa
preparations from Bulgaria had growth rates of 118.8% and 108.5%, respectively. Frozen

One Billion (Bn) = 1 000 000 000
chicken cuts and edible offal from Brazil and wholly or partly stripped tobacco from Zimbabwe
declined from 2018 and 2019.
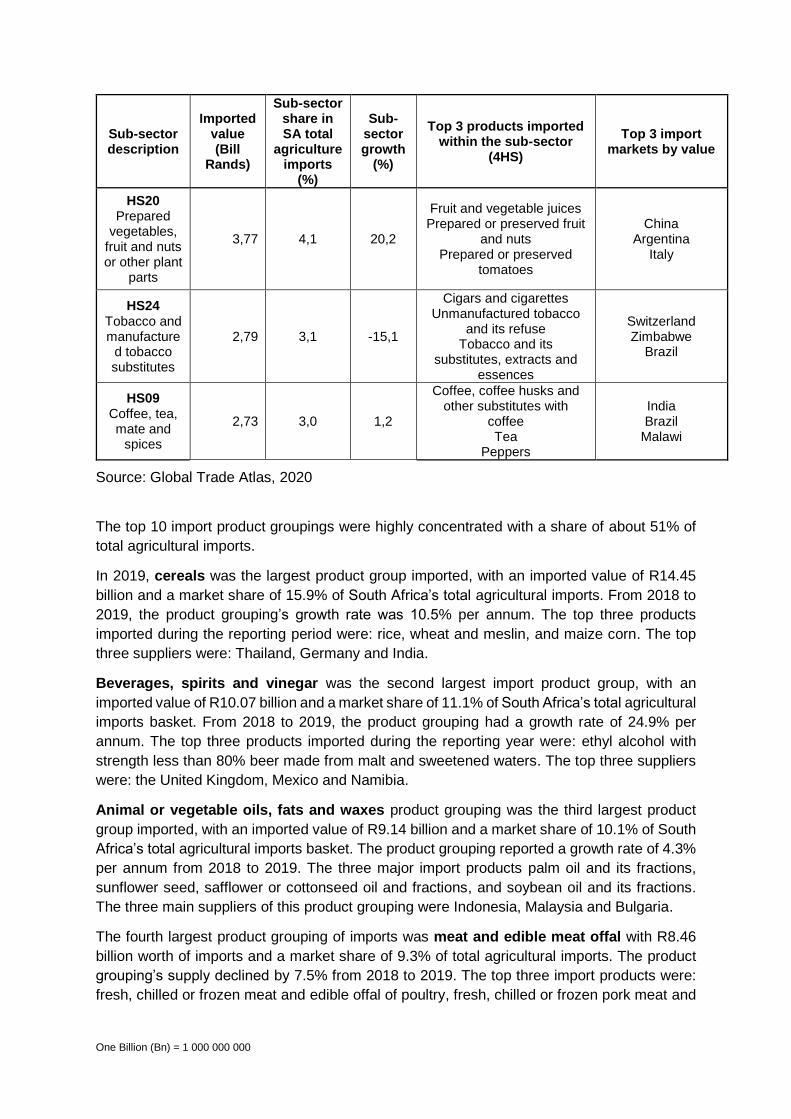
2.2. Imports analysis by product grouping level (HS2) during 2019
Table 6: South Africa’s top 10 major agricultural import product groupings by value
during 2019 (variations from 2018 – 2019)
Sub-sector description
Imported value (Bill
Rands)
Sub-sector share in SA total
agriculture imports
(%)
Sub-sector growth
(%)
Top 3 products imported within the sub-sector
(4HS)
Top 3 import markets by value
HS10 Cereals
14,45 15,9 10,5 Rice
Wheat and meslin Maize corn
Thailand Germany
India
HS22 Beverages, spirits and
vinegar
10,07 11,1 24,9 Ethyl alcohol <80%
Beer made from malt Sweetened waters
United Kingdom Mexico Namibia
HS15 Animal or vegetable
oils, fats and waxes
9,14 10,1 4,3
Palm oil and its fractions Sunflower seed, safflower
or cotton seed oil and fractions
Soybean oil and its fractions
Indonesia Malaysia Bulgaria
HS02 Meat and
edible meat offal
8,46 9,3 -7,5
Fresh, chilled or frozen meat and edible offal of
poultry Fresh, chilled or frozen
pork meat Edible offal of bovine,
sheep, goat, horse and swine
Brazil United States
Poland
HS17 Sugars and
sugar confectionary
6,43 7,1 11,7
Solid, pure sucrose cane or beet sugar
Sugar confection, excluding cocoa
Sugars and caramel
Eswatini China
Zambia
HS23 Food
industry residues and
prepared animal feed
5,46 6,0 0,3
Preparations used in animal feeding
Soybean oilcake and other solid residues
Oilcake from vegetable fats and oil
Argentina Netherlands
France
HS21 Miscellaneou
s edible preparations
4,87 5,4 5,9
Food preparations Extracts of coffee, tea and
mate Sauces, mixed condiments
and seasonings and prepared mustard
United States Netherlands
Germany
One Billion (Bn) = 1 000 000 000
Sub-sector description
Imported value (Bill
Rands)
Sub-sector share in SA total
agriculture imports
(%)
Sub-sector growth
(%)
Top 3 products imported within the sub-sector
(4HS)
Top 3 import markets by value
HS20 Prepared
vegetables, fruit and nuts or other plant
parts
3,77 4,1 20,2
Fruit and vegetable juices Prepared or preserved fruit
and nuts Prepared or preserved
tomatoes
China Argentina
Italy
HS24 Tobacco and manufacture
d tobacco substitutes
2,79 3,1 -15,1
Cigars and cigarettes Unmanufactured tobacco
and its refuse Tobacco and its
substitutes, extracts and essences
Switzerland Zimbabwe
Brazil
HS09 Coffee, tea, mate and
spices
2,73 3,0 1,2
Coffee, coffee husks and other substitutes with
coffee Tea
Peppers
India Brazil
Malawi
Source: Global Trade Atlas, 2020
The top 10 import product groupings were highly concentrated with a share of about 51% of
total agricultural imports.
In 2019, cereals was the largest product group imported, with an imported value of R14.45
billion and a market share of 15.9% of South Africa’s total agricultural imports. From 2018 to
2019, the product grouping’s growth rate was 10.5% per annum. The top three products
imported during the reporting period were: rice, wheat and meslin, and maize corn. The top
three suppliers were: Thailand, Germany and India.
Beverages, spirits and vinegar was the second largest import product group, with an
imported value of R10.07 billion and a market share of 11.1% of South Africa’s total agricultural
imports basket. From 2018 to 2019, the product grouping had a growth rate of 24.9% per
annum. The top three products imported during the reporting year were: ethyl alcohol with
strength less than 80% beer made from malt and sweetened waters. The top three suppliers
were: the United Kingdom, Mexico and Namibia.
Animal or vegetable oils, fats and waxes product grouping was the third largest product
group imported, with an imported value of R9.14 billion and a market share of 10.1% of South
Africa’s total agricultural imports basket. The product grouping reported a growth rate of 4.3%
per annum from 2018 to 2019. The three major import products palm oil and its fractions,
sunflower seed, safflower or cottonseed oil and fractions, and soybean oil and its fractions.
The three main suppliers of this product grouping were Indonesia, Malaysia and Bulgaria.
The fourth largest product grouping of imports was meat and edible meat offal with R8.46
billion worth of imports and a market share of 9.3% of total agricultural imports. The product
grouping’s supply declined by 7.5% from 2018 to 2019. The top three import products were:
fresh, chilled or frozen meat and edible offal of poultry, fresh, chilled or frozen pork meat and
One Billion (Bn) = 1 000 000 000
edible offal of bovine, sheep, goat, horse and swine. The top three supplier partners were:
Brazil, United States and Poland.
Sugars and sugar confectionary were the fifth largest product group imported, with a value
of R6.43 billion and a market share of 7.1% of South Africa’s total agricultural imports. The
product group’s imports increased by 11.7% per annum, from 2018 to 2019. The top three
products imported under this grouping were: solid, pure sucrose cane or beet sugar, sugar
confection, excluding cocoa, and sugars and caramel. The top three supplier partners were:
Eswatini, China and Zambia.