trade, smes and development in tunisia€“gafta –etc. itc 2015 trade policy in tunisia fact #1:...
TRANSCRIPT

Trade, SMEs and Development in Tunisia
Leila Baghdadi
University of Tunis
ITC 2015
Why Tunisia?
• Trade is good for both developing and developed countries – Empirical evidence from macro data
• Firms exposed to trade are performing well – More productive
– More profitable
– Create more jobs
• Recent empirical evidence on developed countries
• Less research on – Developing countries
– Importers
– Services
Motivation
ITC 2015

Why Tunisia?
• Impact of the exposure to international trade in Tunisia on – Trade creation
– Productivity
– Profitability
• Focus on – onshore non exporters and importers
– onshore exporters and non importers
– onshore exporters and importers
– offshore exporters and non importers
– offshore exporters and importers
• Use of an unique firm level data in Tunisia
Motivation
ITC 2015
Why Tunisia? • 1972: Creation of an offshore regime
• Mid eighties: – Unilateral tariff liberalization
– Reform of import procedures
– Removal of import restrictions
• WTO member since its creation
• Preferential trade agreements – EU
– GAFTA
– Etc.
Trade policy in Tunisia
ITC 2015
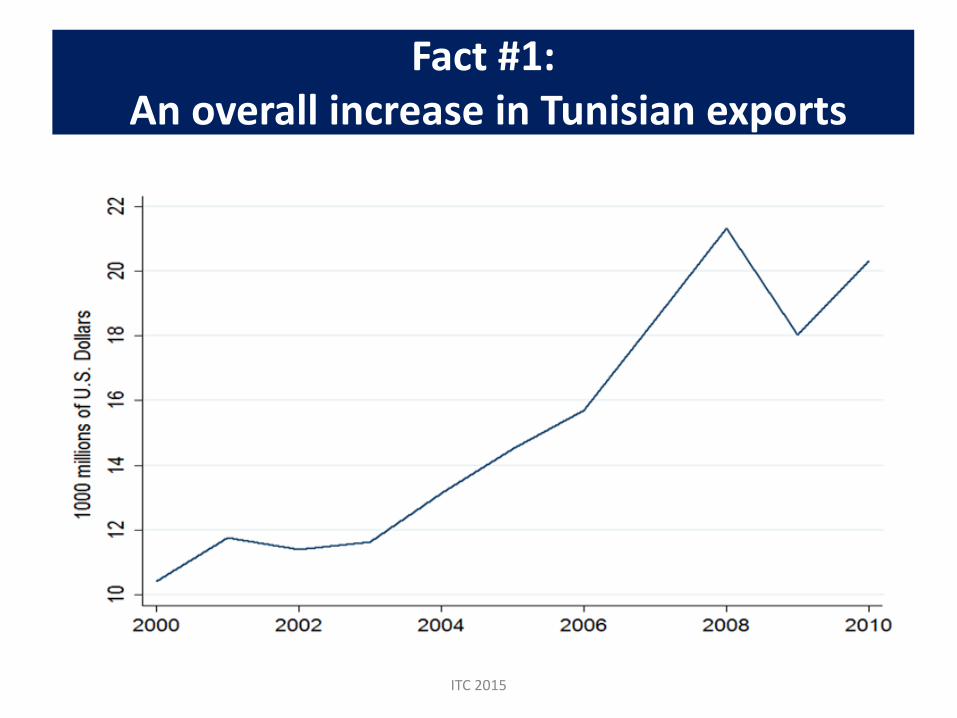
Fact #1: An overall increase in Tunisian exports
ITC 2015
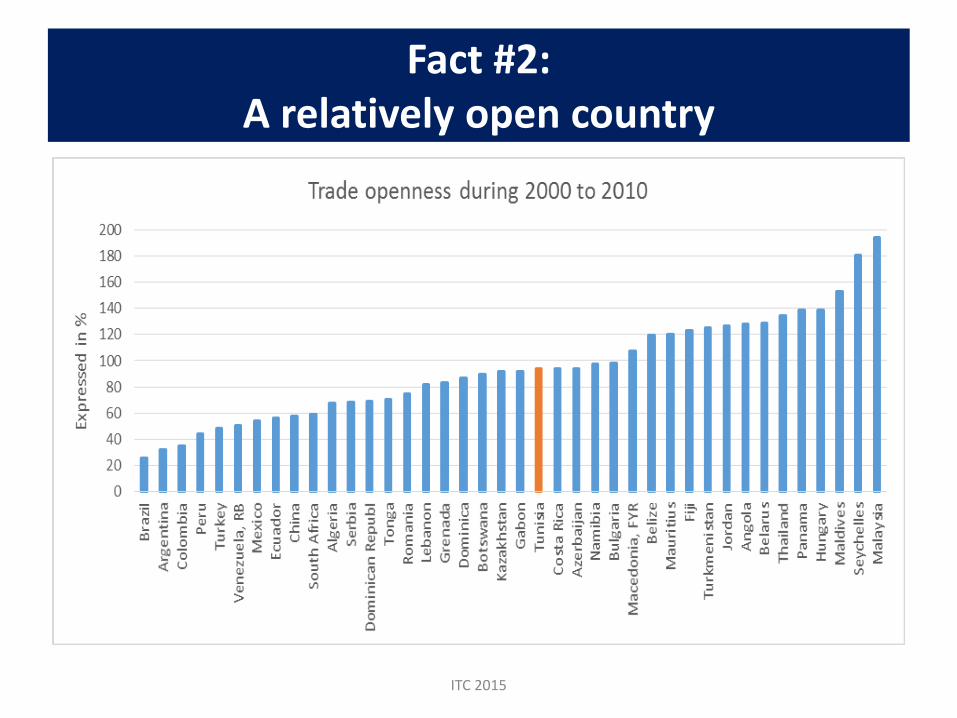
Why Tunisia? Fact #2:
A relatively open country
ITC 2015

Why Tunisia? Fact #3:
Lower performance in attracting FDI
ITC 2015

Why Tunisia?
• Data
– Tunisian registry of firms (RNE)
– Collected by the National Institute of Statistics in Tunisia (Institut National de la Statistique)
– Data on employment, age and main activity of all registered private firms
– Firm level imports and exports at HS6 level (from customs)
– Period 2000-2010
Firm’s dynamic in Tunisia
ITC 2015
Why Tunisia?
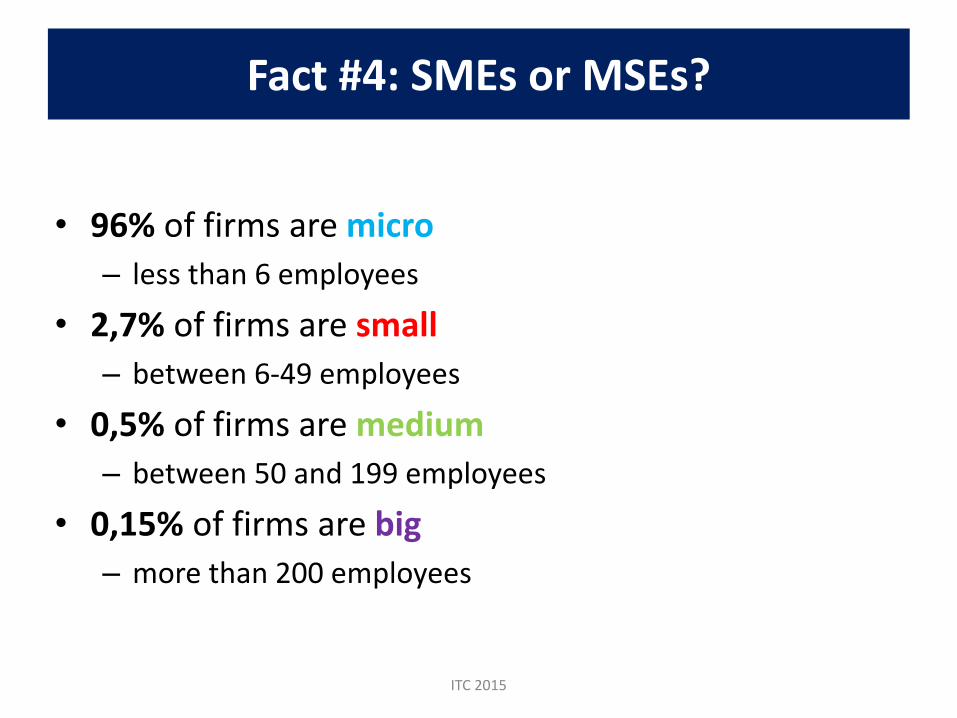
• 96% of firms are micro
– less than 6 employees
• 2,7% of firms are small
– between 6-49 employees
• 0,5% of firms are medium
– between 50 and 199 employees
• 0,15% of firms are big
– more than 200 employees
Fact #4: SMEs or MSEs?
ITC 2015

Why Tunisia?
• Offshore onshore dichotomy
– Imports inputs duty free
– No specific regulations
– No taxes
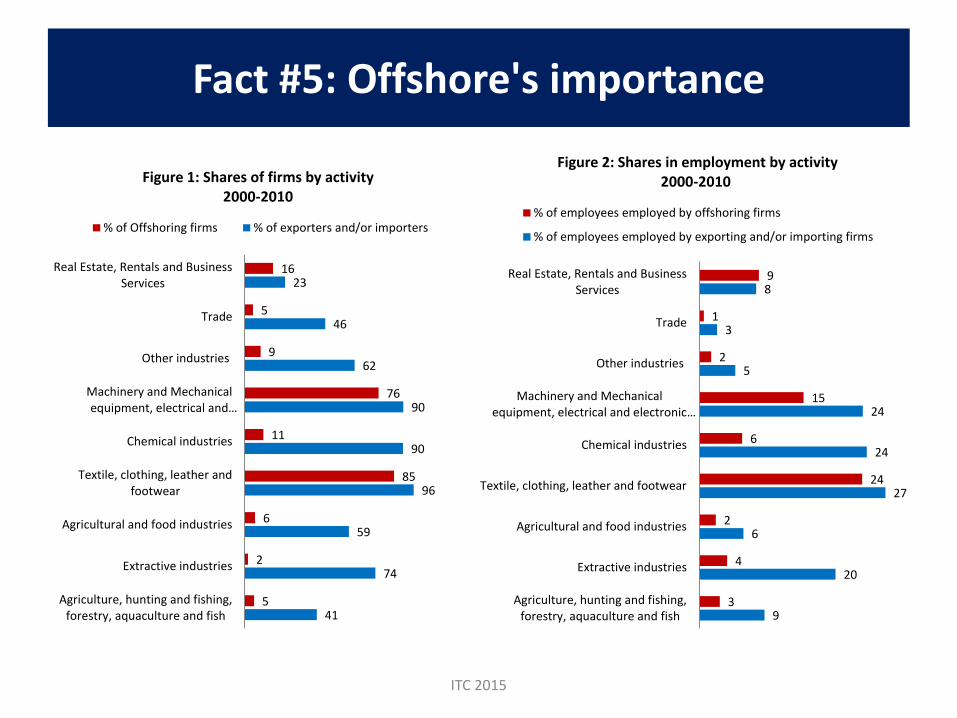
Fact #5: Offshore’s importance
ITC 2015

Why Tunisia?
• The importance of the offshore sector
– 2% of firms
– 29% of total employment
– 20% of total turnovers
– 78% of total exports
Fact #5: Offshore’s importance
ITC 2015
Fact #5: Offshore's importance
ITC 2015
41
74
59
96
90
90
62
46
23
5
2
6
85
11
76
9
5
16
Agriculture, hunting and fishing,forestry, aquaculture and fish
Extractive industries
Agricultural and food industries
Textile, clothing, leather andfootwear
Chemical industries
Machinery and Mechanicalequipment, electrical and…
Other industries
Trade
Real Estate, Rentals and BusinessServices
Figure 1: Shares of firms by activity 2000-2010
% of Offshoring firms % of exporters and/or importers
9
20
6
27
24
24
5
3
8
3
4
2
24
6
15
2
1
9
Agriculture, hunting and fishing,forestry, aquaculture and fish
Extractive industries
Agricultural and food industries
Textile, clothing, leather and footwear
Chemical industries
Machinery and Mechanicalequipment, electrical and electronic…
Other industries
Trade
Real Estate, Rentals and BusinessServices
Figure 2: Shares in employment by activity 2000-2010
% of employees employed by offshoring firms
% of employees employed by exporting and/or importing firms

Fact #6: MSEs forever
ITC 2015
all onshore offshore exporter exporter and/orimporter
0.47 0.41
4.99
5.54
6.17
2.62
1.80
9.39
7.19
5.16
4.35 4.02
4.92
4.28 4.28
Figure 3: Percentage of firms registering growth 2000-2010
Micro Small Medium
ITC 2015
-10,000
0
10,000
20,000
30,000
40,000
50,000
60,000
70,000
1998 2000 2002 2004 2006 2008 2010 2012
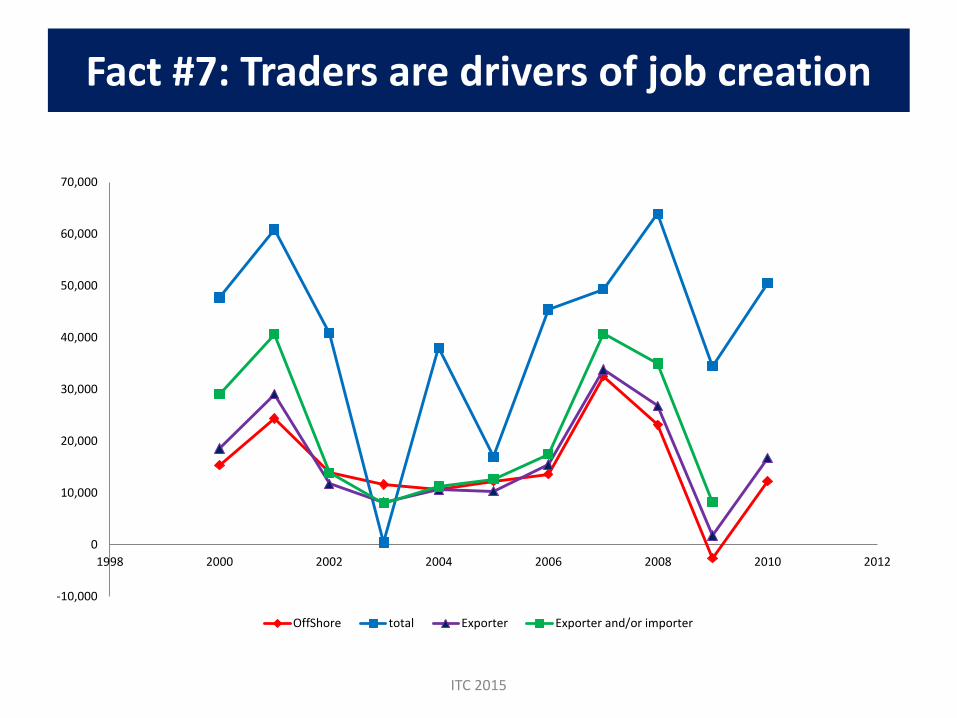
OffShore total Exporter Exporter and/or importer
Fact #7: Traders are drivers of job creation
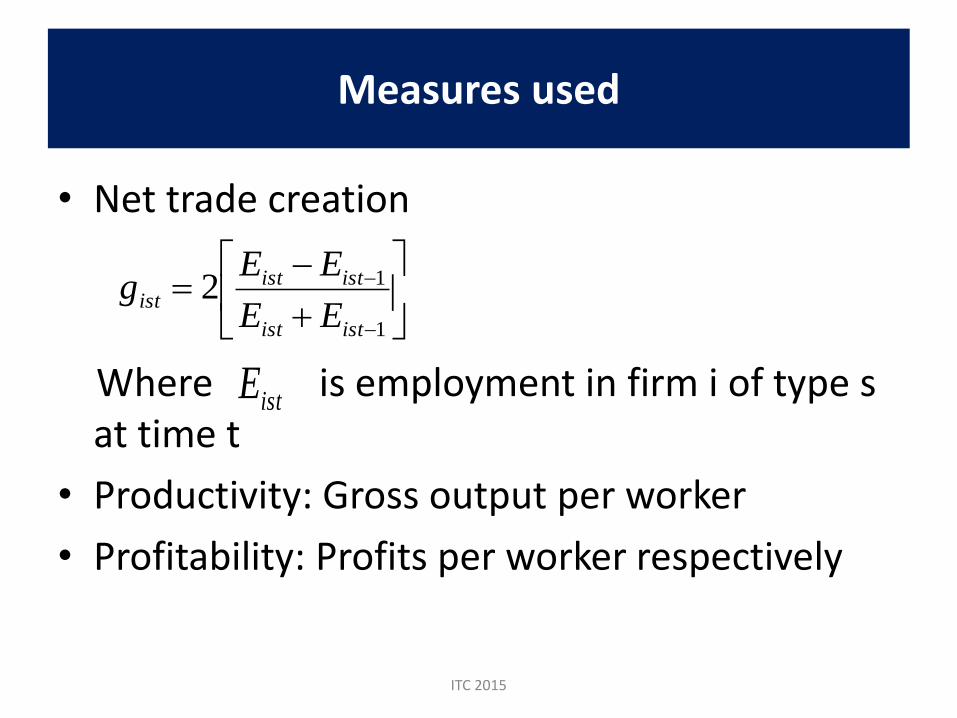
• Net trade creation
Where is employment in firm i of type s at time t
• Productivity: Gross output per worker
• Profitability: Profits per worker respectively
ITC 2015
1
12istist
ististist
EE
EEg
Measures used
istE
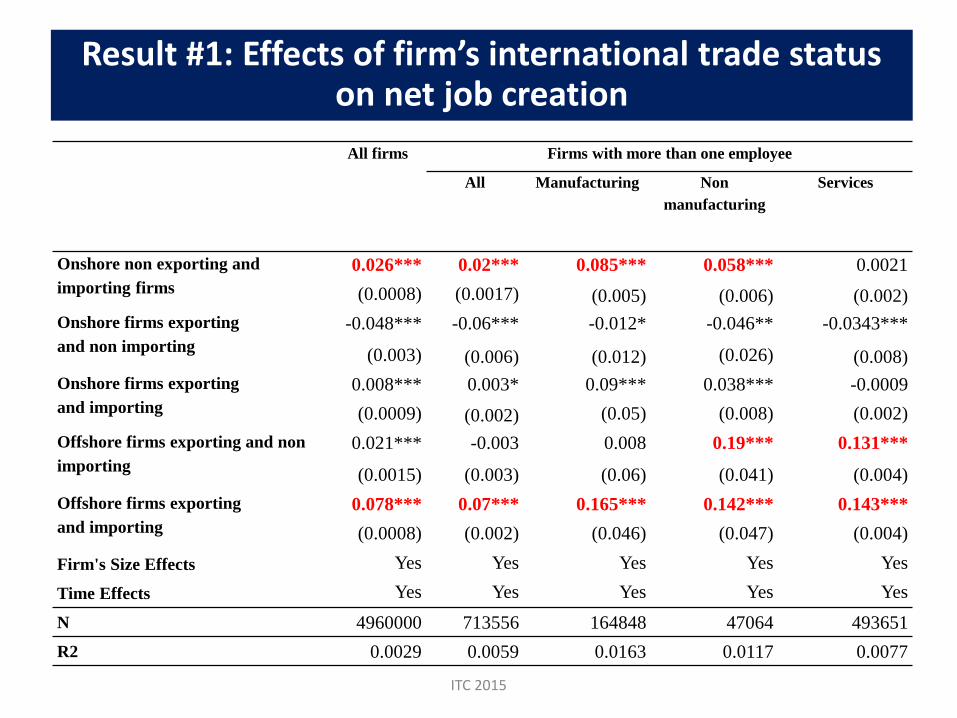
Result #1: Effects of firm’s international trade status on net job creation
ITC 2015
All firms Firms with more than one employee
All Manufacturing Non
manufacturing
Services
Onshore non exporting and
importing firms
0.026*** 0.02*** 0.085*** 0.058*** 0.0021
(0.0008) (0.0017) (0.005) (0.006) (0.002)
Onshore firms exporting
and non importing
-0.048*** -0.06*** -0.012* -0.046** -0.0343***
(0.003) (0.006) (0.012) (0.026) (0.008)
Onshore firms exporting
and importing
0.008*** 0.003* 0.09*** 0.038*** -0.0009
(0.0009) (0.002) (0.05) (0.008) (0.002)
Offshore firms exporting and non
importing
0.021*** -0.003 0.008 0.19*** 0.131***
(0.0015) (0.003) (0.06) (0.041) (0.004)
Offshore firms exporting
and importing
0.078*** 0.07*** 0.165*** 0.142*** 0.143***
(0.0008) (0.002) (0.046) (0.047) (0.004)
Firm's Size Effects Yes Yes Yes Yes Yes
Time Effects Yes Yes Yes Yes Yes
N 4960000 713556 164848 47064 493651
R2 0.0029 0.0059 0.0163 0.0117 0.0077

Why Tunisia?
ITC 2015
Result #2: Effects of firm’s international trade status on productivity
All firms
Firms with more than one employee
All Manufacturing Non
Manufacturing
Services
Onshore non exporting and importing firms 0.992*** 0.992*** 0.828*** 0.607*** 1.352***
(0.006) (0.006) (0.001) (0.012) (0.007)
Onshore firms exporting and non importing 0.314*** 0.031*** 0.268*** 0.471*** 0.0532***
(0.021) (0.021) (0.031) (0.053) (0.034)
Onshore firms exporting and importing 1.434*** 1.434*** 1.232*** 1.14*** 1.895***
(0.006) (0.006) (0.013) (0.016) (0.011)
Offshore firms exporting and non
importing
-0.847*** -0.849*** -0.904*** -0.771*** -0.645***
(0.010) (0.010) (0.017) (0.085) (0.017)
Offshore firms exporting and importing 0.566** 0.566*** 0.382*** 0.920*** 0.909***
(0.005) (0.005) (0.012) (0.095) (0.016)
Firm's Size Effects Yes Yes Yes Yes Yes
Time Effects Yes Yes Yes Yes Yes
N 336806 326572 105114 30712 190313
R2 0.200 0.200 0.213 0.18 0.298

Result #3: Effects of firm’s international trade status on profitability
All firms
Firms with more than one employee
All Manufacturing Non
Manufacturing
Services
Non exporting and importing firms 1.435*** 1.436*** 1.00*** 0.657*** 2.038***
(0.013) (0.013) (0.0399) (0.024) (0.013)
Onshore firms exporting and non
importing
0.522*** 0.522*** 0.218*** 1.572*** 0.799***
(0.047) (0.047) (0.086) (0.118) (0.065)
Onshore firms exporting and
importing
1.963*** 1.963*** 1.674*** 1.536*** 2.375***
(0.013) (0.014) (0.037) (0.032) (0.019)
Offshore firms and non importing -0.170*** -0.174*** -0.077*** -0.366*** -0.402***
(0.024) (0.024) (0.049) (0.138) (0.029)
Offshore firms and importing 0.618** 0.618*** 0.334*** 1.996*** 0.942***
(0.011) (0.012) (0.035) (0.248) (0.025)
Firm's Size Effects Yes Yes Yes Yes Yes
Time Effects Yes Yes Yes Yes Yes
N 204018 198799 63723 17729 117189
R2 0.160 0.160 0.083 0.205 0.316
ITC 2015

Conclusions
• Trade exposed firms are creating more jobs, are more productive and more profitable
• Two way traders are the most performing firms
ITC 2015

Conclusions
• Offshore firms tend to create more jobs compared to onshore firms
• but they are less productive and less profitable than onshore firms
– no knowledge transfer?
ITC 2015

Conclusions
• Importers perform better
– Good quality inputs?
– More integrated in the international markets?
ITC 2015
Conclusions
• Firms in services perform well
– Exporting offshore firms in services contribute to employment more than in manufacturing
– More profitable and more productive than in the manufacturing sector
ITC 2015