trading and research in r with bloomberg -...
TRANSCRIPT

Trading and research
in R with Bloomberg
Peter Garnry, CFA
CopenhagenR – UseR Group Meetup
2015-05-13

Background
• Loved mathematics and physics in high school
• Bachelor in business (CBS / Warwick) – why?
• Co-founded a financial software company (2007-2010)
• Head of Equity Strategy, Saxo Bank (2010-)
• CFA (2011-2014); to please my educational ego
• Active R programmer since 2011

R in Saxo Bank
FX options pricing models
Multi-asset trading models
Middle-office risk management
Firm-wide risk management
Business intelligence
Research recommendation engine
CFD order flow analysis

The importance of R in finance
• JPMorgan CIO unit lost $6.2B in
2012 due to the “London Whale”
• VaR model underpinning the
hedging strategy was run in Excel!
• If this level of standard was found
in bridge construction…nobody
would drive over a bridge

The physics of Wall Street
Louis Bachelier
Ed Thorp
Maury Osbourne Benoît Mandelbrot
Fischer Black James D. Farmer

The king of quants
Jim Simons
• Only three losing quarters 1993-2005
• 40% p.a. after 5%/44%
• Trades everything that’s liquid
• Time-bound trades

Quantitative trading
• Rules for signal generation and
risk management
– Minimal or no human intervention
• Identify statistically significant and
hopefully repeatable signals
• Low-frequency to high-frequency

Trading strategies
• Forecasting
– Models (super- or unsupervised) attempting to predict the
direction in the future
• Mean reversion
– Trading the spread between two instruments (co-integration)
– Gaps, relative value etc.
• Momentum
– Builds on slow diffusion of information
• High frequency trading
– Exploits market microstructure, market making

Backtesting
• Test trading performance and risk
on historical data
• Remove hindsight bias
– How did you feel on September 16,
2008?
• Statistical performance tests for
comparison between signals
• Forecasting models: three-step…
– Training, validation, test

Backtesting pitfalls
• Training and testing on the same data
– Time series cross-validation (Hyndman) or “forecast evaluation with
rolling origin”
• Survivorship bias (expensive to eliminate)
• “Trade on the close” + ignoring price impact
• Unreasonable participation rate + strategy capacity
• Overfitting statistical model
• Bootstrapping provides more robust result
– Reshuffle historical returns or cross-sectional sample with replacement
over time

What bootstrapping looks like…
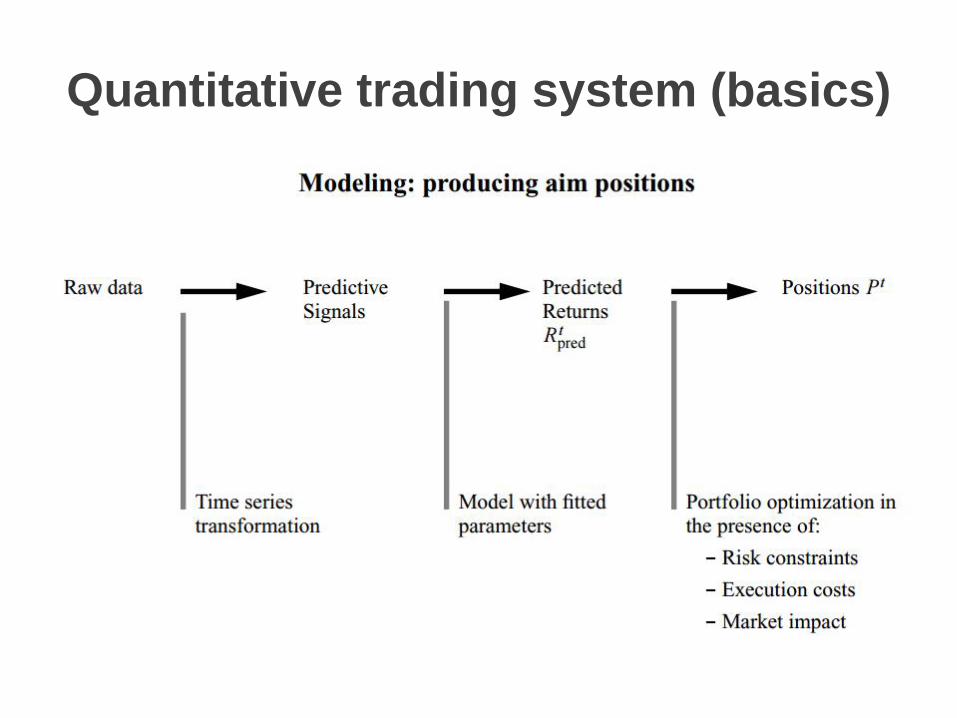
Quantitative trading system (basics)
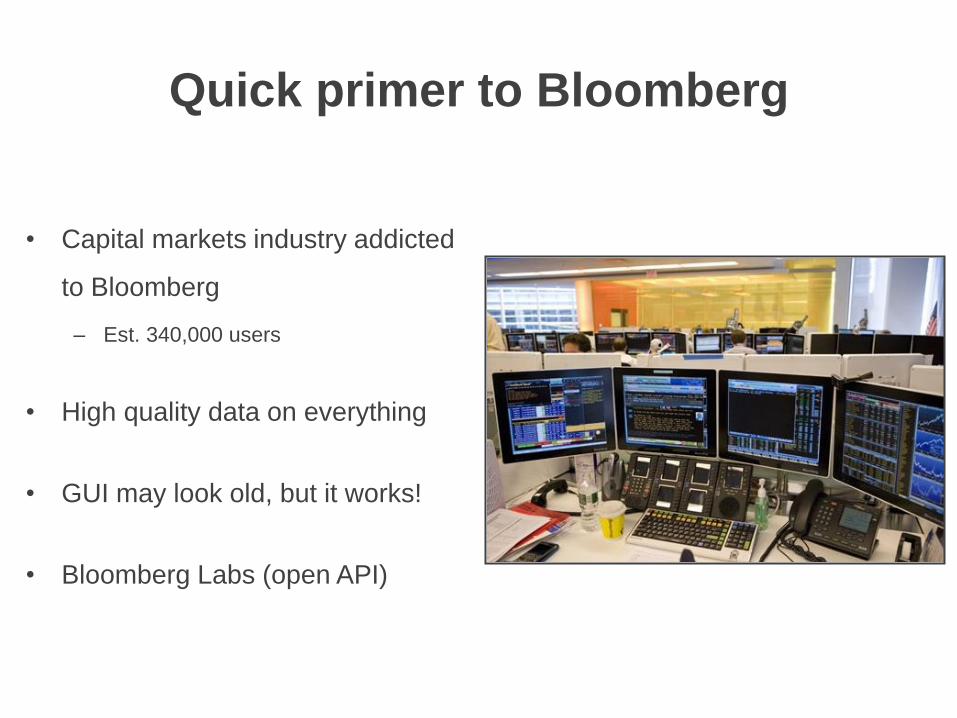
Quick primer to Bloomberg
• Capital markets industry addicted
to Bloomberg
– Est. 340,000 users
• High quality data on everything
• GUI may look old, but it works!
• Bloomberg Labs (open API)

Why data matters
• Corporate actions (splits, dividends etc.)
• Potential outliers distorting statistical models
• Winners/losers on gaps-on-open strategy sensitive to this!
Source: Bloomberg
Apple daily share price unadjusted for corporate actions

RbbgExtension
• Package extends the functions in the Rbbg package
– Connects Bloomberg with R
• Simplifies data queries on fundamental and price data
• Functions to eliminate survivorship bias
• Solves quirky data issues (active vs. inactive tickers)
• Future add-ons: Point-in-Time (equities), options, commodity
seasonality
– Cheaper than Compustat

Enough talk…show me code!
• Load S&P 100 tickers, get OHLCV since Jan 1, 2014
• Tickers > 1 + Fields > 1 = array(time, tickers, fields)
– Why not output data in a list?

Plot data using ‘quantmod’

Apple earnings
• Load historical earnings for Apple
• Plot EPS since 2005 + earnings surprise in %

It’s that easy…

VWAP strategy
• Strategy: long/short the price-to-vwap spread on close
– Long lowest spread (20 pos), short highest spread (20 pos)
– Execution orders < 30 secs before close
– Close positions on next day’s open (overnight bet)
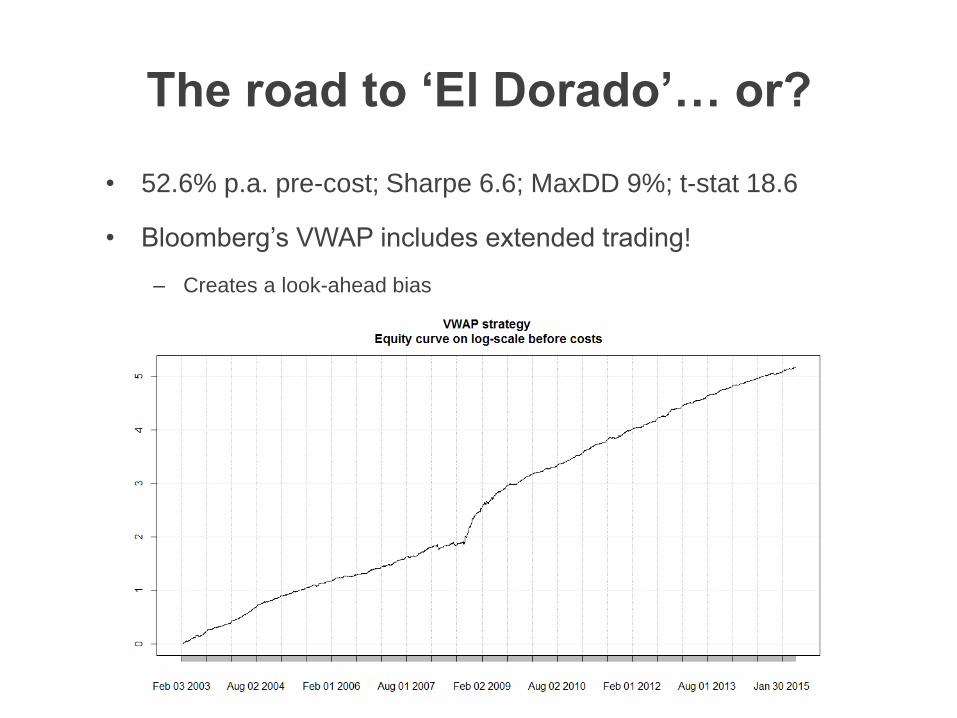
The road to ‘El Dorado’… or?
• 52.6% p.a. pre-cost; Sharpe 6.6; MaxDD 9%; t-stat 18.6
• Bloomberg’s VWAP includes extended trading!
– Creates a look-ahead bias

Pairs trading
• Market neutral strategy, first statistical arbitrage strategy
• Invented in the early 1982/83 by Gerry Bamberger at
Morgan Stanley’s quantitative group
– David Shaw came from same group, founded D.E. Shaw
• Find two time-series that co-integrates e.g. the regression
model’s residuals are stationary
– Typically pairs are found by correlation/co-integration grid search
across clusters (GICS or agglomerative hierarchical clustering)
• Very profitable strategy in 1980s and 1990s, but its has
slowly been arbitraged

Pairs trading
• Example on Coca-Cola and PepsiCo
– Almost identical companies with same product and geography
• Two years of data with the last three months out-of-sample

Momentum
• Premier market anomaly, accepted that as an
add-on to the famous three-factor model
• Robust factor over time, across countries and
asset classes
– Even across frequencies
• Dual-momentum is latest fashion (Gary
Antonacci)
– Implemented in ETFs
• Test momentum on Russell 1000
– Survivorship free vs bias

Few lines of code

34.4% vs 16.1% annualised

Monte carlo simulation

Signal strength

Momentum conclusions
• Code shows how easy it is to do quick trading research in R.
– Where R really shines compared to (Python), Java, C++
• Next step is subtracting trade cost, calculate strategy
capacity etc.
• Shows the importance of survivorship free data set
• Weak signal correlation but enough to beat the market
– But mean return is not significant (t-stat 1.23)
– Academia often finds momentum to be significant?

Let’s understand signal strength
• Generate 500 random bivariate normal distributions…
• …over a sequence of expected correlations
• Basically simulating forecasts against actual returns
• Asset with daily mean of 3 bps (7.9% p.a.)
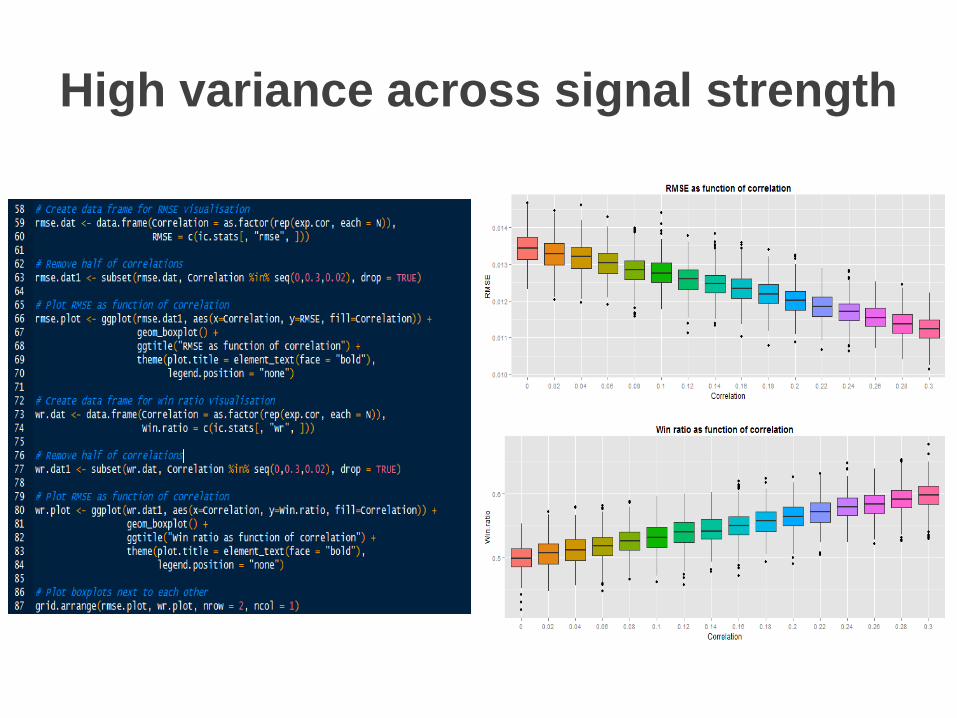
High variance across signal strength

Why multiple strategies work…

Multi-layered signals
• Signal correlation is an important measurement of a model’s
predictive power
– Don’t expect strong signals
• Return variance reduces with signal strength and number of
strategies (depending on signal cross correlations)
• What to do when multiple signals disagree?
– And if the frequency is different?
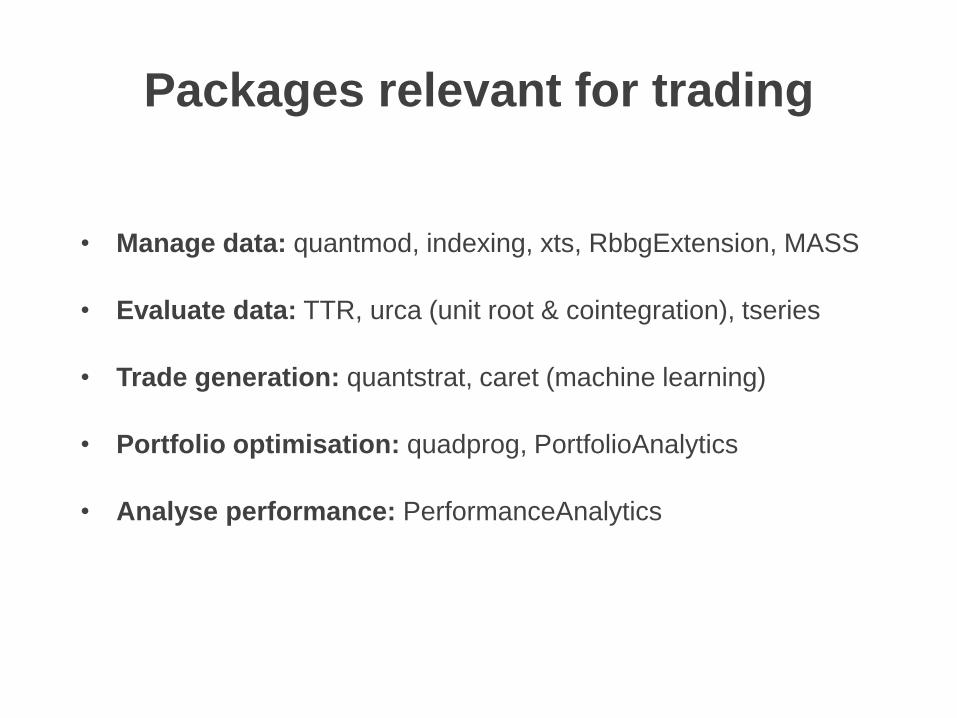
Packages relevant for trading
• Manage data: quantmod, indexing, xts, RbbgExtension, MASS
• Evaluate data: TTR, urca (unit root & cointegration), tseries
• Trade generation: quantstrat, caret (machine learning)
• Portfolio optimisation: quadprog, PortfolioAnalytics
• Analyse performance: PerformanceAnalytics

“In this business it’s easy to confuse
luck with brains”
Jim Simons (1996)