trading update, fy20 and fy21 distribution and ......2020/06/22 · abn 86 098 143 429 transurban...
TRANSCRIPT

asx release
Classification Transurban Group
Transurban International Limited ABN 90 121 746 825
Transurban Holdings Limited ABN 86 098 143 429
Transurban Holding Trust ABN 30 169 362 255
ARSN 098 807 419
[email protected] www.transurban.com
Level 31 Tower Five, Collins Square 727 Collins Street Docklands Victoria 3008 Australia Telephone +613 8656 8900 Facsimile +613 8656 8585
22 June 2020
TRADING UPDATE, FY20 AND FY21 DISTRIBUTION AND 2020 ANNUAL GENERAL MEETINGS
Trading Update Transurban today provides the attached trading update on recent company performance. Transurban will provide a market briefing at 11.00am (AEST) today, 22 June 2020. The market briefing will be webcast via the Transurban website at transurban.com.
FY20 Distribution A distribution totaling 16.0 cents per stapled security will be paid for the six months ending 30 June 2020. This will be paid from the Transurban Holding Trust and controlled entities and will not have franking credits. This takes the total FY20 distribution to 47.0 cents per stapled security, of which 2.0 cents is fully franked.
The extent to which distributions paid in FY20 are tax deferred will be confirmed in Tax Statements to be issued to security holders with the final distribution in August 2020.
FY21 Distribution guidance Transurban advises it anticipates the FY21 distribution will be in line with Free Cash, excluding Capital Releases1.
Distribution Reinvestment Plan The Distribution Reinvestment Plan (DRP) will operate for the distribution for the six months ending 30 June 2020. No discount will be applied when determining the price at which stapled securities will be issued under the DRP for this distribution.
The Directors have determined that the DRP pricing period in relation to this distribution will be the period of 10 trading days, commencing 6 July 2020.
The key dates for the distribution and the DRP are:
Securities trade ‘ex-distribution’ Record Date Final date for Elections under DRP Payment Date and DRP Allotment Date
29 June 2020 30 June 2020 1 July 2020 14 August 2020
1 See Glossary in the attached trading update for definitions of Free Cash and Capital Releases F
or p
erso
nal u
se o
nly

asx release
Classification Transurban Group
Transurban International Limited ABN 90 121 746 825
Transurban Holdings Limited ABN 86 098 143 429
Transurban Holding Trust ABN 30 169 362 255
ARSN 098 807 419
[email protected] www.transurban.com
Level 31 Tower Five, Collins Square 727 Collins Street Docklands Victoria 3008 Australia Telephone +613 8656 8900 Facsimile +613 8656 8585
2020 Annual General Meetings In accordance with Listing Rule 3.13.1, Transurban advises that:
• the 2020 Annual General Meetings of security holders of Transurban Holdings Limited and Transurban International Limited in conjunction with a meeting of unitholders of Transurban Holding Trust will be held on Thursday, 8 October 2020. Further details regarding the 2020 Annual General Meetings including the Notice of Meetings will be made available to security holders in accordance with regulatory requirements; and
• the closing date for the receipt of nominations from persons wishing to be considered for election as a director is Wednesday, 5 August 2020.
Investor enquiries Tess Palmer Head of Investor Relations +61 458 231 983
Media enquiries Sarah Chapman Manager, Media and Communications +61 400 841 898
This announcement is authorised by the Board of Transurban Group.
F
or p
erso
nal u
se o
nly

GATEWAY MOTORWAY, BRISBANE
For
per
sona
l use
onl
y

TRADING UPDATE | 22 JUNE 2020TRADING UPDATE | 22 JUNE 2020
This publication is prepared by the Transurban Group comprising Transurban Holdings Limited (ACN 098 143 429), Transurban Holding Trust (ARSN 098 807 419) and Transurban International Limited (ACN 121 746 825). The responsible entity of Transurban Holding Trust is Transurban Infrastructure Management Limited (ACN 098 147 678) (AFSL 246 585).
No representation or warranty is made as to the accuracy, completeness or correctness of the information contained in this publication. To the maximum extent permitted by law, none of the Transurban Group, its Directors, employees or agents or any other person, accept any liability for any loss arising from or in connection with this publication including, without limitation, any liability arising from fault or negligence, or make any representations or warranties regarding, and take no responsibility for, any part of this publication and make no representation or warranty, express or implied, as to the currency, accuracy, reliability, or completeness of information in this publication.
The information in this publication does not take into account individual investment and financial circumstances and is not intended in any way to influence a person dealing with a financial product, nor provide financial advice. It does not constitute an offer to subscribe for securities in the Transurban Group. Any person intending to deal in Transurban Group securities is recommended to obtain professional advice.
This publication contains certain forward-looking statements. The words “anticipate”, “expect”, “forecast”, “potential” and other similar expressions are intended to identify forward-looking statements. Indications of, and guidance on, future earnings, financial position, distributions, capex requirements and performance are also forward-looking statements as are statements regarding internal management estimates and assessments of traffic expectations and market outlook. Such forward-looking statements are not guarantees of future performance and involve known and unknown risks, uncertainties and other factors, many of which are beyond the control of Transurban, its officers, employees, agents and advisors, that may cause actual results to differ materially from those expressed or implied in such statements. There can be no assurance that actual outcomes will not differ materially from these statements. There are usually differences between forecast and actual results because events and actual circumstances frequently do not occur as forecast and their differences may be material.
DISCLAIMER
2
UNITED STATES OF AMERICA
These materials do not constitute an offer of securities for sale in the United States of America, and the securities referred to in these materials have not been and will not be registered under the United States Securities Act of 1933, as amended, and may not be offered or sold in the United States absent registration or an exemption from registration.
© Copyright Transurban Limited ABN 96 098 143 410. All rights reserved. No part of this publication may be reproduced, stored in a retrieval system, or transmitted in any form or by any means, electronic, mechanical, photocopying, recording or otherwise, without the written permission of the Transurban Group.
For
per
sona
l use
onl
y

TRADING UPDATE | 22 JUNE 2020
TRADING UPDATE
3
• 2H20 distribution of 16.0 cents per security, taking the overall FY20 distribution to 47.0 cents per security. Transurban anticipates FY21 distribution to be in line with Free Cash, excluding Capital Releases
• Progressive traffic recovery in line with easing government restrictions
– Australian markets improving significantly from peak impacts in April, with rate of restrictions removal differing across markets
– GWA Express Lanes traffic recovering slower, reflecting severity of government restrictions in the Greater Washington Area
– Tolls reapplied on A25 from 25 May, having been suspended since 25 March
• Committed to maintaining employment for our workforce, returning to our offices in line with government restrictions
• Working with contractors and governments to deliver our portfolio of large-scale, highly complex projects, keeping thousands of people in local jobs and supporting the supply chain
• More than $3.5 million of toll credits granted to date through program focused on supporting frontline workers and others adversely impacted through the pandemic. Emphasis now shifting to provide financial support to those customers experiencing financial hardship as a result of COVID-19
• With traffic volumes improving and a strong capital position Transurban remains well positioned for emerging opportunities to support the economy and drive growth through the recovery phase
• Performance will remain sensitive to future government responses and overall economic conditions
For
per
sona
l use
onl
y

TRADING UPDATE | 22 JUNE 2020
Weekly traffic performance by geography and vehicle class1
1. April-June 2020 data is provisional management data that is subject to change with final data to be released with Transurban Group FY20 Results in August 2020. Average daily traffic (ADT) % change is to prior corresponding period in 2019. 2. Week commencing 14 June includes traffic results from Sunday, 14 June 2020 to Thursday, 18 June 2020. As this is not a complete week, ADT % change is compared to the five day period Sunday, 16 June 2019 to Thursday, 20 June 2019.3. Tolls were suspended on the A25 from 25 March-24 May 2020 inclusive.
TRAFFIC UPDATE
4
• COVID-19 traffic impacts observable from early March with traffic deteriorating as lockdown measures were imposed
• Progressive recovery from mid-April in line with easing government restrictions
• Traffic will remain sensitive to future government responses
• Commercial traffic continues to display greater resilience to date
Transurban traffic by week1
-
0.5
1.0
1.5
2.0
2.5
ADT
(MIL
LIO
NS)
WEEK COMMENCING
-90%
-80%
-70%
-60%
-50%
-40%
-30%
-20%
-10%
0%
10%
20%
30%
40%
50%
60%
70%
80%
1-Mar 8-Mar 15-Mar 22-Mar 29-Mar 5-Apr 12-Apr 19-Apr 26-Apr 3-May 10-May 17-May 24-May 31-May 7-Jun 14-Jun
Transurban Group ADT Car ADT Large Vehicle ADT Australia GWA A25
WEEK COMMENCING
Impacted by timing of Easter holidays in 2020
Impacted by timing of Easter holidays in 2019
Stage 3 national restrictions 29/3
Stage 1 national restrictions 22/3
Initial ban on gatherings 15/3
Stage 2 national restrictions 24/3
National framework for lifting restrictions unveiled 8/5
2
3
For
per
sona
l use
onl
y

TRADING UPDATE | 22 JUNE 2020
• Impacts to traffic across Australian markets peaked in mid-April with a progressive recovery evident since
• Australia’s response to COVID-19 and its success in managing the spread resulted in peak impacts lasting only a short duration
• Government caution remains to avoid secondary waves of infection with traffic levels still subdued
• Contracted toll increases will apply as defined in each asset concession agreement with the next increase on 1 July
Government restriction removal timeline by market1
Weekly traffic performance by market2
1. Summary of key dates only and future dates are subject to change. Specific restrictions eased differs by state. Refer to government websites in each jurisdiction for latest information and further detail.2. April-June 2020 data is provisional management data that is subject to change with final data to be released with Transurban Group FY20 Results in August 2020. Average daily traffic (ADT) % change is to prior corresponding period in 2019. 3. Week commencing 14 June includes traffic results from Sunday, 14 June 2020 to Thursday, 18 June 2020. As this is not a complete week, ADT % change is compared to the five day period Sunday, 16 June 2019 to Thursday, 20 June 2019.
AUSTRALIA MARKET UPDATE
5
-70%
-60%
-50%
-40%
-30%
-20%
-10%
0%
10%
20%
30%
1-Mar 8-Mar 15-Mar 22-Mar 29-Mar 5-Apr 12-Apr 19-Apr 26-Apr 3-May 10-May 17-May 24-May 31-May 7-Jun 14-Jun
Sydney Melbourne Brisbane
WEEK COMMENCING
Impacted by timing of Easter holidays in 2020
Impacted by timing of Easter holidays in 2019
Initial easing of restrictions relating to schools, gatherings and non-essential shoppingFirst phase easing of restrictions
Peak restrictions
Second phase easing of restrictionsThird phase easing of restrictions
322 June 2020
New South Wales
Victoria
Queensland
APRIL 20 MAY 20 JUNE 20 JULY 20
For
per
sona
l use
onl
y

TRADING UPDATE | 22 JUNE 2020
• Impact to Express Lanes traffic prolonged due to the severity of government restrictions in the Greater Washington Area, but recovery evident from end of April
• A25 toll suspension ended as of 25 May with compensation agreed with Government
• Progressive removal of restrictions in GWA and Montreal underway with a slower rate of removal reflecting the severity of the outbreak in these regions
Government restriction removal timeline by market1
Express Lanes weekly traffic performance and dynamic toll prices4,5
1. Summary of key dates only. Refer to government websites in each jurisdiction for latest information and further detail.2. Timings are in relation to counties within Washington D.C. metro area only which have experienced delayed easing of restrictions relative to the remainder of Virginia and Maryland.3. Timings are in relation to Montreal only which has experienced delayed easing of restrictions relative to the remainder of Quebec.4. April-June 2020 data is provisional management data that is subject to change with final data to be released with Transurban Group FY20 Results in August 2020. Average daily traffic (ADT) % change is to prior corresponding period in 2019. 5. Weekly average toll price data is reported in USD and is provisional management data that is subject to change. 6. Week commencing 14 June includes traffic results from Sunday, 14 June 2020 to Thursday, 18 June 2020. As this is not a complete week, ADT % change is compared to the five day period Sunday, 16 June 2019 to Thursday, 20 June 2019 and
average toll price is based on the period Sunday, 14 June 2020 to Thursday, 18 June 2020.
NORTH AMERICA MARKET UPDATE
6
$8.7
$8.2
$5.1
$4.2
$4.0
$4.0
$4.1
$4.1
$4.2
$4.4
$4.5
$4.9
$4.9
$4.9
$6.0
$5.6
$5.4
$4.9
$2.6
$2.1
$2.0
$1.9
$1.9
$1.9
$2.0
$2.0
$2.1
$2.2
$2.2
$2.3
$2.4
$2.5
-140%
-120%
-100%
-80%
-60%
-40%
-20%
0%
20%
40%
1-Mar 8-Mar 15-Mar 22-Mar 29-Mar 5-Apr 12-Apr 19-Apr 26-Apr 3-May 10-May 17-May 24-May 31-May 7-Jun 14-Jun
95 Express Lanes average toll price 495 Express Lanes average toll price95 Express Lanes ADT growth % 495 Express Lanes ADT growth %
WEEK COMMENCING
6
Stay-at-home restrictions eased to a safer-at-home public health advisory (Phase One of recovery)
Outdoor gatherings of 10 people allowedPeak restrictions
Phase Two of recovery commences
Partial reopening of retail storesIndoor gatherings allowed (<50 people)and restaurants reopening
APRIL 20 MAY 20 JUNE 20 JULY 20
22 June 2020
GWA‒Virginia2
GWA‒Maryland2
Montreal3
For
per
sona
l use
onl
y
TRADING UPDATE | 22 JUNE 2020
STAGED RECOVERY CONSIDERATIONS
7
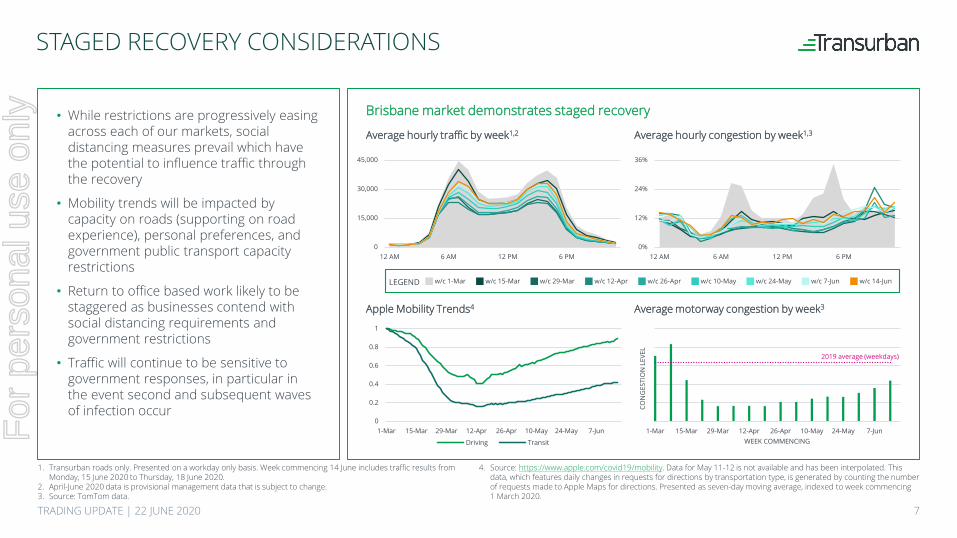
• While restrictions are progressively easing across each of our markets, social distancing measures prevail which have the potential to influence traffic through the recovery
• Mobility trends will be impacted by capacity on roads (supporting on road experience), personal preferences, and government public transport capacity restrictions
• Return to office based work likely to be staggered as businesses contend with social distancing requirements and government restrictions
• Traffic will continue to be sensitive to government responses, in particular in the event second and subsequent waves of infection occur
Brisbane market demonstrates staged recovery
1. Transurban roads only. Presented on a workday only basis. Week commencing 14 June includes traffic results from Monday, 15 June 2020 to Thursday, 18 June 2020.
2. April-June 2020 data is provisional management data that is subject to change.3. Source: TomTom data.
4. Source: https://www.apple.com/covid19/mobility. Data for May 11-12 is not available and has been interpolated. This data, which features daily changes in requests for directions by transportation type, is generated by counting the number of requests made to Apple Maps for directions. Presented as seven-day moving average, indexed to week commencing 1 March 2020.
Apple Mobility Trends4 Average motorway congestion by week3
Average hourly traffic by week1,2 Average hourly congestion by week1,3
0
15,000
30,000
45,000
12 AM 6 AM 12 PM 6 PM0%
12%
24%
36%
12 AM 6 AM 12 PM 6 PM
0
0.2
0.4
0.6
0.8
1
1-Mar 15-Mar 29-Mar 12-Apr 26-Apr 10-May 24-May 7-Jun
Driving Transit
1-Mar 15-Mar 29-Mar 12-Apr 26-Apr 10-May 24-May 7-Jun
CON
GES
TIO
N L
EVEL
WEEK COMMENCING
2019 average (weekdays)
LEGEND w/c 1-Mar w/c 15-Mar w/c 29-Mar w/c 12-Apr w/c 26-Apr w/c 10-May w/c 24-May w/c 7-Jun w/c 14-Jun
For
per
sona
l use
onl
y

TRADING UPDATE | 22 JUNE 2020
DELIVERY AND OPPORTUNITIES UPDATE
8
• Transurban continues to work with contractors and governments to deliver its portfolio of large-scale, highly complex projects
• Engaging with governments and industry on pipeline of potential infrastructure projects to drive growth through the recovery phase
Australian projects
• NorthConnex expected to open in Q1 FY21
North American projects
• Construction continues on the Fredericksburg Extension project with site clearing, earthworks and bridge construction underway
• The 495 Northern Extension project is progressing with the process to appoint a design-build team underway
• Transurban is participating alongside its consortium partners in the competitive selection process for Phase 1 of the Maryland Express Lanes project with the preferred phase developer to be selected in 20211
1. Consortium includes Transurban, Macquarie Capital, Archer Western Construction, Dewberry Engineers and Stantec Consulting Services.
M8 and M5 East
• M8 (formerly New M5) expected to open in Q1FY21• Tolling on existing M5 East to commence upon
opening and tolling commencement on M8• Corridor represents a key WestConnex value driver
with new connections into Sydney Airport and Port Botany through the future Sydney Gateway
• M8 to connect with M4-M5 Link (under construction) and M6 Extension (in procurement)
For
per
sona
l use
onl
y

TRADING UPDATE | 22 JUNE 2020
WEST GATE TUNNEL PROJECT UPDATE1
9
1. The D&C subcontractor has purported to terminate the D&C subcontract and also noted their intention to continue works on site. Transurban WGT Co Pty Limited has received a document from the D&C subcontractor entitled ‘West Gate Tunnel Project: Termination of the D&C Subcontract on the basis of a Force Majeure Termination Event’, a document entitled ‘West Gate Tunnel Project: Termination of the D&C Subcontract on the basis of further Force Majeure Termination Events’ and a document entitled ‘West Gate Tunnel Project: Third Force Majeure Termination Event Notice….’, all of which relate to issues in respect of the presence, classification and disposal of PFAS. Transurban does not consider the D&C subcontract has been validly terminated and, as such, the contract remains valid.
• Progress continues on site with launching gantry now assembled above Footscray Road that will build an elevated road connecting into CityLink
• Commencement of tunnelling requires resolution on a range of matters, including disposal site confirmation, preparatory works, achievement of relevant approvals and resolving commercial matters
• D&C subcontractor-run tender for spoil disposal sites is ongoing, with disposal sites currently seeking environmental and planning approvals
• Transurban has filed proceedings in the Supreme Court of Victoria to enforce the contract between Transurban WGT Co Pty Ltd (Project Co) and the D&C subcontractor
– Proceedings are to ensure the parties comply with the dispute resolution processes contemplated by the contract and do not seek to resolve liability of claims on the project, which have not been accepted by the State or Project Co and are still subject to dispute resolution processes
• We remain committed to working with the State and the D&C subcontractor to resolve the tunnelling issues
ELEVATED ROAD LAUNCHING GANTRY, 3 JUNE
For
per
sona
l use
onl
y
TRADING UPDATE | 22 JUNE 2020
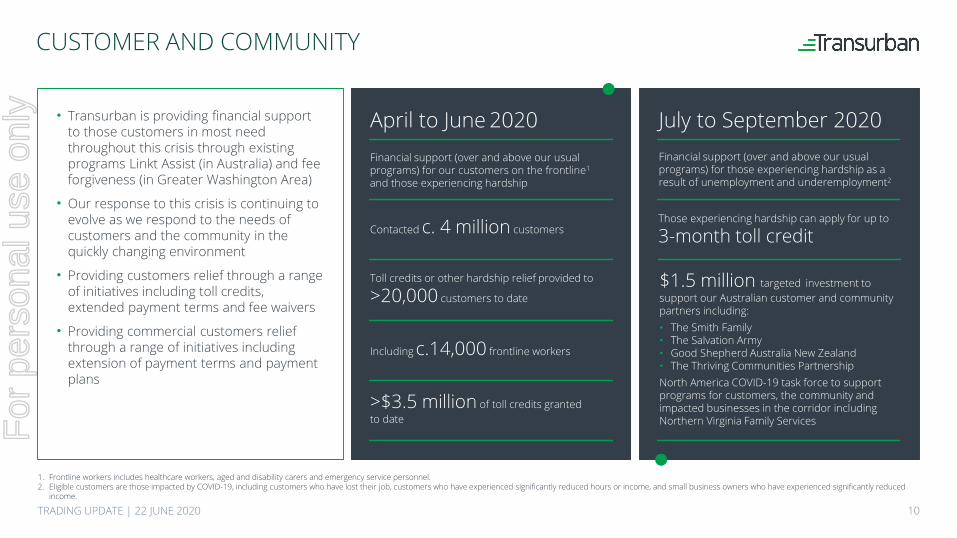
July to September 2020
CUSTOMER AND COMMUNITY
10
• Transurban is providing financial support to those customers in most need throughout this crisis through existing programs Linkt Assist (in Australia) and fee forgiveness (in Greater Washington Area)
• Our response to this crisis is continuing to evolve as we respond to the needs of customers and the community in the quickly changing environment
• Providing customers relief through a range of initiatives including toll credits, extended payment terms and fee waivers
• Providing commercial customers relief through a range of initiatives including extension of payment terms and payment plans
April to June 2020
Contacted c. 4 million customers
Toll credits or other hardship relief provided to
>20,000 customers to date
Including c.14,000 frontline workers
>$3.5 million of toll credits granted to date
Those experiencing hardship can apply for up to
3-month toll credit
Financial support (over and above our usual programs) for our customers on the frontline1
and those experiencing hardship
Financial support (over and above our usual programs) for those experiencing hardship as a result of unemployment and underemployment2
$1.5 million targeted investment to support our Australian customer and community partners including:• The Smith Family• The Salvation Army• Good Shepherd Australia New Zealand• The Thriving Communities PartnershipNorth America COVID-19 task force to support programs for customers, the community and impacted businesses in the corridor including Northern Virginia Family Services
1. Frontline workers includes healthcare workers, aged and disability carers and emergency service personnel.2. Eligible customers are those impacted by COVID-19, including customers who have lost their job, customers who have experienced significantly reduced hours or income, and small business owners who have experienced significantly reduced
income.
For
per
sona
l use
onl
y

TRADING UPDATE | 22 JUNE 2020
Transurban continues to remain compliant with all debt covenants• Transurban continues to
proactively manage those facilities where covenant headroom has been reduced
• No debt facilities are in default or forecast to reach default
• Continued debt covenant compliance dependent on traffic performance
• Certain assets will have limited distribution capacity through the remainder of 2020
Transurban 2H20 distribution of 16.0 cents per security, taking the overall FY20 distribution to 47.0 cents per security
• 2H20 distribution is in line with Free Cash, excluding Capital Releases– The majority of assets (both 100% owned and non-100% owned) have paid distributions in line
with their individual Free Cash• Transurban retains a strong liquidity position with sufficient funds to meet capital requirements
and debt refinancing obligations to end of FY21
Transurban anticipates FY21 distribution to be in line with Free Cash, excluding Capital Releases
• Transurban continues to assess the use of proceeds from Capital Releases noting that they can be used to:– Strengthen credit metrics– Fund development/acquisition opportunities– Enhance distributions
CAPITAL MANAGEMENT
11
For
per
sona
l use
onl
y

TRADING UPDATE | 22 JUNE 2020
SUMMARY
12
• Transurban continues to prioritise the health and safety of our employees, contractors and customers through this period
• Committed to maintaining employment for thousands of employees and subcontractors to operate our assets and deliver our major projects
• Increased financial support for customers and communities requiring assistance as a result of COVID-19
• Traffic is improving with the recovery directly tied to government responses, and differing trends developing across different markets. Performance will remain sensitive to future government responses and overall economic conditions
• 2H20 distribution of 16.0 cents per security, taking the overall FY20 distribution to 47.0 cents per security. Transurban anticipates FY21 distribution to be in line with Free Cash, excluding Capital Releases
• Transurban is well-positioned for the recovery and is engaging with industry and governments on a pipeline of potential infrastructure projects to support the economy and drive growth
A25, MONTREALFor
per
sona
l use
onl
y

For
per
sona
l use
onl
y

For
per
sona
l use
onl
y

For
per
sona
l use
onl
y

TRADING UPDATE | 22 JUNE 2020
Recent traffic data (ADT % change)2
Recent large vehicle traffic data (ADT % change)2
TRAFFIC UPDATE1
16
1. Transurban has improved the calculation of Average Daily Traffic (ADT). Traffic measurement involves the correlation of images and tags from detected vehicles. Reporting improvements have enabled faster removal of duplicate trips, for example, where multiple tags are detected in a vehicle. The change to the calculation has resulted in reported ADT reducing for some assets, by a maximum of 1%. ADT for prior corresponding periods has been restated for comparative purposes. This ADT reporting change has no impact on revenue.
2. April-June 2020 data is provisional management data that is subject to change with final data to be released with Transurban Group FY20 Results in August 2020. Average daily traffic (ADT) % change is to prior corresponding period
in 2019. 3. Week commencing 14 June includes traffic results from Sunday, 14 June 2020 to Thursday, 18 June 2020. As this is not a
complete week, ADT % change is compared to the five day period Sunday, 16 June 2019 to Thursday, 20 June 2019.4. Includes the 395 Express Lanes which opened in November 2019. Tolls were suspended on the A25 from 25 March-24
May 2020 inclusive.5. Montreal data only, given large vehicles are not permitted to travel on the Express Lanes.6. Based on proportional toll revenues.
Week commencing 1 Mar 8 Mar 15 Mar 22 Mar 29 Mar 5 Apr 12 Apr 19 Apr 26 Apr 3 May 10 May 17 May 24 May 31 May 7 June 14 June3
Sydney (1%) (2%) (10%) (29%) (42%) (51%) (51%) (18%) (34%) (30%) (27%) (25%) (20%) (13%) (13%) (9%)Melbourne (2%) (2%) (21%) (43%) (54%) (62%) (65%) (42%) (53%) (50%) (45%) (41%) (37%) (34%) (32%) (31%)Brisbane 4% (1%) (9%) (27%) (39%) (49%) (51%) (11%) (34%) (33%) (28%) (24%) (22%) (19%) (17%) (14%)North America4 17% 6% (46%) (64%) (67%) (70%) (68%) (62%) (60%) (55%) (48%) (44%) (46%) (48%) (42%) (43%)Transurban Group 1% (2%) (17%) (36%) (48%) (56%) (57%) (30%) (43%) (40%) (35%) (32%) (29%) (25%) (23%) (21%)
Week commencing 1 Mar 8 Mar 15 Mar 22 Mar 29 Mar 5 Apr 12 Apr 19 Apr 26 Apr 3 May 10 May 17 May 24 May 31 May 7 June 14 June3
Sydney (10%) (3%) 3% (3%) (13%) (26%) (27%) 86% (10%) (9%) (11%) (13%) (11%) 1% (2%) 2%Melbourne 1% 5% (1%) (10%) (14%) (31%) (36%) 56% (14%) (14%) (12%) (12%) (7%) (6%) (4%) (6%)Brisbane 4% (2%) 3% (4%) (12%) (28%) (30%) 86% (11%) (13%) (13%) (11%) (11%) (10%) (9%) (6%)Montreal5 5% 4% (9%) (24%) (29%) (31%) (36%) 6% (9%) 2% 31% 41% (4%) (6%) (4%) (6%)Transurban Group 0% 1% 1% (7%) (13%) (29%) (33%) 69% (12%) (13%) (11%) (11%) (9%) (6%) (5%) (5%)Large vehicles as a % of revenue6 25% 25% 31% 37% 42% 41% 40% 41% 39% 37% 35% 34% 33% 32% 30% 33%
Impacted by timing of Easter holidays in 2020
Impacted by timing of Easter holidays in 2019
Impacted by timing of Easter holidays in 2020
Impacted by timing of Easter holidays in 2019F
or p
erso
nal u
se o
nly

TRADING UPDATE | 22 JUNE 2020
Recent traffic data (ADT % change)1
TRAFFIC UPDATE
17
1. April-June 2020 data is provisional management data that is subject to change with final data to be released with Transurban Group FY20 Results in August 2020. Average daily traffic (ADT) % change is to prior corresponding period in 2019. 2. Week commencing 14 June includes traffic results from Sunday, 14 June 2020 to Thursday, 18 June 2020. As this is not a complete week, ADT % change is compared to the five day period Sunday, 16 June 2019 to Thursday, 20 June 2019.3. Includes the 395 Express Lanes which opened in November 2019. Tolls were suspended on the A25 from 25 March-24 May 2020 inclusive. North America includes the Greater Washington Area (GWA) and Montreal which is part of Quebec (QUE).
Week commencing 1 Mar 8 Mar 15 Mar 22 Mar 29 Mar 5 Apr 12 Apr 19 Apr 26 Apr 3 May 10 May 17 May 24 May 31 May 7 June 14 June2
Sydney (NSW) (1%) (2%) (10%) (29%) (42%) (51%) (51%) (18%) (34%) (30%) (27%) (25%) (20%) (13%) (13%) (9%)Melbourne (VIC) (2%) (2%) (21%) (43%) (54%) (62%) (65%) (42%) (53%) (50%) (45%) (41%) (37%) (34%) (32%) (31%)Brisbane (QLD) 4% (1%) (9%) (27%) (39%) (49%) (51%) (11%) (34%) (33%) (28%) (24%) (22%) (19%) (17%) (14%)North America3 17% 6% (46%) (64%) (67%) (70%) (68%) (62%) (60%) (55%) (48%) (44%) (46%) (48%) (42%) (43%)Transurban Group 1% (2%) (17%) (36%) (48%) (56%) (57%) (30%) (43%) (40%) (35%) (32%) (29%) (25%) (23%) (21%)
Public holidays falling on weekdays:
2020 None VIC 9th None None None AUS 10th
QUE 10thAUS 13th
QUE 13th None None QLD 4th None QUE 18th GWA 25th None NSW 8th
VIC 8th None
2019 None VIC 11th None None None None NoneAUS 19, 22nd
QUE 19, 22nd
AUS 25thNone QLD 6th None QUE 20th GWA 27th None NSW 10th
VIC 10th None
RDOs:
2020 None NSW 9th
VIC 10th QLD 16th NSW 23rd
VIC 23rd None NSW 9thNSW 14th
VIC 14-15th
QLD 14thNone NSW 27th
VIC 27-28th None NSW 11th
VIC 11th QLD 18th NSW 25th
VIC 25th NoneNSW 9th
VIC 9th
QLD 8thNone
2019 None VIC 12th None NSW 25th
QLD 25th VIC 1st None None VIC 23-24th
QLD 23rdNSW 26th
VIC 26th None NSW 13th
VIC 13th QLD 20th NSW 27th
VIC 27th None NSW 11th
VIC 11th QLD 17th
For
per
sona
l use
onl
y

TRADING UPDATE | 22 JUNE 2020
MONTHLY TRAFFIC PERFORMANCE BY ASSET1
18
1. April-June 2020 data is provisional management data that is subject to change with final data to be released with Transurban Group FY20 Results in August 2020. Average daily traffic (ADT) % change is to prior corresponding period in 2019.2. June month-to-date includes data up to Thursday, 18 June 2020 inclusive. As this is not a complete month, ADT % change is compared to the 18 day period Monday, 3 June 2019 to Thursday, 20 June 2019.
(30%
)
(33%
)
(36%
)
(49%
)
(49%
)
(53%
)
(53%
)
(56%
)
(24%
)
(42%
)
(49%
)
(53%
)
(55%
)
(57%
)
(38%
)
(80%
)
(81%
)
(48%
)
(16%
)
(19%
)
(24%
)
(33%
)
(36%
)
(39%
)
(42%
)
(45%
)
(16%
)
(32%
)
(37%
)
(45%
)
(49%
)
(47%
)
(12%
)
(69%
)
(74%
)
(36%
)
1%
(6%
)
(8%
)
(14%
)
(19%
)
(26%
)
(25%
)
(32%
)
(3%
)
(21%
)
(23%
)
(29%
)
(32%
)
(35%
)
(20%
)
(53%
)
(65%
)
(23%
)
-90%
-80%
-70%
-60%
-50%
-40%
-30%
-20%
-10%
0%
10%M4 M5 West M7 CCT M2 ED LCT CityLink Logan Gateway Legacy Clem7 GBB AirportlinkM7 A25 95 495
TransurbanGroup
LEGEND
Sydney
Melbourne
Brisbane
North America
Transurban Group
Apr-20 May-20 Jun-20MTD2
For
per
sona
l use
onl
y

TRADING UPDATE | 22 JUNE 2020
GLOSSARY
19
TERM DEFINITION
95 95 Express Lanes395 395 Express Lanes495 495 Express Lanes1H/2H First or second half of a financial yearA25 A25 toll roadABN Australian Business NumberACN Australian Company Number
ADT Average Daily Traffic. ADT is calculated by dividing the total number of trips on each asset (transactions on CityLink) by the number of days in the period
AFSL Australian Financial Services LicenceARSN Australian Registered Scheme NumberAUS AustraliaCAPEX Capital Expenditure
CAPITAL RELEASES Capital Releases refer to the injection of debt into Transurban operated assets as assets mature, optimising balance sheets.
CCT Cross City TunnelCOVID-19 CoronavirusD&C Design and ConstructED Eastern Distributor
FREE CASH
Free Cash is the primary measure used to assess the cash performance of the Group. It represents the cash available for distribution to security holders. Free Cash is calculated as cash flows from operating activities from 100% owned entities (adjusted to include the allowance for maintenance of intangible assets, exclude cash payments for maintenance of intangible assets and exclude transaction and integration costs related to acquisitions), plus Capital Releases from 100% owned entities, less debt amortisation of 100% owned entities, plus returns from non-100% owned entities.
FY Financial year 1 July to 30 June
TERM DEFINITION
GATEWAY Gateway MotorwayGBB Go Between BridgeGROUP Transurban Group
GWA Greater Washington Area meaning northern Virginia, Washington D.C., areas of Maryland and the surrounding metropolitan area
LCT Lane Cove TunnelLEGACY Legacy WayLINKT Transurban’s retail tolling brandLOGAN Logan MotorwayM2 Hills M2M4 New M4M5 M5 WestM7 Westlink M7M8 M8 Motorway (formerly referred to as New M5)MTD Month-to-dateNSW New South Wales, AustraliaPFAS Per and polyfluorinated alkyl substancesQ1/Q3 First or third quarter of a financial yearQLD Queensland, AustraliaQUE QuebecRDO Rostered Days OffTOLL REVENUE Toll revenue includes revenue from customers, specifically tolls, service and fee revenueUSD US DollarsVIC Victoria, AustraliaW/C Week commencingWGT/WGTP West Gate Tunnel/West Gate Tunnel Project
For
per
sona
l use
onl
y