• TRAFx Counters• Choosing Counter Locations• Using the Data• Managing the Counters and Data
2
• Breakout Session and Discussion
• Q&A Session
Presenter
Presentation Notes
Discuss TRAFx trail and vehicle counters, why we went with the product, different installation options, not a commercial just our experience, can apply principles for other types of counters and visitation data collection methods. Choosing counter locations and all the considerations that come with this process Using the data, all the potential uses and the value of it within your agency Managing the counters and the data long term and the involvement of field staff Breakout session with exercise followed by a discussion time. End with a Q&A
TRAFx Counters 3
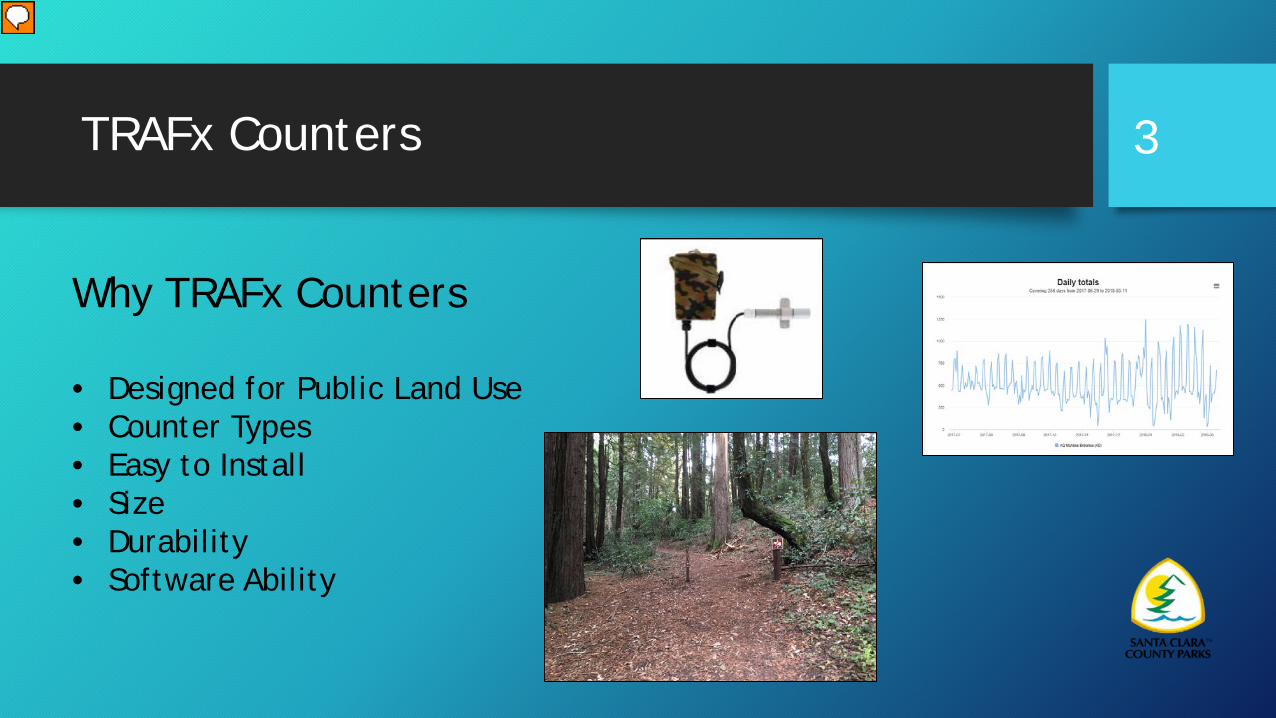
Why TRAFx Counters
• Designed for Public Land Use• Counter Types• Easy to Install• Size • Durability• Software Ability
Presenter
Presentation Notes
Hand out counters. Designed for public lands, several agencies world wide use them, many of our Bay Area sister agencies east bay regional parks, Mid Pen, OSA San Mateo Able to consult with sister agencies on their experiences. Describe IR, range, no reflector, Magnetometer, range, no line of sight, Ease of concealment, size, show example Durability, water proof cases, moisture is the worst thing Software ability from the raw data comprehensive reports are generated on a cloud based server Data Net which we look at later.
TRAFx Counters 4
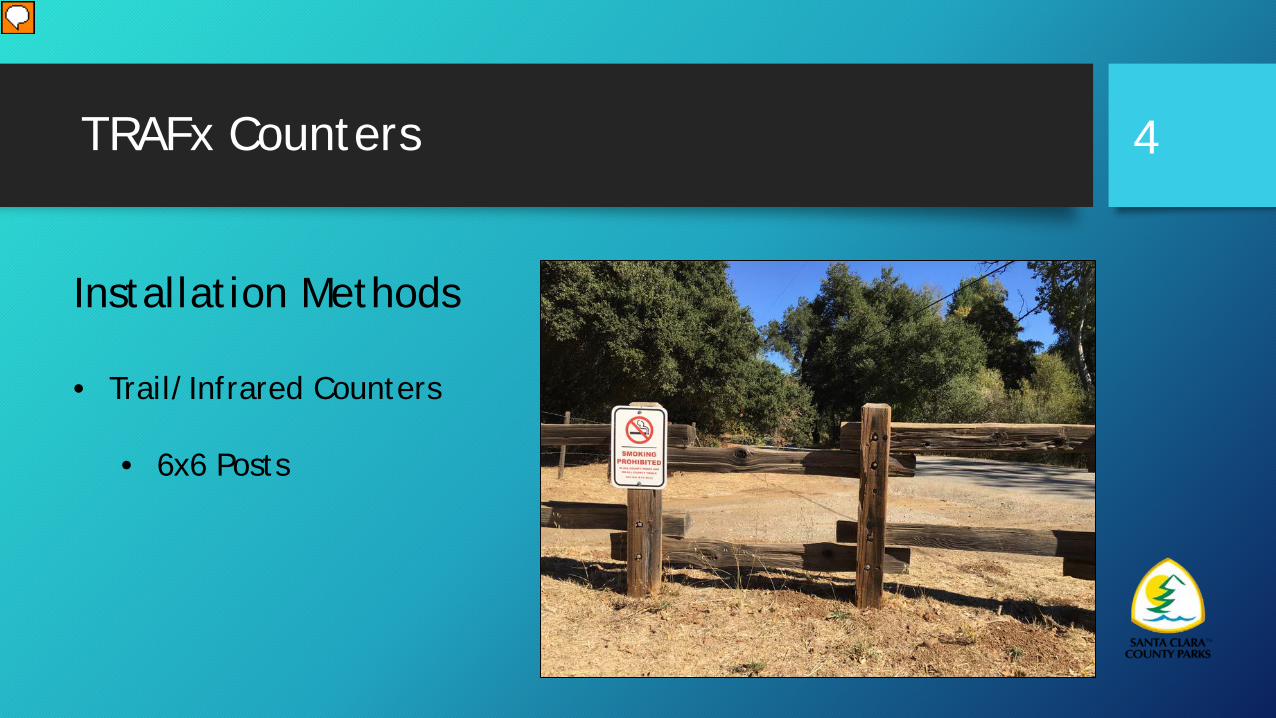
Installation Methods
• Trail/Infrared Counters
• 6x6 Posts
Presenter
Presentation Notes
Trail or Infrared counters easy to conceal, favorite method in 6x6 post, repurpose for sign or fence post, use infrastructure in place. Rout, plate, hardware cloth to protect, gum, marble story
TRAFx Counters 5
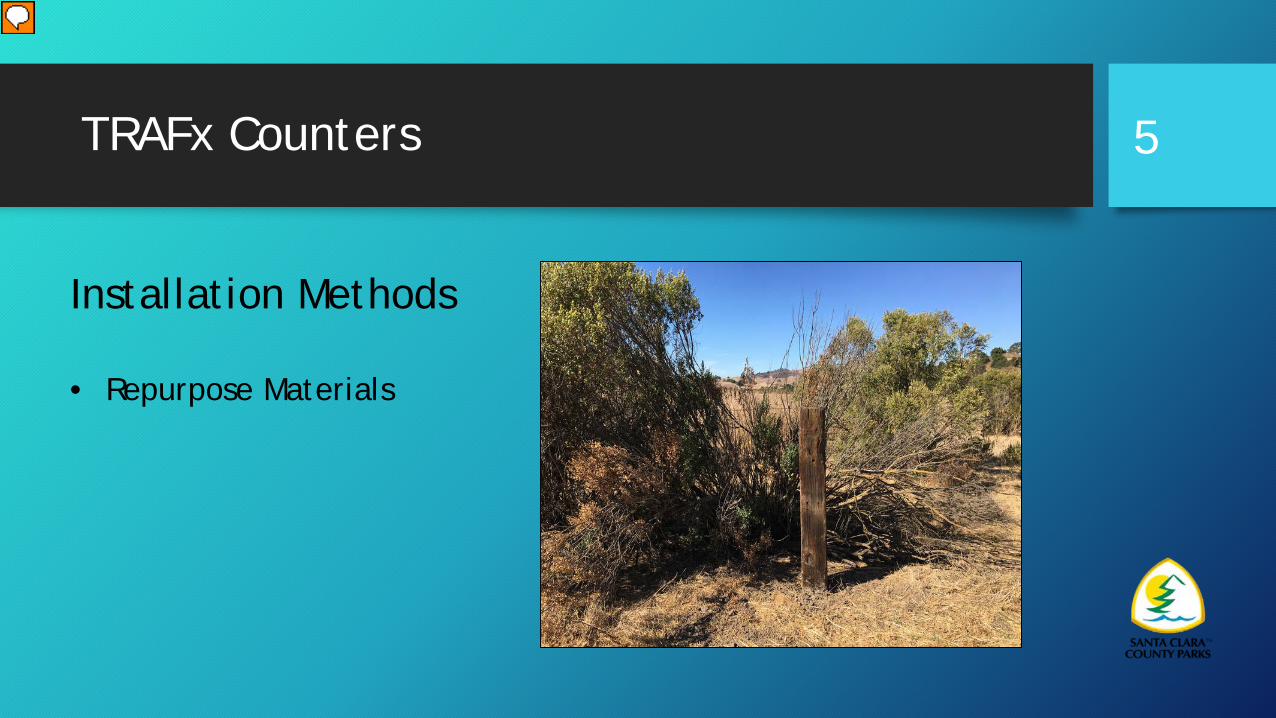
Installation Methods
• Repurpose Materials
Presenter
Presentation Notes
Utilize what looks natural in the environment. Old ranch posts work great in ranching areas. Tell story of salvaging old redwood corral posts. Be artistic, have fun.
TRAFx Counters 6
Installation Methods
• Trail/Infrared Counters
• Nesting Boxes
Presenter
Presentation Notes
Another agency in our area uses nesting boxes to conceal the counters. Wood pecker story
TRAFx Counters 7
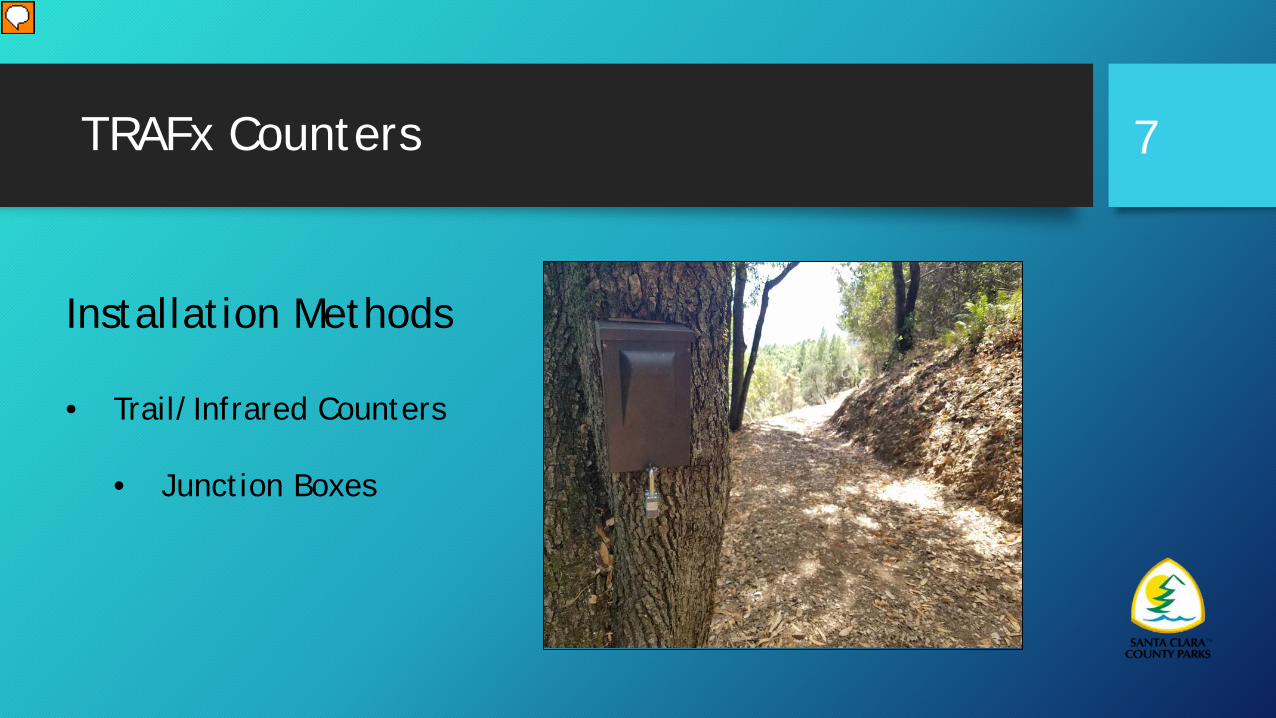
Installation Methods
• Trail/Infrared Counters
• Junction Boxes
Presenter
Presentation Notes
This method works for easy installation and transportable. Fits better in some environments versus others.
TRAFx Counters 8
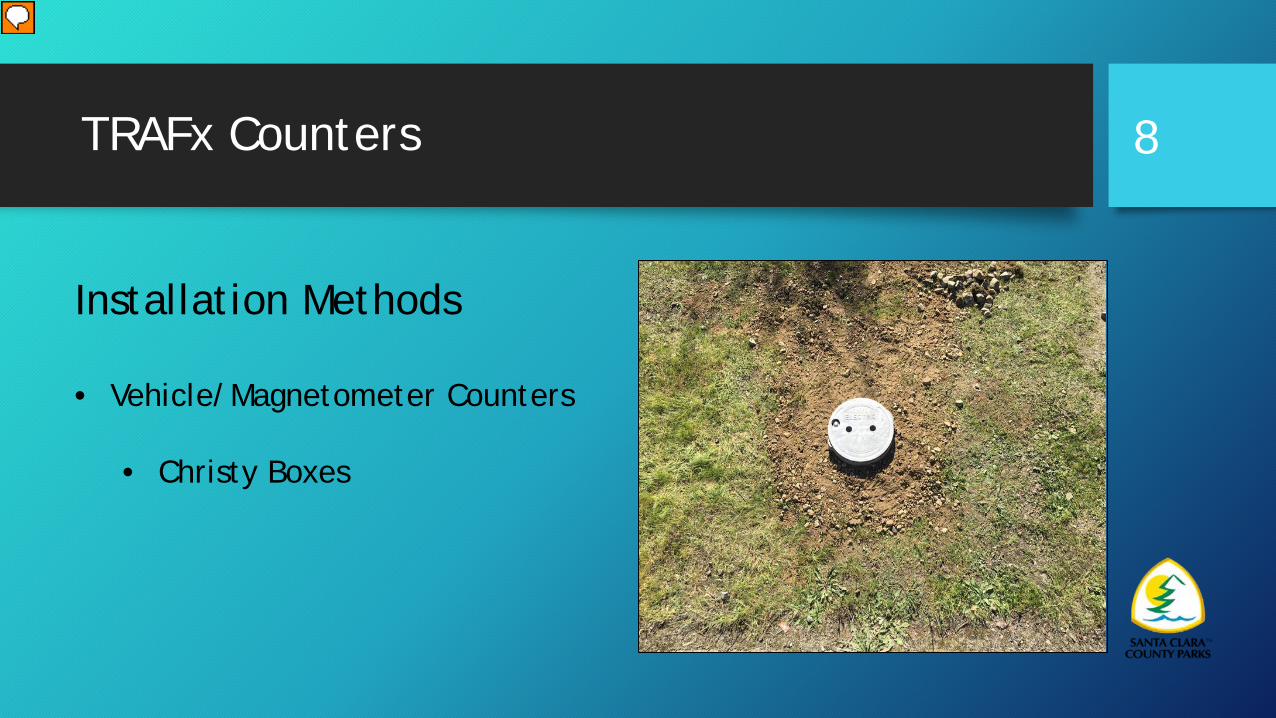
Installation Methods
• Vehicle/Magnetometer Counters
• Christy Boxes
Presenter
Presentation Notes
Christy boxes, Concealed easy to install, secure beware of soil drainage issues, Bear Ranch story and vehicles running them over, LG Creek Story
TRAFx Counters 9
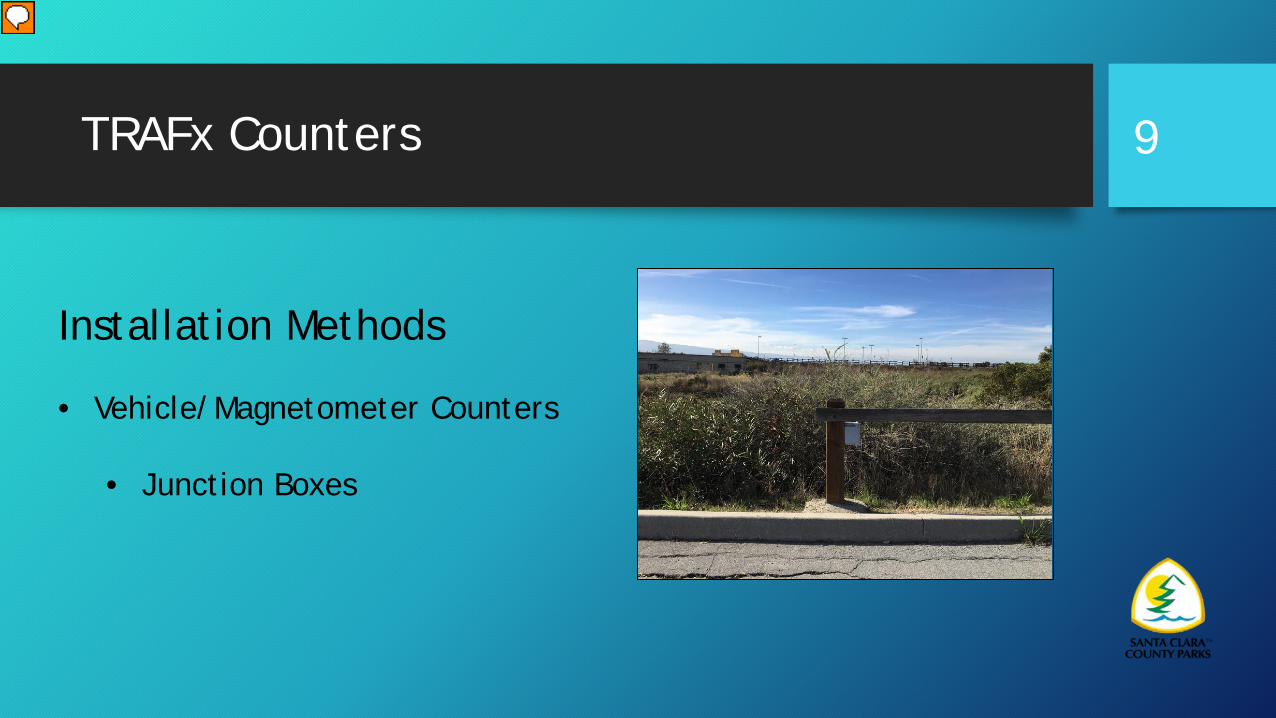
Installation Methods
• Vehicle/Magnetometer Counters
• Junction Boxes
Presenter
Presentation Notes
Where infrastructure allows I prefer using junction boxes. Clean installation, easy to access counter.
Choosing Counter Locations 10
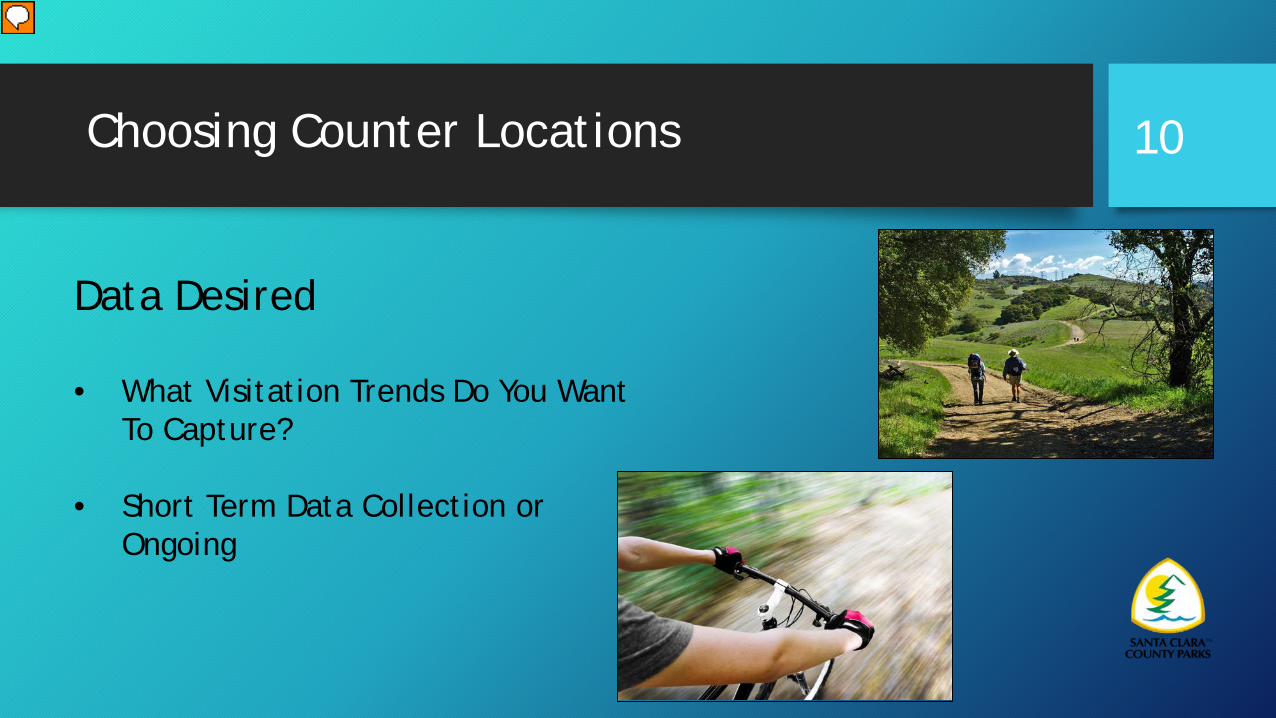
Data Desired
• What Visitation Trends Do You Want To Capture?
• Short Term Data Collection or Ongoing
Presenter
Presentation Notes
Identify the visitation you want to capture. Vehicle, hikers, bikes, equestrian, all the above. Overall park visitation-SCCP approach Phase II. I will discuss the data element mostly form this perspective. High visitation sites and park. or specific locations. Also consider what methods your agency is currently using to capture park visitation and how this data may compliment or overlap with counter data. Short term at each site and rotate or permanent locations? Mention Phase III, High visitation sites and park. or specific locations
Choosing Counter Locations 11
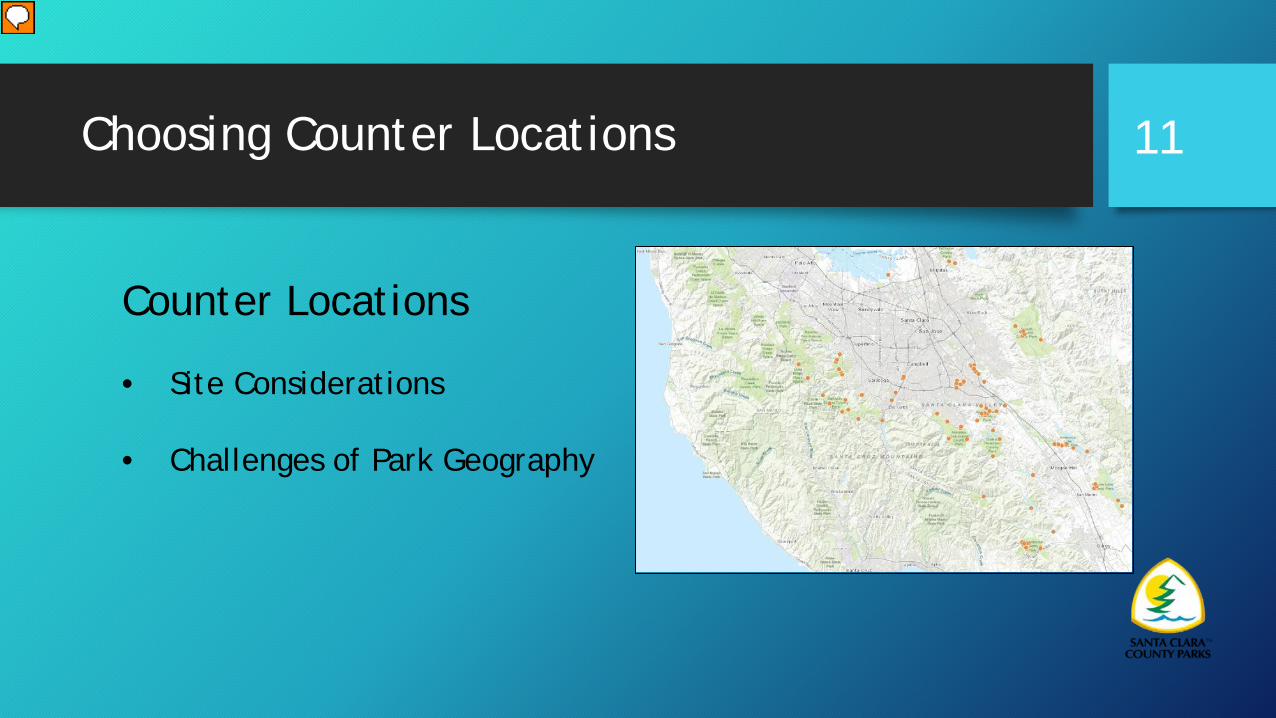
Counter Locations
• Site Considerations
• Challenges of Park Geography
Presenter
Presentation Notes
Deciding on the site and considerations to factor in, range of the counters Examine different park layouts and the challenges with deciding sites
Choosing Counter Locations 12
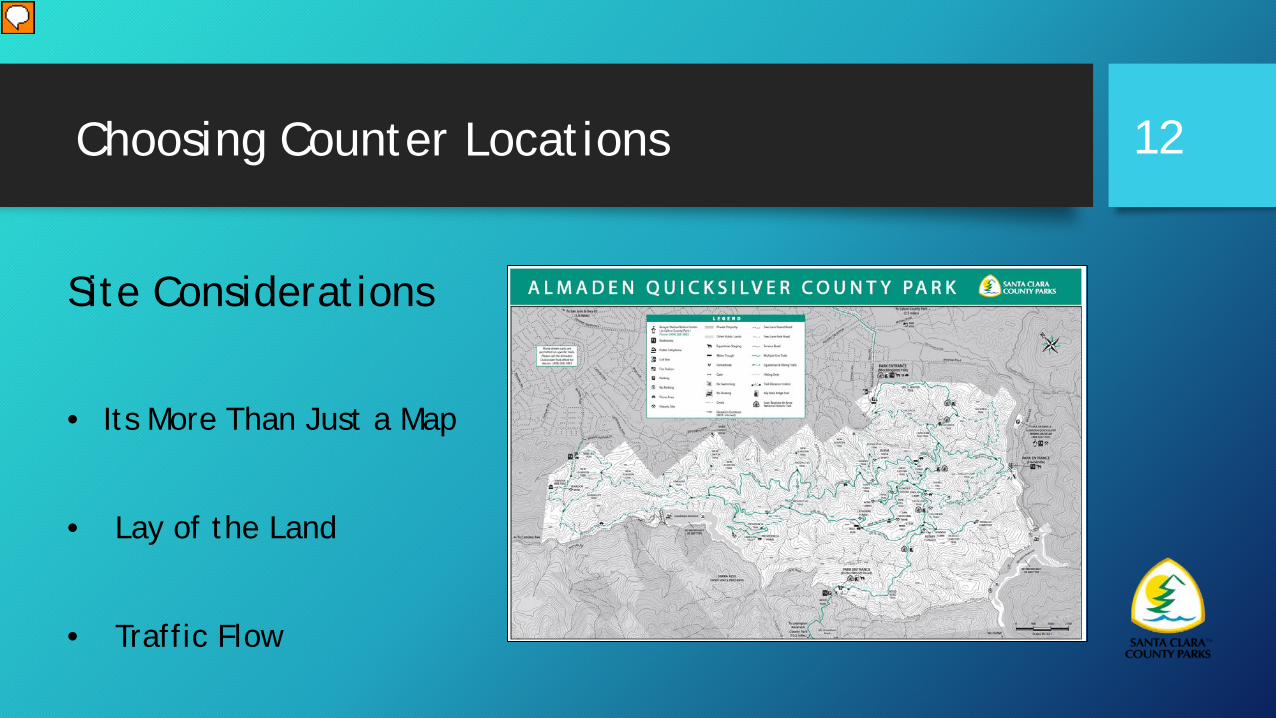
Site Considerations
• Its More Than Just a Map
• Lay of the Land
• Traffic Flow
Presenter
Presentation Notes
Visit the site, survey park visitors on their traffic trends, meet with park staff, recommended hikes, act. Multiple trail junctions or heads at a single location. Counters specs what can it capture. Consider choke points, tail heads with multiple access points.
Choosing Counter Locations 13
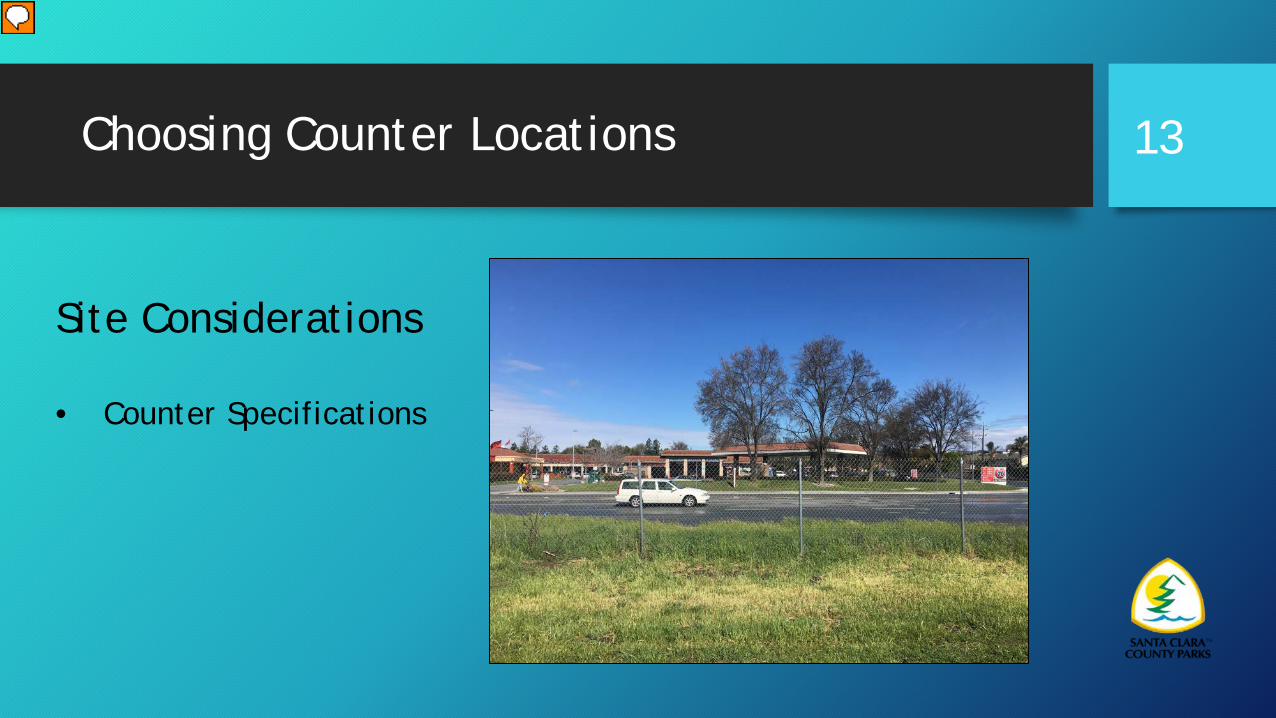
Site Considerations
• Counter Specifications
Presenter
Presentation Notes
Know the range of your counters, view of early site, Branham mistake, Explain how infrareds under count and vehicles over. Trail funnels, back ups of traffic.
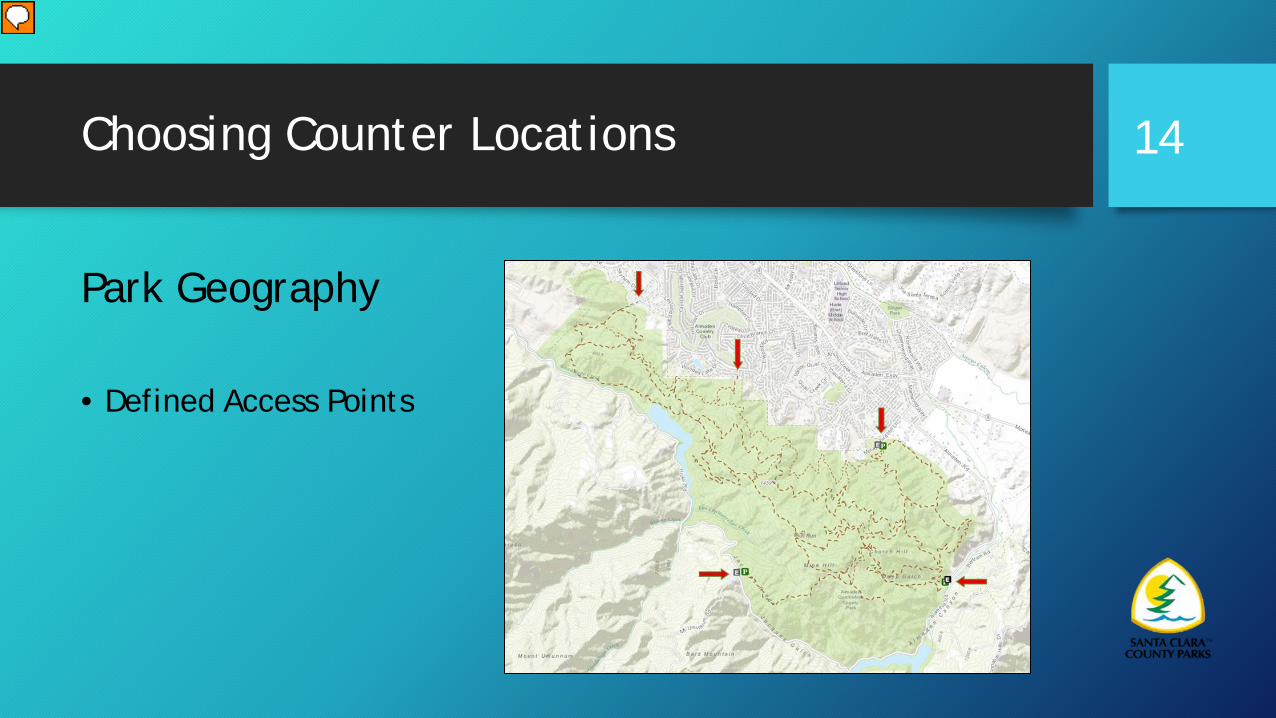
Choosing Counter Locations
Park Geography
• Defined Access Points
14
Presenter
Presentation Notes
What does the layout of the Park give you? AQ example 5 major entrances, set counter divide by 2.
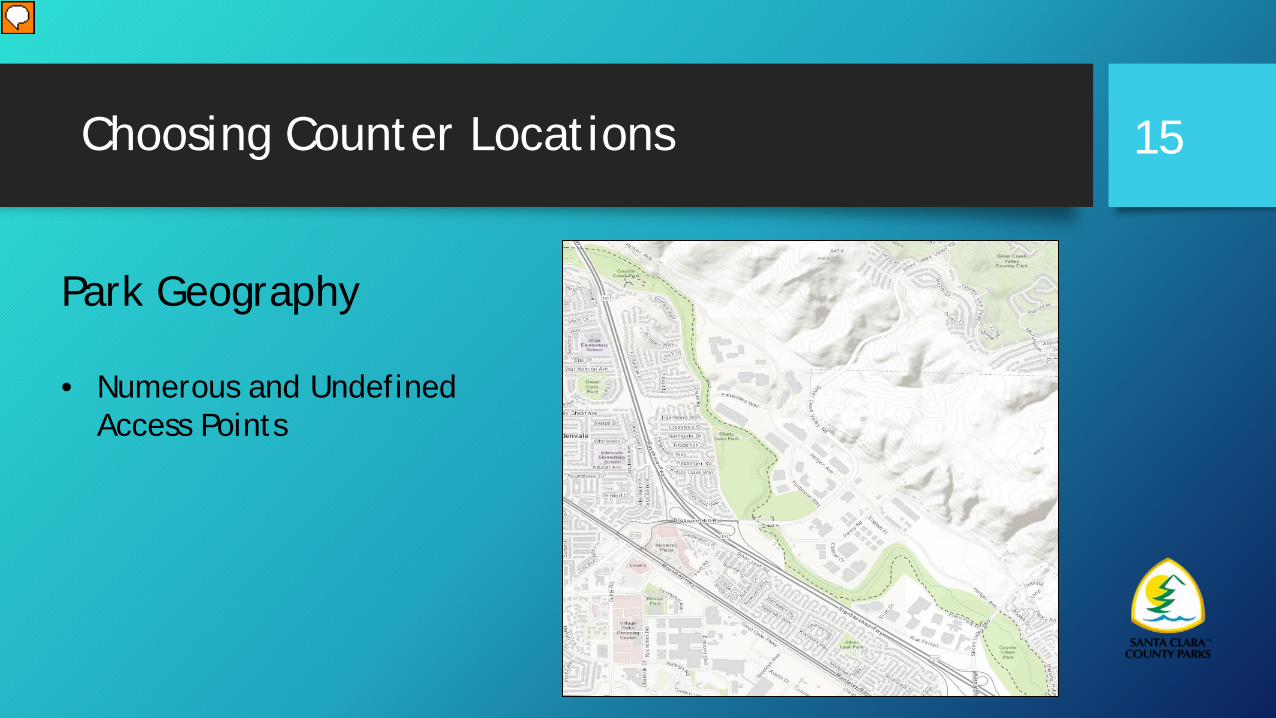
Choosing Counter Locations 15
Park Geography
• Numerous and Undefined Access Points
Presenter
Presentation Notes
Example on park system we manage is the Coyote Creek Trail, over 15 miles of trail passes by residential and business parks numerous entrances very porous and linear park. With an urban park on the north end and park on the south, along with parks of other local agencies along the parkway. Where do place counters. Establish hot spots where most traffic will pass consider counters at different mileage intervals. Discuss 2 park units counters at the boundaries.
Choosing Counter Locations 16
Challenging Parks
• Camping Parks
Presenter
Presentation Notes
Then there is camping parks that are also day use where a visitor in a single visit may trigger multiple counters. Makes interpreting the numbers more difficult. Now you are capturing what the most used locations are. Which is still valuable data but its harder to determine overall visitation. Are breakout session exercise is based upon solving the issue of capturing park visitation in these more challenging parks.
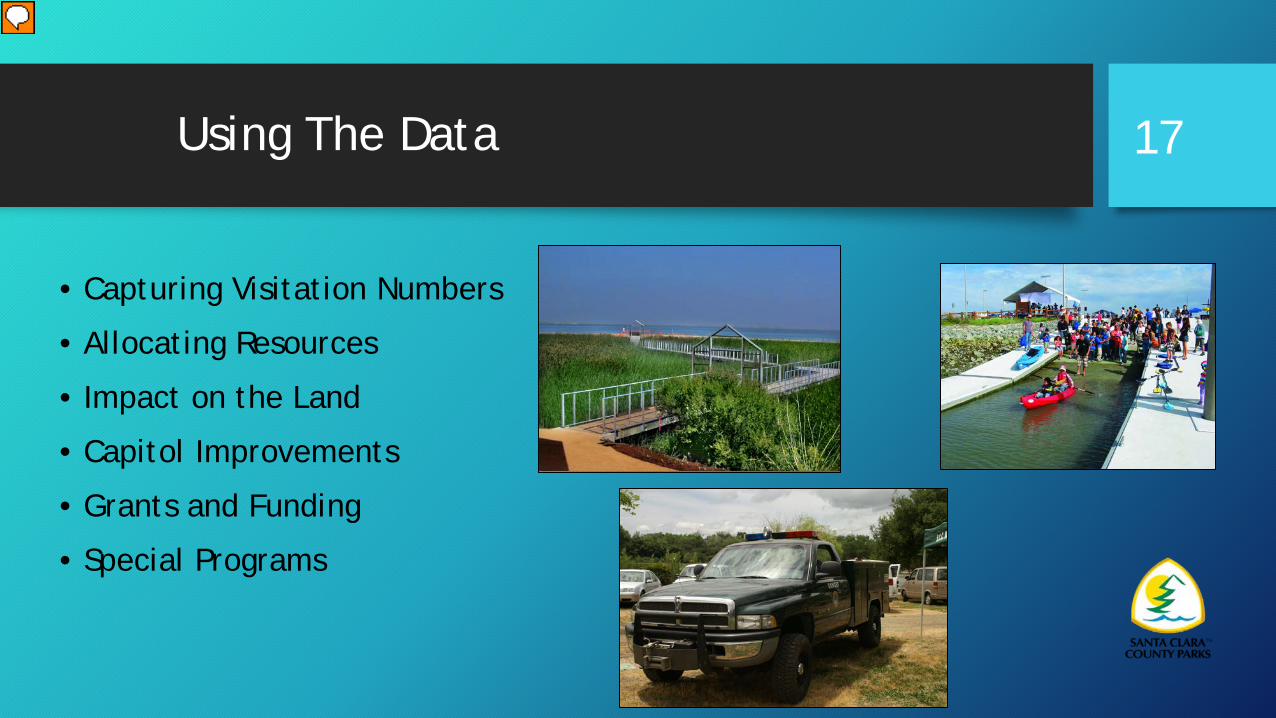
Using The Data
• Capturing Visitation Numbers
• Allocating Resources
• Impact on the Land
• Capitol Improvements
• Grants and Funding
• Special Programs
17
Presenter
Presentation Notes
Greg’ section Key points Number of visitors to the park or site. Staffing schedules, resource allocation NRM considerations, trail maintenance CIP including new trails type of trails, facilities Grants funding Interp programs, where to run surveys
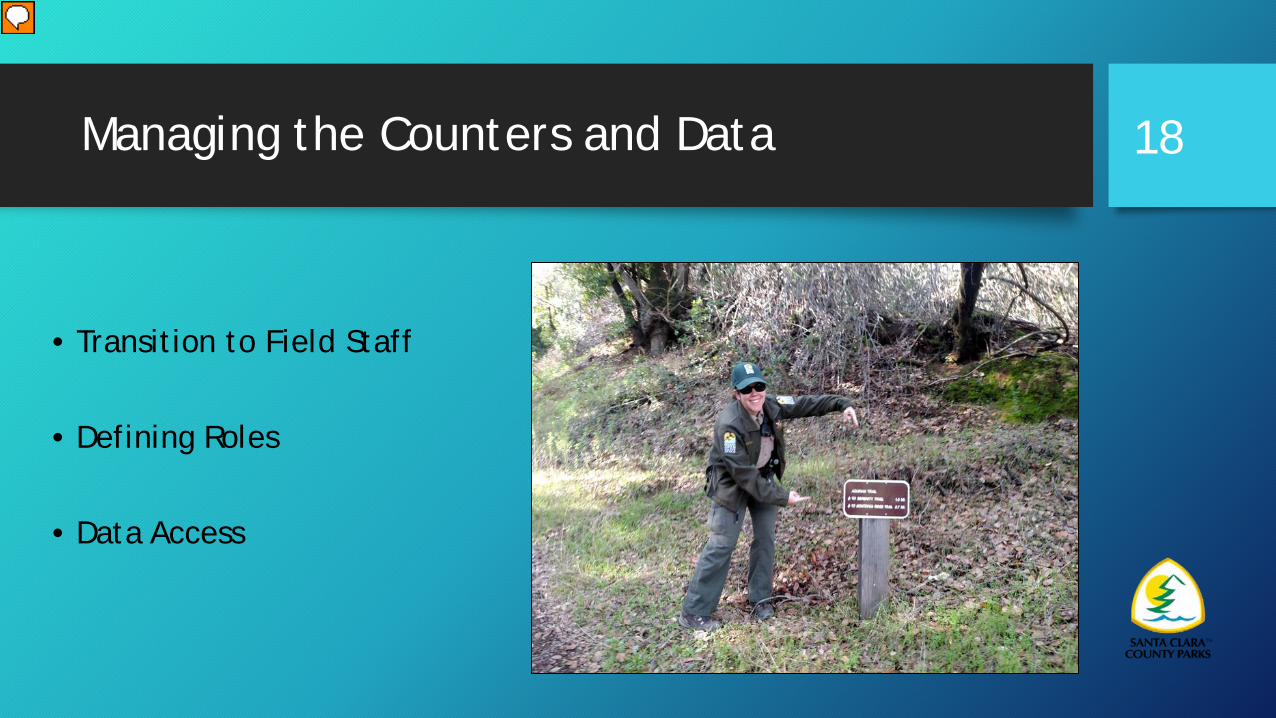
Managing the Counters and Data
• Transition to Field Staff
• Defining Roles
• Data Access
18
Presenter
Presentation Notes
Its important to partner with field staff in collecting data and maintaining the counters. Counter liaison Give them a sense of ownership of the counters. Set policies and procedures, train field staff, support them. Take the time to train the staff and give them an orientation and be available to support them. Data access to each park unit so they can make internal decisions with the data and see the benefit of it. Feedback about kiosk schedules, patrol schedules. Field buys in
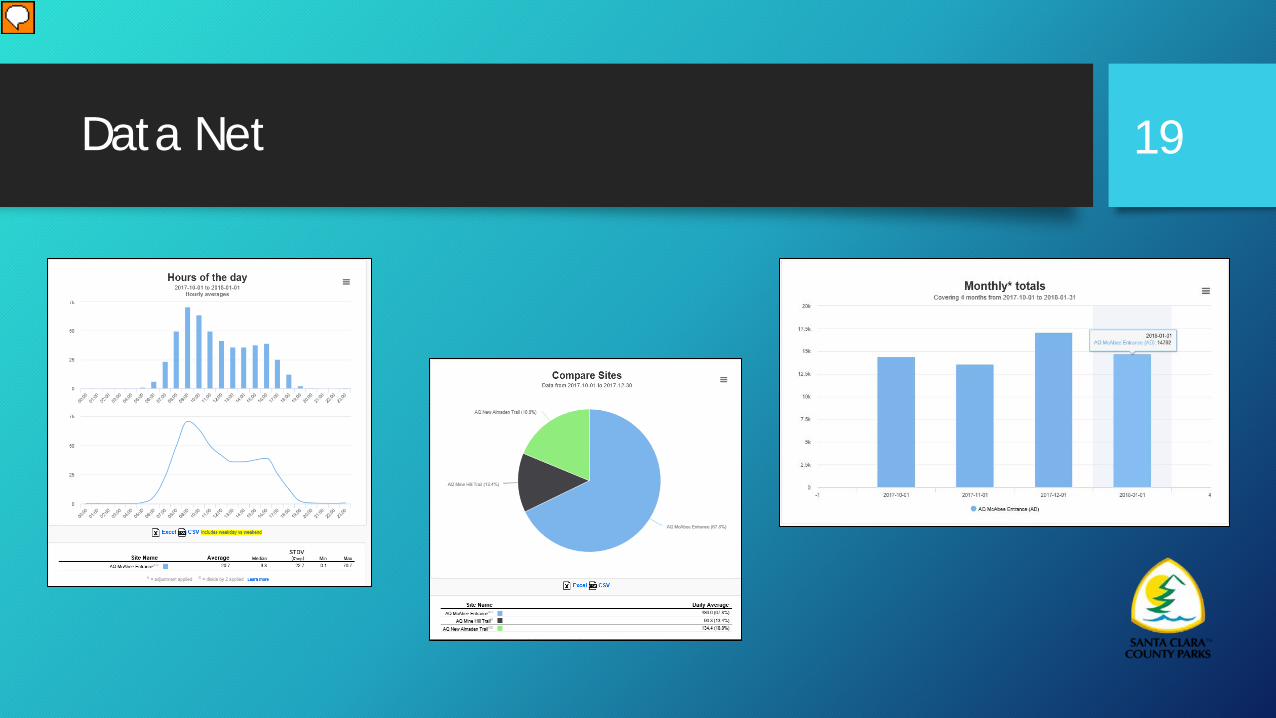
Data Net 19
Presenter
Presentation Notes
Data Net is a cloud based server that generates the raw data into interactive , comprehensive reports.
Data Net
Managing Data Net
• View Sites
• Create Sites
• Build in Factors
• Export Data
20
Presenter
Presentation Notes
On the home page you can view all your sites as well as a map of all your counter locations. Creating a site is easy. Name your site, map its location, add pictures, there is a comment section to for installation notes. You can build multipliers into the data to account for infrareds undercounting and divide the data by 2. filter dates or days of the week in and out of the reports. There are many options to Export your data. It can be raw unfiltered data for an uploaded data set, a single file out of a set, or data from the reports with all the built in factors and filters. The reports can be exported in Excel, CSV, or PDF
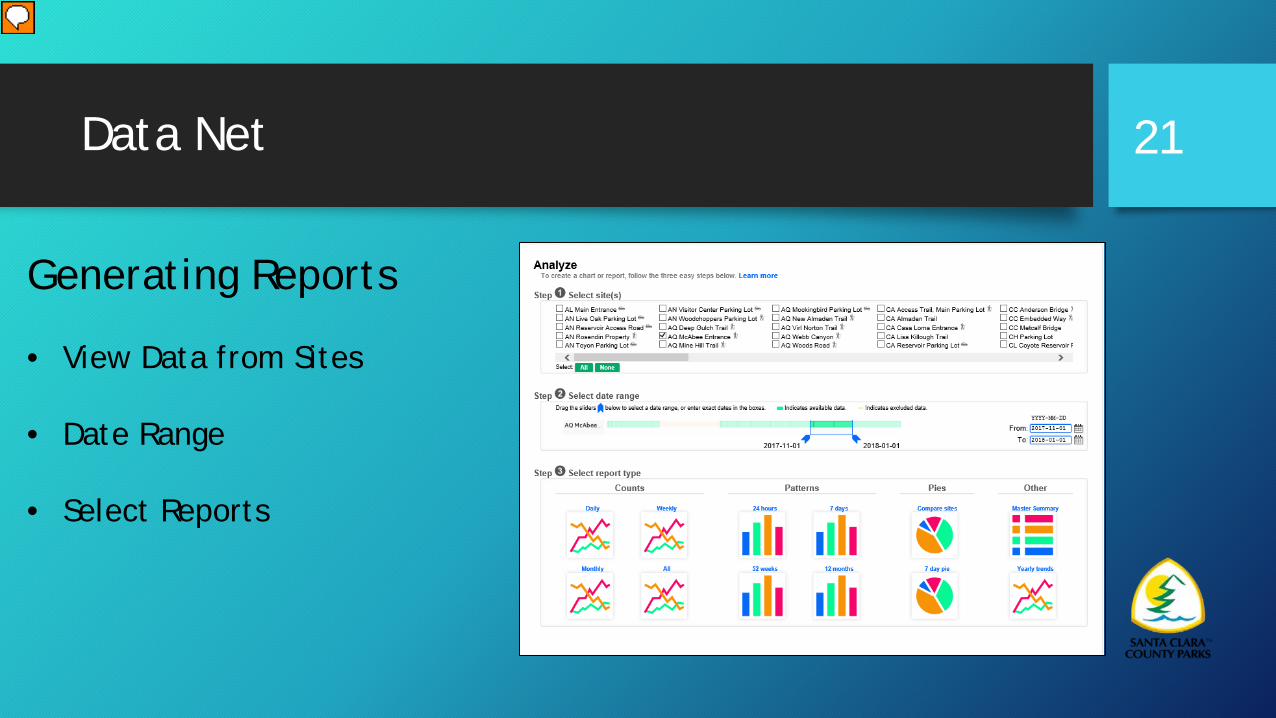
Data Net 21
Generating Reports
• View Data from Sites
• Date Range
• Select Reports
Presenter
Presentation Notes
Here you choose which sites you want to view data from. You can select one or multiple sites. Next set a data range, you can generate your reports based upon the life of the counter from launch to last time data was collected or a specific range. Then select the reports you want to view.
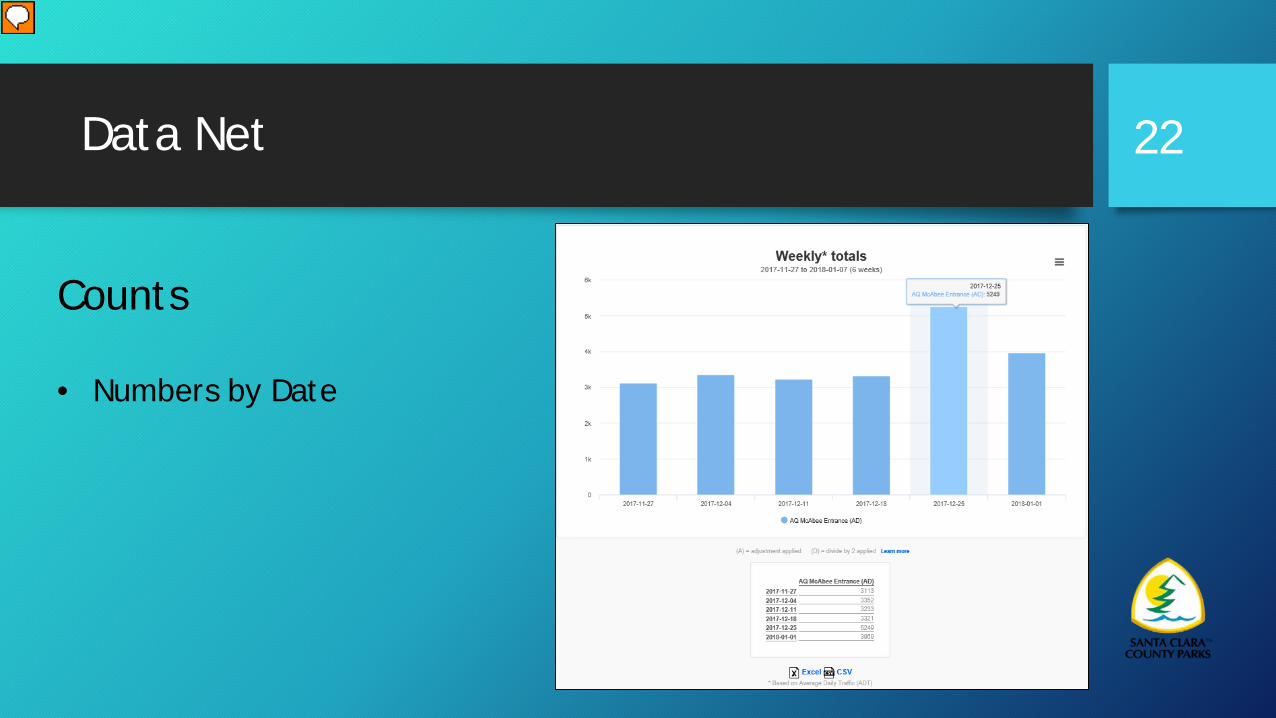
Data Net 22
Counts
• Numbers by Date
Presenter
Presentation Notes
Your counts give you the totals by date, you can choose by Daily, weekly, monthly or generate a report showing all 3. All the graphs are interactive so you can hover your curser over a section the view the stats
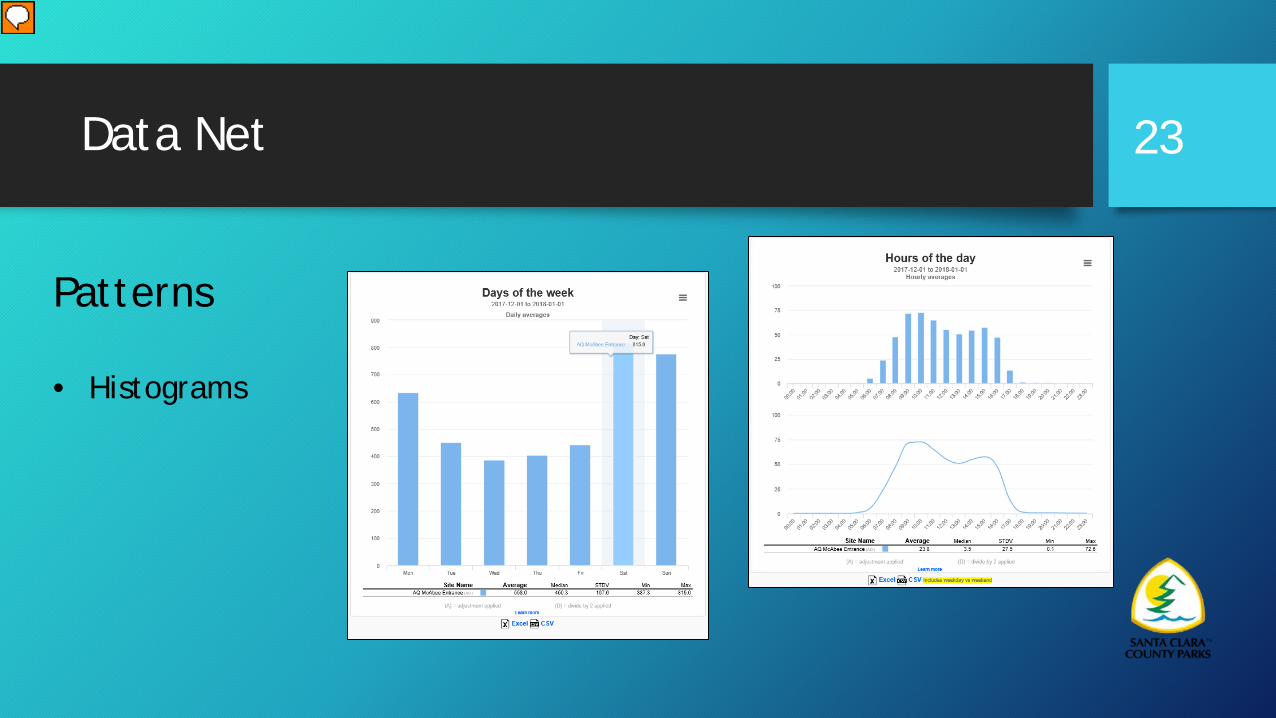
Data Net 23
Patterns
• Histograms
Presenter
Presentation Notes
The Patterns reports are histograms which show the distribution of data within various classes or groups. Here we can view these patterns by hours of the day or days of the week. View your peak times or days and over time compare theses patterns by season.
Data Net 24
Pies
• Multiple Site Viewing
Presenter
Presentation Notes
Useful for viewing data of multiple sites. Comparing visitation of sites within a park or similar sites within a agency. Also can view by days of the week pie.
Data Net
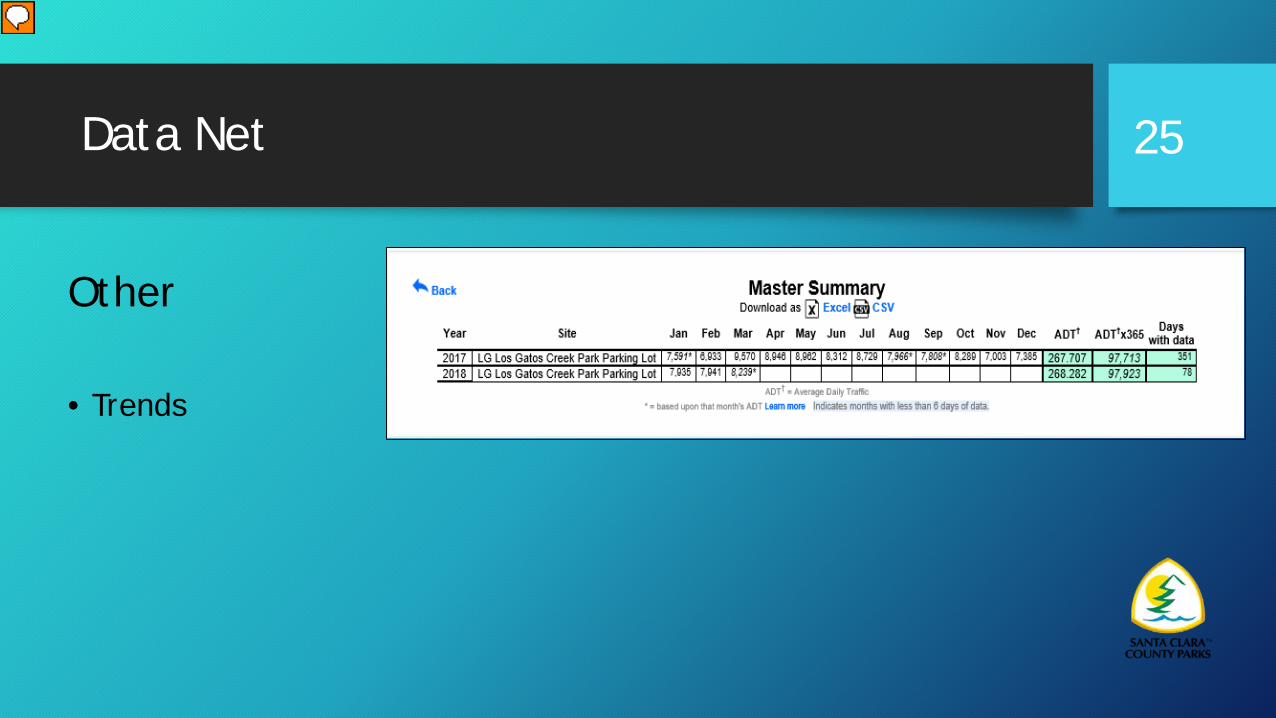
Other
• Trends
25
Presenter
Presentation Notes
These reports lets you view long range trends comparing years and months over time.
Breakout Session 26
Presenter
Presentation Notes
10 min, then discussion of results.
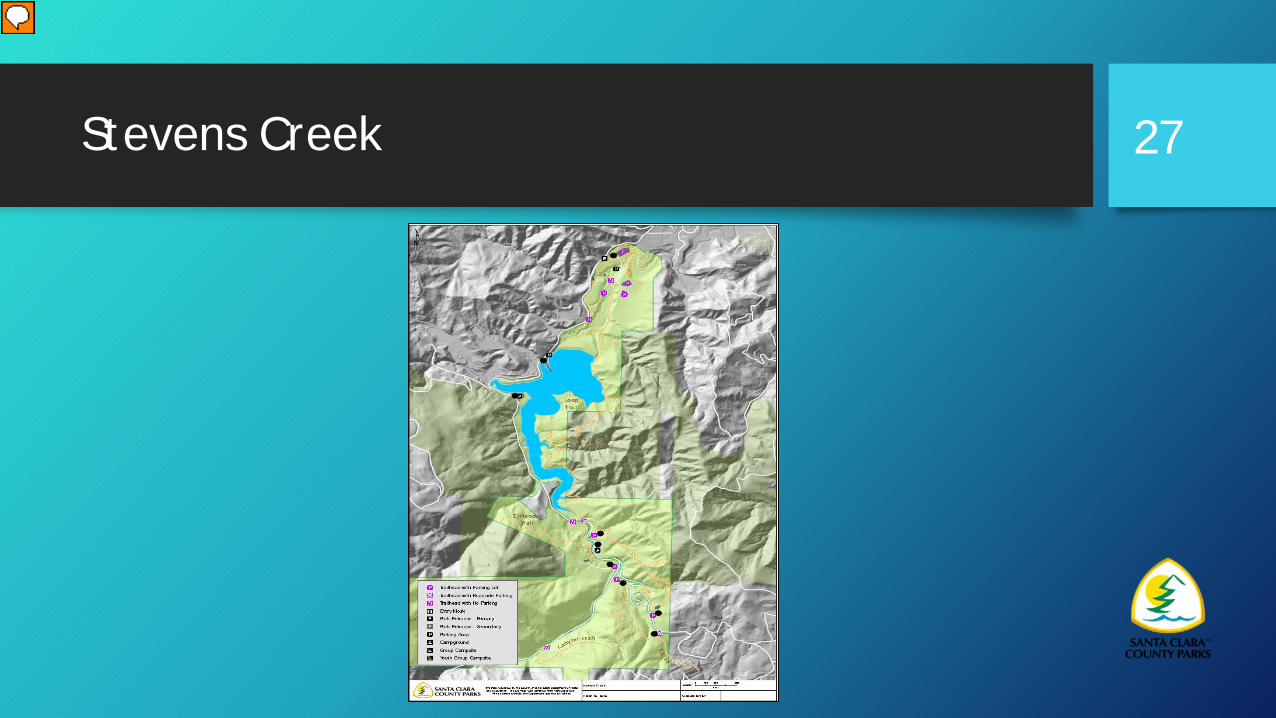
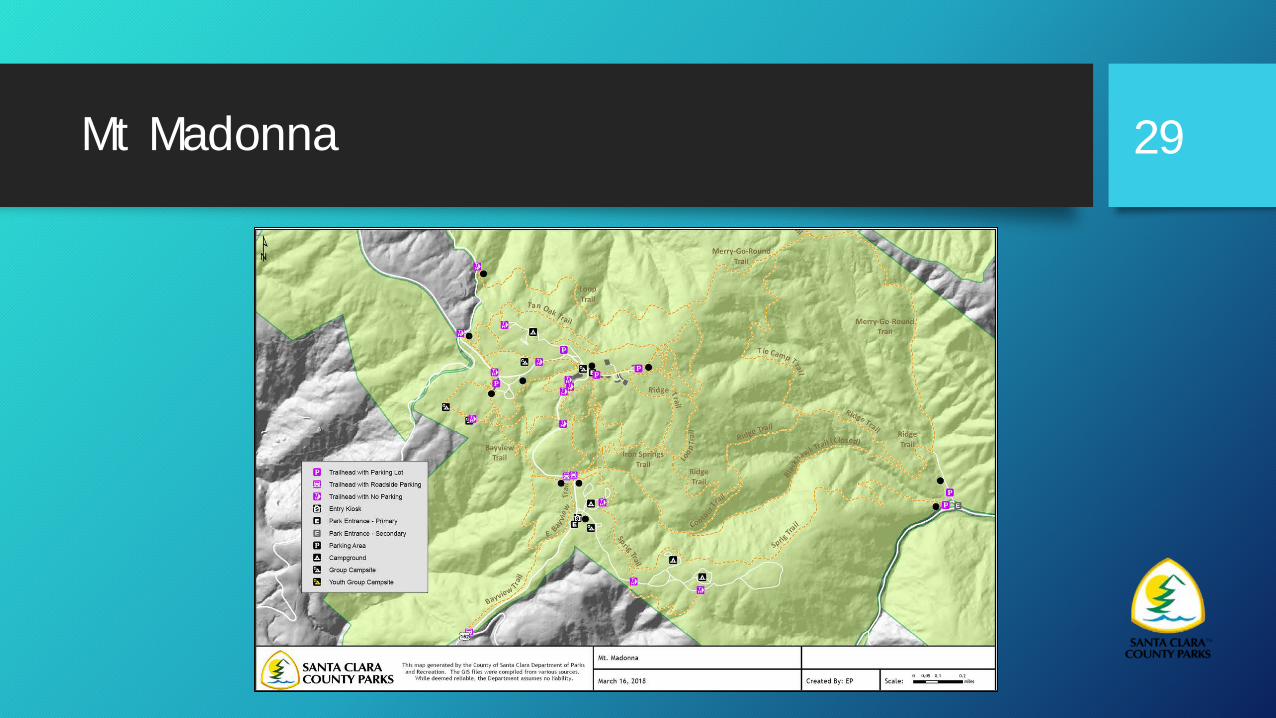
Stevens Creek 27
Presenter
Presentation Notes
Vehicle Counters at the main entrance, boat launch, 5 picnic areas, archery range, roadside trail head.
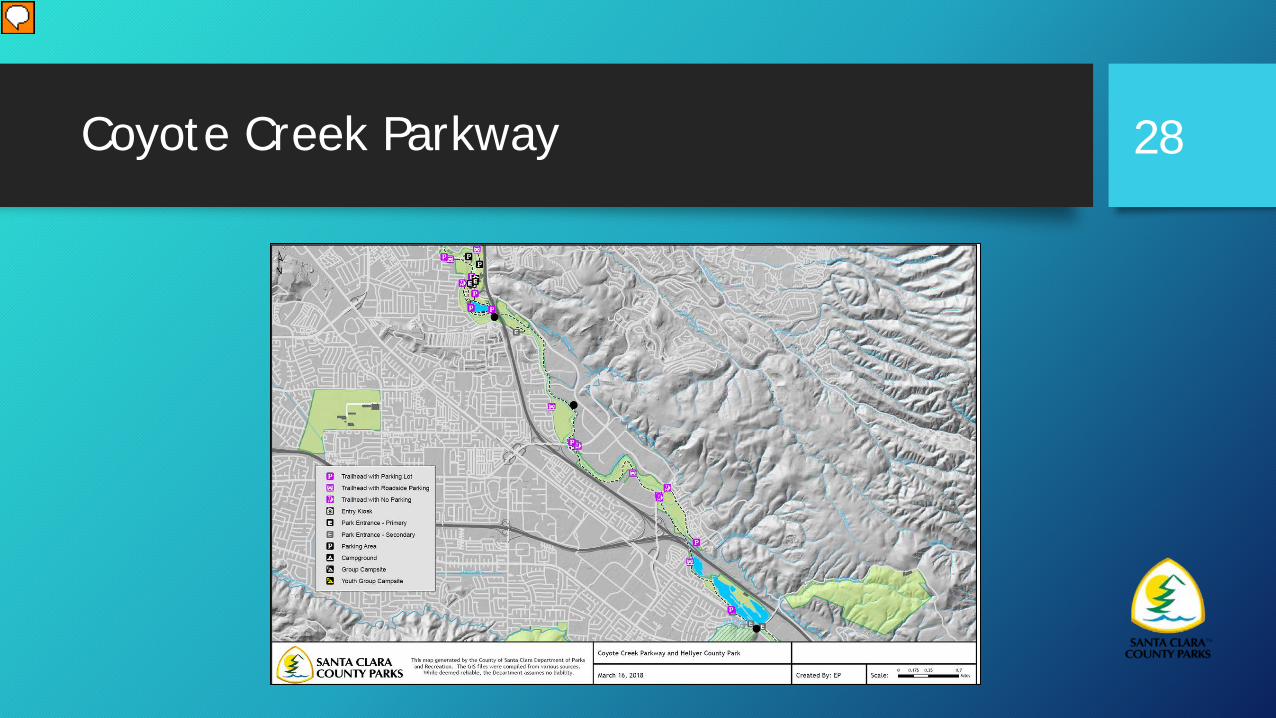
Coyote Creek Parkway 28
Presenter
Presentation Notes
3 infrareds, entering/exiting park to the north, middle of business park, south end of park unit