training and deriving precalculus relations: a s mall- g rou p web
TRANSCRIPT

The Psychological Record, 2012, 62, 225–242
Portions of this paper were presented at the 34th Annual Conference of the Association for Behavior Analysis.
Correspondence concerning this article should be addressed to Chris Ninness, School Psychology Doctoral Program, PO Box 13019 SFA Station, Stephen F. Austin State University, Nacogdoches, TX 75962. E-mail: [email protected]
Training and deriving Precalculus relaTions: a small- grouP, Web- inTeracTive aPProach
Jenny McGinty, Chris Ninness, Glen McCuller, Robin Rumph, Andrea Goodwin, Ginger Kelso, Angie Lopez, and Elizabeth Kelly
Stephen F. Austin State University
A small- group, web- interactive approach to teaching precalculus concepts was investigated. Following an online pretest, 3 participants were given a brief (15 min) presentation on the details of reciprocal math relations and how they op-erate on the coordinate axes. During baseline, participants were tested regard-ing their ability to construct formulas for a diversified series of graphs. This was followed by online, construction- based, small- group training procedures focusing on the construction of mathematical functions and a test of novel re-lations. Participants then received group training in accordance with frames of coordination (same as) and frames of opposition (reciprocal of) formula- to- graph relations. Online assessment indicated that participants showed sub-stantial improvement over baseline and pretest performances. This was true even though, during the tests of novel relations, graphs were displayed with scattered data points instead of solid lines on the coordinate axes. Although one participant was unable to complete the second half of the experiment, we were able to train this small group employing approximately the same number of exposures needed for individual training in previous research. Key words: group training, reciprocal, precalculus, mutual entailment, combinatorial entailment, mathematical relations, four- member relations, construction- based training, matching to sample, relational frame theory
Over the past decade, high school students in the United States have performed sig-nificantly below the mathematical achievement scores of their international peers. For example, outcomes from the 2006 Program for International Student Assessment (PISA) confirmed that U.S. 15-year- olds performed at levels below cohorts from 23 of 30 industri-alized nations (Baldi, Jin, Skemer, Green, & Herget, 2007). Math achievement measures from the Third International Math and Science Study (TIMSS) make it clear that U.S. 12th- grade “advanced students” (ages 17 to 18 years) perform poorly in comparison to students from the 41 other nations in the study. In fact, they fall near the bottom of the international distribution (Schmidt, Houang, & Cogan, 2002). Perhaps relatedly, enroll-ment in university mathematics and science programs continues to fall (National Science Board, 2006).

226 MCGInTy eT al.
For U.S. students to become more mathematically competitive in a global market, teaching methods must be altered to increase the effectiveness with which students learn mathematical concepts. Relational frame theory (RFT) potentially offers methods to increase learning efficacy. From an RFT viewpoint (see Hayes, Barnes- Holmes, & Roche, 2001), once a few relations (among mathematical facts) are taught, others may emerge without additional instruction or reinforcement for correct responding. From this instruc-tional perspective, responding in accordance within a network of stimulus relations incor-porates the properties of mutual entailment, combinatorial entailment, and the transformation of functions. Briefly stated, if Stimulus a is the same as Stimulus B, then the derived relation B same as a is described as being mutually entailed. This property operates in a manner analogous to symmetry (Fienup, Covey, & Critchfield, 2010; Sidman, 1986); however, RFT argues that other types of arbitrarily derived relations may emerge from more flexible and diversified training systems. For example, if a is trained as greater than B, then the relation B less than a may emerge without specific training or reinforce-ment. Such an emergent relation is described as being mutually entailed. In another varia-tion of such learned interactions, if A is trained as the opposite of B, then B opposite of A may emerge as mutually entailed. By this same paradigm, if B is the opposite of C, then C opposite of B is mutually entailed. Taking this notion one step further, given the acquisi-tion of such derived relations within an arbitrarily applicable network of emergent rela-tions, the relations C same as A and A same as C are derived and described within RFT as combinatorial entailed (e.g., Stewart, Barnes- Holmes, Roche, & Smeets, 2001). applied research in RFT appears especially congenial with the development of computer- interactive software aimed at training a variety of mathematical and advanced computa-tional relations (ensley & Kaskosz, 2008; nash, 2007; Peters, 2007).
employing strategies imbedded in RFT, ninness and colleagues (2005b) developed computer- interactive matching- to- sample (MTS) protocols directed at establishing advanced math skills via derived stimulus relations. These protocols have been employed to teach formula- to- graph relations for mathematical transformations about the coordinate axes. In other words, participants were taught to select a formula when presented with a graph or vice versa. after teaching several formula–graph relations, participants were then able to derive relations between novel formulas and graphs. In a subsequent study conducted by ninness and colleagues (2005a), participants were taught to match formula- to- factored- formula and factored- formula- to- graph relations for vertical and horizontal shifts on the coordinate axes. After being taught several relations among formulas, factored formulas, and graphs, the participants could derive relations among novel stimuli. In a later study (ninness et al., 2006), these results were replicated with the addition of altering preference for factored or standard formulas through contexts such as rules and contingent rewards. In all three stud-ies, participants were able to demonstrate derived relations without specific complex- relations training. This is notable because a small number of trained mathematical relations can facili-tate the acquisition of similar concepts without the need for direct training.
More recently, ninness et al. (2009) trained somewhat higher level math concepts entailing same- as relations and opposite- of relations. In addition to matching formulas to graphs and graphs to formulas, participants also matched graphs to the opposite (or recip-rocal) formula and formulas to reciprocal graphs. In this study, similar to all previous studies, tests conducted during baseline and following training were in an MTS format. However, during training, this study also incorporated construction- based responding in which participants were required to construct graphs using computer software and to type formulas when shown graphs. Unlike past research in this area, in this study we conducted group training using a series of online and off- line techniques with an emphasis on face- to- face, direct- instruction strategies.
The protocol in the present study is distinctive from our previous research in three important ways: (1) Most of the current training procedures used an online, web- interactive, construction- based responding protocol in conjunction with MTS selection procedures. (2) Tests of novel relations addressed curve fitting; that is, participants were
227TRAINING ANd dERIvING PRECALCULUS RELATIONS
trained with exemplars in the form of solid- line functions, but because graphical data are often represented as a series of data points rather than solid lines (Sullivan, 2002), novel test stimuli were composed of more challenging scattered dots on the coordinate axes. Some functions were composed of tightly compressed dots resembling the more traditional solid line, while other functions were composed of widely dispersed scattered dots, making their particular patterns much more difficult to identify as a mathematical function. (3) Group responding was employed in an effort to provide math intervention to three students concurrently within a natural classroom environment. In this instance, group responding required students to complete training simultaneously. Training mastery was based on group, rather than individual, performance.
The present study aimed at translating (Mace & Critchfield, 2010) our previous exper-imental preparations to a more natural classroom context. That is, it was our ambition to develop a small- group RFT math protocol utilizing the amount of time and labor previously employed to train complex concepts to participants individually (e.g., ninness et al., 2009). Currently, all of our protocols are freely accessible to interested users (and math and statis-tics instructors) on a dedicated faculty server at http://www.faculty.sfasu.edu/ninnessherbe/chris_ninness.htm. For this particular precalculus training protocol (http://www.faculty.sfasu.edu/ninnessherbe/construction_based_08_exp.html) and the gray-scale version (http://www.facultysfasu.edu/ninnessherbe/construction_based_10_exp.html), a simple but specific sequence of data- entry procedures is required in order to employ the online scoring system. Our scoring procedures are available from the second author upon request; however, our user- interactive training software can be employed easily without using the scoring system.
method
Participants and setting Three female college students (ages 21, 22, and 26 years) were recruited from various
academic disciplines by way of agreements to provide extra credit and financial compensa-tion for engaging in university- based research projects. Participants received five test points on their final examinations for their involvement in the study. additionally, each participant could earn $1.00 per correct response during the novel relations assessment (maximum $24.00). Upon study completion, participants were debriefed and reimbursed accordingly (two out of three participants completed the full experiment). Following informed consent, an online pretest was administered to determine participants’ skill levels with respect to identifying six basic precalculus graphical functions. Participants attempted to construct (type) mathematical formulas corresponding to graphical displays. Individuals who were able to correctly construct any of the six pretest formulas were excused from the study. none of the participants had any specific recollection of prior exposure to the subject matter addressed within this study, and none of the participants produced an approximation of a correct formula during the pretest condition. Prior to the first baseline session, students were exposed to a pretraining MTS protocol aimed at train-ing the basic formula- to- graph relations for sine, cosine, secant, and cosecant. Pretesting and pretraining were completed prior to initiating any other components of the experiment. The study entailed two sessions, each of which required approximately 90 min, with a 45-min break between sessions. all sessions took place in a university classroom.
apparatus and softwareIn pretesting, training and assessment were conducted using MTS procedures.
Training, testing, and response recordings were controlled by software written by the second author in Microsoft Visual Basic and adobe actionScript 2.0 (see ensley & Kaskosz, 2008, for a discussion and assistive tutorial on graphing mathematical
228 MCGInTy eT al.
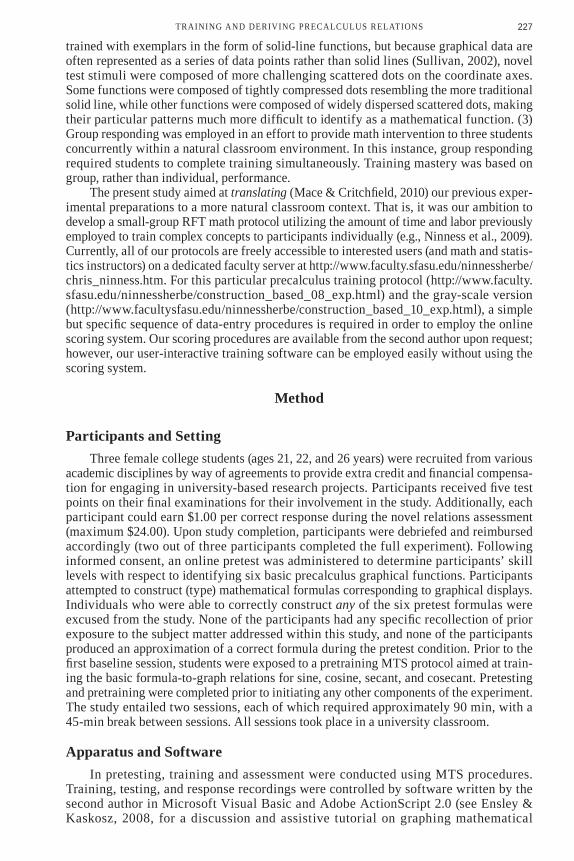
expressions using actionScript software techniques). Our online training protocols were developed in an effort to generate complex novel graphing functions. Figure 1 illustrates a graph where y = cos(x) – 4, representing one of the six test functions employed during the first baseline condition.
Figure 1. Construction-based responding and scoring. X’s above each pretest and baseline item (F1–F12) indicate errors. This pattern of continuous errors was exhibited by all three participants throughout pretesting (F1–F6) and baseline assessments (F7–F12).
The online interactive software displayed formulas and graphs and monitored the accuracy of participant responses. although not visible to the participants, errors were recorded automatically by the system. The computer’s data compilation was confirmed prior to initiating all experimental sessions. Three 15-in. laptop computers, each connected to 21-in. secondary monitors and infrared wireless mice, were aligned along the front row of the classroom. The secondary monitors faced away from the participants and toward the experimenter, such that the experimenter was able to observe each participant’s perfor-mance as the study progressed. The classroom was equipped with an overhead elmo pro-jector, allowing the experimenter’s laptop to display the software training program on a 15-ft overhead screen located at the front of the classroom.
design and ProcedureDuring the first baseline condition, participants were assessed regarding their ability
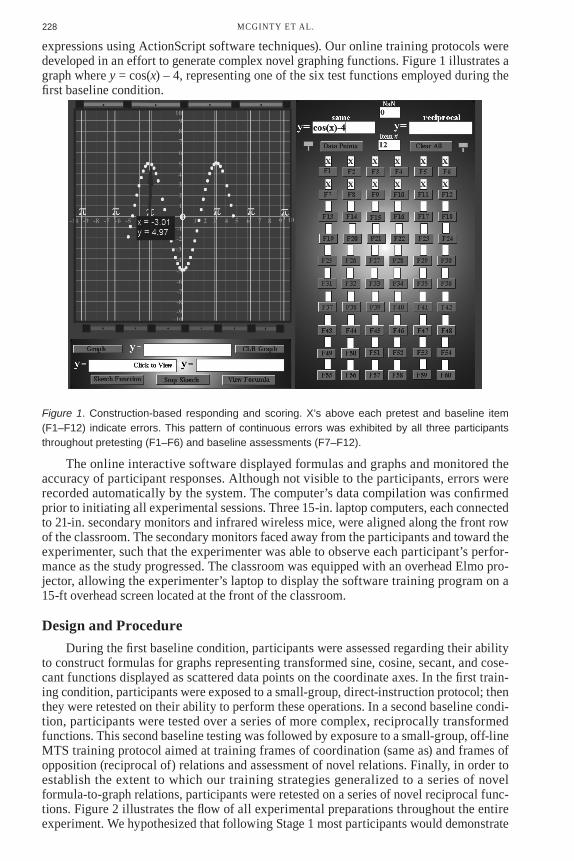
to construct formulas for graphs representing transformed sine, cosine, secant, and cose-cant functions displayed as scattered data points on the coordinate axes. In the first train-ing condition, participants were exposed to a small- group, direct- instruction protocol; then they were retested on their ability to perform these operations. In a second baseline condi-tion, participants were tested over a series of more complex, reciprocally transformed functions. This second baseline testing was followed by exposure to a small- group, off- line MTS training protocol aimed at training frames of coordination (same as) and frames of opposition (reciprocal of) relations and assessment of novel relations. Finally, in order to establish the extent to which our training strategies generalized to a series of novel formula- to- graph relations, participants were retested on a series of novel reciprocal func-tions. Figure 2 illustrates the flow of all experimental preparations throughout the entire experiment. We hypothesized that following Stage 1 most participants would demonstrate
229TRAINING ANd dERIvING PRECALCULUS RELATIONS
a marked improvement in their ability to construct formulas associated with various types of graphical representations of cosine and sine functions, but that they would encounter difficulty during a second series of tests in Baseline 2 when exposed to a novel series of reciprocal functions. We further hypothesized that participants would improve dramati-cally following the training provided in Stage 3 and Stage 4.
Pretest
Stage 1Pretraining Coordinate AxesPositive/Negative Forms of
Trigonometric Functions
Baseline 1Assessment of Transformations
Stage 2Online Training/Testing
of Amplitude andFrequency
Transformations
Test Novel Relations Addressing Amplitude/Frequency Transformations
Step 1: Coordinate AxesStep 2: Define ReciprocalStep 3: Positive/Negative Sin, Cos, Sec, Csc
Step 1: Train/Test Cos Amplitude StretchStep 2: Train/Test Cos Amplitude CompressStep 3: Train/Test Cos Frequency CompressStep 4: Train/Test Cos Frequency StretchStep 5: Train/Test Sec Amplitude StretchStep 6: Train/Test Sec Amplitude CompressStep 7: Train/Test Sec Frequency CompressStep 8: Train/Test Sec Frequency Stretch
Step 1: Train/Test A1–B1 cos (x) reciprocal of 1/cos (x)Step 2: Train/Test B1–C1 1/cos (x) same as sec (x)Step 3: Train/Test C1–D1 sec (x) same as graphStep 4: Test D1–C1, C1–B1, B1–A1, B1–D1 Test D1–B1, A1–D1, D1–A1, A1–C1, C1–A1
Step 1: Train/Test A2–B2 sin (x) reciprocal of 1/csc (x)Step 2: Train/Test B2–C2 1/sin (x) same as csc (x)Step 3: Train/Test C2–D2 sin (x) same as graphStep 4: Test D2–C2, C2–B2, B2–A2, B2–D2 Test D2–B2, A2–D2, D2–A2, A2–C2, C2–A2
Baseline 2Assessment of
Reciprocal Transformations
Stage 3Training and Testing of
Cosine and Secant Reciprocals Relations
Stage 4Training and Testing of
Sine and CosecantReciprocals Relations
Test Novel RelationsAddressing
Amplitude/FrequencyReciprocal Transformations
Figure 2. Flowchart indicating the sequence of testing and training procedures.

230 MCGInTy eT al.
Pretest. during a six- item pretest, the experimenter asked each participant to con-struct (type) a formula consistent with a graphical representation of a precalculus function (the F1–F6 buttons on Figure 1). Graphs were displayed as a stream of data points forming a sine, cosine, secant, or cosecant function. These were transformed when the argument of the function or the entire function was multiplied and/or divided by a series of new values, causing the functions to compress and/or stretch along the x or y axis. (See Table 1 for a complete listing of all formulas employed in the experiment.)Table 1Formulas Employed During Pretest, Baseline 1, Tests of Novel Relations, Baseline 2, and Posttreatment Test
Pretest
F1: y = 3*sin(x) F2: y = .5*sin(2*x) F3: y = .5*cos(.5*x)
F4: y = −4*cos(2*x) F5: y = −sin(x) F6: y = −4*cos(2*x)
Baseline 1
F7: y = −.5*cos(.5*x) F8: y = −2*cos(x) F9: y = −2*sin(x)
F10: y = 3*sin(x) F11 y = cos(.5*x) F12: y = −5*cos(x)
Test of novel relations addressing amplitude/frequency transformations
F13: y = −5*sin(x*.5) F14: y = 4*cos(2*x) F15: y = −3*sin(x) F16: y = 4*sin(x)
F17: y = −5*sin(x*.5) F18: y = −.5*sin(2*x) F19: y = −2*sin(2*x) F20: y = 2*cos(x)
F21: y = −4*sin(x*2) F22: y = 2*sin(x*2) F23: y = −4*sin(x) F24: y = 4*cos(.5*x)
Baseline 2
F25: y = 1/cos(x*2) F26: y = −1/cos(x*2) F27: y = −1/cos(x)
F28: y = 1/sin(x) F29: y = 3/−sin(x*2) F30: y = 4/sin(2*x)
Posttreatment Test
F31: y = 1/cos(x) F32: y = −1/sin(x) F32: y = −1/sin(x*.5) F33: y = 3/cos(x*2)
F35: y = .5/cos(x) F36: y = 3/sin(x*2) F37: y = 1/sin(.5*x) F38: y = −2/cos(x)
F39: y = −4*sin(2*x) F40: y = −sin(.5*x) F41: y = 4/−sin(x) F42: y = −2/cos(.5*)
Note. Each formula represents a training step employed during the experiment. None of the participants constructed formulas consistent with the above pretest formulas. Two of the six pretest graphs (F4 and F6) are illustrated in Figure 3.
stage 1. Steps 1 and 2 of pretraining were conducted as a conventional didactic math lesson focusing on the transformations of precalculus functions. During Step 1, partici-pants were exposed to a brief lecture regarding the basic operations sine (sin), cosine (cos), secant (sec), and cosecant (csc) and how these functions appear on the coordinate axes. during Step 2, an explanation and PowerPoint illustration of reciprocal relations was pro-vided. In Step 3, participants were pretrained regarding positive and negative forms of sin, cos, sec, and csc functions. also, during this step, MTS procedures were employed as participants were trained and tested on A–B and B–C trigonometric relations, mutually entailed (B–a and C–B) relations, and combinatorially entailed (a–C and C–a) relations. Participants attempted to match a sample with one of six comparison items. according to the criteria of Stage 1, each participant was required to identify all relations correctly, including where the functions fell on the coordinate axes and how they transformed under influence of changes in frequency and amplitude. any error in matching resulted in the retraining of all participants. The objective of pretraining was to provide the prerequisite skills needed to perform trigonometric operations associated with cosine and secant and
231TRAINING ANd dERIvING PRECALCULUS RELATIONS
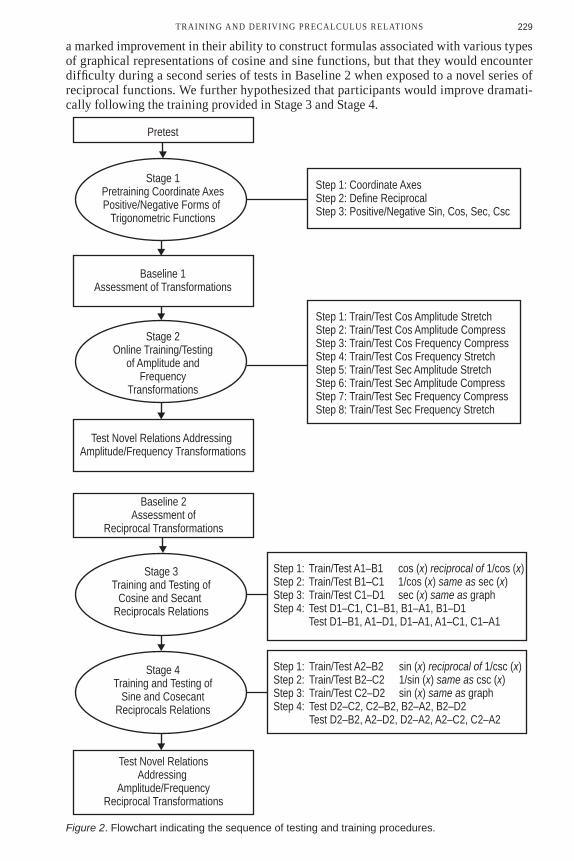
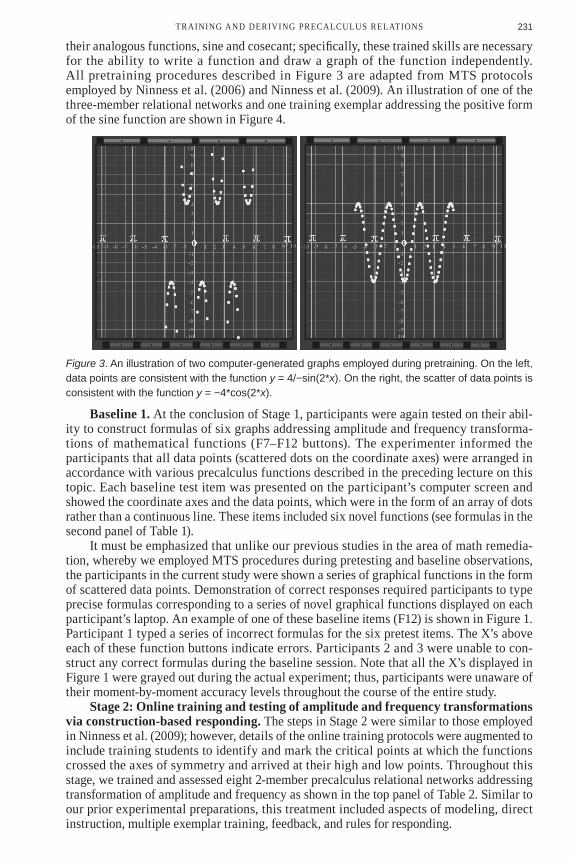
their analogous functions, sine and cosecant; specifically, these trained skills are necessary for the ability to write a function and draw a graph of the function independently. all pretraining procedures described in Figure 3 are adapted from MTS protocols employed by ninness et al. (2006) and ninness et al. (2009). an illustration of one of the three- member relational networks and one training exemplar addressing the positive form of the sine function are shown in Figure 4.
Figure 3. An illustration of two computer-generated graphs employed during pretraining. On the left, data points are consistent with the function y = 4/−sin(2*x). On the right, the scatter of data points is consistent with the function y = −4*cos(2*x).
baseline 1. At the conclusion of Stage 1, participants were again tested on their abil-ity to construct formulas of six graphs addressing amplitude and frequency transforma-tions of mathematical functions (F7–F12 buttons). The experimenter informed the participants that all data points (scattered dots on the coordinate axes) were arranged in accordance with various precalculus functions described in the preceding lecture on this topic. each baseline test item was presented on the participant’s computer screen and showed the coordinate axes and the data points, which were in the form of an array of dots rather than a continuous line. These items included six novel functions (see formulas in the second panel of Table 1).
It must be emphasized that unlike our previous studies in the area of math remedia-tion, whereby we employed MTS procedures during pretesting and baseline observations, the participants in the current study were shown a series of graphical functions in the form of scattered data points. Demonstration of correct responses required participants to type precise formulas corresponding to a series of novel graphical functions displayed on each participant’s laptop. an example of one of these baseline items (F12) is shown in Figure 1. Participant 1 typed a series of incorrect formulas for the six pretest items. The X’s above each of these function buttons indicate errors. Participants 2 and 3 were unable to con-struct any correct formulas during the baseline session. note that all the X’s displayed in Figure 1 were grayed out during the actual experiment; thus, participants were unaware of their moment- by- moment accuracy levels throughout the course of the entire study.
stage 2: online training and testing of amplitude and frequency transformations via construction- based responding. The steps in Stage 2 were similar to those employed in ninness et al. (2009); however, details of the online training protocols were augmented to include training students to identify and mark the critical points at which the functions crossed the axes of symmetry and arrived at their high and low points. Throughout this stage, we trained and assessed eight 2-member precalculus relational networks addressing transformation of amplitude and frequency as shown in the top panel of Table 2. Similar to our prior experimental preparations, this treatment included aspects of modeling, direct instruction, multiple exemplar training, feedback, and rules for responding.

232 MCGInTy eT al.
Figure 4. The top panel shows the basic sine function, where A1 illustrates sine in standard form, B1 illustrates the sine function when multiplied by a negative one coefficient, and C1 is the graphical representation of both formulas addressing this function. The bottom panel illustrates one of the matching-to-sample exemplars employed during pretraining and testing of these formula-to-graph relations.
108642
−2−4−6−8
−10
−10 −8 −6 −4 −2 2 4 6 8 10
Combinatorially EntailedMutually Entailed
Mutually Entailed
A1
B1
C1
y = −sin(−x)
y = sin (x)
−10 −8 −6 −4 −2 2 4 6 8 10
108642
−2−4−6−8
−10
−10 −8 −6 −4 −2 2 4 6 8 10
108642
−2−4−6−8
−10
−10 −8 −6 −4 −2 2 4 6 8 10
108642
−2−4−6−8
−10
−10 −8 −6 −4 −2 2 4 6 8 10
108642
−2−4−6−8
−10
−10 −8 −6 −4 −2 2 4 6 8 10
108642
−2−4−6−8
−10
−10 −8 −6 −4 −2 2 4 6 8 10
108642
−2−4−6−8
−10
y = sin (x)
A B
C D
E F
233TRAINING ANd dERIvING PRECALCULUS RELATIONS
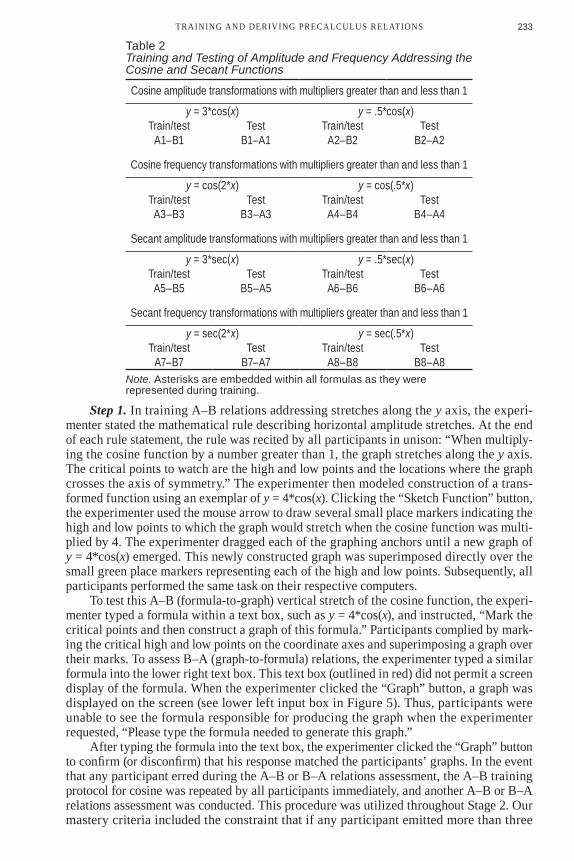
Table 2 Training and Testing of Amplitude and Frequency Addressing the Cosine and Secant Functions
Cosine amplitude transformations with multipliers greater than and less than 1
y = 3*cos(x) y = .5*cos(x)Train/test Test Train/test Test
A1–B1 B1–A1 A2–B2 B2–A2
Cosine frequency transformations with multipliers greater than and less than 1
y = cos(2*x) y = cos(.5*x)Train/test Test Train/test TestA3–B3 B3–A3 A4–B4 B4–A4
Secant amplitude transformations with multipliers greater than and less than 1
y = 3*sec(x) y = .5*sec(x)Train/test Test Train/test TestA5–B5 B5–A5 A6–B6 B6–A6
Secant frequency transformations with multipliers greater than and less than 1
y = sec(2*x) y = sec(.5*x)Train/test Test Train/test Test
A7–B7 B7–A7 A8–B8 B8–A8Note. Asterisks are embedded within all formulas as they were represented during training.
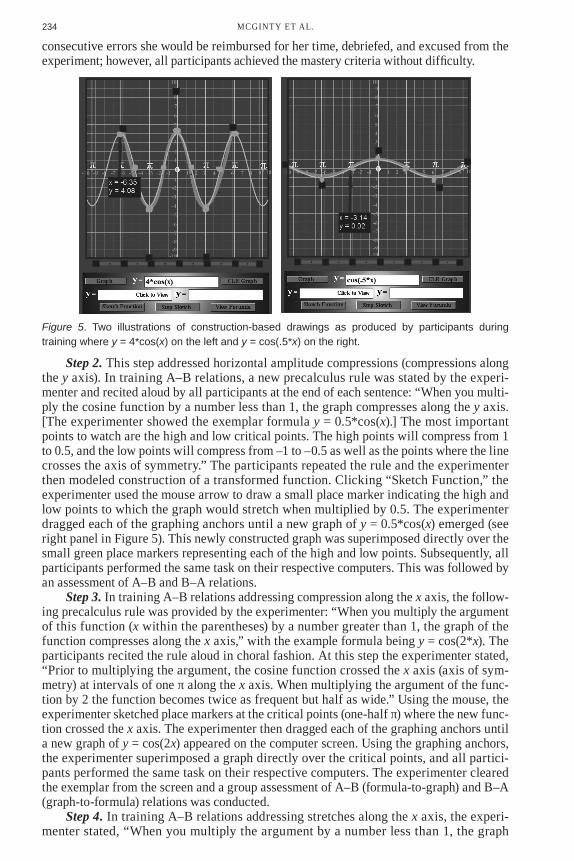
Step 1. In training A–B relations addressing stretches along the y axis, the experi-menter stated the mathematical rule describing horizontal amplitude stretches. at the end of each rule statement, the rule was recited by all participants in unison: “When multiply-ing the cosine function by a number greater than 1, the graph stretches along the y axis. The critical points to watch are the high and low points and the locations where the graph crosses the axis of symmetry.” The experimenter then modeled construction of a trans-formed function using an exemplar of y = 4*cos(x). Clicking the “Sketch Function” button, the experimenter used the mouse arrow to draw several small place markers indicating the high and low points to which the graph would stretch when the cosine function was multi-plied by 4. The experimenter dragged each of the graphing anchors until a new graph of y = 4*cos(x) emerged. This newly constructed graph was superimposed directly over the small green place markers representing each of the high and low points. Subsequently, all participants performed the same task on their respective computers.
To test this A–B (formula- to- graph) vertical stretch of the cosine function, the experi-menter typed a formula within a text box, such as y = 4*cos(x), and instructed, “Mark the critical points and then construct a graph of this formula.” Participants complied by mark-ing the critical high and low points on the coordinate axes and superimposing a graph over their marks. To assess B–a (graph- to- formula) relations, the experimenter typed a similar formula into the lower right text box. This text box (outlined in red) did not permit a screen display of the formula. When the experimenter clicked the “Graph” button, a graph was displayed on the screen (see lower left input box in Figure 5). Thus, participants were unable to see the formula responsible for producing the graph when the experimenter requested, “Please type the formula needed to generate this graph.”
After typing the formula into the text box, the experimenter clicked the “Graph” button to confirm (or disconfirm) that his response matched the participants’ graphs. In the event that any participant erred during the A–B or B–A relations assessment, the A–B training protocol for cosine was repeated by all participants immediately, and another A–B or B–A relations assessment was conducted. This procedure was utilized throughout Stage 2. Our mastery criteria included the constraint that if any participant emitted more than three
234 MCGInTy eT al.
consecutive errors she would be reimbursed for her time, debriefed, and excused from the experiment; however, all participants achieved the mastery criteria without difficulty.
Figure 5. Two illustrations of construction-based drawings as produced by participants during training where y = 4*cos(x) on the left and y = cos(.5*x) on the right.
Step 2. This step addressed horizontal amplitude compressions (compressions along the y axis). In training a–B relations, a new precalculus rule was stated by the experi-menter and recited aloud by all participants at the end of each sentence: “When you multi-ply the cosine function by a number less than 1, the graph compresses along the y axis. [The experimenter showed the exemplar formula y = 0.5*cos(x).] The most important points to watch are the high and low critical points. The high points will compress from 1 to 0.5, and the low points will compress from –1 to –0.5 as well as the points where the line crosses the axis of symmetry.” The participants repeated the rule and the experimenter then modeled construction of a transformed function. Clicking “Sketch Function,” the experimenter used the mouse arrow to draw a small place marker indicating the high and low points to which the graph would stretch when multiplied by 0.5. The experimenter dragged each of the graphing anchors until a new graph of y = 0.5*cos(x) emerged (see right panel in Figure 5). This newly constructed graph was superimposed directly over the small green place markers representing each of the high and low points. Subsequently, all participants performed the same task on their respective computers. This was followed by an assessment of a–B and B–a relations.
Step 3. In training A–B relations addressing compression along the x axis, the follow-ing precalculus rule was provided by the experimenter: “When you multiply the argument of this function (x within the parentheses) by a number greater than 1, the graph of the function compresses along the x axis,” with the example formula being y = cos(2*x). The participants recited the rule aloud in choral fashion. at this step the experimenter stated, “Prior to multiplying the argument, the cosine function crossed the x axis (axis of sym-metry) at intervals of one π along the x axis. When multiplying the argument of the func-tion by 2 the function becomes twice as frequent but half as wide.” Using the mouse, the experimenter sketched place markers at the critical points (one- half π) where the new func-tion crossed the x axis. The experimenter then dragged each of the graphing anchors until a new graph of y = cos(2x) appeared on the computer screen. Using the graphing anchors, the experimenter superimposed a graph directly over the critical points, and all partici-pants performed the same task on their respective computers. The experimenter cleared the exemplar from the screen and a group assessment of A–B (formula- to- graph) and B–A (graph- to- formula) relations was conducted.
Step 4. In training A–B relations addressing stretches along the x axis, the experi-menter stated, “When you multiply the argument by a number less than 1, the graph

235TRAINING ANd dERIvING PRECALCULUS RELATIONS
stretches along the x axis,” with the example formula being y = cos(0.5*x). The experi-menter marked the critical points where the curve crossed the x axis and marked high and low points illustrating that when the argument of a function is multiplied by 0.5, the func-tion becomes half as frequent but stretches to twice its length. as in the previous steps, the experimenter superimposed a line over the critical points and proceeded to conduct a group assessment of a–B and B–a relations (see right panel of Figure 5).
Steps 5 through 8. Steps 5 through 8, which addressed secant, were trained in a format identical to Steps 1 through 4 addressing cosine. Thus, they are not discussed here in detail; however, they are presented as part of the training steps shown in Table 1. Since the sine and cosecant functions transform in a manner analogous to the cosine and secant functions, these were not trained using any of the above steps. Students were simply informed that the mathematical transformations of these functions occurred in a manner that was the same as the cosine and secant functions.
Fidelity of graph and formula constructions. during Stage 2 training and testing, the accuracy of the participant’s constructed graph was determined by visually comparing it to the computer- generated graph of each function. The experimenter and a second observer independently examined each graph and formula construction. If both the experi-menter and observer agreed that each participant’s graph construction matched the computer- generated graph of a given function, all participants advanced to the next step of training and assessment. Similar to strategies employed in direct instruction requiring group mastery (Englemann, Carnine, & Steely, 2001), if any participant’s graph construc-tion did not match the computer- generated graph (according to the experimenter or observer), all three students were simultaneously reexposed to the training procedure. The observer and experimenter agreed with regard to the accuracy of the participants’ con-structions on all occasions. any response requiring more than 30 s was to be identified as an error, and if such a delayed response took place, the programmed contingencies required participants to engage in reexposure training. If a participant had required more than four exposures, the program would have terminated immediately and that participant would have been compensated, debriefed, and excused from the study; however, all participants achieved criteria. Table 3 shows the number of exposures required by each participant. Although one participant was precluded from completing the second half of the experiment, we were able to train the three participants simultaneously using the same number of trials and training time employed during individualized training in our previous research in this area. Interestingly, this small group of participants required slightly fewer trials than several of our pilot participants, who were trained with the same protocol individually.Table 3 Number of Exposures Required to Attain Mastery on Construction of Cosine and Secant Amplitude and Frequency Functions
Participant A1–B1 A2–B2 A3–B3 A4–B4 A5–B5 A6–B6 A7–B7 A8–B8 Total
1 2 2 1 1 1 1 2 1 11
2 2 2 1 1 1 1 2 1 11
3 2 2 1 1 1 1 2 1 11
Test of novel relations addressing amplitude/frequency transformations. After completing Stage 2, participants were assessed over a series of novel graphs. They were asked to construct the correct formula for each graph created by clicking the F13–F24 function buttons (12 test items). Tests of novel relations were composed of graphs address-ing amplitude and frequency transformations that had not been employed during any of the training conditions. These graphs were employed in an attempt to provide a complex and diversified array of transformations (horizontal and vertical compressions and stretches) of the sine and cosine functions (see the third panel of Table 1 for illustrations of the correct formulas required in the assessment of 12 novel graph- to- formula relations).
236 MCGInTy eT al.
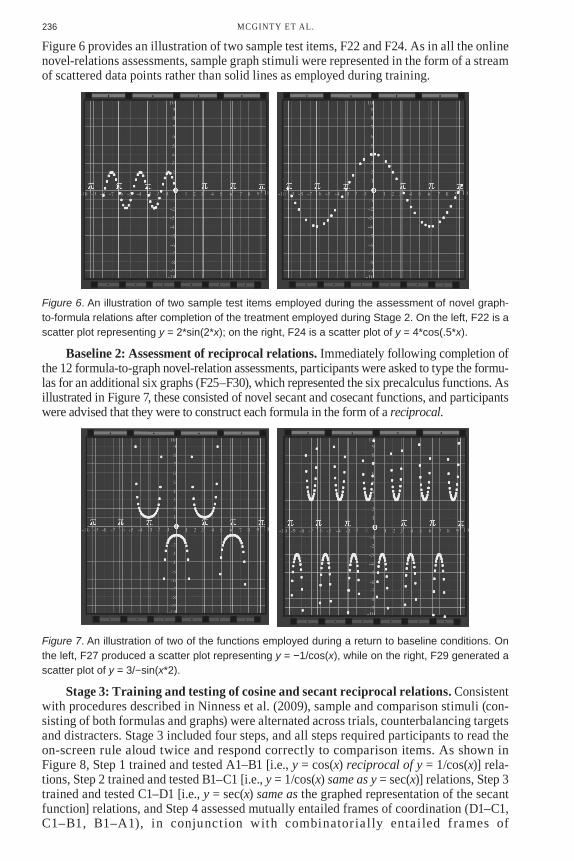
Figure 6 provides an illustration of two sample test items, F22 and F24. as in all the online novel- relations assessments, sample graph stimuli were represented in the form of a stream of scattered data points rather than solid lines as employed during training.
Figure 6. An illustration of two sample test items employed during the assessment of novel graph-to-formula relations after completion of the treatment employed during Stage 2. On the left, F22 is a scatter plot representing y = 2*sin(2*x); on the right, F24 is a scatter plot of y = 4*cos(.5*x).
baseline 2: assessment of reciprocal relations. Immediately following completion of the 12 formula- to- graph novel- relation assessments, participants were asked to type the formu-las for an additional six graphs (F25–F30), which represented the six precalculus functions. as illustrated in Figure 7, these consisted of novel secant and cosecant functions, and participants were advised that they were to construct each formula in the form of a reciprocal.
Figure 7. An illustration of two of the functions employed during a return to baseline conditions. On the left, F27 produced a scatter plot representing y = −1/cos(x), while on the right, F29 generated a scatter plot of y = 3/−sin(x*2).
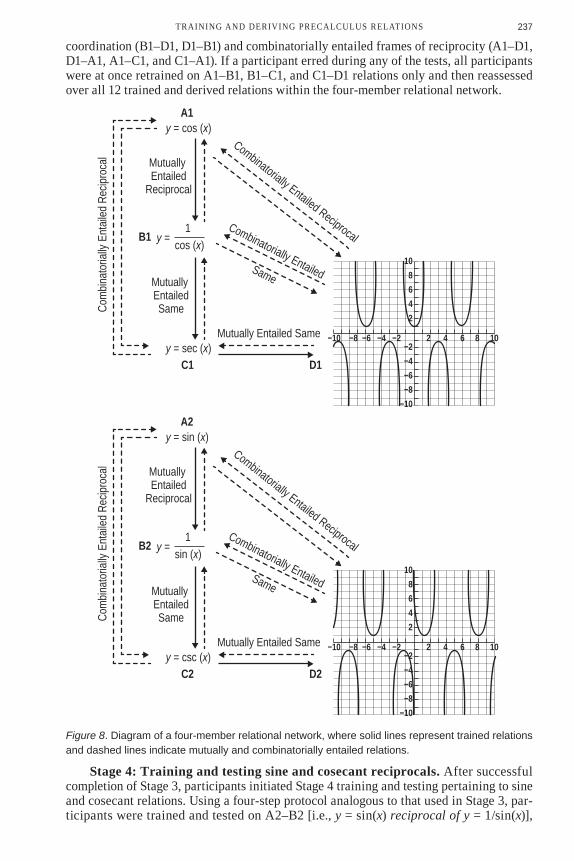
stage 3: Training and testing of cosine and secant reciprocal relations. Consistent with procedures described in ninness et al. (2009), sample and comparison stimuli (con-sisting of both formulas and graphs) were alternated across trials, counterbalancing targets and distracters. Stage 3 included four steps, and all steps required participants to read the on- screen rule aloud twice and respond correctly to comparison items. as shown in Figure 8, Step 1 trained and tested a1–B1 [i.e., y = cos(x) reciprocal of y = 1/cos(x)] rela-tions, Step 2 trained and tested B1–C1 [i.e., y = 1/cos(x) same as y = sec(x)] relations, Step 3 trained and tested C1–D1 [i.e., y = sec(x) same as the graphed representation of the secant function] relations, and Step 4 assessed mutually entailed frames of coordination (D1–C1, C1–B1, B1–A1), in conjunct ion with combinatorial ly entai led frames of
237TRAINING ANd dERIvING PRECALCULUS RELATIONS
coordination (B1–d1, d1–B1) and combinatorially entailed frames of reciprocity (A1–d1, D1–a1, a1–C1, and C1–a1). If a participant erred during any of the tests, all participants were at once retrained on A1–B1, B1–C1, and C1–d1 relations only and then reassessed over all 12 trained and derived relations within the four- member relational network.
−10 −8 −6 −4 −2 2 4 6 8 10
108642
−2−4−6−8
−10
A1
B1
C1 D1
y = cos (x)
y = sec (x)
cos (x)1
y =
Combinatorially Entailed ReciprocalCombinatorially EntailedSame
Com
bina
toria
lly E
ntai
led
Recip
roca
l
Mutually Entailed Same
Mutually EntailedSame
Mutually Entailed
Reciprocal
−10 −8 −6 −4 −2 2 4 6 8 10
108642
−2−4−6−8
−10
A2
B2
C2 D2
y = sin (x)
y = csc (x)
sin (x)1
y =
Combinatorially Entailed ReciprocalCombinatorially EntailedSame
Com
bina
toria
lly E
ntai
led
Recip
roca
l
Mutually Entailed Same
Mutually EntailedSame
Mutually Entailed
Reciprocal
Figure 8. Diagram of a four-member relational network, where solid lines represent trained relations and dashed lines indicate mutually and combinatorially entailed relations.
stage 4: Training and testing sine and cosecant reciprocals. After successful completion of Stage 3, participants initiated Stage 4 training and testing pertaining to sine and cosecant relations. Using a four- step protocol analogous to that used in Stage 3, par-ticipants were trained and tested on a2–B2 [i.e., y = sin(x) reciprocal of y = 1/sin(x)],

238 MCGInTy eT al.
B2–C2 [i.e., y = 1/sin(x) same as y = csc(x)], and C2–D2 [i.e., y = csc(x) same as the graphed representation of the cosecant function] relations and then assessed on mutually entailed frames of coordination (d2–C2, C2–B2, B2–A2), in conjunction with combinatorially entailed frames of coordination (B2–d2, d2–B2) and combinatorially entailed frames of reciprocity (a2–D2, D2–a2, a2–C2, and C2–a2) [see bottom panel of Figure 8]. The protocol mirrored the same counterbalancing procedures employed during Stage 3.
Participants were not trained on the transformation of sine and cosecant functions; instead, they were simply informed that, with regard to amplitude and frequency, the sine and cosecant functions transform in the same manner as cosine and secant. In the event that an error was emitted by any individual during group training, all three participants were to be reexposed to training in concert (cf. englemann, Carnine, & Steely, 2001; Marchand- Martella, Slocum, & Martella, 2004). However, no errors were emitted during this training stage.
Posttreatment test of novel relations addressing reciprocal transformations. Immediately following completion of Stage 4 training, participants were asked to con-struct formulas for graphs that appeared when they pressed the F31–F42 buttons of the construction- based online protocol. These graphs consisted of novel transformations per-taining to the reciprocal of sine and cosine functions. Two of the functions employed in the final assessment of novel relations were not in reciprocal format. F39 and F40 were employed as probes in order to verify that participants were able to maintain the distinc-tion between reciprocal and nonreciprocal functions. note that at the beginning of Stage 4, students were informed that reciprocal formulas such as 4*1/-sin(x) could be represented simply as 4/-sin(x) [since any number multiplied by 1 is equal to itself].
resultsComprehensive outcomes for all three participants across experimental stages are
provided in the bottom panel of Table 2. During Stage 2, Participant 2 failed to construct a graph addressing A1–B1 relations [y = 3*cos(x)]. Thus, in accordance with our group- training protocol, all three participants were reexposed to a1–B1 training. Based on an error emitted by Participant1 (failure to accurately construct the formula for a graph depicting B2–A2 relations [y = .5*cos(x)]) and another error emitted by Participant 3 (fail-ure to accurately construct the formula for a graph depicting B7–A7 relations [y = sec(2*x)]), additional exposures to a2–B2 and a7–B7 training were required during Stage 2.
at the beginning of Stage 3 (training of reciprocal relations), Participant 3 failed to correctly identify the combinatorially entailed formula- to- graph A1–C1 [y = cos(x) recip-rocal of secant y = sec(x)] relation, and all three participants were simultaneously reex-posed to A1–B1, B1–C1, and C1–d1 trained relations and assessed over all derived relations pertaining to the mutually entailed d1–C1, C1–B1, and B1–A1 relations, as well as the combinatorially entailed relations, including B1–d1, d1–B1, A1–d1, d1–A1, A1–C1, and C1–a1 (see top panel of Figure 8). Subsequently, all three participants passed the assessment of these derived relations within the four- member cosine–secant relational network. This included correctly identifying a2–B2, B2–C2, and C2–D2 trained relations and being assessed over all derived relations pertaining to the mutually entailed d2–C2, C2–B2, and B2–A2 relations, as well as the combinatorially entailed relations, including B2–D2, D2–B2, a2–D2, D2–a2, a2–C2, and C2–a2. (Comprehensive outcomes for the assessment of novel relations are shown in Figure 9.)
assessment of novel relations. as an overview of the results, Figure 9 shows a binary graph depicting trial- by- trial responding with the results of the construction- based novel- relations assessment. Test numbers are listed along the x axis for each participant. accurate responses are identified with zeros; errors are shaded blocks containing ones. The top row of Figure 9 shows Participant 1 had a series of errors (ones) throughout her pretest and Baseline 1 conditions. after Stage 1 training, this participant accurately constructed 11 of

239TRAINING ANd dERIvING PRECALCULUS RELATIONS
12 formulas matching the novel array of data points. This participant was unable to con-tinue the experiment due to a personal complication that arose during the course of the study. Participant 2 made a continuous series of errors throughout the pretest and Baseline 1 conditions. after Stage 1 training, she accurately constructed 10 of 12 formulas matching the novel array of data points; however, when she was exposed to a set of curve- fitting reciprocal functions during Baseline 2, she was unable to input any formulas match-ing these functions. These errors occurred despite exposure to this topic during pretraining. After Stage 2 training, she constructed 10 of 12 reciprocal formulas matching the novel array of data points depicted on the coordinate axes. Participant 3’s performance data during the pretest and Baseline 1 show the same constant series of errors in both condi-tions. Her performance improved following Stage 2 training when she accurately con-structed 9 of 12 formulas fitting the novel array of data points. When she was exposed to a set of curve- fitting reciprocal functions during Baseline 2, she was incapable of construct-ing these formulas. after Stage 3 and 4 training, she constructed 11 of 12 reciprocal for-mulas matching the novel array of data points displayed on her laptop.
Figure 9. Errors pertaining to tests of novel relations are identified as shaded blocks containing ones, and correct responses are depicted as zeros.
discussion These findings represent an extension and systematic replication of ninness et al.
(2009) and suggest that comparable strategies might be developed to address an even wider variety of high school and college mathematics/statistics curriculums in serious need of remediation. employing hypotheses predicated on relational frame theory, we developed a set of online functional- analytic protocols aimed at training students to construct precalcu-lus graphical functions and formulas. The procedures are more efficient than our previous research endeavors in this area in the sense that they enable the experimenter/instructor to train and test several participants concurrently. In past research, group instruction was not demonstrated with a combination of face- to- face and online training. The current
240 MCGInTy eT al.
investigation also incorporated several group instructional strategies common to the direct instruction literature. For example, choral responding of rules required each participant to provide her own response. Further, this responding in unison allowed corrections to be provided to the whole group instead of singling out any one member for correction (Marchand- Martella et al., 2004). all participants also received the additional practice provided in the correction procedure. an additional direct instruction group strategy used herein was teaching for mastery. The group did not advance to the next phase until all participants mastered the material in any one training phase. as previously noted, partici-pants required slightly fewer training exposures than several of our pilot participants, who were trained with the same protocol individually.
according to outcomes from PISa (2006), large numbers of U.S. high school students continue to perform well below average in almost every area of mathematics. For example, students at the very highest functioning level (Level 5) in the PISA study are able to “work with models for complex situations, identifying constraints and specifying assumptions; select, compare, and evaluate appropriate problem solving strategies . . . .” However, only “7.7% of U.S. 15-year- olds reached at least level 5 on the mathematics scale (OeCD aver-age 13%)” (PISa, 2006, as cited in PISA 2006: Science Competencies for Tomorrow’s World, p. 20). Clearly, U.S. high school students require a more effective approach to train-ing higher level math skills. What makes derived stimulus relations training so pedagogi-cally powerful is the way in which newly acquired mathematical concepts facilitate the acquisition of similar relational networks while preserving the essential components of the initially trained stimulus relations. In our present study, a small- group training protocol (broadly similar to a direct instruction model) generated even more efficient acquisition of complex mathematical concepts in comparison to individual instruction. Indeed, we nearly improved our training efficiency by a factor of three, and we plan to train at least five par-ticipants (concurrently) in the next variation of this investigation.
If nothing else, outcomes from the PISa (2006) report make it apparent that U.S. high school students are in serious need of more robust, scientifically based instructional strate-gies that can target “groups” of students previously deprived of the opportunity to develop basic and advanced mathematical fluency (Binder, 1996). To this end, we continue to develop group- oriented training protocols aimed at establishing trigonometric identities, inverse trigonometric functions, and conversion of polar coordinates to rectangular coordi-nates and vice versa. Moreover, our laboratory continues to develop group RFT training protocols focusing on the acquisition of several multivariate techniques (e.g., eigenvalues and eigenvectors).
While the rigor associated with the implementation of construction- based and MTS protocols may appear onerous and beyond the capacity of students deprived of sufficient prerequisite skills in mathematics, this study, as well as studies being conducted in several stimulus relations laboratories (e.g., Fields et al., 2009; Fienup & Critchfield, in press), provides reasonably compelling evidence that mathematically inexperienced but verbally competent adolescents and adults are capable of mastering extremely complex and multi-faceted abstract mathematical and statistical operations when sufficiently exposed to stimulus relations protocols. Collaborating in this aspiration, we continue to expand and pilot test small- group RFT protocols focusing on basic and advanced concepts in calculus and multivariate statistics. as previously mentioned, we have found that even students with very limited mathematical histories are quite capable of grasping this material when trained within computer- interactive RFT protocols.
Clearly, an instructional methodology aimed at training abstract concepts and employ-ing intensive computer- interactive models may appear extremely redundant and contrived by some educators, but systematically and meticulously addressing challenges associated with complex concept formation is congenial with our functional analytic heritage. From our perspective, the development of sophisticated mathematical repertoires entails a cer-tain level of redundancy, but this process eventually results in the emergence of new, untrained relational networks that become useful and even interesting to students and to

241TRAINING ANd dERIvING PRECALCULUS RELATIONS
the culture—which ultimately must rely on the students’ advanced academic repertoires in order to survive. To quote the foremost advocate of this perspective, “Many instructional arrangements seem ‘contrived,’ but there is nothing wrong with that. It is the teacher’s function to contrive conditions under which students learn. It has always been the task of formal education to set up behavior which would prove useful or enjoyable later in a stu-dent’s life” (Skinner, 1973).
referencesBalDI, S., JIn, y., SKeMeR, M., GReen, P. J., & HeRGeT, D. (2007). Highlights from PISA
2006: Performance of U.S. 15-year- old students in science and mathematics literacy in an international context (NCES 2008–016). Washington, DC: national Center for education Statistics, Institute of education Sciences, U.S. Department of education.
BInDeR, C. (1996). Behavioral fluency: evaluation of a new paradigm. The Behavior Analyst, 19, 163–197.
enGleMann, S., CaRnIne, D., & STeely, D. G. (2001). Making connections in mathematics. Journal of Learning Disabilities, 24, 292–303.
enSley, D., & KaSKOSz, B. (2008). Flash and math applets: Learn by example. Introduction to ActionScript programming for mathematics and science teaching and learning. Charleston, SC: BookSurge Publishing.
FIelDS, l., TRaVIS, R., yaDlOVKeR, e., ROy, D., De aGUIaR- ROCHa, l., & STURMey, P. (2009). equivalence class formation: a method for teaching statistical interactions. Journal of Applied Behavior Analysis, 42, 575–593.
FIenUP, D. M., COVey, D. P., & CRITCHFIelD, T. S. (2010). Teaching brain–behavior relations economically with stimulus equivalence technology. Journal of Applied Behavior Analysis, 43, 19–33.
FIenUP, D., & CRITCHFIelD, T. (in press). efficiently establishing concepts of inferential statistics and hypothesis decision making through contextually controlled equivalence classes. Journal of Applied Behavior Analysis.
HayeS, S. C., BaRneS- HOlMeS, D., & ROCHe, B. (2001). Relational frame theory: A post- Skinnerian account of human language and cognition. new york: Kluwer academic/Plenum Publishers.
MaCe, F.C., & CRITCHFIelD, T. S. (2010). Translational research in behavior analysis: Historical traditions and imperatives for the future. Journal of the Experimental Analysis of Behavior, 93, 293–312.
MaRCHanD- MaRTella, n. e., SlOCUM, T., & MaRTella, R. C. (2004). Introduction to direct instruction. Boston: Pearson.
naSH, T. (2007). Accelerated C# 2008. Berkeley, Ca: apress.naTIOnal SCIenCe BOaRD. (2006). Science and engineering indicators 2006. arlington,
Va: national Science Foundation.nInneSS, C., BaRneS- HOlMeS, D., RUMPH, R., MCCUlleR, G., FORD, a., Payne, R., nInneSS,
S., SMITH, R., WaRD, T., & ellIOTT, M. (2006). Transformation of mathematical and stimulus functions. Journal of Applied Behavior Analysis, 39, 299–321.
nInneSS, C., DIXOn, M., BaRneS- HOlMeS, D., ReHFelDT, R. a., RUMPH, R., MCCUlleR, G., HOllanD, J., SMITH, R., nInneSS, S., & MCGInTy, J. (2009). Constructing and deriving reciprocal trigonometric relations: a functional analytic approach. Journal of Applied Behavior Analysis, 42, 191–208.
nInneSS, C., RUMPH, R., MCCUlleR, G., HaRRISOn, C., FORD, a. M., & nInneSS, S. (2005a). a functional analytic approach to computer- interactive mathematics. Journal of Applied Behavior Analysis, 38, 1–22.
242 MCGInTy eT al.
nInneSS, C., RUMPH, R., MCCUlleR, G., VaSqUez, e., HaRRISOn, C., FORD, a. M., nInneSS, S. K., & BRaDFIelD, a. (2005b). a relational frame and artificial neural network approach to computer- interactive mathematics. The Psychological Record, 51, 561–570.
PeTeRS, K. (2007). Foundation ActionScript 3.0 animation: Making things move! Berkeley, Ca: apress.
PROGRaM FOR InTeRnaTIOnal STUDenT aSSeSSMenT. (2006). PISA 2006 Science Competencies for Tomorrow’s World. Retrieved October 4, 2007, from http://www.oecd.org/dataoecd/16/28/39722597.pdf
SCHMIDT, W., HOUanG, R., & COGan, l. (2002). a coherent curriculum: The case of mathematics. American Educator, 26, 10–26, 47–48.
SIDMan, M. (1986). Functional analysis of emergent verbal classes. In T. Thompson & M. D. zeiler (eds.), Analysis and integration of behavioral units (pp. 213–245). Hillsdale, nJ: erlbaum.
SKInneR, B. F. (1973). The free and happy student. Phi Delta Kappan, 55(1), 13–16.STeWaRT, I., BaRneS- HOlMeS, D., ROCHe, B., & SMeeTS, P. M. (2001). Generating derived
relational networks via the abstraction of common physical properties: A possible model of analogical reasoning. The Psychological Record, 51, 381–408.
SUllIVan, M. (2002). Precalculus (6th ed.). Upper Saddle River, nJ: Prentice Hall.