training debugger
DESCRIPTION
Debbuger for ARMTRANSCRIPT
Debugger Basics - Training
TRACE32 Online Help
TRACE32 Directory
TRACE32 Index
TRACE32 Training ............................................................................................................................
Debugger Training ........................................................................................................................
Debugger Basics - Training ....................................................................................................... 1
System Concept ...................................................................................................................... 5
On-chip Debug Interface 6
Debug Features 6
TRACE32 Tools 7
On-chip Debug Interface plus On-chip Trace Buffer 11
On-chip Trace Features 11
On-chip Debug Interface plus Trace Port 12
Trace Features 12
TRACE32 Tools 13
NEXUS 15
NEXUS Features 15
TRACE32 Tools (parallel NEXUS port) 16
TRACE32 Tools (serial AURORA NEXUS port) 18
Starting a TRACE32 PowerView Instance ............................................................................. 19
Basic TRACE32 PowerView Parameters 19
Configuration File 19
Standard Parameters 20
Examples for Configuration Files 21
Additional Parameters 24
Application Properties (Windows only) 25
Configuration via T32Start (Windows only) 26
About TRACE32 27
Version Information 27
Prepare Full Information for a Support Email 28
Establish your Debug Session ............................................................................................... 29
Key TRACE32 Set-up Commands 29
The PER.view/PER.Set Command 30
The Data.LOAD Command 31
Debug Scenarios 35
Establish the Debug Communication .................................................................................... 37
Debugger Basics - Training 1 ©1989-2013 Lauterbach GmbH
Debug Scenario 1 .................................................................................................................... 43
NOR Flash Programming 44
The Flash Programming File 44
On-chip Flash Programming 45
Off-chip Flash Programming 48
Configure the TRACE32 OS-Awareness 59
Debug Scenario 2 .................................................................................................................... 60
Typical Boot Sequence 60
Flash Programming (NAND/Serial/eMMC) 65
The Flash Programming File and the Debug Symbol File 65
NAND Flash Programming (non-generic NAND Flash Controller) 66
eMMC Flash Programming 78
Establish the Communication 79
Load the Debug Symbols 79
Debug Scenario 3 .................................................................................................................... 80
Run the Boot Loader 81
Load Application (and/or OS) Code and Debug Symbols 82
Load Debug Symbols only 82
Configure the TRACE32 OS-Awareness 82
Complete Set-up Example 82
Debug Scenario 4 .................................................................................................................... 83
Write a Script to Configure the Target 84
Load Application (and/or OS) Code and Debug Symbols 84
Configure the TRACE32 OS-Awareness 84
Generate a Start-Up Script ..................................................................................................... 85
Write a Start-Up Script 85
Run a Start-up Script 86
Automated Start-up Scripts 87
TRACE32 PowerView .............................................................................................................. 88
Overview 89
Main Menu Bar and Accelerators 90
Main Tool Bar 92
Window Area 94
Command Line 97
Command Structure 97
Command Examples 98
The Online Help for a Specific Command 99
Standard Parameter Syntax 100
Message Line 101
Softkeys 102
State Line 103
Debugger Basics - Training 2 ©1989-2013 Lauterbach GmbH
Registers .................................................................................................................................. 104
Display the Core Registers 104
Colored Display of Changed Registers 105
Modify the Contents of a Core Register 106
Display the Special Function Registers 107
Tree Display 107
Full Display 108
Details about a Single Configuration Register 110
The PER Definition File 111
Modify a Special Function Register 112
Memory Display and Modification ......................................................................................... 113
The Data.dump Window 114
Basics 114
Modify the Memory Contents 119
Run-time Memory Access 120
Colored Display of Changed Memory Contents 129
The List Window 130
Displays the Source Listing Around the PC 130
Displays the Source Listing of a Selected Function 131
Breakpoints .............................................................................................................................. 133
Breakpoint Implementations 133
Software Breakpoints in RAM (Program) 133
Software Breakpoints in FLASH (Program) 134
Onchip Breakpoints in NOR Flash (Program) 135
Onchip Breakpoints (Read/Write) 138
ETM Breakpoints (Read/Write) for ARM or Cortex-A/-R 152
Breakpoint Types 155
Program Breakpoints 156
Read/Write Breakpoints 157
Breakpoint Handling ............................................................................................................... 159
Breakpoint Setting at Run-time 159
Real-time Breakpoints vs. Intrusive Breakpoints 160
Break.Set Dialog Box 162
The HLL Check Box 163
Implementations 165
Actions 166
Options 169
DATA Breakpoints 171
Advanced Breakpoints 174
TASK-aware Breakpoints 175
Intrusive TASK-aware Breakpoint 175
Real-time TASK-aware Breakpoint 179
Debugger Basics - Training 3 ©1989-2013 Lauterbach GmbH
Counter 180
CONDition 184
CMD 187
memory/register/var 190
Display a List of all Set Breakpoints 195
Delete Breakpoints 196
Enable/Disable Breakpoints 196
Store Breakpoint Settings 197
Debugging ................................................................................................................................ 198
Basic Debug Control 198
Sample-based Profiling .......................................................................................................... 201
Introduction 201
Standard Approach 202
Details 205
In-depth Result 205
(other) 206
Document your Results .......................................................................................................... 207
Print your Results 207
Save your Results to a File 209
Debugger Basics - Training 4 ©1989-2013 Lauterbach GmbH
Debugger Basics - Training
Version June, 11 2013
System Concept
A single-core processor/multi-core chip can provide:
• An on-chip debug interface
• An on-chip debug interface plus an on-chip trace buffer
• An on-chip debug interface plus an off-chip trace port
• A NEXUS interface including an on-chip debug interface
Depending on the debug resources different debug features can be provided and different TRACE32 tools are offered.
Debugger Basics - Training 5 System Concept ©1989-2013 Lauterbach GmbH

On-chip Debug Interface
The TRACE32 debugger allows you to test your embedded hardware and software by using the on-chip debug interface of the single-core processor/multi-core chip. The most common on-chip debug interface is JTAG.
A single on-chip debug interface can be used to debug all cores of a multi-core chip.
Debug Features
Depending on the single-core processor/multi-core chip different debug features are available.
Debug features provided by all single-core processors/multi-core chips:
• Read/write access to registers
• Read/write access to memories
• Start/stop of program execution
Debug features specific for each single-core processor/multi-core chip:
• Number of on-chip breakpoints
• Read/write access to memory while the program execution is running
• Additional features as benchmark counters, triggers etc.
Debugger Basics - Training 6 System Concept ©1989-2013 Lauterbach GmbH

TRACE32 Tools
The TRACE32 debugger hardware always consists of:
• Universal debugger hardware
• Debug cable specific to the processor architecture
Debugger Basics - Training 7 System Concept ©1989-2013 Lauterbach GmbH
POWER DEBUG INTERFACE / USB 2
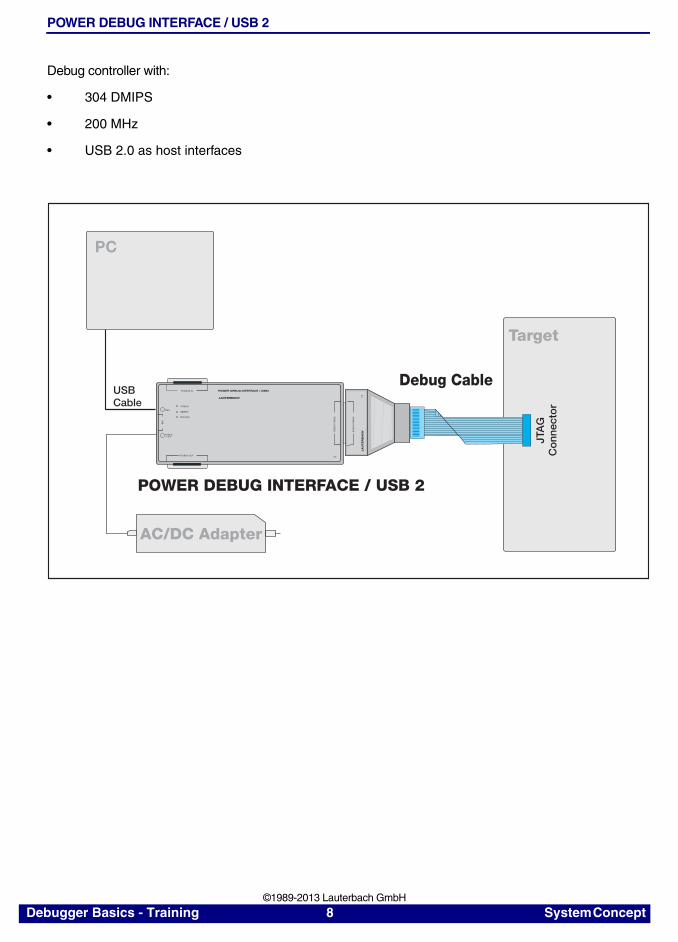
Debug controller with:
• 304 DMIPS
• 200 MHz
• USB 2.0 as host interfaces
POWER DEBUG INTERFACE / USB2PODBUS IN
POWER
SELECT
EMULATE
TRIG
POWER7-9 V
US
B
LAUTERBACH
PODBUS OUT
DE
BU
G C
AB
LE
Target
POWER DEBUG INTERFACE / USB 2
USBCable
Debug Cable
JTA
GC
onn
ecto
r
DE
BU
G C
AB
LE
LA
UTE
RB
AC
H
AC/DC Adapter
PC
Debugger Basics - Training 8 System Concept ©1989-2013 Lauterbach GmbH
POWER DEBUG / ETHERNET
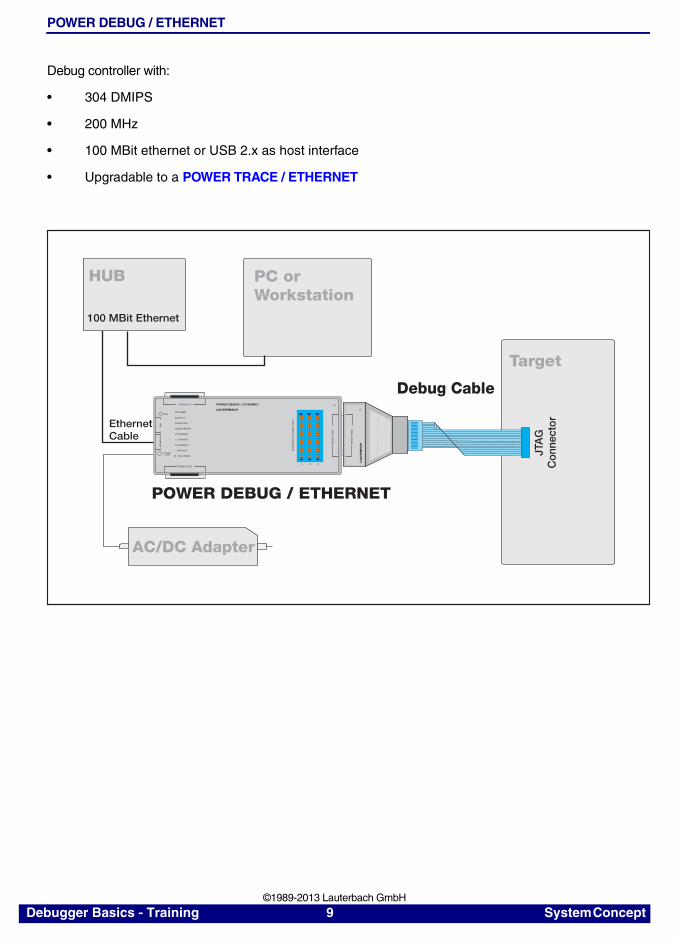
Debug controller with:
• 304 DMIPS
• 200 MHz
• 100 MBit ethernet or USB 2.x as host interface
• Upgradable to a POWER TRACE / ETHERNET
POWER DEBUG / ETHERNETPODBUS IN
TRIG
POWER7-9 V
US
B
LAUTERBACH
PODBUS OUT
DE
BU
G C
AB
LE
Target
PC orWorkstation
EthernetCable
POWER
SELECT
EMULATE
RECORDING
TRIGGER
ET
HE
RN
ET
CON ERR
TRANSMIT
RECEIVE
COLLISION
HUB
100 MBit Ethernet
Debug Cable
JTA
GC
onne
ctor
DE
BU
G C
AB
LE
LA
UTE
RB
AC
H
RE
SE
RV
ED
FO
R P
OW
ER
TR
AC
E
C B A
POWER DEBUG / ETHERNET
AC/DC Adapter
Debugger Basics - Training 9 System Concept ©1989-2013 Lauterbach GmbH
POWER DEBUG II
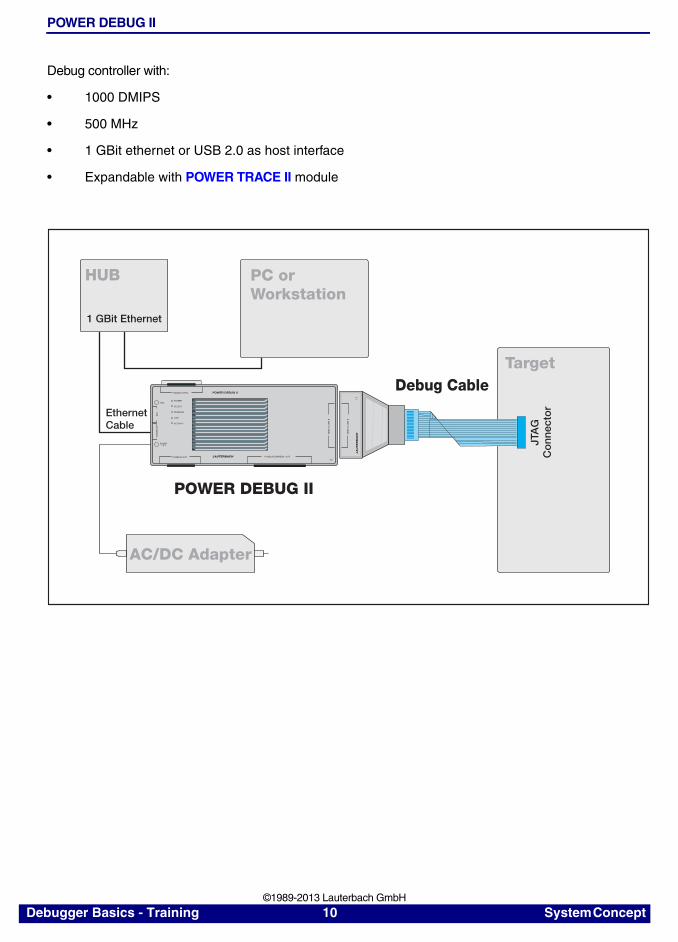
Debug controller with:
• 1000 DMIPS
• 500 MHz
• 1 GBit ethernet or USB 2.0 as host interface
• Expandable with POWER TRACE II module
POWER DEBUG IIPODBUS SYNC
TRIG
POWER7-9 V
US
B
LAUTERBACHPODBUS OUT
DE
BU
G C
AB
LE
Target
POWER DEBUG II
EthernetCable
POWER
SELECT
RUNNING
LINK
ACTIVITY
ET
HE
RN
ET
HUB
1 GBit Ethernet
Debug Cable
DE
BU
G C
AB
LE
JTA
GC
onn
ecto
r
LA
UTE
RB
AC
H
PODBUS EXPRESS OUT
PC orWorkstation
AC/DC Adapter
Debugger Basics - Training 10 System Concept ©1989-2013 Lauterbach GmbH
On-chip Debug Interface plus On-chip Trace Buffer
A number of single-core processors/multi-core chips offer in addition to the on-chip debug interface an on-chip trace buffer.
On-chip Trace Features
The on-chip trace buffer can store information:
• On the executed instructions.
• On task/process switches.
• On load/store operations if supported by the trace generation hardware.
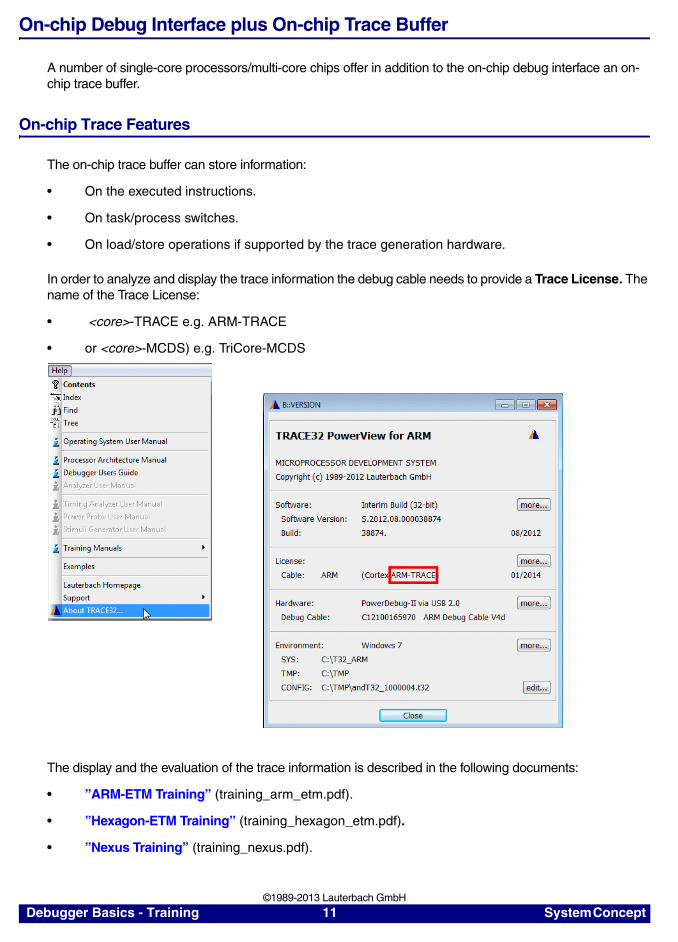
In order to analyze and display the trace information the debug cable needs to provide a Trace License. The name of the Trace License:
• <core>-TRACE e.g. ARM-TRACE
• or <core>-MCDS) e.g. TriCore-MCDS
The display and the evaluation of the trace information is described in the following documents:
• ”ARM-ETM Training” (training_arm_etm.pdf).
• ”Hexagon-ETM Training” (training_hexagon_etm.pdf).
• ”Nexus Training” (training_nexus.pdf).
Debugger Basics - Training 11 System Concept ©1989-2013 Lauterbach GmbH
On-chip Debug Interface plus Trace Port
A number of single-core processors/multi-core chips offer in addition to the on-chip debug interface a so-called trace port. The most common trace port is the TPIU for the ARM/Cortex architecture.
Trace Features
The trace port exports in real-time trace information:
• On the executed instructions.
• On task/process switches.
• On load/store operations if supported by the trace generation logic.
The display and the evaluation of the trace information is described in the following documents:
• ”ARM-ETM Training” (training_arm_etm.pdf)
• ”Hexagon-ETM Training” (training_hexagon_etm.pdf)
Debugger Basics - Training 12 System Concept ©1989-2013 Lauterbach GmbH
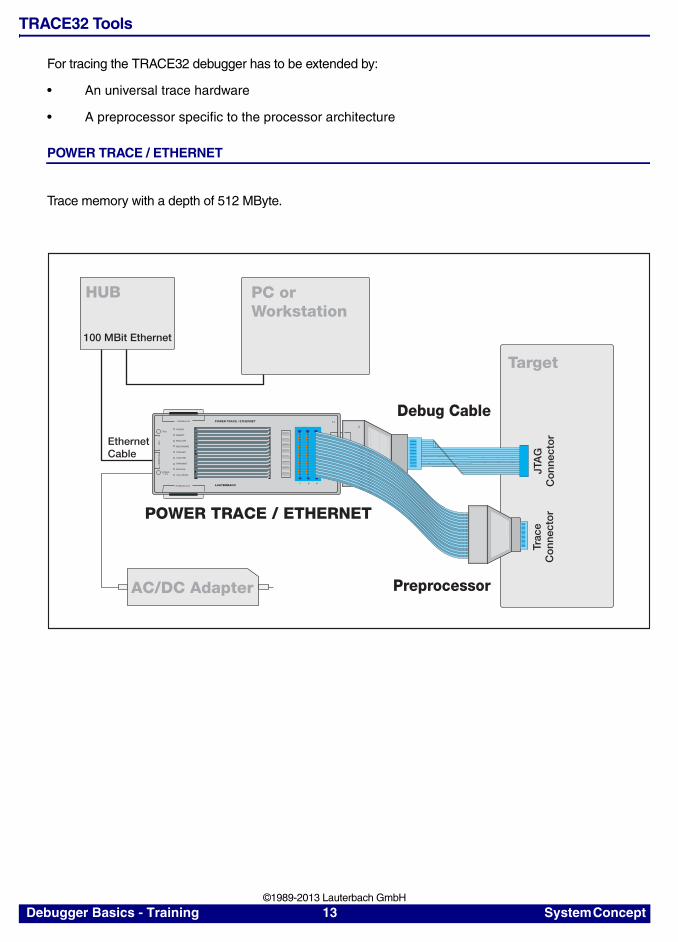
TRACE32 Tools
For tracing the TRACE32 debugger has to be extended by:
• An universal trace hardware
• A preprocessor specific to the processor architecture
POWER TRACE / ETHERNET
Trace memory with a depth of 512 MByte.
POWER TRACE / ETHERNETPODBUS IN
TRIG
POWER7-9 V
US
B
LAUTERBACHPODBUS OUT
DE
BU
G C
AB
LE
Target
AC/DC Adapter
PC orWorkstation
POWER TRACE / ETHERNET
EthernetCable
POWER
SELECT
EMULATE
RECORDING
TRIGGER
ET
HE
RN
ET
CON ERR
TRANSMIT
RECEIVE
COLLISION
HUB
100 MBit Ethernet
Debug Cable
JTA
GC
onn
ecto
r
DE
BU
G C
AB
LE
LA
UT
ER
BA
CH
LO
GIC
AN
ALY
ZE
R P
RO
BE
C B A
Trac
eC
onn
ecto
r
Preprocessor
Debugger Basics - Training 13 System Concept ©1989-2013 Lauterbach GmbH
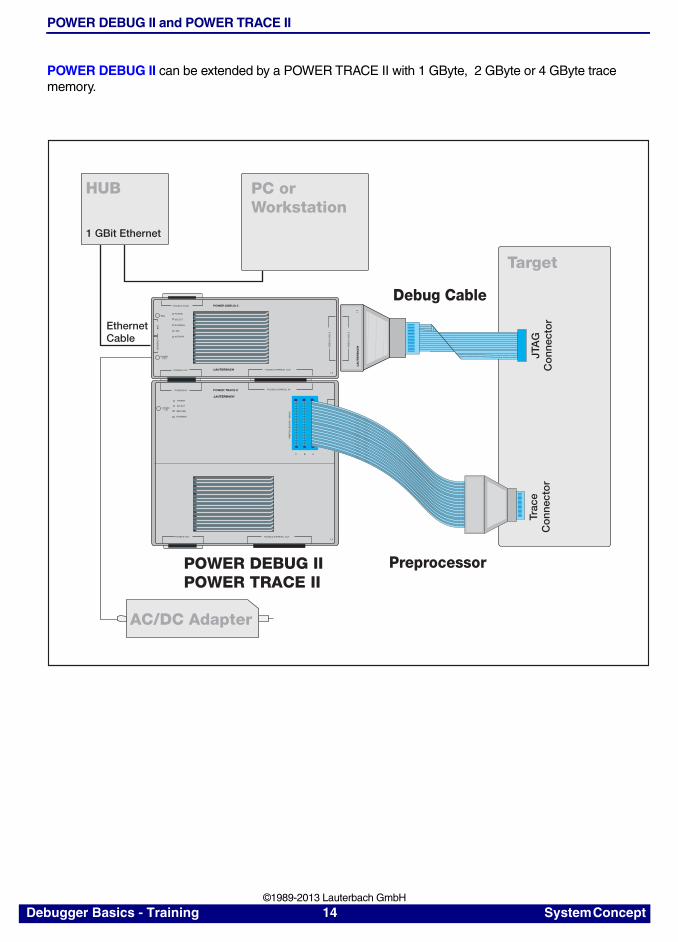
POWER DEBUG II and POWER TRACE II
POWER DEBUG II can be extended by a POWER TRACE II with 1 GByte, 2 GByte or 4 GByte trace memory.
POWER TRACE IIPODBUS IN
POWER
SELECT
RECORD
RUNNING
POWER7-9V
LAUTERBACH
PODBUS OUT
POWER DEBUG IIPODBUS SYNC
TRIG
POWER7-9 V
US
B
LAUTERBACHPODBUS OUT
DE
BU
G C
AB
LE
Target
POWER DEBUG IIPOWER TRACE II
EthernetCable
POWER
SELECT
RUNNING
LINK
ACTIVITY
ET
HE
RN
ET
HUB
1 GBit Ethernet
Debug Cable
JTA
GC
onn
ecto
r
DE
BU
G C
AB
LE
LA
UTE
RB
AC
H
LO
GIC
AN
ALY
ZE
R P
RO
BE
C B A
Trac
eC
onn
ecto
r
Preprocessor
PODBUS EXPRESS OUT
PODBUS EXPRESS IN
PODBUS EXPRESS OUT
PR
EP
RO
CE
SS
OR
/ N
EX
US
PC orWorkstation
AC/DC Adapter
Debugger Basics - Training 14 System Concept ©1989-2013 Lauterbach GmbH
NEXUS
NEXUS is a standardized interface for on-chip debugging and real-time trace especially for the automotive industry.
NEXUS Features
Debug features provided by all single-core processors/multi-core chips:
• Read/write access to the registers
• Read/write access to all memories
• Start/stop of program execution
• Read/write access to memory while the program execution is running
Debug features specific for single-core processor/multi-core chip:
• Number of on-chip breakpoints
• Benchmark counters, triggers etc.
Trace features provided by all single-core processors/multi-core chips:
• Information on the executed instructions.
• Information on task/process switches.
Trace features specific for the single-core processor/multi-core chip:
• Information on load/store operations if supported by the trace generation logic.
The display and the evaluation of the trace information is described in ”Nexus Training” (training_nexus.pdf).
Debugger Basics - Training 15 System Concept ©1989-2013 Lauterbach GmbH
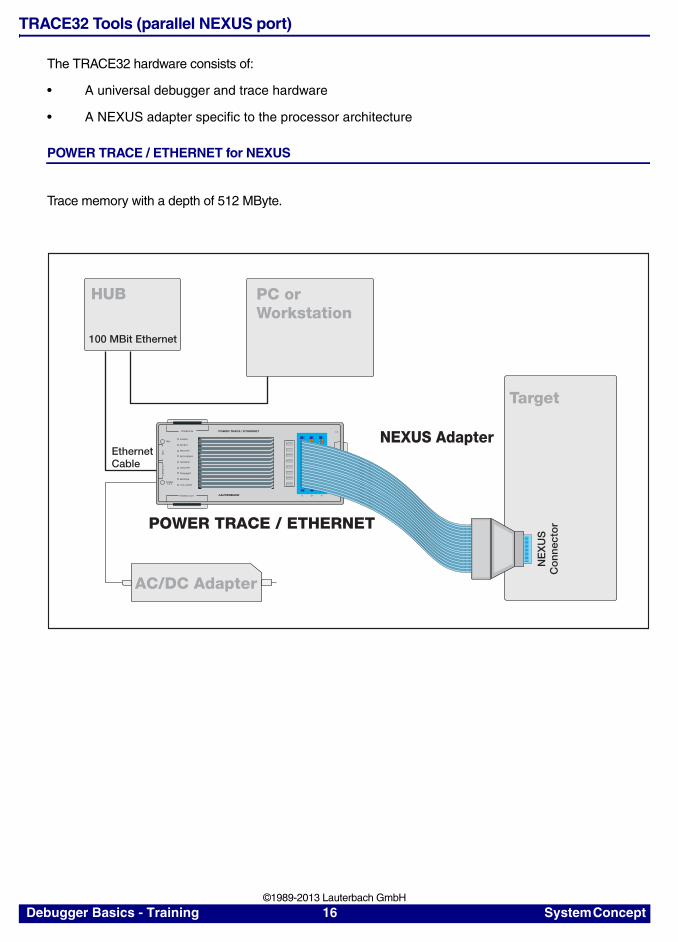
TRACE32 Tools (parallel NEXUS port)
The TRACE32 hardware consists of:
• A universal debugger and trace hardware
• A NEXUS adapter specific to the processor architecture
POWER TRACE / ETHERNET for NEXUS
Trace memory with a depth of 512 MByte.
POWER TRACE / ETHERNETPODBUS IN
TRIG
POWER7-9 V
US
B
LAUTERBACHPODBUS OUT
DE
BU
G C
AB
LE
Target
POWER TRACE / ETHERNET
EthernetCable
POWER
SELECT
EMULATE
RECORDING
TRIGGER
ET
HE
RN
ET
CON ERR
TRANSMIT
RECEIVE
COLLISION
C B A
HUB
100 MBit Ethernet
NEXUS Adapter
NE
XU
SC
onn
ecto
r
LO
GIC
AN
ALY
ZE
R P
RO
BE
AC/DC Adapter
PC orWorkstation
Debugger Basics - Training 16 System Concept ©1989-2013 Lauterbach GmbH
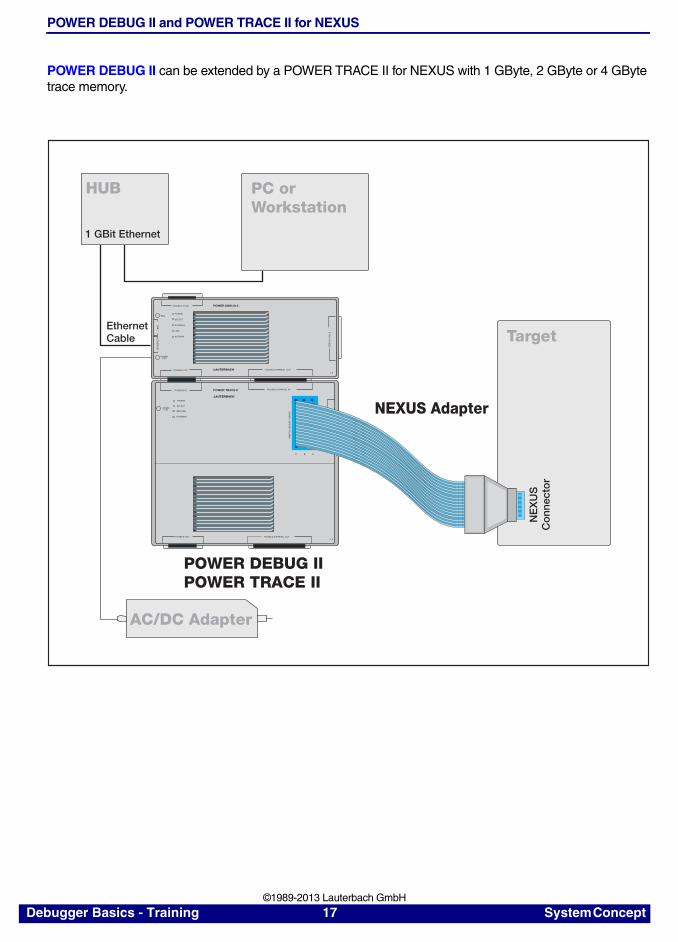
POWER DEBUG II and POWER TRACE II for NEXUS
POWER DEBUG II can be extended by a POWER TRACE II for NEXUS with 1 GByte, 2 GByte or 4 GByte trace memory.
POWER TRACE IIPODBUS IN
POWER
SELECT
RECORD
RUNNING
POWER7-9V
LAUTERBACH
PODBUS OUT
POWER DEBUG IIPODBUS SYNC
TRIG
POWER7-9 V
US
B
LAUTERBACHPODBUS OUT
DE
BU
G C
AB
LE Target
POWER DEBUG IIPOWER TRACE II
EthernetCable
POWER
SELECT
RUNNING
LINK
ACTIVITY
ET
HE
RN
ET
HUB
1 GBit Ethernet
LO
GIC
AN
ALY
ZE
R P
RO
BE
C B A
PODBUS EXPRESS OUT
PODBUS EXPRESS IN
PODBUS EXPRESS OUT
PR
EP
RO
CE
SS
OR
/ N
EX
US
PC orWorkstation
AC/DC Adapter
NE
XU
SC
onn
ecto
r
NEXUS Adapter
Debugger Basics - Training 17 System Concept ©1989-2013 Lauterbach GmbH
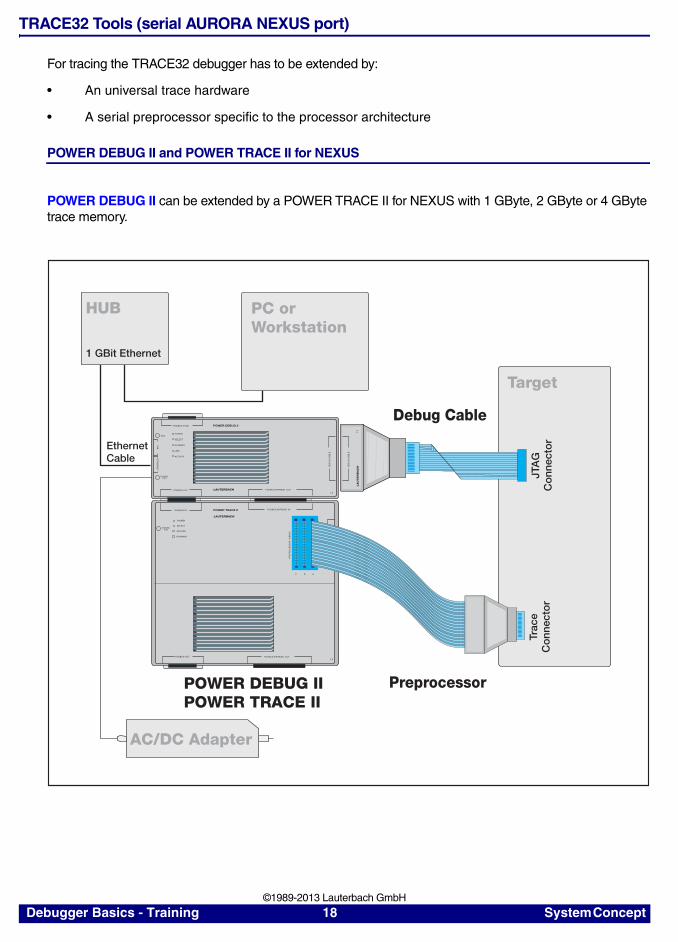
TRACE32 Tools (serial AURORA NEXUS port)
For tracing the TRACE32 debugger has to be extended by:
• An universal trace hardware
• A serial preprocessor specific to the processor architecture
POWER DEBUG II and POWER TRACE II for NEXUS
POWER DEBUG II can be extended by a POWER TRACE II for NEXUS with 1 GByte, 2 GByte or 4 GByte trace memory.
POWER TRACE IIPODBUS IN
POWER
SELECT
RECORD
RUNNING
POWER7-9V
LAUTERBACH
PODBUS OUT
POWER DEBUG IIPODBUS SYNC
TRIG
POWER7-9 V
US
B
LAUTERBACHPODBUS OUT
DE
BU
G C
AB
LE
Target
POWER DEBUG IIPOWER TRACE II
EthernetCable
POWER
SELECT
RUNNING
LINK
ACTIVITY
ET
HE
RN
ET
HUB
1 GBit Ethernet
Debug Cable
JTA
GC
onn
ecto
r
DE
BU
G C
AB
LE
LA
UTE
RB
AC
H
LO
GIC
AN
ALY
ZE
R P
RO
BE
C B A
Trac
eC
onn
ecto
r
Preprocessor
PODBUS EXPRESS OUT
PODBUS EXPRESS IN
PODBUS EXPRESS OUT
PR
EP
RO
CE
SS
OR
/ N
EX
US
PC orWorkstation
AC/DC Adapter
Debugger Basics - Training 18 System Concept ©1989-2013 Lauterbach GmbH
Starting a TRACE32 PowerView Instance
Basic TRACE32 PowerView Parameters
This chapter describes the basic parameters required to start a TRACE32 PowerView instance.
The parameters are defined in the configuration file. By default the configuration file is named config.t32. It is located in the TRACE32 system directory (parameter SYS).
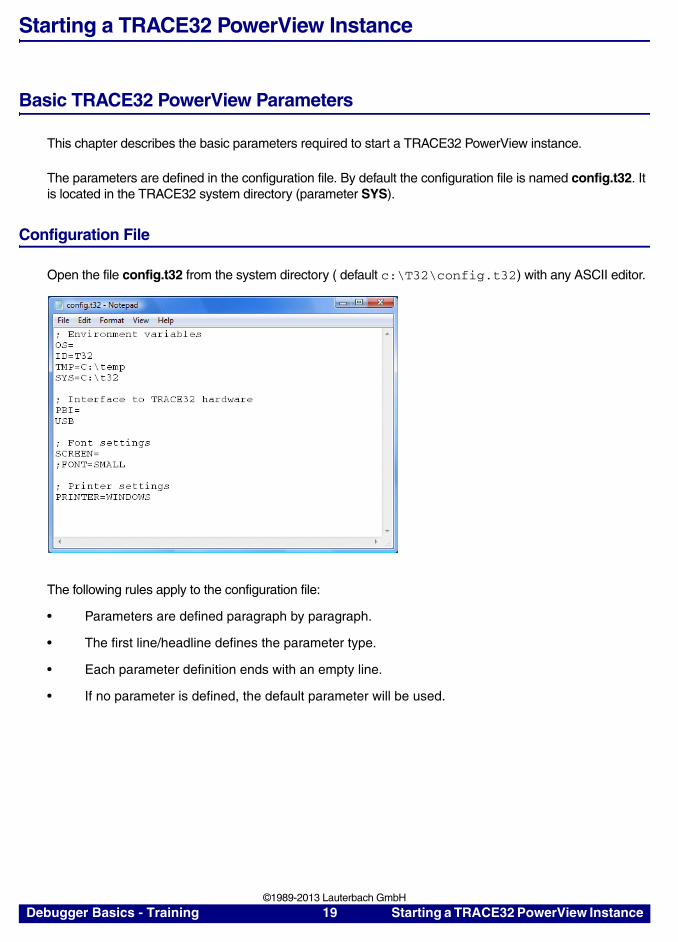
Configuration File
Open the file config.t32 from the system directory ( default c:\T32\config.t32) with any ASCII editor.
The following rules apply to the configuration file:
• Parameters are defined paragraph by paragraph.
• The first line/headline defines the parameter type.
• Each parameter definition ends with an empty line.
• If no parameter is defined, the default parameter will be used.
Debugger Basics - Training 19 Starting a TRACE32 PowerView Instance ©1989-2013 Lauterbach GmbH
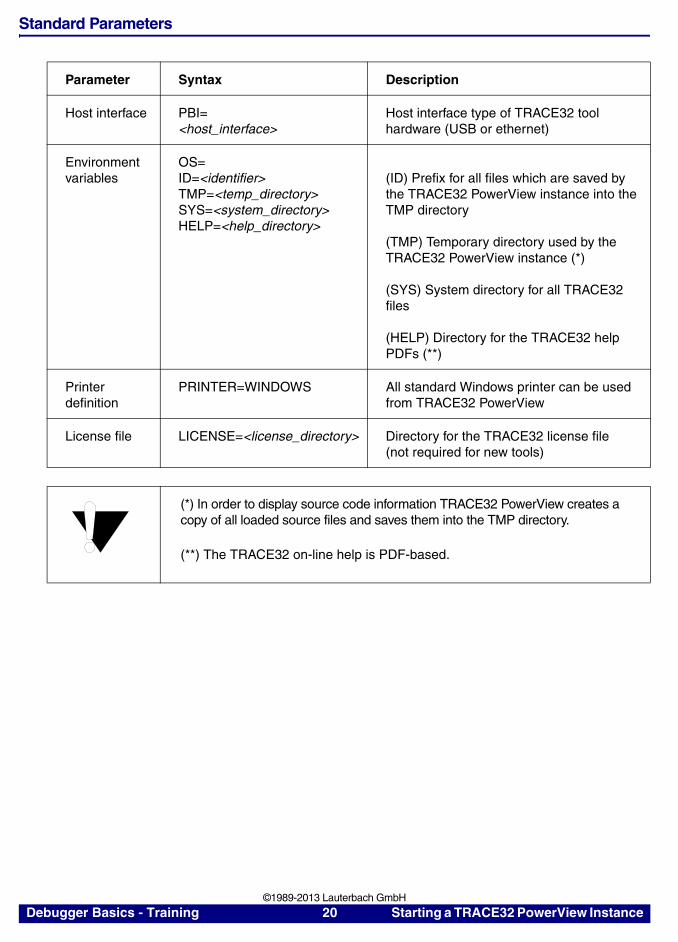
Standard Parameters
Parameter Syntax Description
Host interface PBI=<host_interface>
Host interface type of TRACE32 tool hardware (USB or ethernet)
Environment variables
OS=ID=<identifier>TMP=<temp_directory>SYS=<system_directory>HELP=<help_directory>
(ID) Prefix for all files which are saved by the TRACE32 PowerView instance into the TMP directory
(TMP) Temporary directory used by the TRACE32 PowerView instance (*)
(SYS) System directory for all TRACE32 files
(HELP) Directory for the TRACE32 help PDFs (**)
Printer definition
PRINTER=WINDOWS All standard Windows printer can be used from TRACE32 PowerView
License file LICENSE=<license_directory> Directory for the TRACE32 license file(not required for new tools)
(*) In order to display source code information TRACE32 PowerView creates a copy of all loaded source files and saves them into the TMP directory.
(**) The TRACE32 on-line help is PDF-based.
Debugger Basics - Training 20 Starting a TRACE32 PowerView Instance ©1989-2013 Lauterbach GmbH
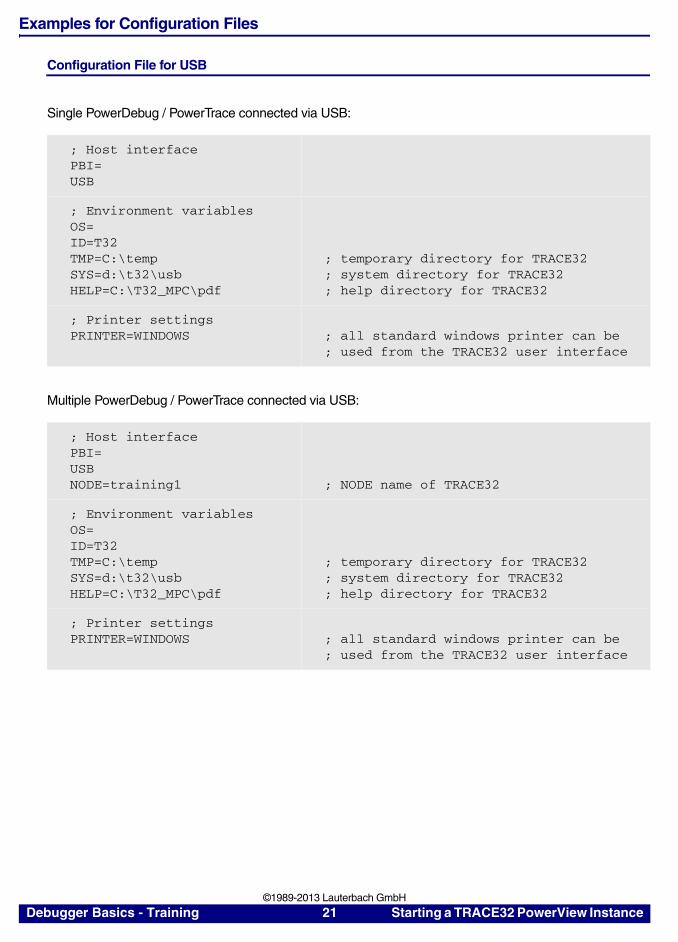
Examples for Configuration Files
Configuration File for USB
Single PowerDebug / PowerTrace connected via USB:
Multiple PowerDebug / PowerTrace connected via USB:
; Host interfacePBI=USB
; Environment variablesOS=ID=T32TMP=C:\tempSYS=d:\t32\usbHELP=C:\T32_MPC\pdf
; temporary directory for TRACE32; system directory for TRACE32; help directory for TRACE32
; Printer settingsPRINTER=WINDOWS ; all standard windows printer can be
; used from the TRACE32 user interface
; Host interfacePBI=USBNODE=training1 ; NODE name of TRACE32
; Environment variablesOS=ID=T32TMP=C:\tempSYS=d:\t32\usbHELP=C:\T32_MPC\pdf
; temporary directory for TRACE32; system directory for TRACE32; help directory for TRACE32
; Printer settingsPRINTER=WINDOWS ; all standard windows printer can be
; used from the TRACE32 user interface
Debugger Basics - Training 21 Starting a TRACE32 PowerView Instance ©1989-2013 Lauterbach GmbH
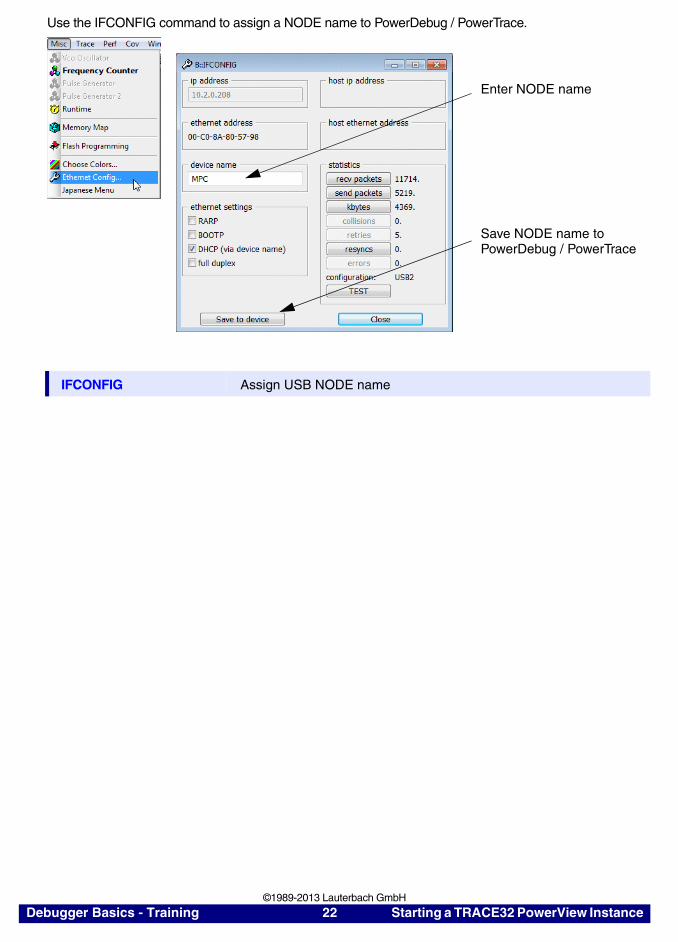
Use the IFCONFIG command to assign a NODE name to PowerDebug / PowerTrace.
IFCONFIG Assign USB NODE name
Enter NODE name
Save NODE name toPowerDebug / PowerTrace
Debugger Basics - Training 22 Starting a TRACE32 PowerView Instance ©1989-2013 Lauterbach GmbH
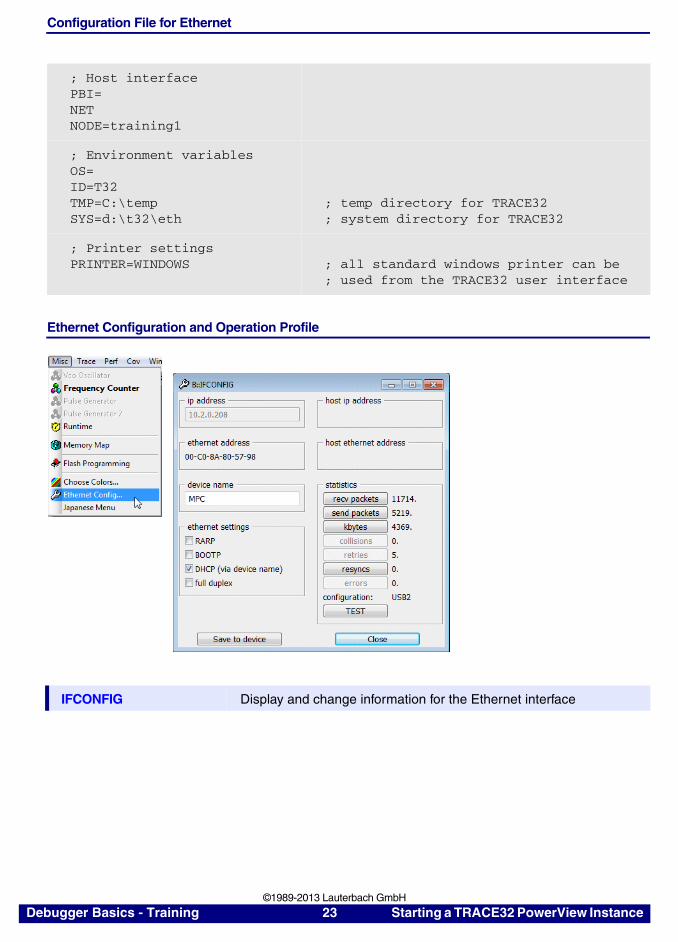
Configuration File for Ethernet
Ethernet Configuration and Operation Profile
; Host interfacePBI=NETNODE=training1
; Environment variablesOS=ID=T32TMP=C:\tempSYS=d:\t32\eth
; temp directory for TRACE32; system directory for TRACE32
; Printer settingsPRINTER=WINDOWS ; all standard windows printer can be
; used from the TRACE32 user interface
IFCONFIG Display and change information for the Ethernet interface
Debugger Basics - Training 23 Starting a TRACE32 PowerView Instance ©1989-2013 Lauterbach GmbH
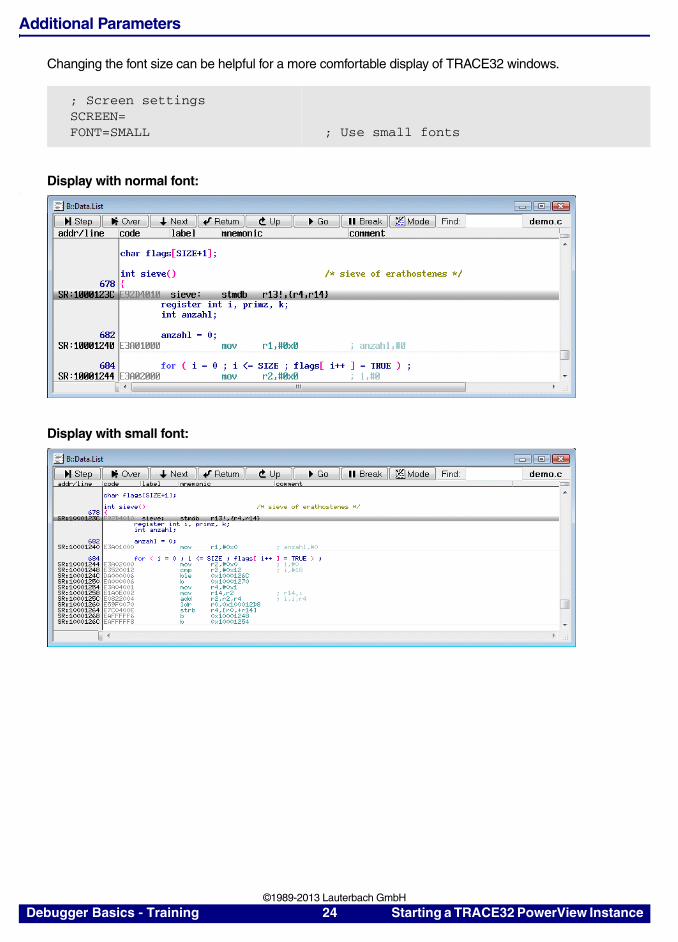
Additional Parameters
Changing the font size can be helpful for a more comfortable display of TRACE32 windows.
Display with normal font::
Display with small font:
; Screen settingsSCREEN=FONT=SMALL ; Use small fonts
Debugger Basics - Training 24 Starting a TRACE32 PowerView Instance ©1989-2013 Lauterbach GmbH
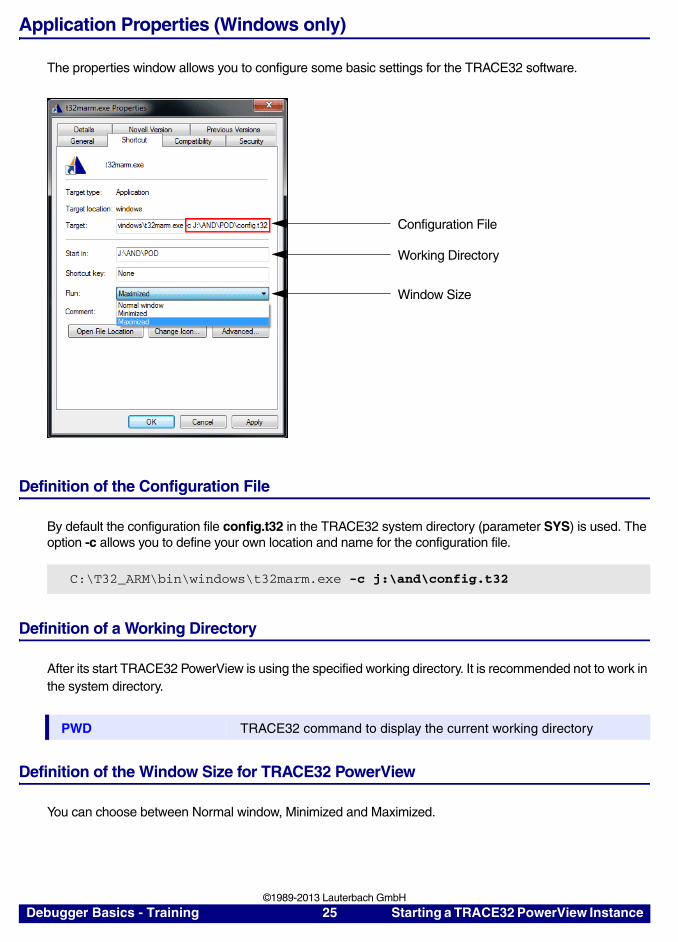
Application Properties (Windows only)
The properties window allows you to configure some basic settings for the TRACE32 software.
Definition of the Configuration File
By default the configuration file config.t32 in the TRACE32 system directory (parameter SYS) is used. The option -c allows you to define your own location and name for the configuration file.
Definition of a Working Directory
After its start TRACE32 PowerView is using the specified working directory. It is recommended not to work in the system directory.
Definition of the Window Size for TRACE32 PowerView
You can choose between Normal window, Minimized and Maximized.
C:\T32_ARM\bin\windows\t32marm.exe -c j:\and\config.t32
PWD TRACE32 command to display the current working directory
Configuration File
Working Directory
Window Size
Debugger Basics - Training 25 Starting a TRACE32 PowerView Instance ©1989-2013 Lauterbach GmbH
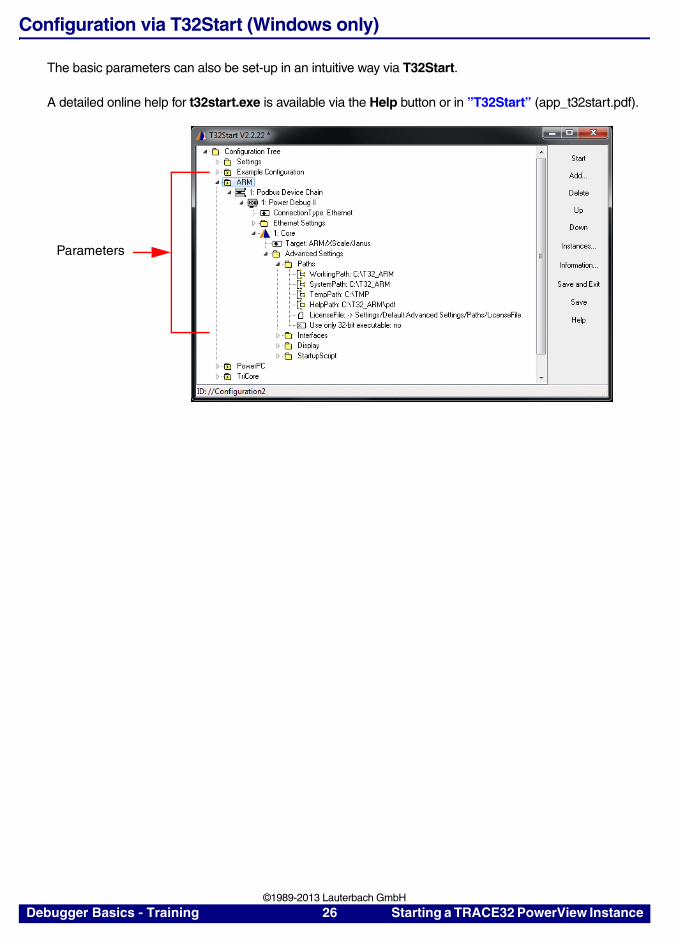
Configuration via T32Start (Windows only)
The basic parameters can also be set-up in an intuitive way via T32Start.
A detailed online help for t32start.exe is available via the Help button or in ”T32Start” (app_t32start.pdf).
Parameters
Debugger Basics - Training 26 Starting a TRACE32 PowerView Instance ©1989-2013 Lauterbach GmbH

About TRACE32
If you want to contact your local Lauterbach support, it might be helpful to provide some basis information about your TRACE32 tool.
Version Information
The VERSION window informs you about:
1. The version of the TRACE32 software
2. The debug licenses programmed into the debug cable and the expiration date of your software guarantee respectively the expiration date of your software maintenance.
3. The serial number of the debug cable.
VERSION.view Display the VERSION window.
VERSION.HARDWARE Display more details about the TRACE32 hardware modules.
VERSION.SOFTWARE Display more details about the TRACE32 software.
1
2
3
Debugger Basics - Training 27 Starting a TRACE32 PowerView Instance ©1989-2013 Lauterbach GmbH
Prepare Full Information for a Support Email
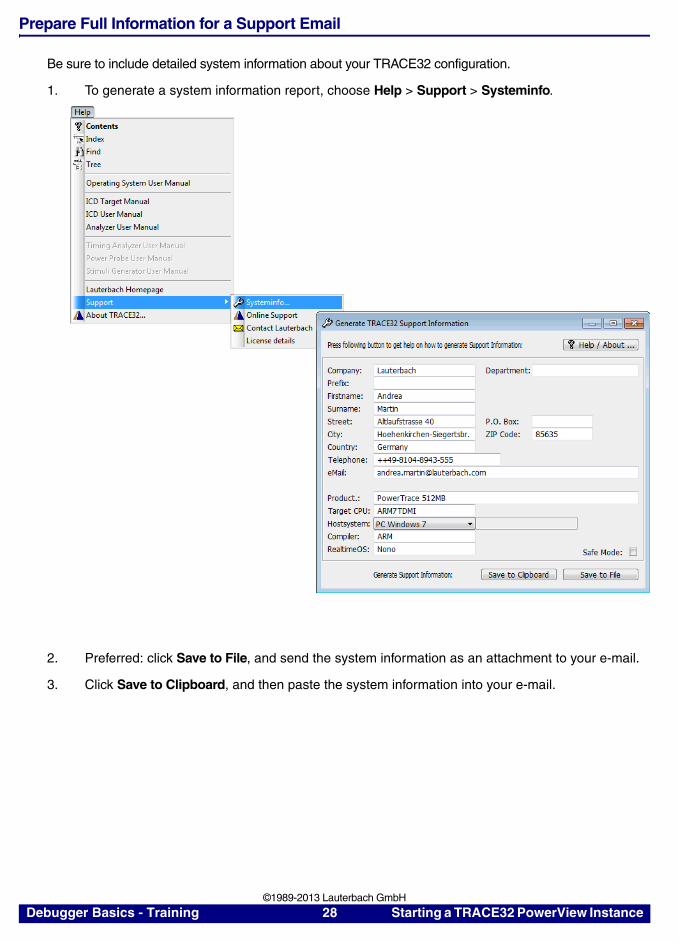
Be sure to include detailed system information about your TRACE32 configuration.
1. To generate a system information report, choose Help > Support > Systeminfo.
2. Preferred: click Save to File, and send the system information as an attachment to your e-mail.
3. Click Save to Clipboard, and then paste the system information into your e-mail.
Debugger Basics - Training 28 Starting a TRACE32 PowerView Instance ©1989-2013 Lauterbach GmbH
Establish your Debug Session
Before you can start debugging, the debug environment has to be set-up. The necessary set-up depends crucially on the debug scenario.
Key TRACE32 Set-up Commands
Debugger Basics - Training 29 Establish your Debug Session ©1989-2013 Lauterbach GmbH
The PER.view/PER.Set Command
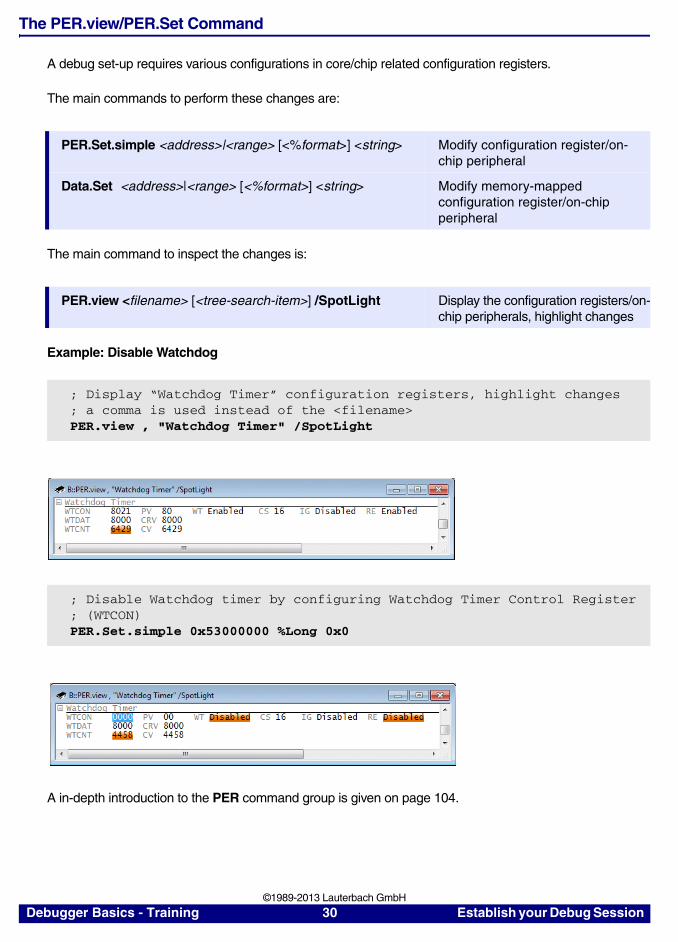
A debug set-up requires various configurations in core/chip related configuration registers.
The main commands to perform these changes are:
The main command to inspect the changes is:
Example: Disable Watchdog
A in-depth introduction to the PER command group is given on page 104.
PER.Set.simple <address>|<range> [<%format>] <string> Modify configuration register/on-chip peripheral
Data.Set <address>|<range> [<%format>] <string> Modify memory-mapped configuration register/on-chip peripheral
PER.view <filename> [<tree-search-item>] /SpotLight Display the configuration registers/on-chip peripherals, highlight changes
; Display “Watchdog Timer” configuration registers, highlight changes; a comma is used instead of the <filename>PER.view , "Watchdog Timer" /SpotLight
; Disable Watchdog timer by configuring Watchdog Timer Control Register; (WTCON) PER.Set.simple 0x53000000 %Long 0x0
Debugger Basics - Training 30 Establish your Debug Session ©1989-2013 Lauterbach GmbH
The Data.LOAD Command
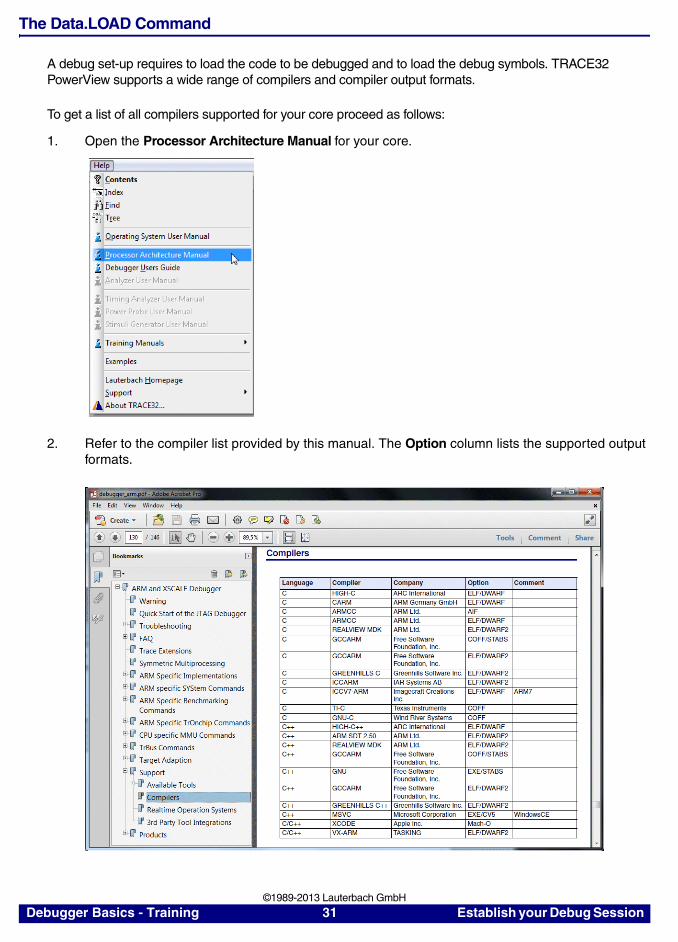
A debug set-up requires to load the code to be debugged and to load the debug symbols. TRACE32 PowerView supports a wide range of compilers and compiler output formats.
To get a list of all compilers supported for your core proceed as follows:
1. Open the Processor Architecture Manual for your core.
2. Refer to the compiler list provided by this manual. The Option column lists the supported output formats.
Debugger Basics - Training 31 Establish your Debug Session ©1989-2013 Lauterbach GmbH
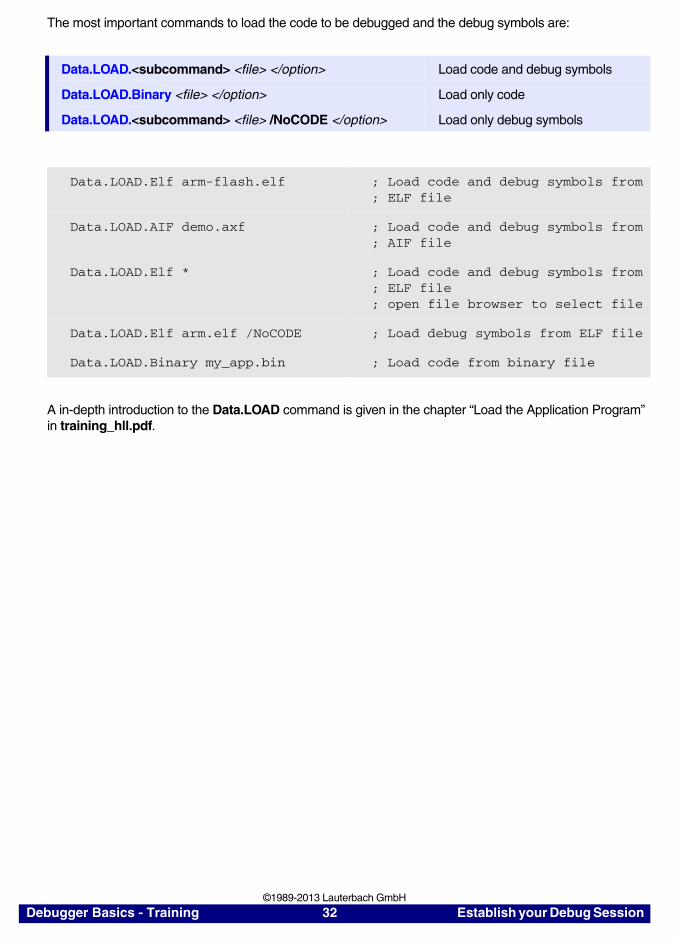
The most important commands to load the code to be debugged and the debug symbols are:
A in-depth introduction to the Data.LOAD command is given in the chapter “Load the Application Program” in training_hll.pdf.
Data.LOAD.<subcommand> <file> </option> Load code and debug symbols
Data.LOAD.Binary <file> </option> Load only code
Data.LOAD.<subcommand> <file> /NoCODE </option> Load only debug symbols
Data.LOAD.Elf arm-flash.elf ; Load code and debug symbols from; ELF file
Data.LOAD.AIF demo.axf ; Load code and debug symbols from; AIF file
Data.LOAD.Elf * ; Load code and debug symbols from; ELF file ; open file browser to select file
Data.LOAD.Elf arm.elf /NoCODE ; Load debug symbols from ELF file
Data.LOAD.Binary my_app.bin ; Load code from binary file
Debugger Basics - Training 32 Establish your Debug Session ©1989-2013 Lauterbach GmbH
The TASK.CONFIG Command
Today most applications use an operating system. TRACE32 PowerView includes a configurable target-OS debugger to provide symbolic debugging of operating systems.
Lauterbach provides ready-to-run configuration files for most common available OSes.
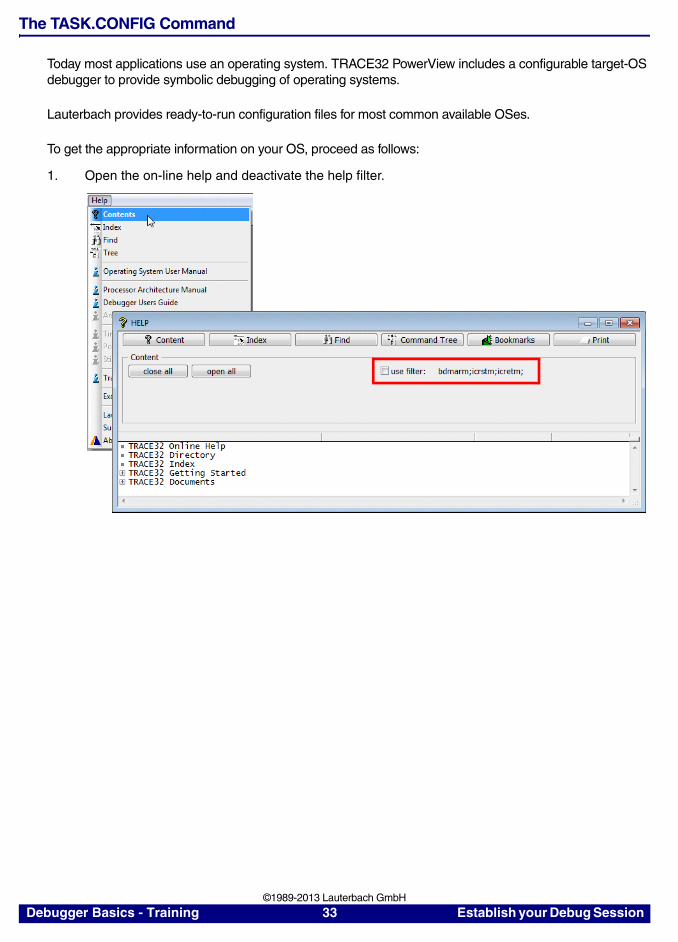
To get the appropriate information on your OS, proceed as follows:
1. Open the on-line help and deactivate the help filter.
Debugger Basics - Training 33 Establish your Debug Session ©1989-2013 Lauterbach GmbH
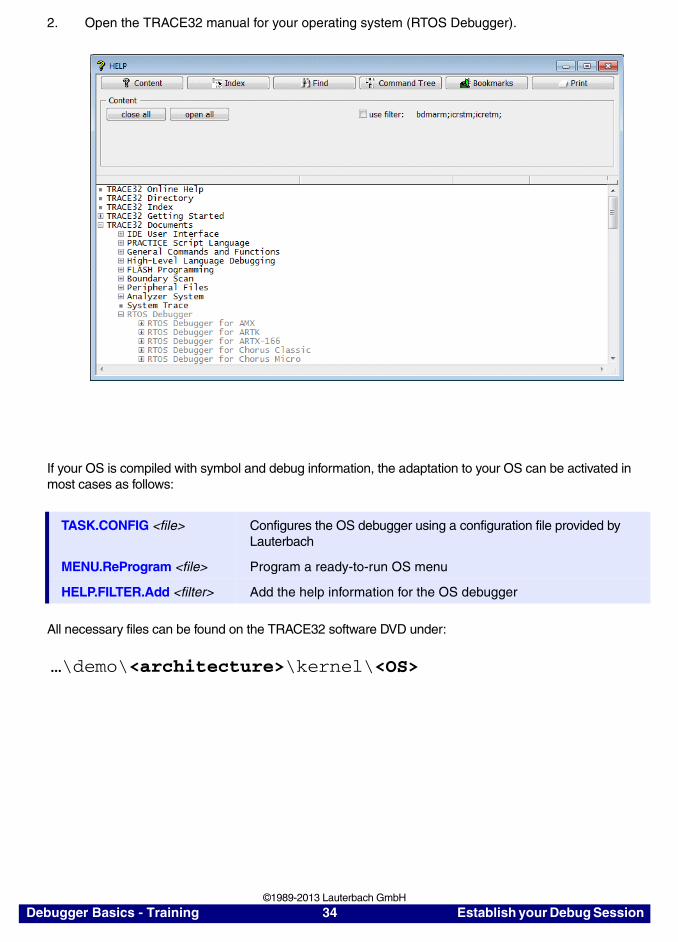
2. Open the TRACE32 manual for your operating system (RTOS Debugger).
If your OS is compiled with symbol and debug information, the adaptation to your OS can be activated in most cases as follows:
All necessary files can be found on the TRACE32 software DVD under:
…\demo\<architecture>\kernel\<OS>
TASK.CONFIG <file> Configures the OS debugger using a configuration file provided by Lauterbach
MENU.ReProgram <file> Program a ready-to-run OS menu
HELP.FILTER.Add <filter> Add the help information for the OS debugger
Debugger Basics - Training 34 Establish your Debug Session ©1989-2013 Lauterbach GmbH
Debug Scenarios
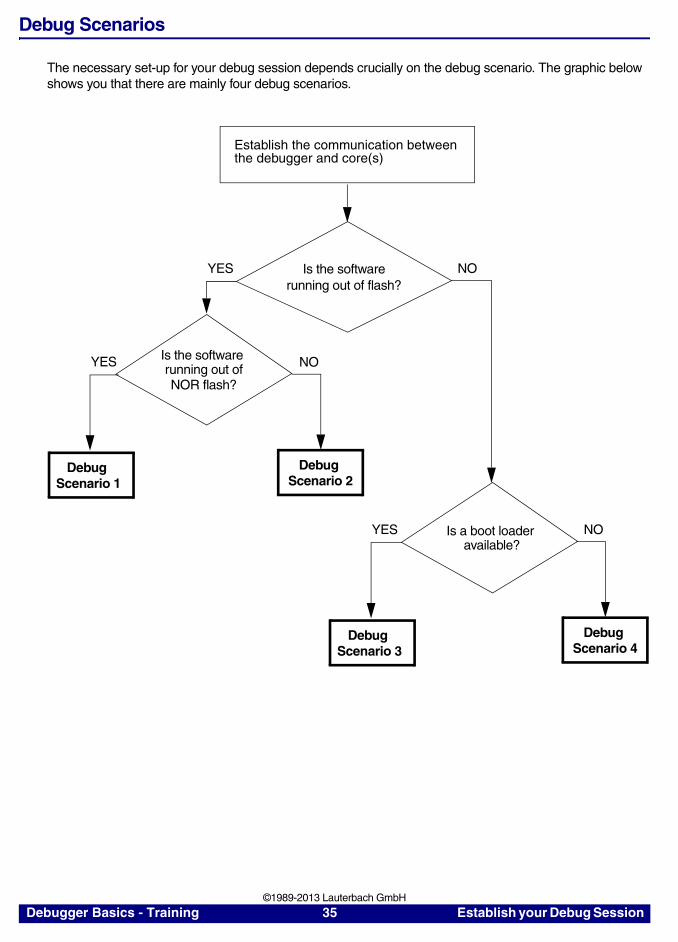
The necessary set-up for your debug session depends crucially on the debug scenario. The graphic below shows you that there are mainly four debug scenarios.
Is the softwarerunning out of flash?
Is a boot loader available?
YES NO
YES NO
Debug
Establish the communication betweenthe debugger and core(s)
Is the software running out of
Scenario 4Debug
Scenario 3
NOR flash?
YES
Debug Scenario 1
NO
Debug Scenario 2
Debugger Basics - Training 35 Establish your Debug Session ©1989-2013 Lauterbach GmbH
After the communication between the debugger and the core(s) is established, there a four debug scenarios. Each debug scenario requires a different set-up.
• Debug Scenario 1
The boot loader or the application (and/or the operating system) under debug is running out of NOR flash.
• Debug Scenario 2
The boot loader under debug is running out of a flash e.g. a NAND or serial flash.
• Debug Scenario 3
The application (and/or the operating system) under debug are running out of RAM and a ready-to-run boot loader configures the target system and especially the RAM for this debug scenario.
• Debug Scenario 4
The application (and/or the operating system) under debug are running out of RAM. The target configuration, especially the RAM configuration has to be done by TRACE32 commands, because there is no ready-to-run boot loader.
Debugger Basics - Training 36 Establish your Debug Session ©1989-2013 Lauterbach GmbH
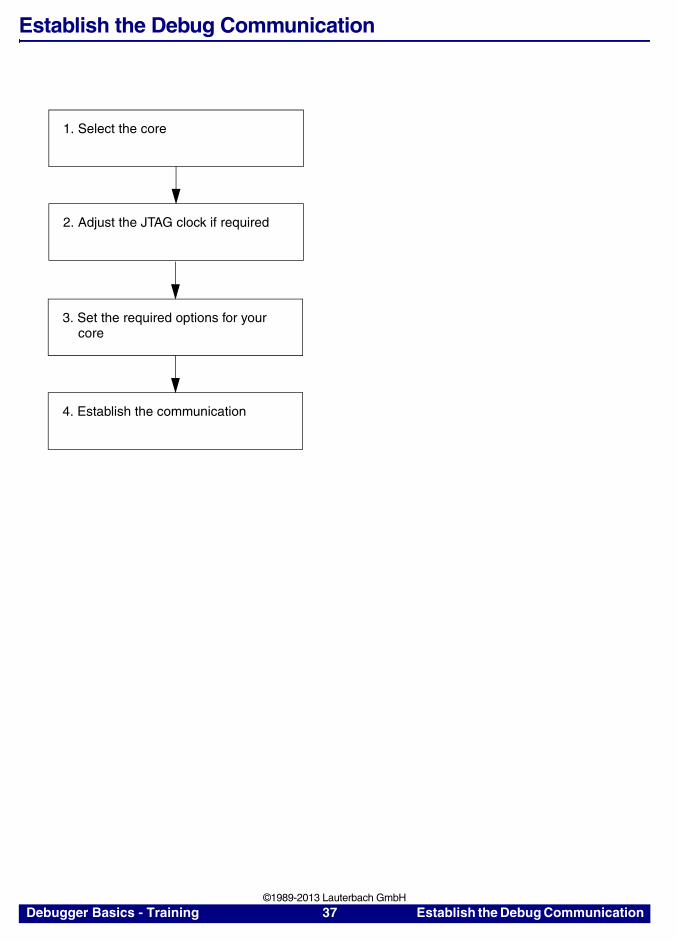
Establish the Debug Communication
1. Select the core
2. Adjust the JTAG clock if required
3. Set the required options for your core
4. Establish the communication
Debugger Basics - Training 37 Establish the Debug Communication ©1989-2013 Lauterbach GmbH
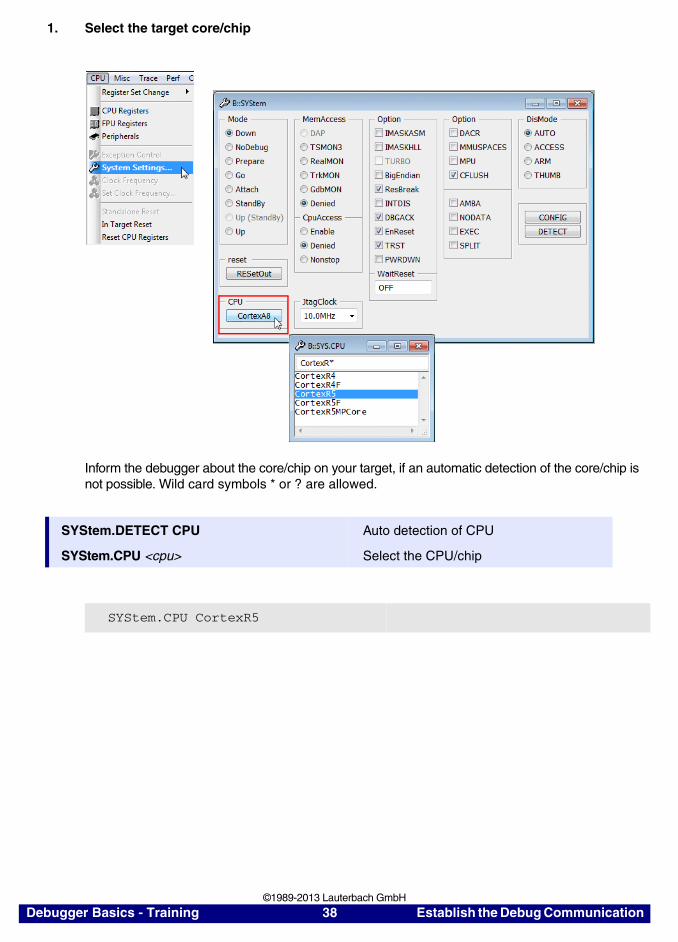
1. Select the target core/chip
Inform the debugger about the core/chip on your target, if an automatic detection of the core/chip is not possible. Wild card symbols * or ? are allowed.
SYStem.DETECT CPU Auto detection of CPU
SYStem.CPU <cpu> Select the CPU/chip
SYStem.CPU CortexR5
Debugger Basics - Training 38 Establish the Debug Communication ©1989-2013 Lauterbach GmbH
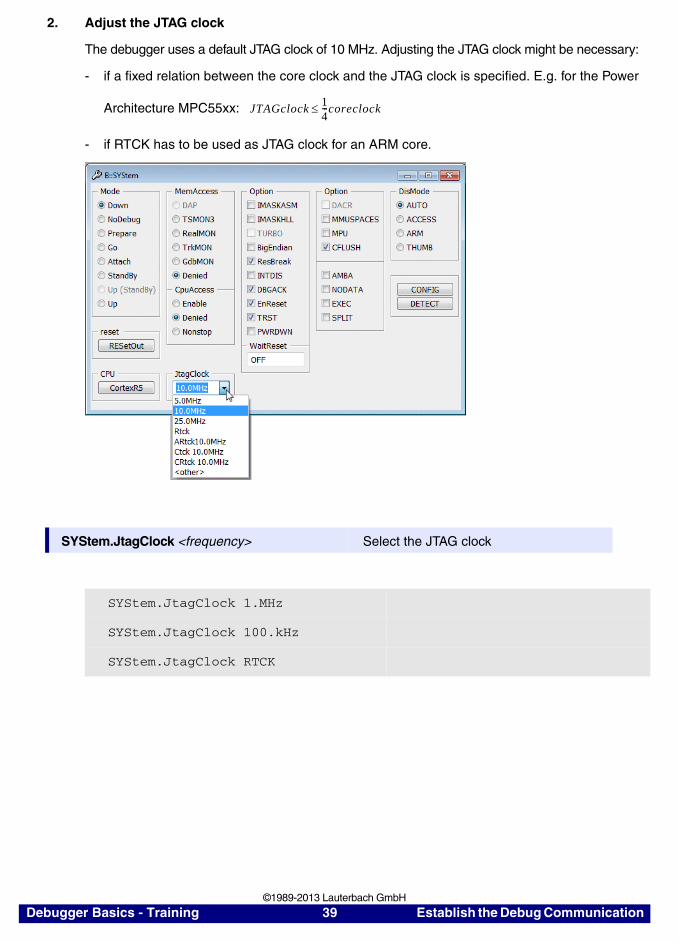
2. Adjust the JTAG clock
The debugger uses a default JTAG clock of 10 MHz. Adjusting the JTAG clock might be necessary:
- if a fixed relation between the core clock and the JTAG clock is specified. E.g. for the Power
Architecture MPC55xx:
- if RTCK has to be used as JTAG clock for an ARM core.
SYStem.JtagClock <frequency> Select the JTAG clock
SYStem.JtagClock 1.MHz
SYStem.JtagClock 100.kHz
SYStem.JtagClock RTCK
JTAGclock14---coreclock
Debugger Basics - Training 39 Establish the Debug Communication ©1989-2013 Lauterbach GmbH
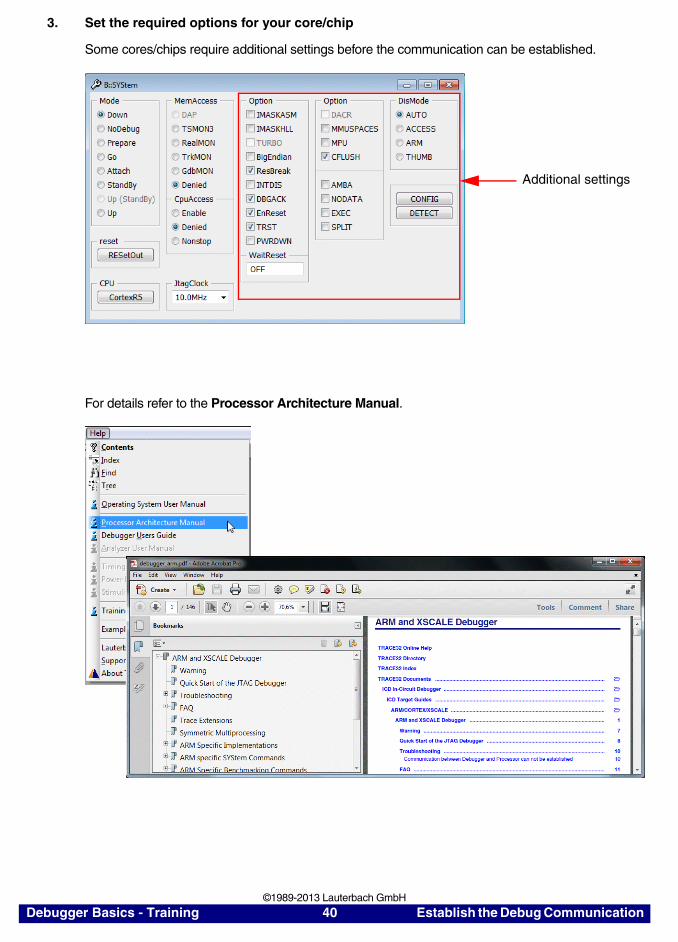
3. Set the required options for your core/chip
Some cores/chips require additional settings before the communication can be established.
For details refer to the Processor Architecture Manual.
Additional settings
Debugger Basics - Training 40 Establish the Debug Communication ©1989-2013 Lauterbach GmbH
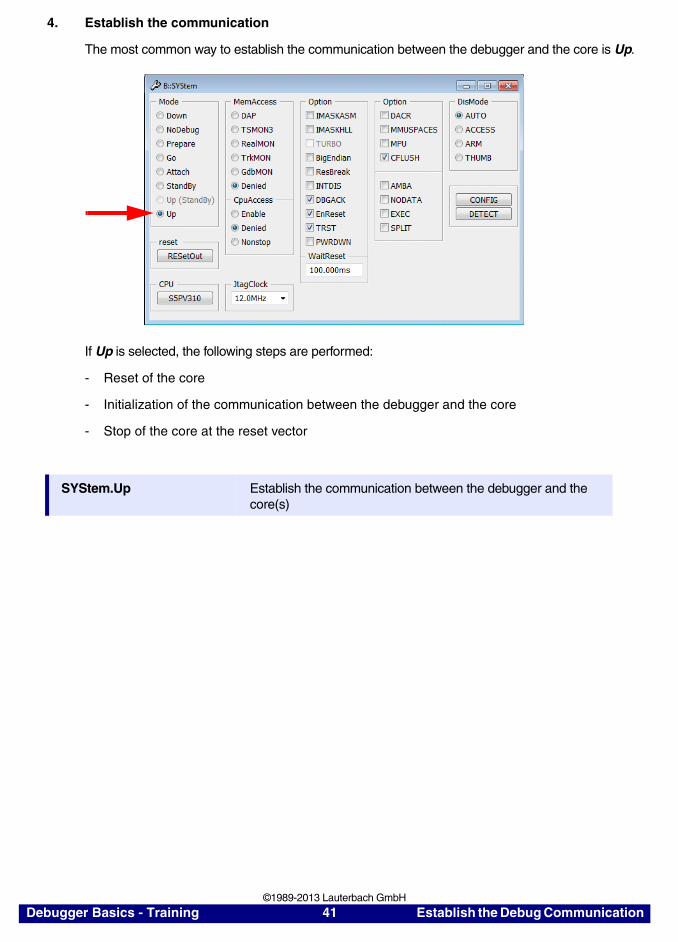
4. Establish the communication
The most common way to establish the communication between the debugger and the core is Up.
If Up is selected, the following steps are performed:
- Reset of the core
- Initialization of the communication between the debugger and the core
- Stop of the core at the reset vector
SYStem.Up Establish the communication between the debugger and the core(s)
Debugger Basics - Training 41 Establish the Debug Communication ©1989-2013 Lauterbach GmbH
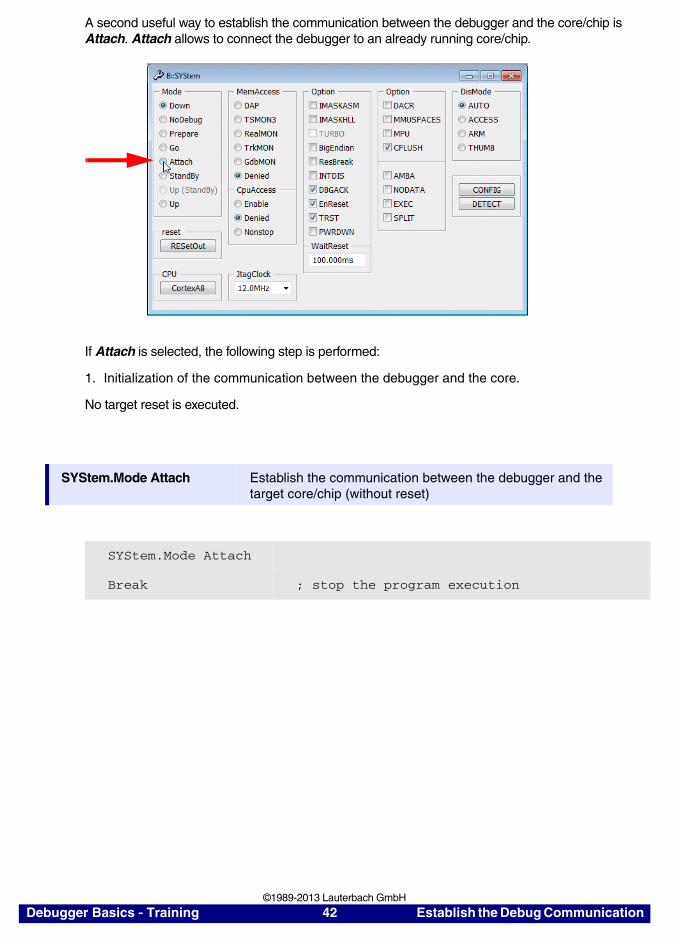
A second useful way to establish the communication between the debugger and the core/chip is Attach. Attach allows to connect the debugger to an already running core/chip.
If Attach is selected, the following step is performed:
1. Initialization of the communication between the debugger and the core.
No target reset is executed.
SYStem.Mode Attach Establish the communication between the debugger and the target core/chip (without reset)
SYStem.Mode Attach
Break ; stop the program execution
Debugger Basics - Training 42 Establish the Debug Communication ©1989-2013 Lauterbach GmbH
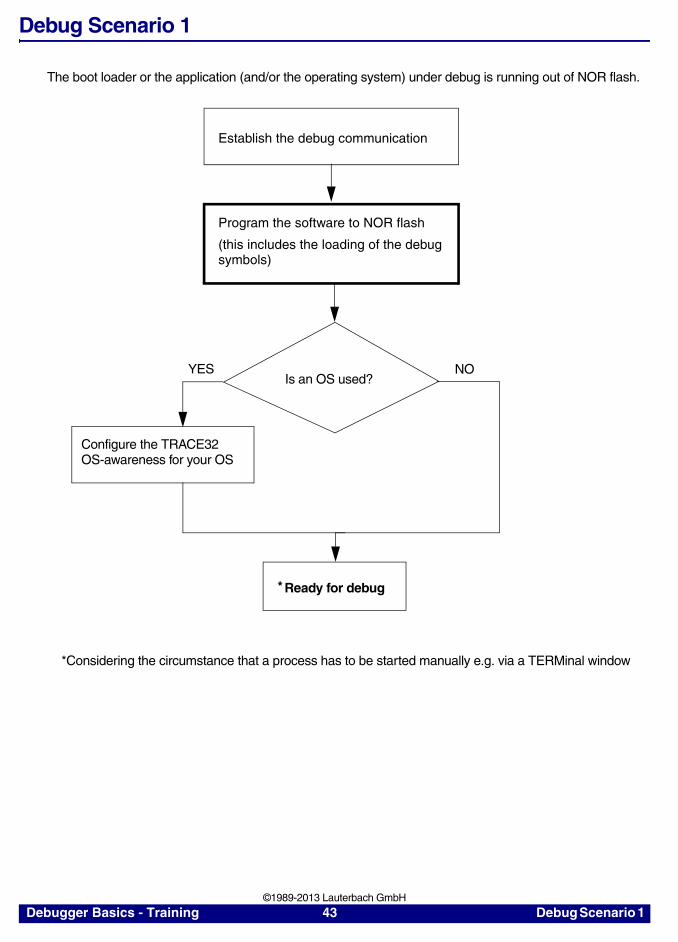
Debug Scenario 1
The boot loader or the application (and/or the operating system) under debug is running out of NOR flash.
Is an OS used?YES NO
Establish the debug communication
Program the software to NOR flash
(this includes the loading of the debugsymbols)
Configure the TRACE32OS-awareness for your OS
Ready for debug*
*Considering the circumstance that a process has to be started manually e.g. via a TERMinal window
Debugger Basics - Training 43 Debug Scenario 1 ©1989-2013 Lauterbach GmbH
NOR Flash Programming
The debugger supports the programming of on-chip and off-chip NOR flash devices.
The Flash Programming File
On-chip and off-chip NOR flash programming allows to load any output file generated by your compiler.
NOTE: Flash programming requires that data cache is disabled for the address range covered by the FLASH device.
Debugger Basics - Training 44 Debug Scenario 1 ©1989-2013 Lauterbach GmbH
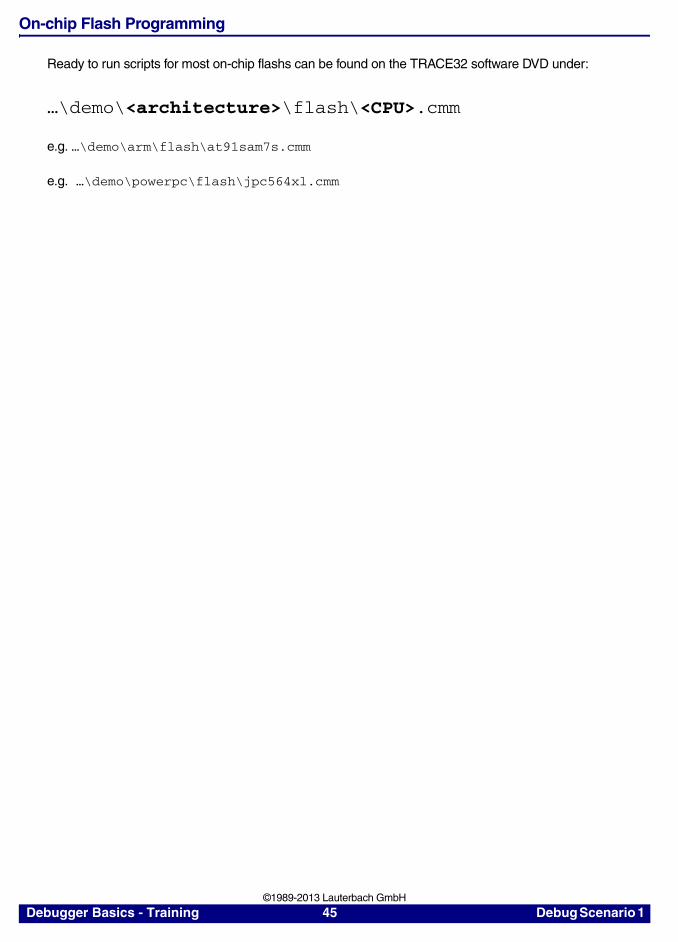
On-chip Flash Programming
Ready to run scripts for most on-chip flashs can be found on the TRACE32 software DVD under:
…\demo\<architecture>\flash\<CPU>.cmm
e.g. …\demo\arm\flash\at91sam7s.cmm
e.g. …\demo\powerpc\flash\jpc564xl.cmm
Debugger Basics - Training 45 Debug Scenario 1 ©1989-2013 Lauterbach GmbH
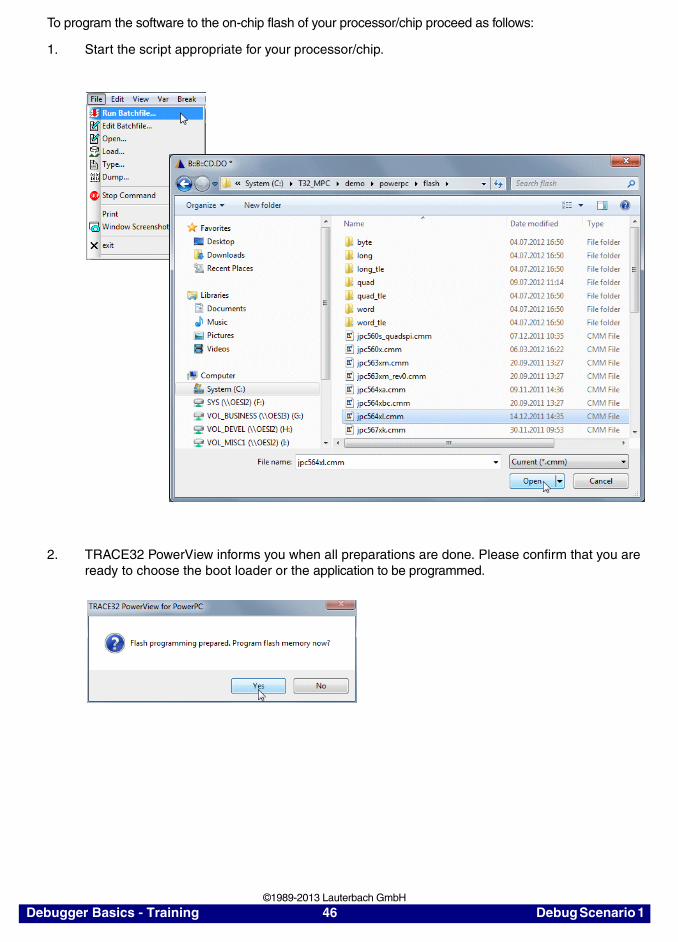
To program the software to the on-chip flash of your processor/chip proceed as follows:
1. Start the script appropriate for your processor/chip.
2. TRACE32 PowerView informs you when all preparations are done. Please confirm that you are ready to choose the boot loader or the application to be programmed.
Debugger Basics - Training 46 Debug Scenario 1 ©1989-2013 Lauterbach GmbH
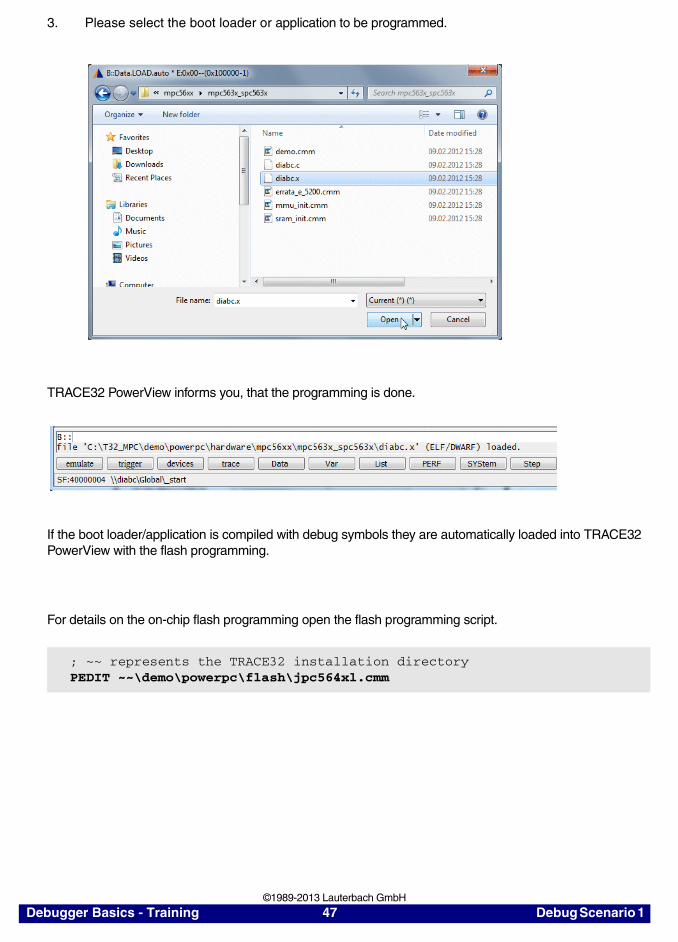
3. Please select the boot loader or application to be programmed.
TRACE32 PowerView informs you, that the programming is done.
If the boot loader/application is compiled with debug symbols they are automatically loaded into TRACE32 PowerView with the flash programming.
For details on the on-chip flash programming open the flash programming script.
; ~~ represents the TRACE32 installation directoryPEDIT ~~\demo\powerpc\flash\jpc564xl.cmm
Debugger Basics - Training 47 Debug Scenario 1 ©1989-2013 Lauterbach GmbH
Off-chip Flash Programming
TRACE32 PowerView provides two methods to program off-chip flash:
1. Tool-based programming
Tool-based programming means that the flash programming algorithm is part of the TRACE32 software. Tool-based programming is easy to configure but slow.
2. Target-controlled programming
Target-controlled flash programming means that the underlying flash programming algorithm is detached from the TRACE32 software. Target-controlled flash programming works as follows:
1. The flash algorithm is downloaded to the target RAM.
2. The programming data are downloaded to the target RAM.
3. The flash algorithm running in the target RAM programs the data to the flash devices.
Target-controlled flash programming minimizes the communication between the host and the debugger hardware. This makes target-controlled flash programming fast.
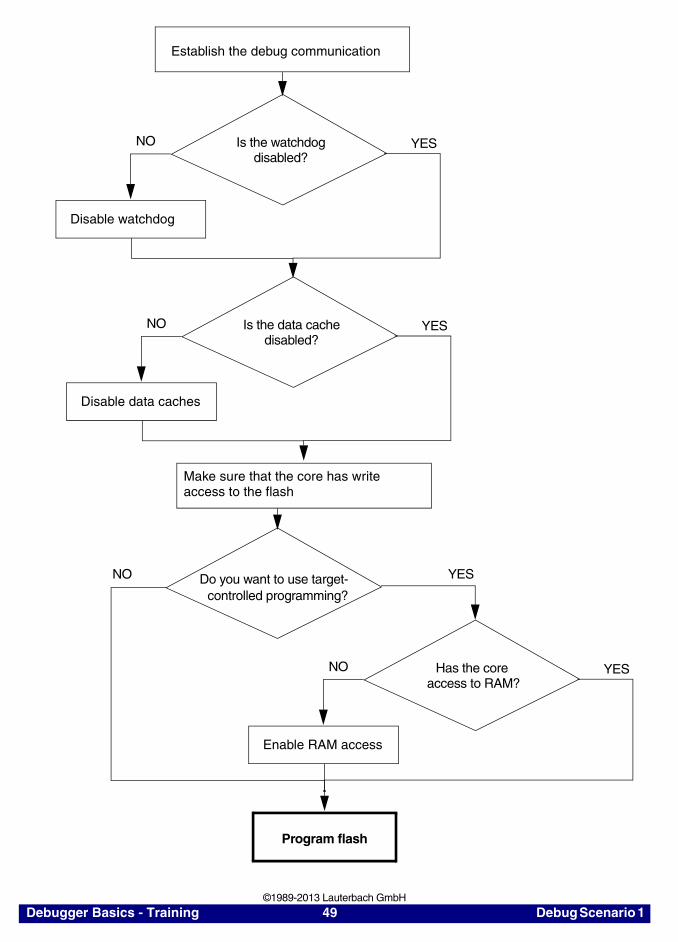
Programming off-chip NOR flash requires the following steps (see next page):
NOTE: It is recommended to start with tool-based flash programming. If this works properly you can switch to target-controlled flash programming.
Debugger Basics - Training 48 Debug Scenario 1 ©1989-2013 Lauterbach GmbH
Program flash
Make sure that the core has write access to the flash
Is the watchdogdisabled?
Disable watchdog
NO YES
Establish the debug communication
Is the data cachedisabled?
Disable data caches
NO YES
Has the core access to RAM?
Enable RAM access
NO YES
Do you want to use target- controlled programming?
YESNO
Debugger Basics - Training 49 Debug Scenario 1 ©1989-2013 Lauterbach GmbH
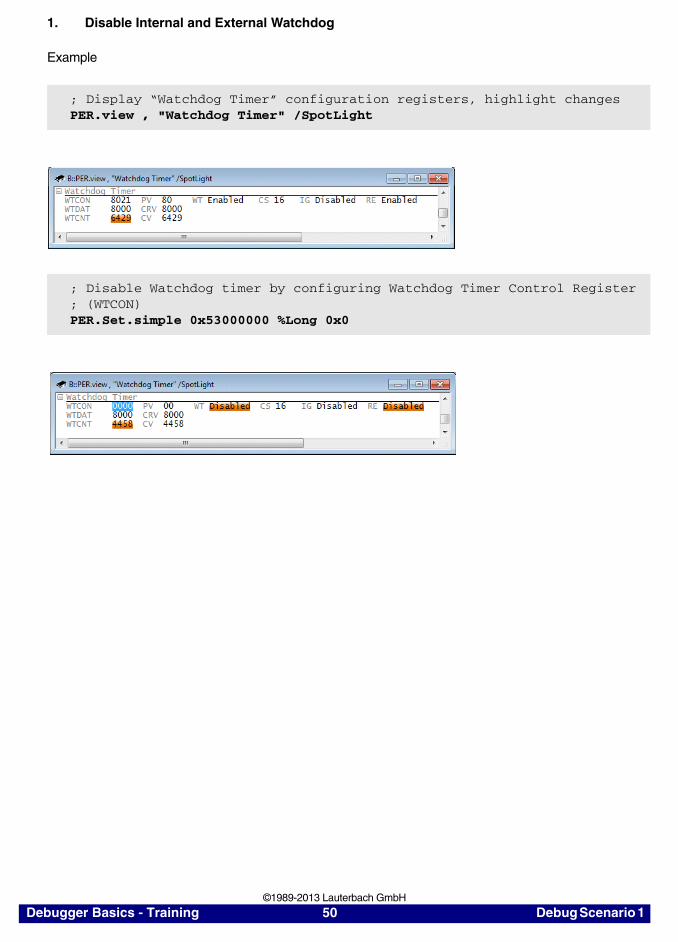
1. Disable Internal and External Watchdog
Example
; Display “Watchdog Timer” configuration registers, highlight changesPER.view , "Watchdog Timer" /SpotLight
; Disable Watchdog timer by configuring Watchdog Timer Control Register; (WTCON) PER.Set.simple 0x53000000 %Long 0x0
Debugger Basics - Training 50 Debug Scenario 1 ©1989-2013 Lauterbach GmbH
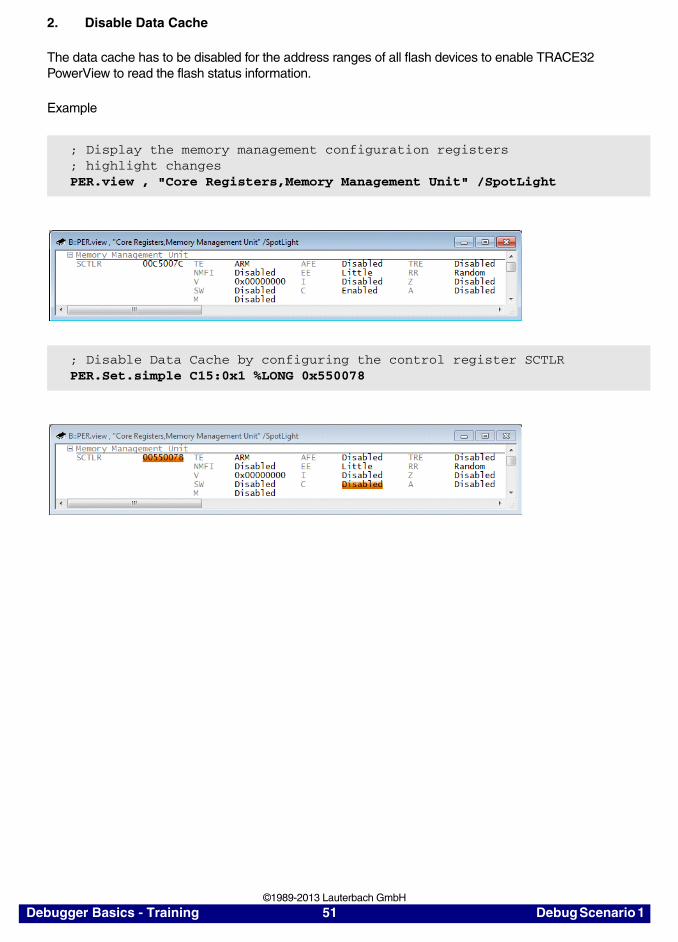
2. Disable Data Cache
The data cache has to be disabled for the address ranges of all flash devices to enable TRACE32 PowerView to read the flash status information.
Example
; Display the memory management configuration registers; highlight changesPER.view , "Core Registers,Memory Management Unit" /SpotLight
; Disable Data Cache by configuring the control register SCTLRPER.Set.simple C15:0x1 %LONG 0x550078
Debugger Basics - Training 51 Debug Scenario 1 ©1989-2013 Lauterbach GmbH
3. Make sure that the core has write access to the flash
NOR flash programming requires that the core has write access to the flash device(s).
The following settings in the bus configuration have to be done for each NOR flash device:
• Definition of the base address of the NOR flash device
• Definition of the size of the NOR flash device
• Definition of the bus size that is used to access the NOR flash device
• The write access has to be enabled for the NOR flash device
• Definition of the timing (number of wait states for the write access to the NOR flash device)
Use the PER.view command to check the settings in the bus configuration registers.
Debugger Basics - Training 52 Debug Scenario 1 ©1989-2013 Lauterbach GmbH
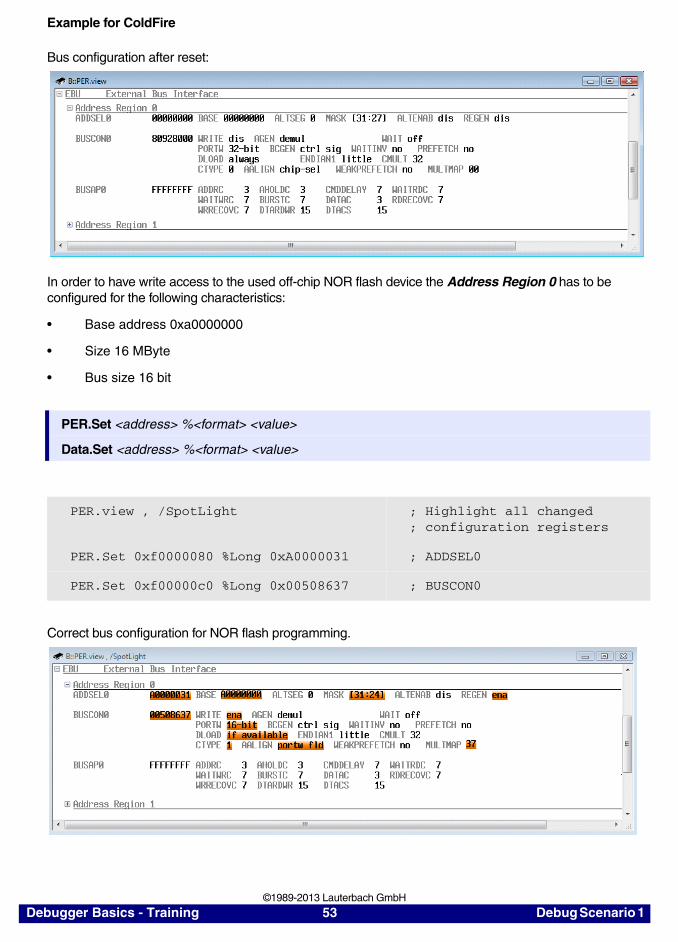
Example for ColdFire
Bus configuration after reset:
In order to have write access to the used off-chip NOR flash device the Address Region 0 has to be configured for the following characteristics:
• Base address 0xa0000000
• Size 16 MByte
• Bus size 16 bit
Correct bus configuration for NOR flash programming.
PER.Set <address> %<format> <value>
Data.Set <address> %<format> <value>
PER.view , /SpotLight ; Highlight all changed; configuration registers
PER.Set 0xf0000080 %Long 0xA0000031 ; ADDSEL0
PER.Set 0xf00000c0 %Long 0x00508637 ; BUSCON0
Debugger Basics - Training 53 Debug Scenario 1 ©1989-2013 Lauterbach GmbH
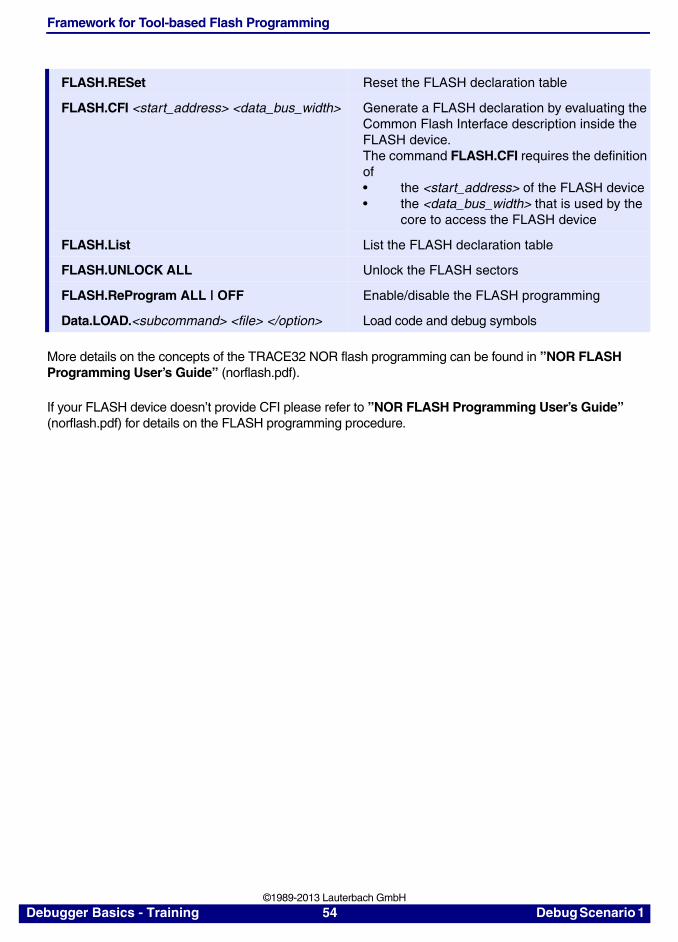
Framework for Tool-based Flash Programming
More details on the concepts of the TRACE32 NOR flash programming can be found in ”NOR FLASH Programming User’s Guide” (norflash.pdf).
If your FLASH device doesn’t provide CFI please refer to ”NOR FLASH Programming User’s Guide” (norflash.pdf) for details on the FLASH programming procedure.
FLASH.RESet Reset the FLASH declaration table
FLASH.CFI <start_address> <data_bus_width> Generate a FLASH declaration by evaluating the Common Flash Interface description inside the FLASH device.The command FLASH.CFI requires the definition of• the <start_address> of the FLASH device• the <data_bus_width> that is used by the
core to access the FLASH device
FLASH.List List the FLASH declaration table
FLASH.UNLOCK ALL Unlock the FLASH sectors
FLASH.ReProgram ALL | OFF Enable/disable the FLASH programming
Data.LOAD.<subcommand> <file> </option> Load code and debug symbols
Debugger Basics - Training 54 Debug Scenario 1 ©1989-2013 Lauterbach GmbH
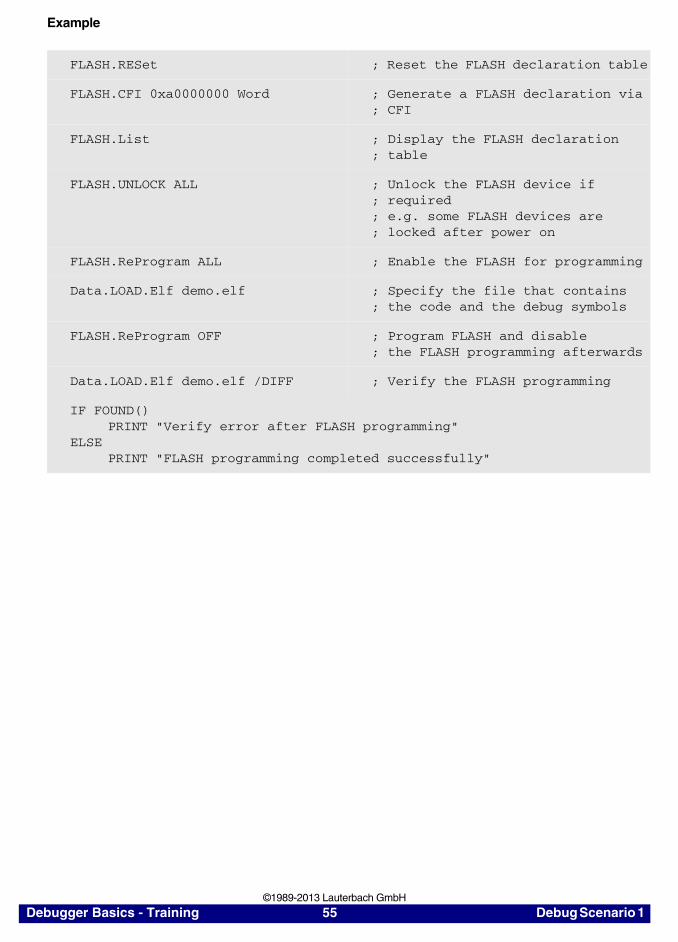
Example
FLASH.RESet ; Reset the FLASH declaration table
FLASH.CFI 0xa0000000 Word ; Generate a FLASH declaration via; CFI
FLASH.List ; Display the FLASH declaration; table
FLASH.UNLOCK ALL ; Unlock the FLASH device if; required; e.g. some FLASH devices are; locked after power on
FLASH.ReProgram ALL ; Enable the FLASH for programming
Data.LOAD.Elf demo.elf ; Specify the file that contains; the code and the debug symbols
FLASH.ReProgram OFF ; Program FLASH and disable ; the FLASH programming afterwards
Data.LOAD.Elf demo.elf /DIFF ; Verify the FLASH programming
IF FOUND()PRINT "Verify error after FLASH programming"
ELSEPRINT "FLASH programming completed successfully"
Debugger Basics - Training 55 Debug Scenario 1 ©1989-2013 Lauterbach GmbH
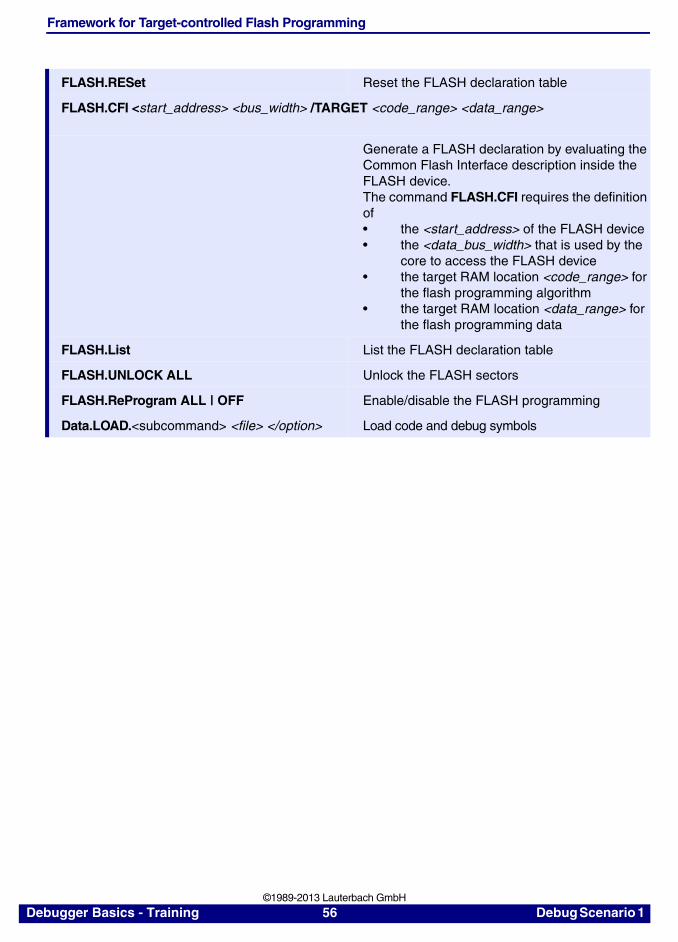
Framework for Target-controlled Flash Programming
FLASH.RESet Reset the FLASH declaration table
FLASH.CFI <start_address> <bus_width> /TARGET <code_range> <data_range>
Generate a FLASH declaration by evaluating the Common Flash Interface description inside the FLASH device.The command FLASH.CFI requires the definition of• the <start_address> of the FLASH device• the <data_bus_width> that is used by the
core to access the FLASH device• the target RAM location <code_range> for
the flash programming algorithm• the target RAM location <data_range> for
the flash programming data
FLASH.List List the FLASH declaration table
FLASH.UNLOCK ALL Unlock the FLASH sectors
FLASH.ReProgram ALL | OFF Enable/disable the FLASH programming
Data.LOAD.<subcommand> <file> </option> Load code and debug symbols
Debugger Basics - Training 56 Debug Scenario 1 ©1989-2013 Lauterbach GmbH
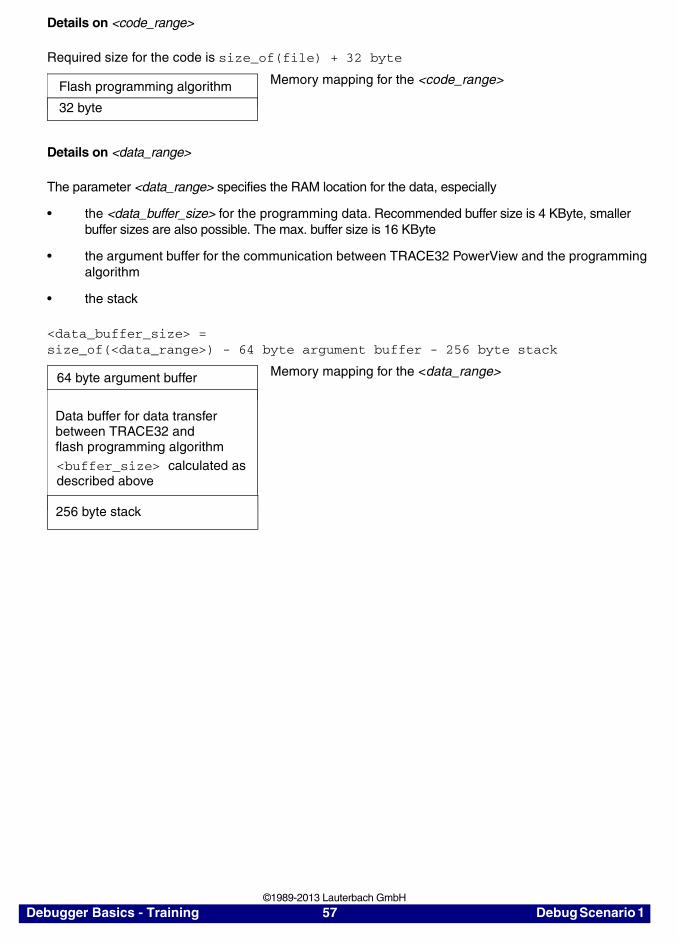
Details on <code_range>
Required size for the code is size_of(file) + 32 byte
Details on <data_range>
The parameter <data_range> specifies the RAM location for the data, especially
• the <data_buffer_size> for the programming data. Recommended buffer size is 4 KByte, smaller buffer sizes are also possible. The max. buffer size is 16 KByte
• the argument buffer for the communication between TRACE32 PowerView and the programming algorithm
• the stack
<data_buffer_size> = size_of(<data_range>) - 64 byte argument buffer - 256 byte stack
Memory mapping for the <code_range> Flash programming algorithm
32 byte
Memory mapping for the <data_range>
Data buffer for data transfer between TRACE32 and flash programming algorithm<buffer_size> calculated asdescribed above
256 byte stack
64 byte argument buffer
Debugger Basics - Training 57 Debug Scenario 1 ©1989-2013 Lauterbach GmbH
4. Enable RAM Access
Target-controlled Flash Programming requires, that the core has access to the RAM locations specified for <code_range> and <data_range>.
If this is not the case the following settings in the bus configuration have to be done for an off-chip RAM:
• Definition of the base address of the RAM
• Definition of the size of the RAM
• Definition of the bus size that is used to access the RAM
• Definition of the timing (number of wait states for the RAM access)
Debugger Basics - Training 58 Debug Scenario 1 ©1989-2013 Lauterbach GmbH
Example
Configure the TRACE32 OS-Awareness
Refer to page 33 for details.
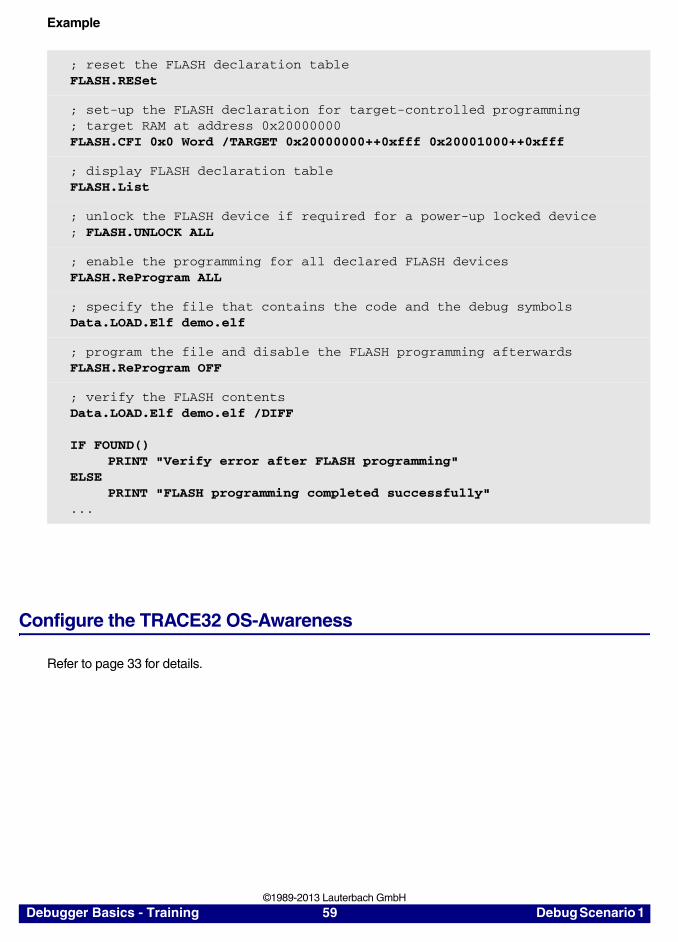
; reset the FLASH declaration tableFLASH.RESet
; set-up the FLASH declaration for target-controlled programming; target RAM at address 0x20000000FLASH.CFI 0x0 Word /TARGET 0x20000000++0xfff 0x20001000++0xfff
; display FLASH declaration tableFLASH.List
; unlock the FLASH device if required for a power-up locked device; FLASH.UNLOCK ALL
; enable the programming for all declared FLASH devicesFLASH.ReProgram ALL
; specify the file that contains the code and the debug symbolsData.LOAD.Elf demo.elf
; program the file and disable the FLASH programming afterwardsFLASH.ReProgram OFF
; verify the FLASH contentsData.LOAD.Elf demo.elf /DIFF
IF FOUND()PRINT "Verify error after FLASH programming"
ELSEPRINT "FLASH programming completed successfully"
...
Debugger Basics - Training 59 Debug Scenario 1 ©1989-2013 Lauterbach GmbH
Debug Scenario 2
The boot loader under debug is running out of a flash e.g. a NAND flash.
In contrast to NOR flash, code can not be executed out of NAND or serial flash. The code has always to be copied to RAM before it can be executed.
Typical Boot Sequence
Before the set-up for debug scenario 2 is described, it might be useful to have a look at a typical boot sequence. If the boot loader is running out of flash the system start-up might include the following steps:
Debugger Basics - Training 60 Debug Scenario 2 ©1989-2013 Lauterbach GmbH
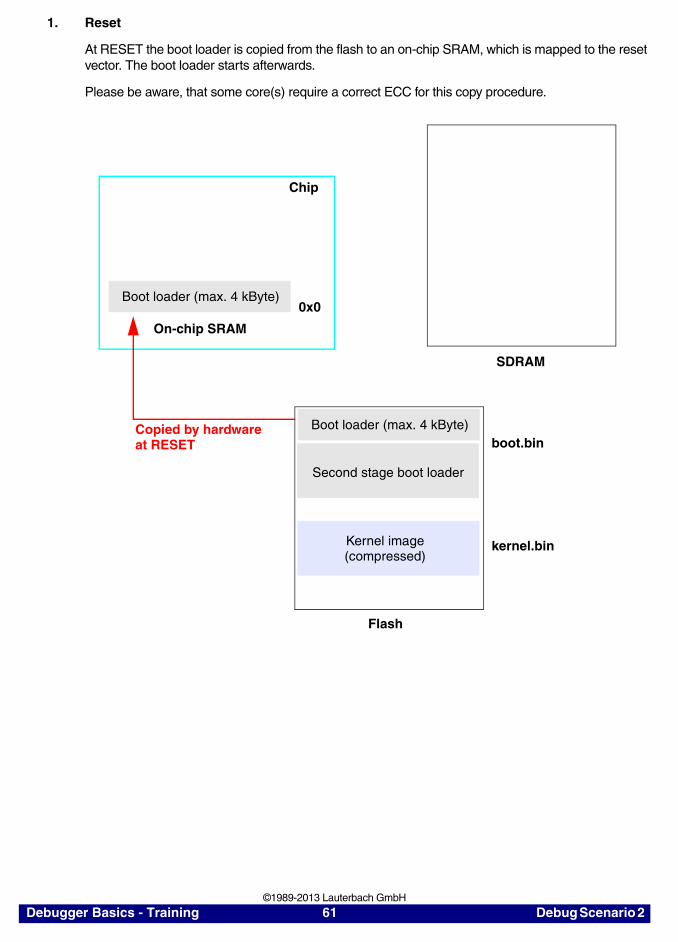
1. Reset
At RESET the boot loader is copied from the flash to an on-chip SRAM, which is mapped to the reset vector. The boot loader starts afterwards.
Please be aware, that some core(s) require a correct ECC for this copy procedure.
Flash
Boot loader (max. 4 kByte)
Kernel image(compressed)
Second stage boot loader
Boot loader (max. 4 kByte)
Chip
On-chip SRAM
SDRAM
Copied by hardwareat RESET boot.bin
kernel.bin
0x0
Debugger Basics - Training 61 Debug Scenario 2 ©1989-2013 Lauterbach GmbH
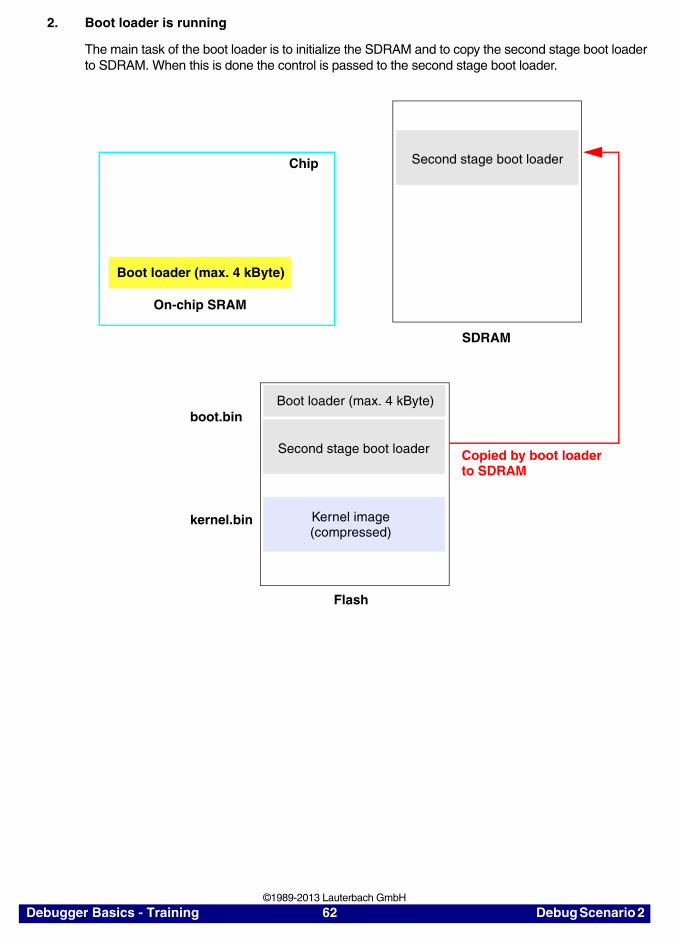
2. Boot loader is running
The main task of the boot loader is to initialize the SDRAM and to copy the second stage boot loader to SDRAM. When this is done the control is passed to the second stage boot loader.
Flash
Boot loader (max. 4 kByte)
Kernel image(compressed)
Second stage boot loader
Boot loader (max. 4 kByte)
Chip
On-chip SRAM
SDRAM
Second stage boot loader
Copied by boot loaderto SDRAM
boot.bin
kernel.bin
Debugger Basics - Training 62 Debug Scenario 2 ©1989-2013 Lauterbach GmbH
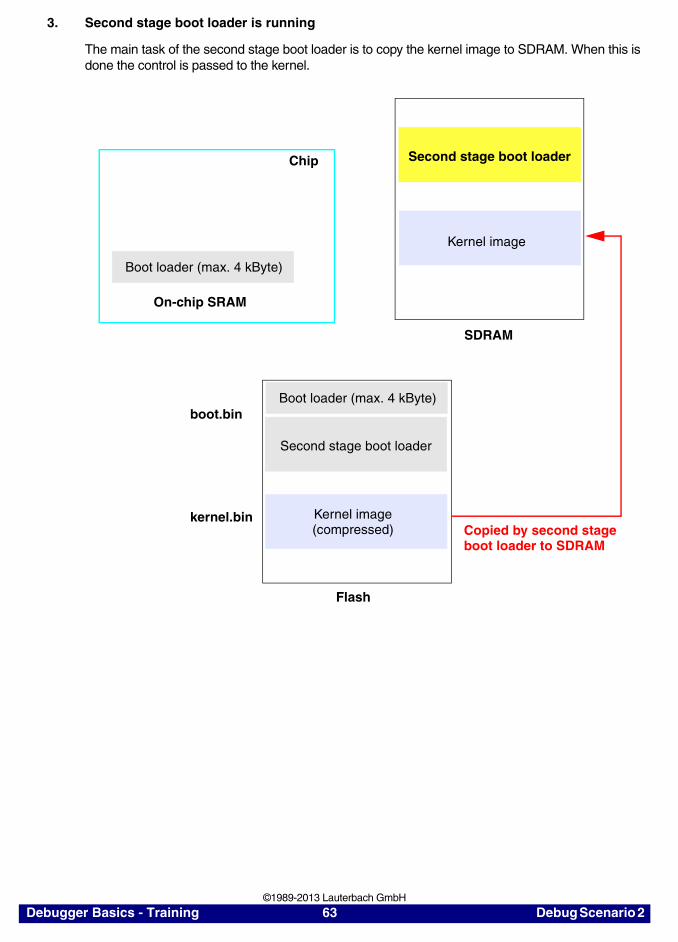
3. Second stage boot loader is running
The main task of the second stage boot loader is to copy the kernel image to SDRAM. When this is done the control is passed to the kernel.
Flash
Boot loader (max. 4 kByte)
Kernel image(compressed)
Second stage boot loader
Chip
On-chip SRAM
SDRAM
Second stage boot loader
Copied by second stage boot loader to SDRAM
Boot loader (max. 4 kByte)
Kernel image
boot.bin
kernel.bin
Debugger Basics - Training 63 Debug Scenario 2 ©1989-2013 Lauterbach GmbH
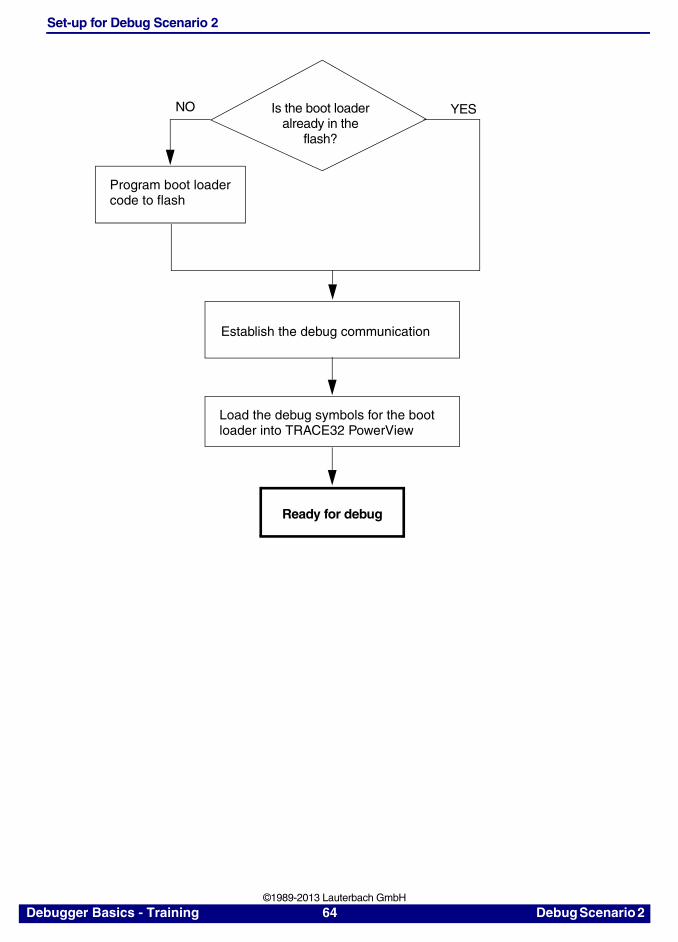
Set-up for Debug Scenario 2
Establish the debug communication
Load the debug symbols for the boot
Is the boot loaderalready in the
flash?
Program boot loader
NO
code to flash
YES
loader into TRACE32 PowerView
Ready for debug
Debugger Basics - Training 64 Debug Scenario 2 ©1989-2013 Lauterbach GmbH
Flash Programming (NAND/Serial/eMMC)
The Flash Programming File and the Debug Symbol File
Flash programming can only program binary files. Therefore two output files have to be generated by the compiler:
• A binary file (e.g. boot.bin)
• A file containing the debug symbols (e.g. boot.elf)
NOTE: Flash programming requires that data cache and MMU is disabled.
Debugger Basics - Training 65 Debug Scenario 2 ©1989-2013 Lauterbach GmbH
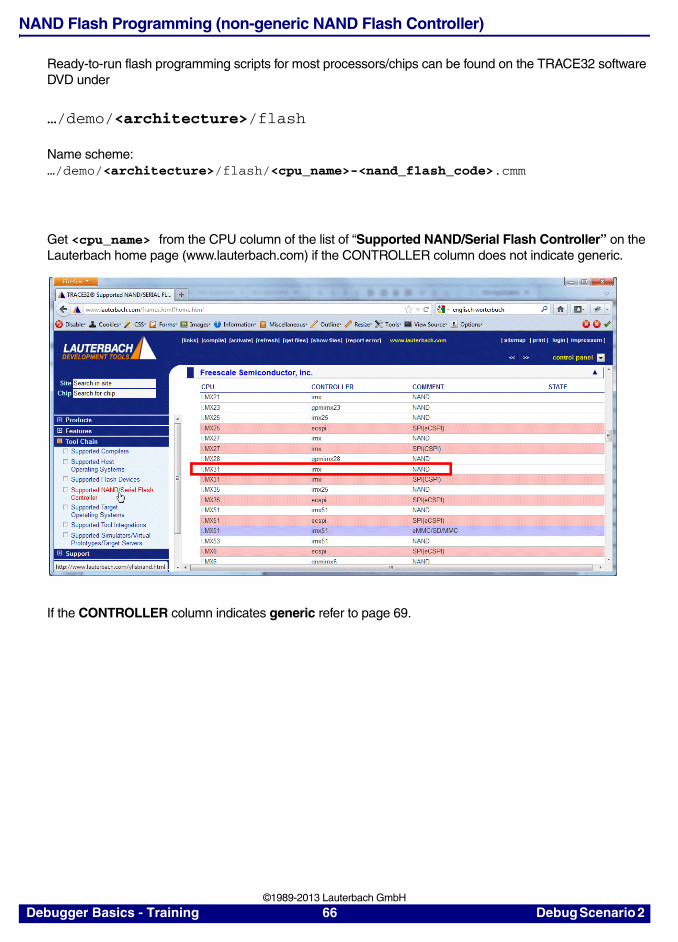
NAND Flash Programming (non-generic NAND Flash Controller)
Ready-to-run flash programming scripts for most processors/chips can be found on the TRACE32 software DVD under
…/demo/<architecture>/flash
Name scheme:…/demo/<architecture>/flash/<cpu_name>-<nand_flash_code>.cmm
Get <cpu_name> from the CPU column of the list of “Supported NAND/Serial Flash Controller” on the Lauterbach home page (www.lauterbach.com) if the CONTROLLER column does not indicate generic.
If the CONTROLLER column indicates generic refer to page 69.
Debugger Basics - Training 66 Debug Scenario 2 ©1989-2013 Lauterbach GmbH
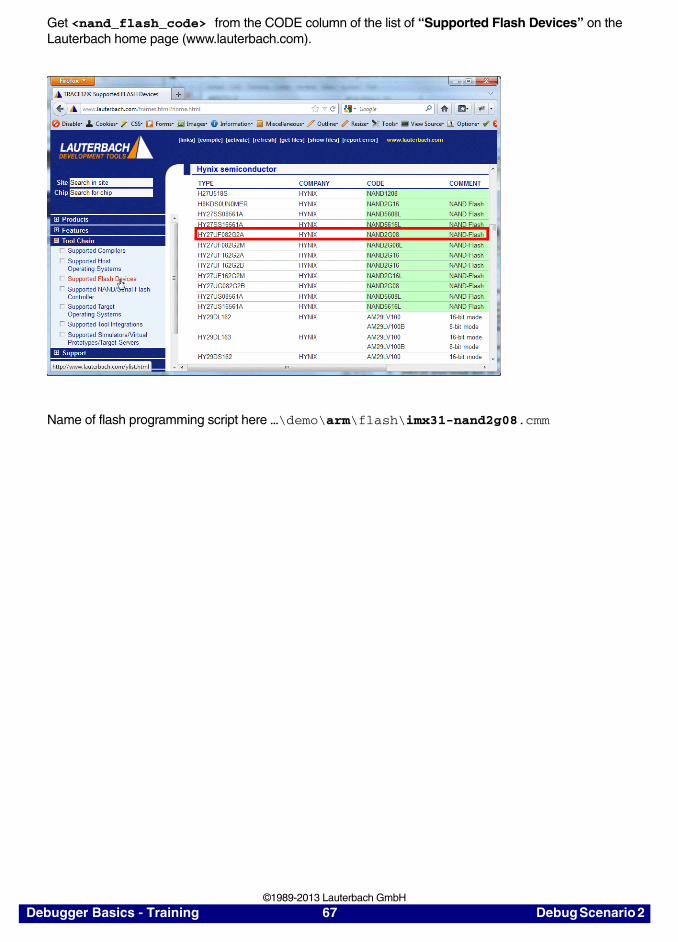
Get <nand_flash_code> from the CODE column of the list of “Supported Flash Devices” on the Lauterbach home page (www.lauterbach.com).
Name of flash programming script here …\demo\arm\flash\imx31-nand2g08.cmm
Debugger Basics - Training 67 Debug Scenario 2 ©1989-2013 Lauterbach GmbH
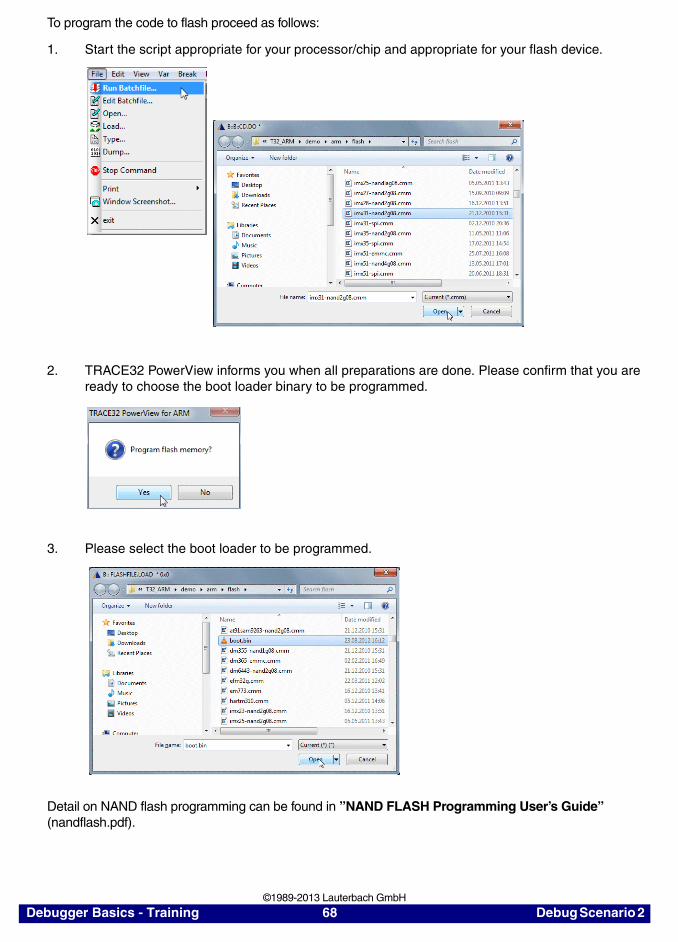
To program the code to flash proceed as follows:
1. Start the script appropriate for your processor/chip and appropriate for your flash device.
2. TRACE32 PowerView informs you when all preparations are done. Please confirm that you are ready to choose the boot loader binary to be programmed.
3. Please select the boot loader to be programmed.
Detail on NAND flash programming can be found in ”NAND FLASH Programming User’s Guide” (nandflash.pdf).
Debugger Basics - Training 68 Debug Scenario 2 ©1989-2013 Lauterbach GmbH
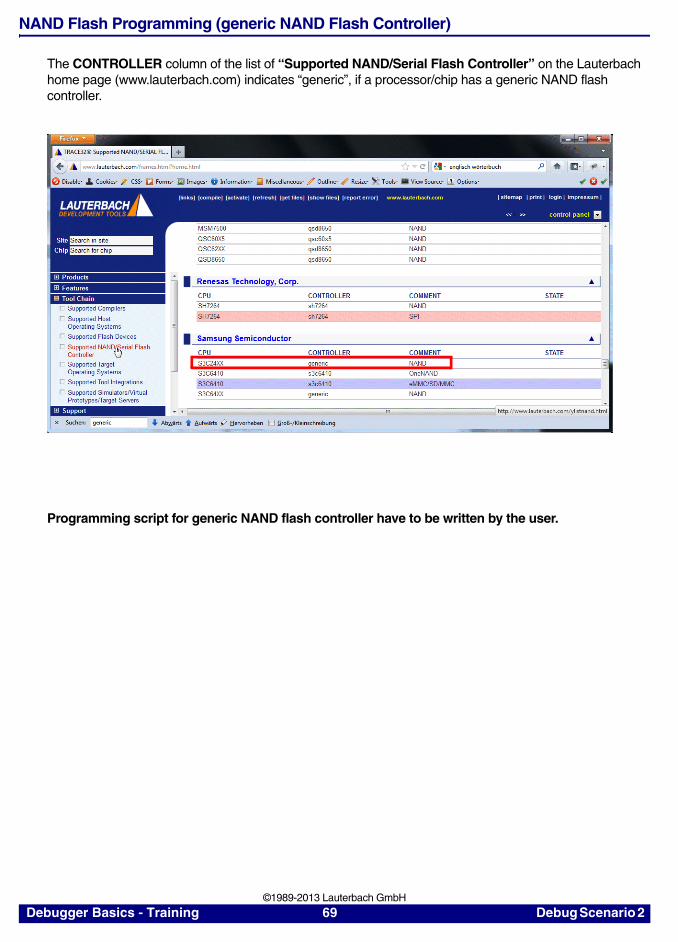
NAND Flash Programming (generic NAND Flash Controller)
The CONTROLLER column of the list of “Supported NAND/Serial Flash Controller” on the Lauterbach home page (www.lauterbach.com) indicates “generic”, if a processor/chip has a generic NAND flash controller.
Programming script for generic NAND flash controller have to be written by the user.
Debugger Basics - Training 69 Debug Scenario 2 ©1989-2013 Lauterbach GmbH
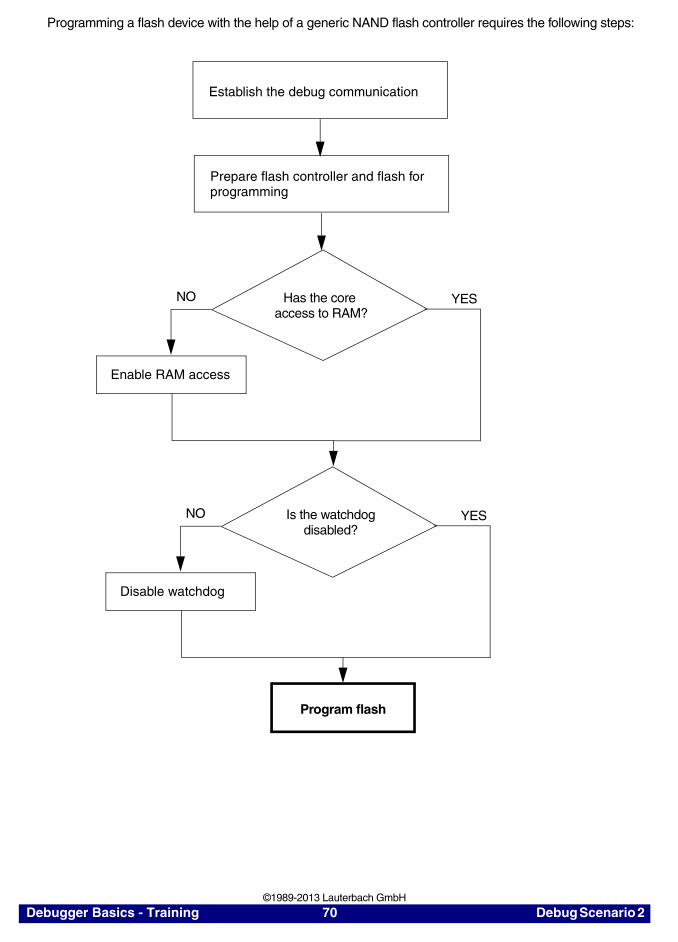
Programming a flash device with the help of a generic NAND flash controller requires the following steps:
Has the core access to RAM?
Enable RAM access
NO YES
Program flash
Prepare flash controller and flash for programming
Is the watchdogdisabled?
Disable watchdog
NO YES
Establish the debug communication
Debugger Basics - Training 70 Debug Scenario 2 ©1989-2013 Lauterbach GmbH
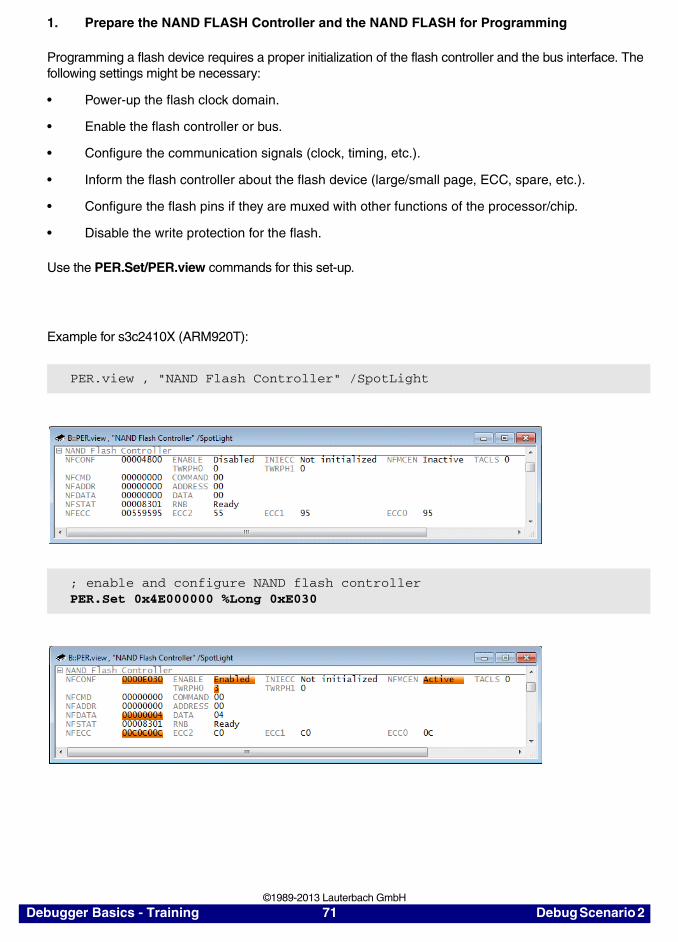
1. Prepare the NAND FLASH Controller and the NAND FLASH for Programming
Programming a flash device requires a proper initialization of the flash controller and the bus interface. The following settings might be necessary:
• Power-up the flash clock domain.
• Enable the flash controller or bus.
• Configure the communication signals (clock, timing, etc.).
• Inform the flash controller about the flash device (large/small page, ECC, spare, etc.).
• Configure the flash pins if they are muxed with other functions of the processor/chip.
• Disable the write protection for the flash.
Use the PER.Set/PER.view commands for this set-up.
Example for s3c2410X (ARM920T):
PER.view , "NAND Flash Controller" /SpotLight
; enable and configure NAND flash controllerPER.Set 0x4E000000 %Long 0xE030
Debugger Basics - Training 71 Debug Scenario 2 ©1989-2013 Lauterbach GmbH
2. Enable RAM Access
TRACE32 PowerView runs the flash programming algorithm in target RAM. It requires at least 16 KByte of RAM for this purpose.
This requires that the core has access to target RAM.
If the core has no access to target RAM, the access to target RAM has to be set-up.
Correct settings in the bus configuration registers are key for the RAM access. The following settings in the bus configuration have to be done:
• Definition of the RAM base address
• Definition of the RAM size
• Definition of the bus size that is used to access the RAM
• The write access has to be enabled for the RAM
• Definition of the timing (number of wait states for the write access to the RAM)
Use the PER.Set/PER.view commands for this set-up.
Debugger Basics - Training 72 Debug Scenario 2 ©1989-2013 Lauterbach GmbH
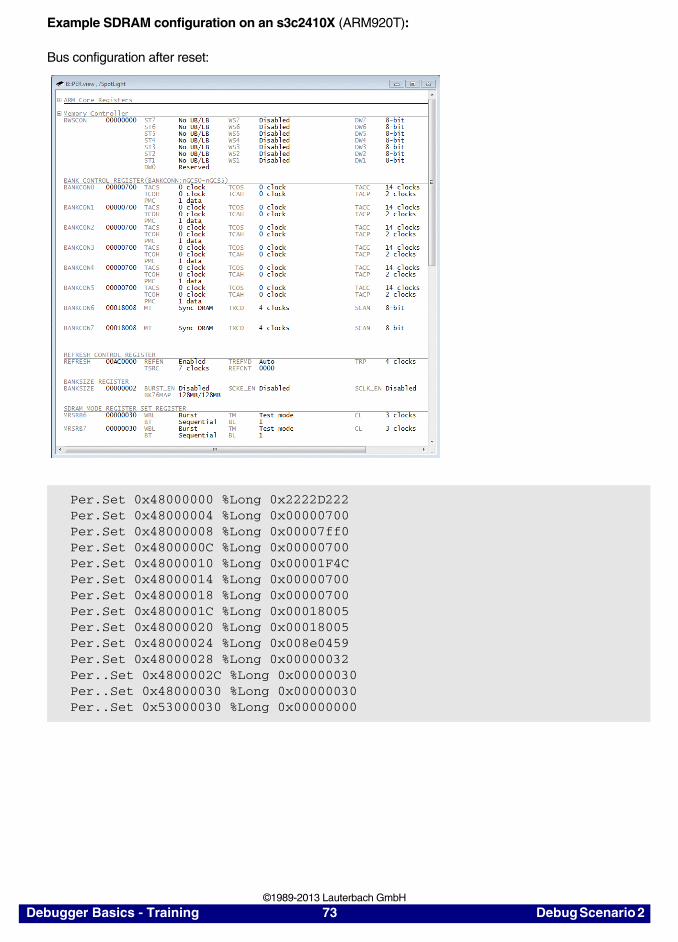
Example SDRAM configuration on an s3c2410X (ARM920T):
Bus configuration after reset:
Per.Set 0x48000000 %Long 0x2222D222Per.Set 0x48000004 %Long 0x00000700Per.Set 0x48000008 %Long 0x00007ff0Per.Set 0x4800000C %Long 0x00000700Per.Set 0x48000010 %Long 0x00001F4CPer.Set 0x48000014 %Long 0x00000700Per.Set 0x48000018 %Long 0x00000700Per.Set 0x4800001C %Long 0x00018005Per.Set 0x48000020 %Long 0x00018005Per.Set 0x48000024 %Long 0x008e0459Per.Set 0x48000028 %Long 0x00000032Per..Set 0x4800002C %Long 0x00000030Per..Set 0x48000030 %Long 0x00000030Per..Set 0x53000030 %Long 0x00000000
Debugger Basics - Training 73 Debug Scenario 2 ©1989-2013 Lauterbach GmbH
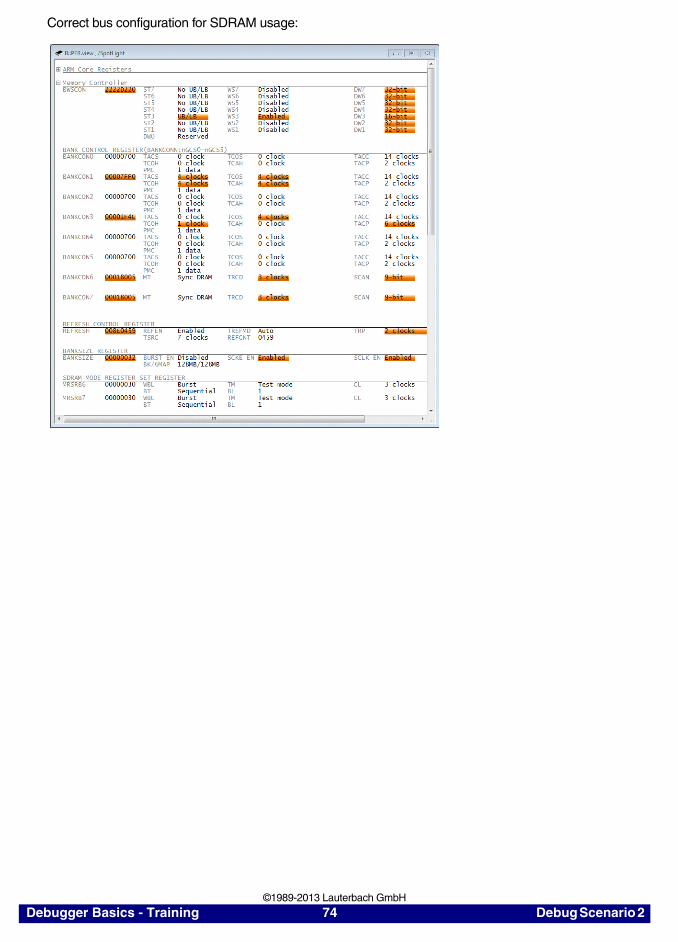
Correct bus configuration for SDRAM usage:
Debugger Basics - Training 74 Debug Scenario 2 ©1989-2013 Lauterbach GmbH
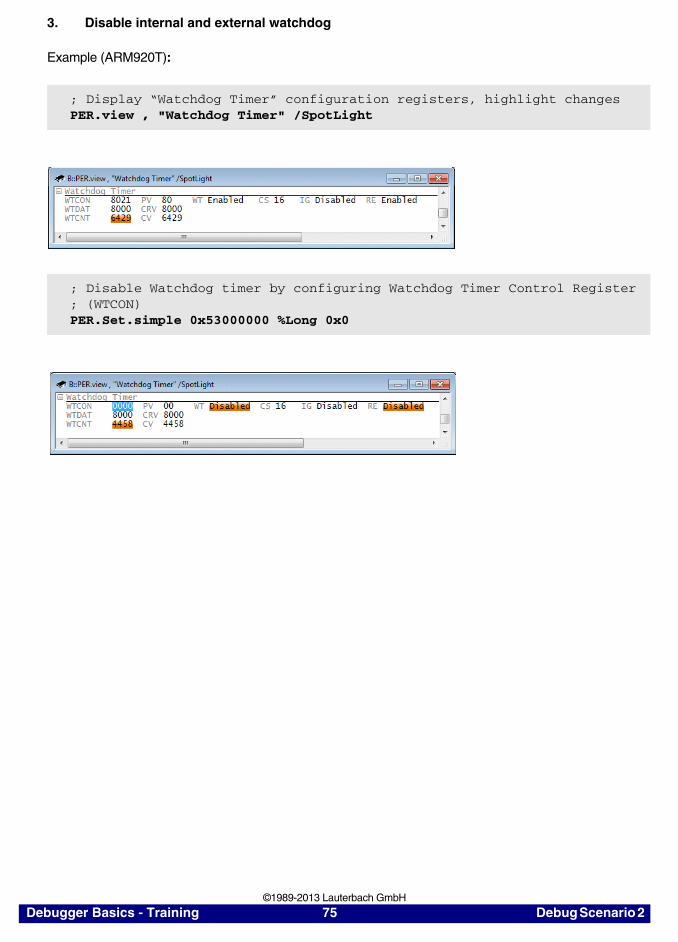
3. Disable internal and external watchdog
Example (ARM920T):
; Display “Watchdog Timer” configuration registers, highlight changesPER.view , "Watchdog Timer" /SpotLight
; Disable Watchdog timer by configuring Watchdog Timer Control Register; (WTCON) PER.Set.simple 0x53000000 %Long 0x0
Debugger Basics - Training 75 Debug Scenario 2 ©1989-2013 Lauterbach GmbH
Generic NAND Flash Programming Framework
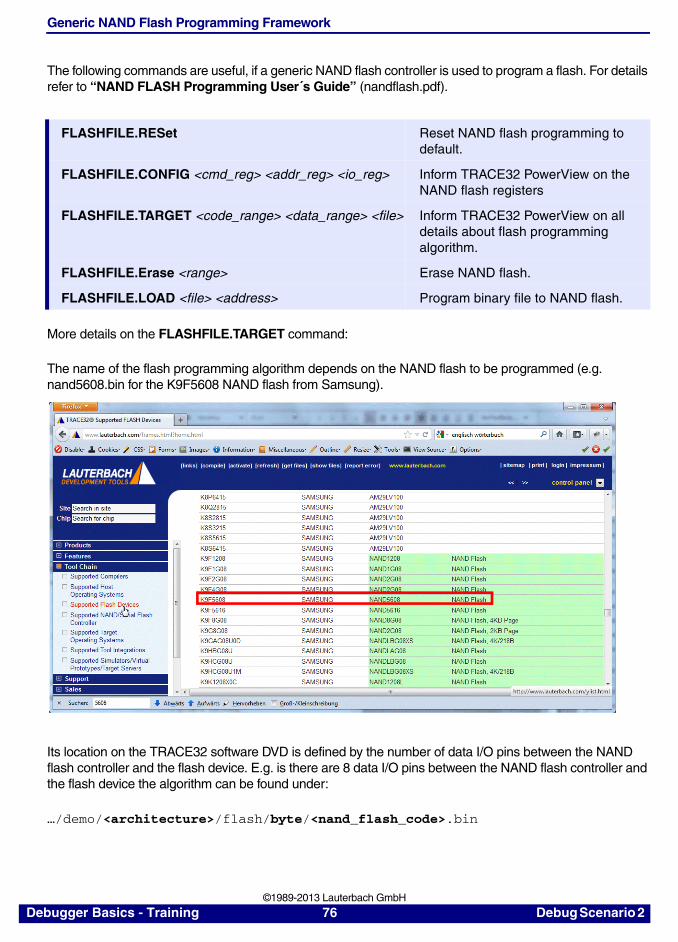
The following commands are useful, if a generic NAND flash controller is used to program a flash. For details refer to “NAND FLASH Programming User´s Guide” (nandflash.pdf).
More details on the FLASHFILE.TARGET command:
The name of the flash programming algorithm depends on the NAND flash to be programmed (e.g. nand5608.bin for the K9F5608 NAND flash from Samsung).
Its location on the TRACE32 software DVD is defined by the number of data I/O pins between the NAND flash controller and the flash device. E.g. is there are 8 data I/O pins between the NAND flash controller and the flash device the algorithm can be found under:
…/demo/<architecture>/flash/byte/<nand_flash_code>.bin
FLASHFILE.RESet Reset NAND flash programming to default.
FLASHFILE.CONFIG <cmd_reg> <addr_reg> <io_reg> Inform TRACE32 PowerView on the NAND flash registers
FLASHFILE.TARGET <code_range> <data_range> <file> Inform TRACE32 PowerView on all details about flash programming algorithm.
FLASHFILE.Erase <range> Erase NAND flash.
FLASHFILE.LOAD <file> <address> Program binary file to NAND flash.
Debugger Basics - Training 76 Debug Scenario 2 ©1989-2013 Lauterbach GmbH
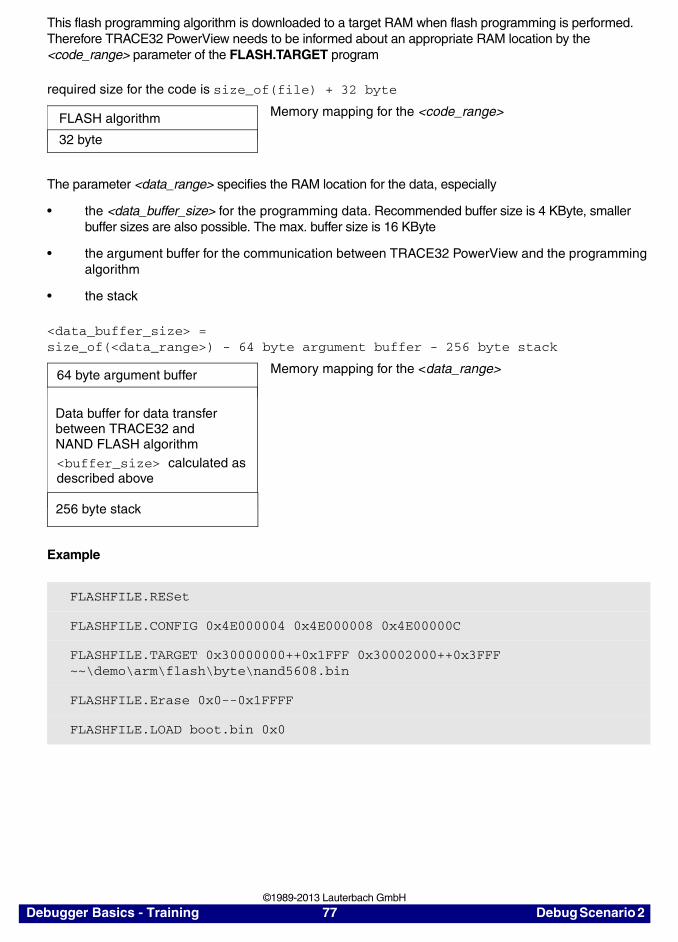
This flash programming algorithm is downloaded to a target RAM when flash programming is performed. Therefore TRACE32 PowerView needs to be informed about an appropriate RAM location by the <code_range> parameter of the FLASH.TARGET program
required size for the code is size_of(file) + 32 byte
The parameter <data_range> specifies the RAM location for the data, especially
• the <data_buffer_size> for the programming data. Recommended buffer size is 4 KByte, smaller buffer sizes are also possible. The max. buffer size is 16 KByte
• the argument buffer for the communication between TRACE32 PowerView and the programming algorithm
• the stack
<data_buffer_size> = size_of(<data_range>) - 64 byte argument buffer - 256 byte stack
Example
FLASHFILE.RESet
FLASHFILE.CONFIG 0x4E000004 0x4E000008 0x4E00000C
FLASHFILE.TARGET 0x30000000++0x1FFF 0x30002000++0x3FFF ~~\demo\arm\flash\byte\nand5608.bin
FLASHFILE.Erase 0x0--0x1FFFF
FLASHFILE.LOAD boot.bin 0x0
Memory mapping for the <code_range> FLASH algorithm
32 byte
Memory mapping for the <data_range>
Data buffer for data transfer between TRACE32 and NAND FLASH algorithm<buffer_size> calculated asdescribed above
256 byte stack
64 byte argument buffer
Debugger Basics - Training 77 Debug Scenario 2 ©1989-2013 Lauterbach GmbH
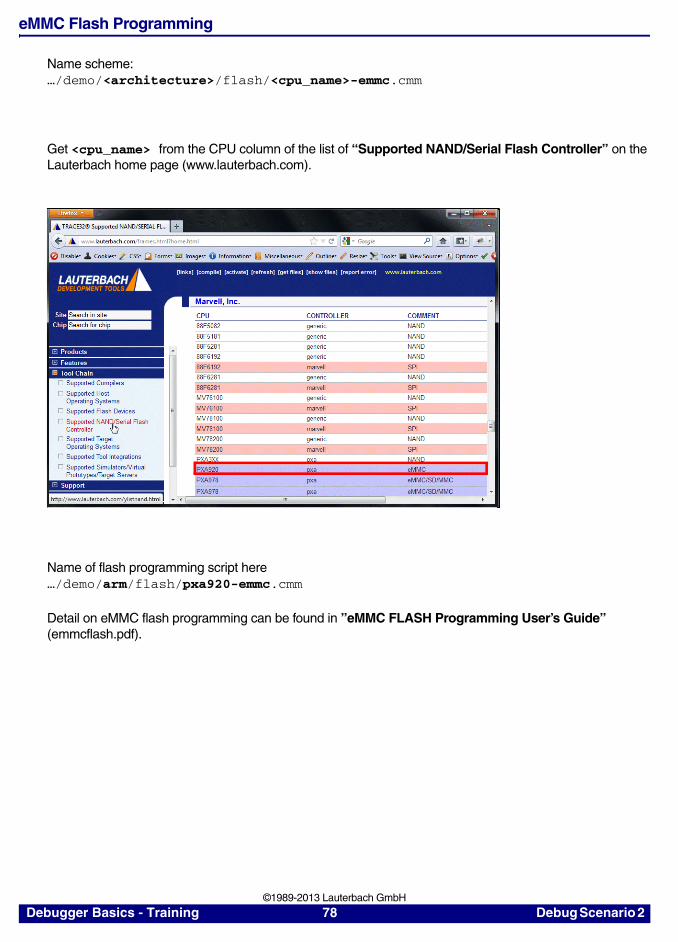
eMMC Flash Programming
Name scheme:…/demo/<architecture>/flash/<cpu_name>-emmc.cmm
Get <cpu_name> from the CPU column of the list of “Supported NAND/Serial Flash Controller” on the Lauterbach home page (www.lauterbach.com).
Name of flash programming script here…/demo/arm/flash/pxa920-emmc.cmm
Detail on eMMC flash programming can be found in ”eMMC FLASH Programming User’s Guide” (emmcflash.pdf).
Debugger Basics - Training 78 Debug Scenario 2 ©1989-2013 Lauterbach GmbH
Establish the Communication
It is required to establish the communication between the debugger and the core by SYStem.Up. This advise the processor/chip to reset before the communication is established (details can be found on page 1).
Load the Debug Symbols
If you want to debug only the second stage boot loader you can set an on-chip breakpoint to its start address:
; load debug symbols for boot loader and second stage boot loader; address of boot loader: 0x0--0x3fff; address of second stage boot loader: 0x33f80000++0x3ffff; symbol mapping has to be accordinglyData.LOAD.Elf boot.elf /NOCODE
Break.Set start_boot2 /Onchip
Debugger Basics - Training 79 Debug Scenario 2 ©1989-2013 Lauterbach GmbH
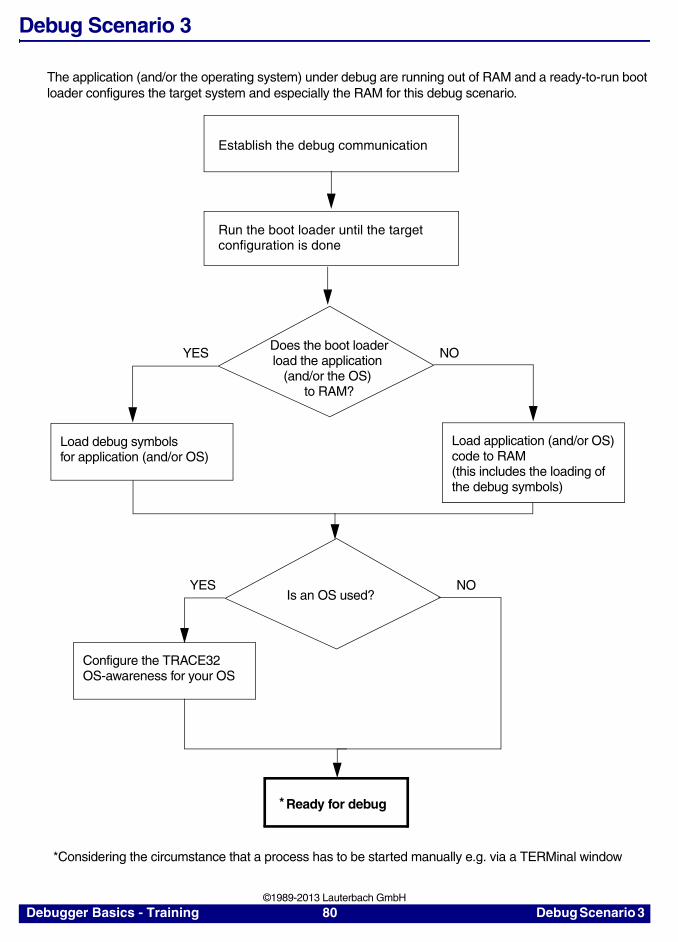
Debug Scenario 3
The application (and/or the operating system) under debug are running out of RAM and a ready-to-run boot loader configures the target system and especially the RAM for this debug scenario.
Establish the debug communication
Run the boot loader until the targetconfiguration is done
Does the boot loaderload the application
(and/or the OS)
YES NO
Load debug symbolsfor application (and/or OS)
Load application (and/or OS)code to RAM(this includes the loading ofthe debug symbols)
to RAM?
Is an OS used?YES NO
Configure the TRACE32OS-awareness for your OS
Ready for debug*
*Considering the circumstance that a process has to be started manually e.g. via a TERMinal window
Debugger Basics - Training 80 Debug Scenario 3 ©1989-2013 Lauterbach GmbH
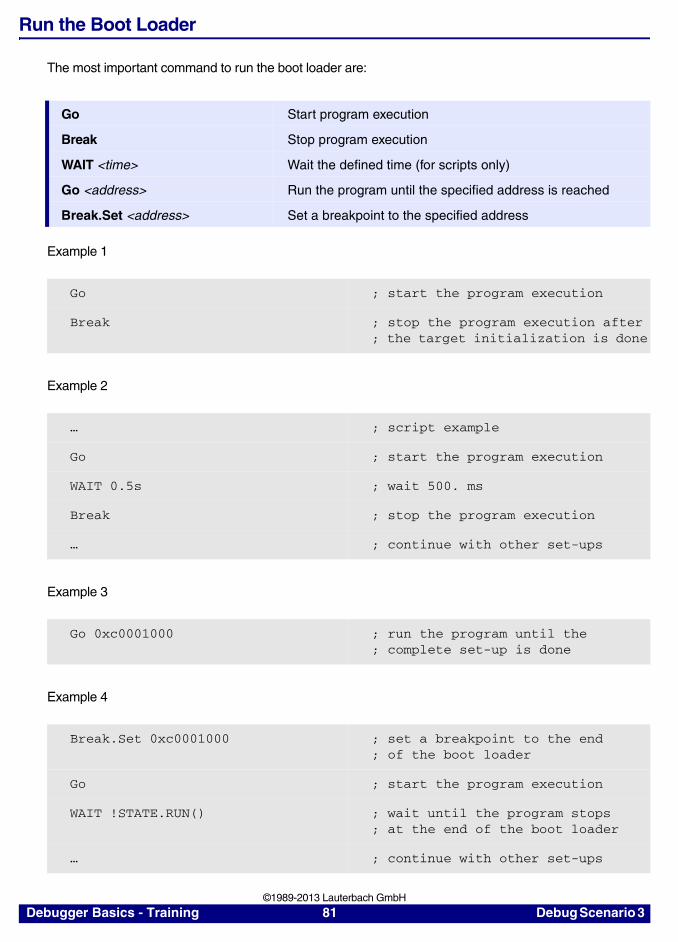
Run the Boot Loader
The most important command to run the boot loader are:
Example 1
Example 2
Example 3
Example 4
Go Start program execution
Break Stop program execution
WAIT <time> Wait the defined time (for scripts only)
Go <address> Run the program until the specified address is reached
Break.Set <address> Set a breakpoint to the specified address
Go ; start the program execution
Break ; stop the program execution after; the target initialization is done
… ; script example
Go ; start the program execution
WAIT 0.5s ; wait 500. ms
Break ; stop the program execution
… ; continue with other set-ups
Go 0xc0001000 ; run the program until the; complete set-up is done
Break.Set 0xc0001000 ; set a breakpoint to the end; of the boot loader
Go ; start the program execution
WAIT !STATE.RUN() ; wait until the program stops; at the end of the boot loader
… ; continue with other set-ups
Debugger Basics - Training 81 Debug Scenario 3 ©1989-2013 Lauterbach GmbH
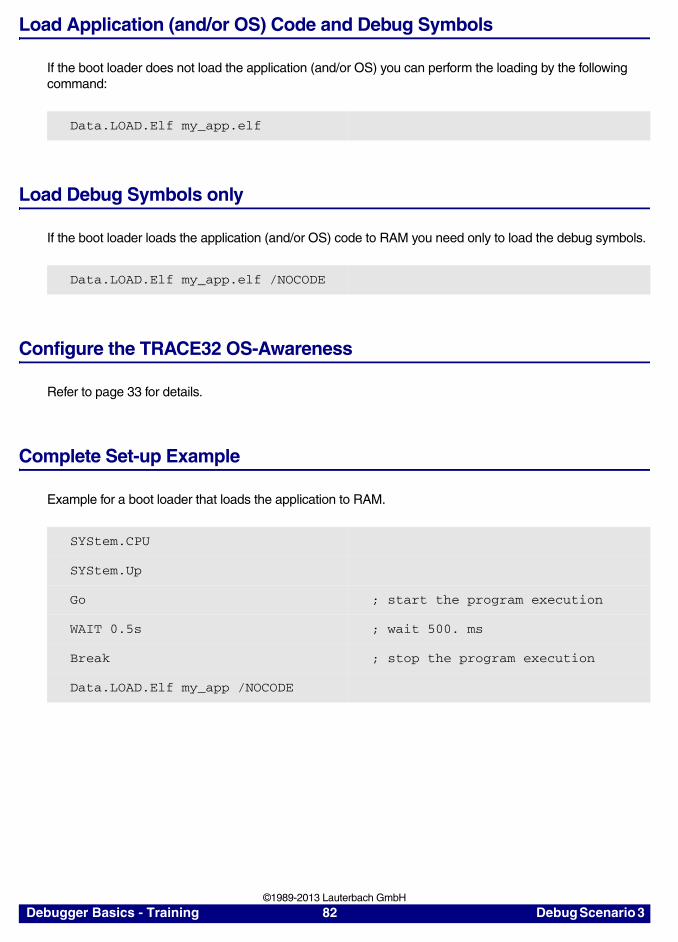
Load Application (and/or OS) Code and Debug Symbols
If the boot loader does not load the application (and/or OS) you can perform the loading by the following command:
Load Debug Symbols only
If the boot loader loads the application (and/or OS) code to RAM you need only to load the debug symbols.
Configure the TRACE32 OS-Awareness
Refer to page 33 for details.
Complete Set-up Example
Example for a boot loader that loads the application to RAM.
Data.LOAD.Elf my_app.elf
Data.LOAD.Elf my_app.elf /NOCODE
SYStem.CPU
SYStem.Up
Go ; start the program execution
WAIT 0.5s ; wait 500. ms
Break ; stop the program execution
Data.LOAD.Elf my_app /NOCODE
Debugger Basics - Training 82 Debug Scenario 3 ©1989-2013 Lauterbach GmbH
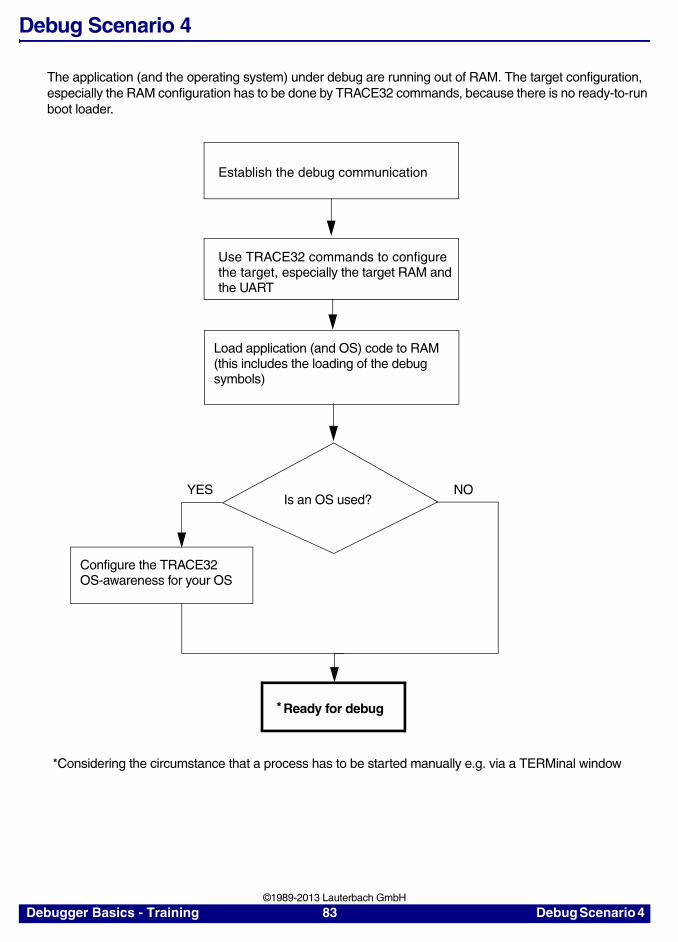
Debug Scenario 4
The application (and the operating system) under debug are running out of RAM. The target configuration, especially the RAM configuration has to be done by TRACE32 commands, because there is no ready-to-run boot loader.
Establish the debug communication
Use TRACE32 commands to configurethe target, especially the target RAM and
Load application (and OS) code to RAM(this includes the loading of the debug symbols)
Is an OS used?YES NO
Configure the TRACE32OS-awareness for your OS
Ready for debug*
*Considering the circumstance that a process has to be started manually e.g. via a TERMinal window
the UART
Debugger Basics - Training 83 Debug Scenario 4 ©1989-2013 Lauterbach GmbH

Write a Script to Configure the Target
A minimum target configuration has to configure all used memories and the serial interface.
Use the PER.Set/PER.view commands for this set-up.
Load Application (and/or OS) Code and Debug Symbols
Configure the TRACE32 OS-Awareness
Refer to page 33 for details.
Data.LOAD.Elf my_app.elf
Debugger Basics - Training 84 Debug Scenario 4 ©1989-2013 Lauterbach GmbH
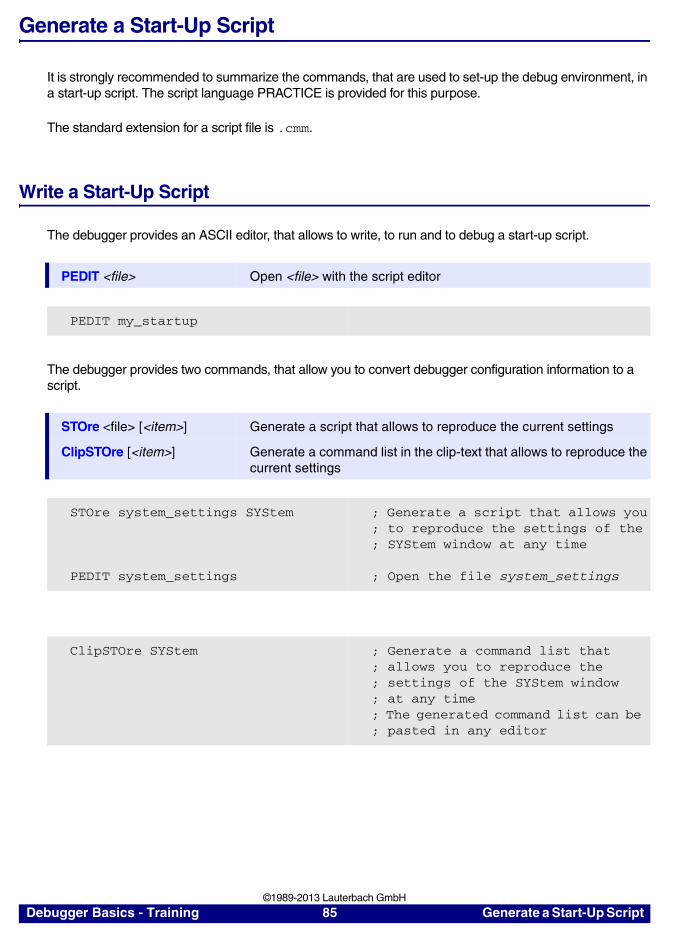
Generate a Start-Up Script
It is strongly recommended to summarize the commands, that are used to set-up the debug environment, in a start-up script. The script language PRACTICE is provided for this purpose.
The standard extension for a script file is .cmm.
Write a Start-Up Script
The debugger provides an ASCII editor, that allows to write, to run and to debug a start-up script.
The debugger provides two commands, that allow you to convert debugger configuration information to a script.
PEDIT <file> Open <file> with the script editor
PEDIT my_startup
STOre <file> [<item>] Generate a script that allows to reproduce the current settings
ClipSTOre [<item>] Generate a command list in the clip-text that allows to reproduce the current settings
STOre system_settings SYStem
PEDIT system_settings
; Generate a script that allows you; to reproduce the settings of the; SYStem window at any time
; Open the file system_settings
ClipSTOre SYStem ; Generate a command list that; allows you to reproduce the; settings of the SYStem window; at any time; The generated command list can be ; pasted in any editor
Debugger Basics - Training 85 Generate a Start-Up Script ©1989-2013 Lauterbach GmbH

Run a Start-up Script
DO <filename> Run a start-up script
DO my_startup
Debugger Basics - Training 86 Generate a Start-Up Script ©1989-2013 Lauterbach GmbH
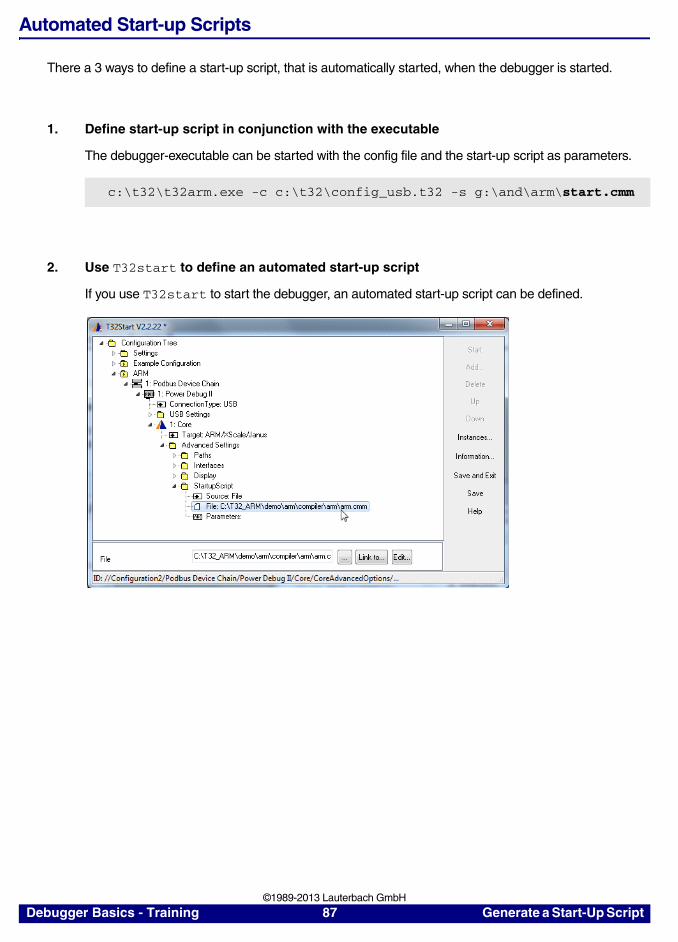
Automated Start-up Scripts
There a 3 ways to define a start-up script, that is automatically started, when the debugger is started.
1. Define start-up script in conjunction with the executable
The debugger-executable can be started with the config file and the start-up script as parameters.
2. Use T32start to define an automated start-up script
If you use T32start to start the debugger, an automated start-up script can be defined.
c:\t32\t32arm.exe -c c:\t32\config_usb.t32 -s g:\and\arm\start.cmm
Debugger Basics - Training 87 Generate a Start-Up Script ©1989-2013 Lauterbach GmbH

TRACE32 PowerView
Debugger Basics - Training 88 TRACE32 PowerView ©1989-2013 Lauterbach GmbH
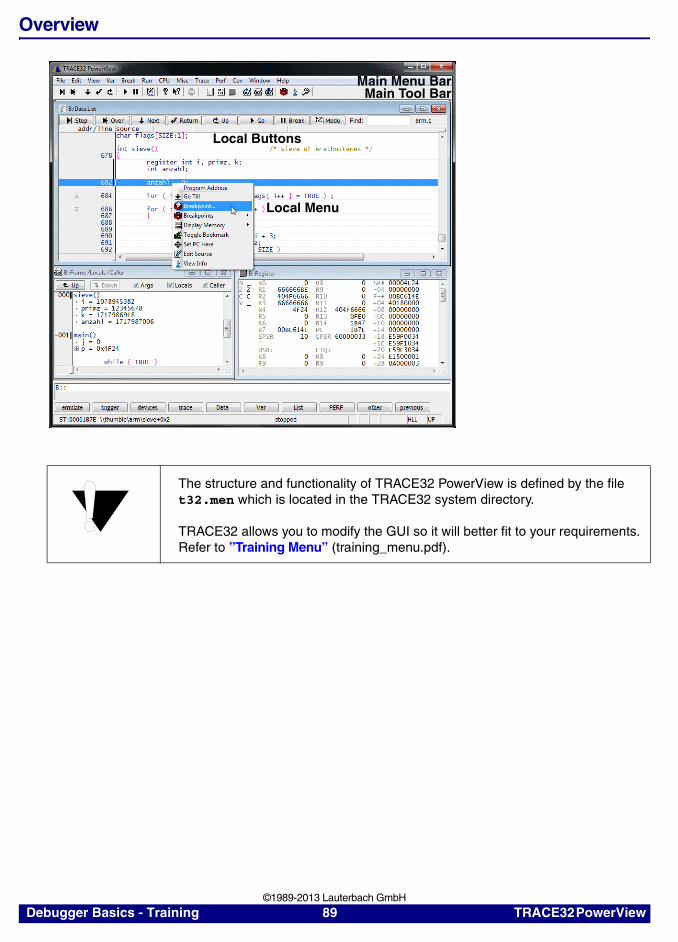
Overview
The structure and functionality of TRACE32 PowerView is defined by the file t32.men which is located in the TRACE32 system directory.
TRACE32 allows you to modify the GUI so it will better fit to your requirements. Refer to ”Training Menu” (training_menu.pdf).
Main Menu BarMain Tool Bar
Local Menu
Local Buttons
Debugger Basics - Training 89 TRACE32 PowerView ©1989-2013 Lauterbach GmbH
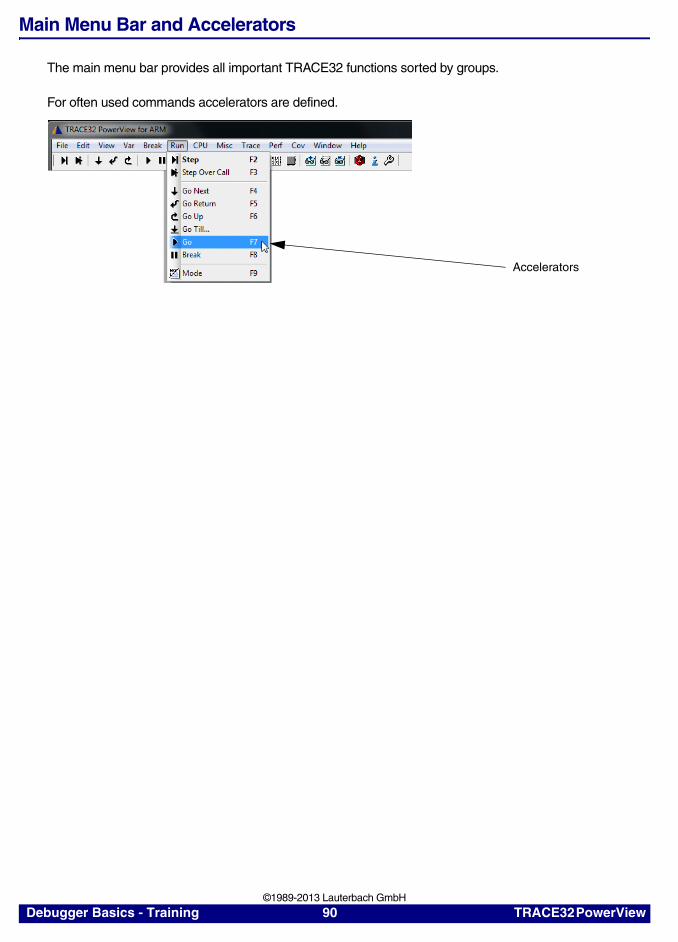
Main Menu Bar and Accelerators
The main menu bar provides all important TRACE32 functions sorted by groups.
For often used commands accelerators are defined.
Accelerators
Debugger Basics - Training 90 TRACE32 PowerView ©1989-2013 Lauterbach GmbH
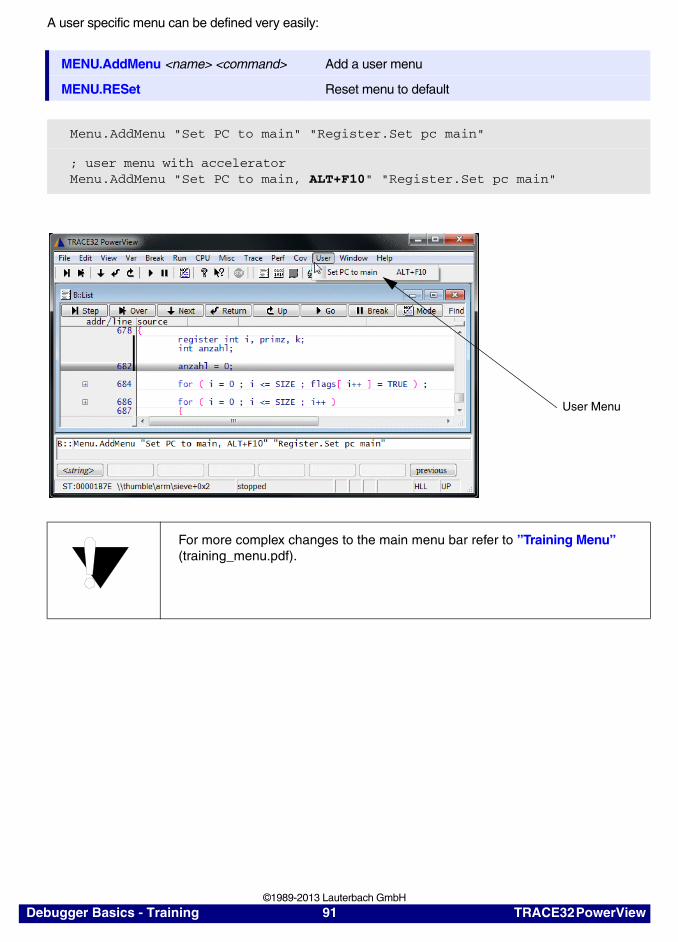
A user specific menu can be defined very easily:
MENU.AddMenu <name> <command> Add a user menu
MENU.RESet Reset menu to default
Menu.AddMenu "Set PC to main" "Register.Set pc main"
; user menu with acceleratorMenu.AddMenu "Set PC to main, ALT+F10" "Register.Set pc main"
For more complex changes to the main menu bar refer to ”Training Menu” (training_menu.pdf).
User Menu
Debugger Basics - Training 91 TRACE32 PowerView ©1989-2013 Lauterbach GmbH
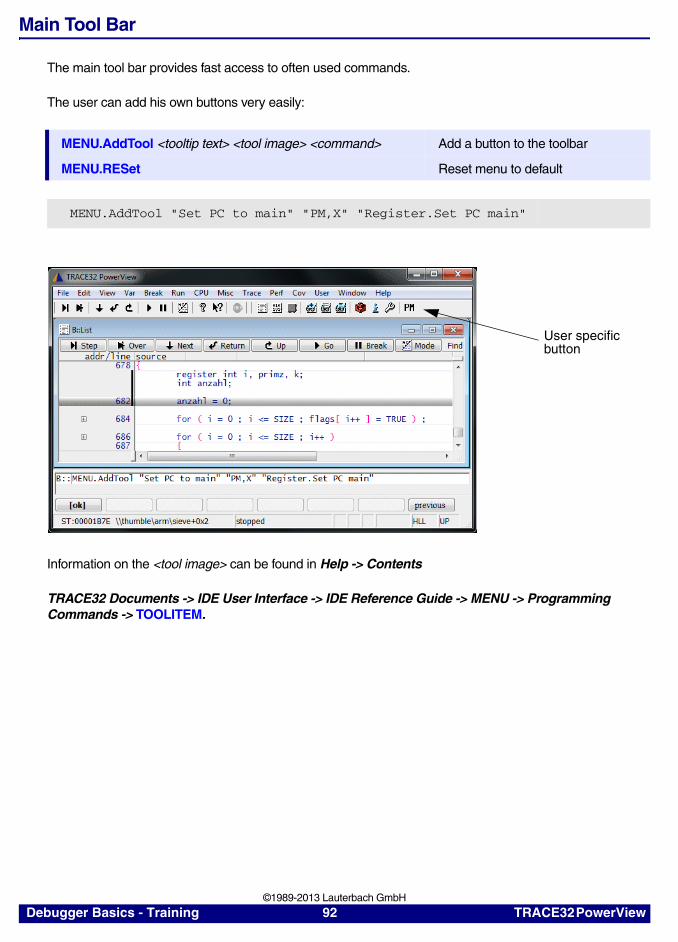
Main Tool Bar
The main tool bar provides fast access to often used commands.
The user can add his own buttons very easily:
Information on the <tool image> can be found in Help -> Contents
TRACE32 Documents -> IDE User Interface -> IDE Reference Guide -> MENU -> Programming Commands -> TOOLITEM.
MENU.AddTool <tooltip text> <tool image> <command> Add a button to the toolbar
MENU.RESet Reset menu to default
MENU.AddTool "Set PC to main" "PM,X" "Register.Set PC main"
User specificbutton
Debugger Basics - Training 92 TRACE32 PowerView ©1989-2013 Lauterbach GmbH
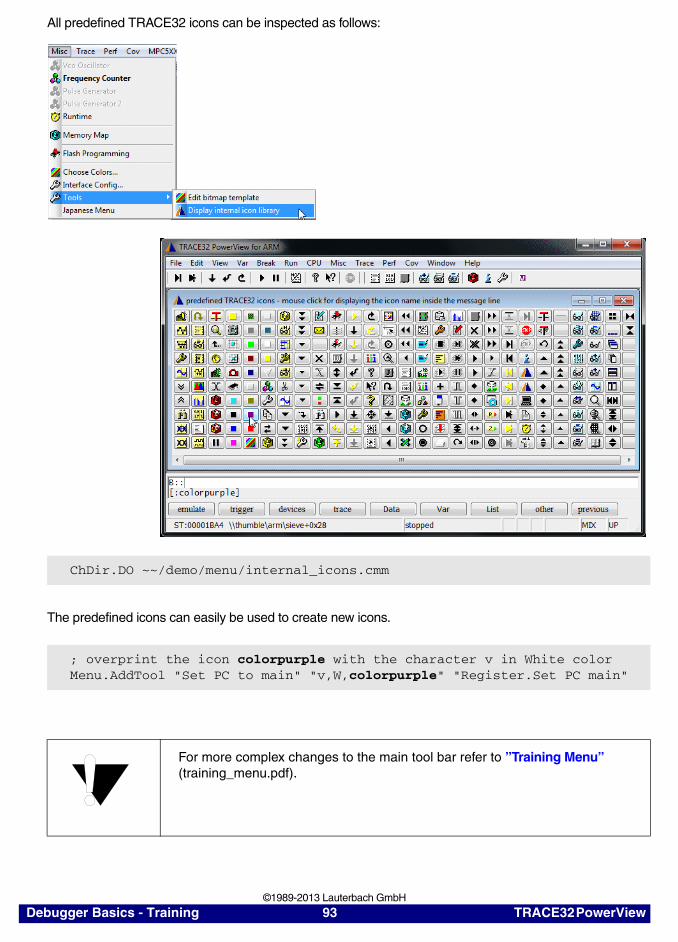
All predefined TRACE32 icons can be inspected as follows:
The predefined icons can easily be used to create new icons.
ChDir.DO ~~/demo/menu/internal_icons.cmm
; overprint the icon colorpurple with the character v in White colorMenu.AddTool "Set PC to main" "v,W,colorpurple" "Register.Set PC main"
For more complex changes to the main tool bar refer to ”Training Menu” (training_menu.pdf).
Debugger Basics - Training 93 TRACE32 PowerView ©1989-2013 Lauterbach GmbH

Window Area
Save Page Layout
No information about the page layout is saved when you exit TRACE32 PowerView. To save the window layout use the Store Window to … command in the Window menu.
// andT32_1000003 Sat Jul 21 16:59:55 2012
B:: TOOLBAR ON STATUSBAR ON FRAMEPOS 68.0 5.2857 107. 45. WINPAGE.RESET WINCLEAR WINPOS 0.0 0.0 80. 16. 15. 1. W000 WINTABS 10. 10. 25. 62. List WINPOS 0.0 21.643 80. 5. 25. 1. W001 WINTABS 13. 0. 0. 0. 0. 0. 0. Break.List WINPAGE.SELECT P000 ENDDO
Store Windows to … generates a batchfile, that allows you to reactivate the window-configuration at any time.
Debugger Basics - Training 94 TRACE32 PowerView ©1989-2013 Lauterbach GmbH
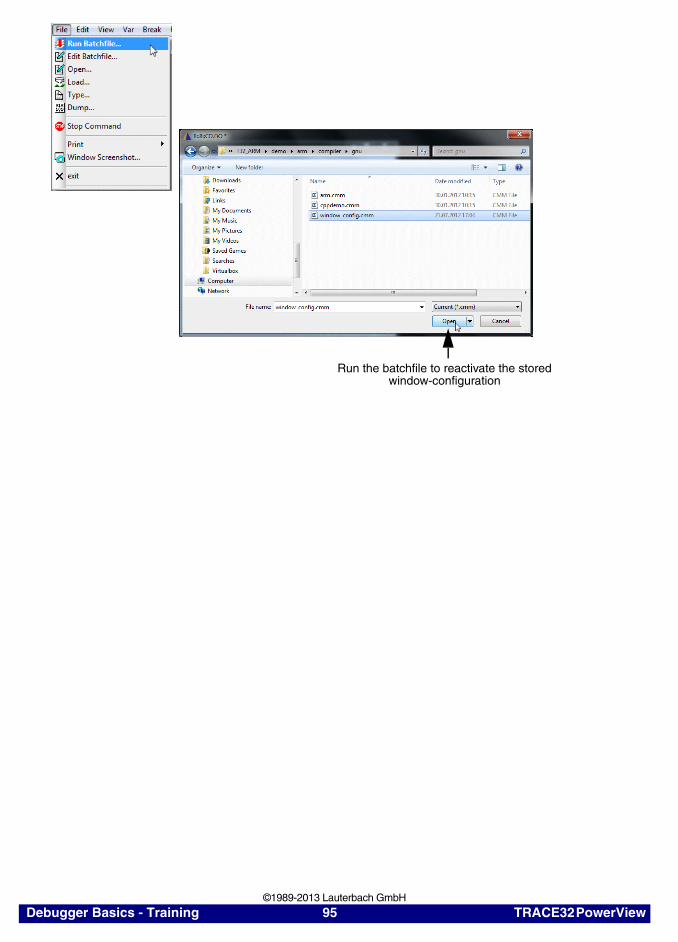
Run the batchfile to reactivate the storedwindow-configuration
Debugger Basics - Training 95 TRACE32 PowerView ©1989-2013 Lauterbach GmbH
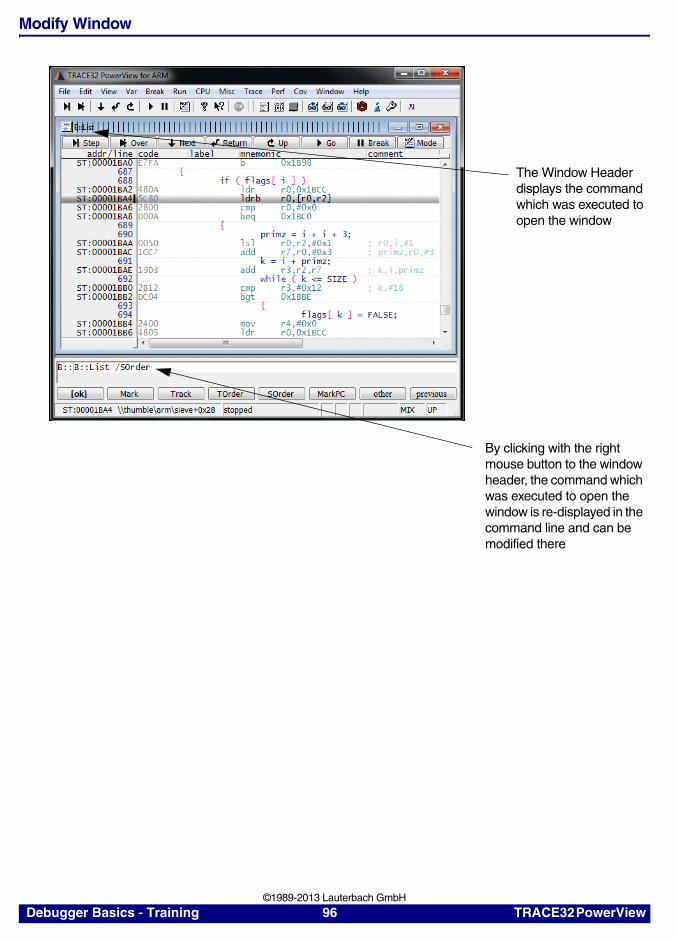
Modify Window
The Window Header displays the command which was executed to open the window
By clicking with the right mouse button to the window header, the command which was executed to open the window is re-displayed in the command line and can be modified there
Debugger Basics - Training 96 TRACE32 PowerView ©1989-2013 Lauterbach GmbH
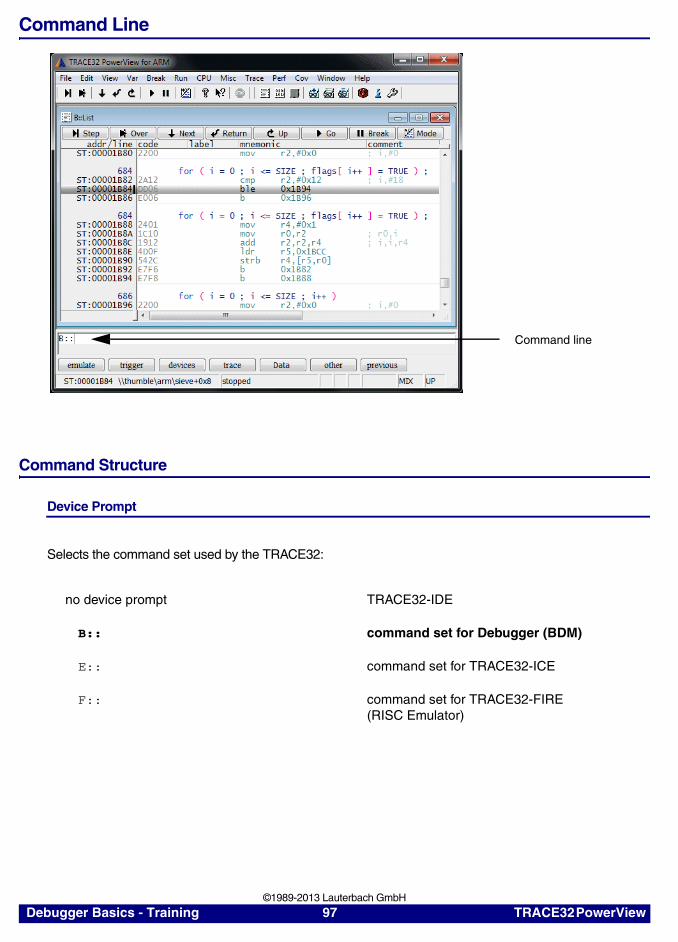
Command Line
Command Structure
Device Prompt
Selects the command set used by the TRACE32:
no device prompt TRACE32-IDE
B:: command set for Debugger (BDM)
E:: command set for TRACE32-ICE
F:: command set for TRACE32-FIRE (RISC Emulator)
Command line
Debugger Basics - Training 97 TRACE32 PowerView ©1989-2013 Lauterbach GmbH
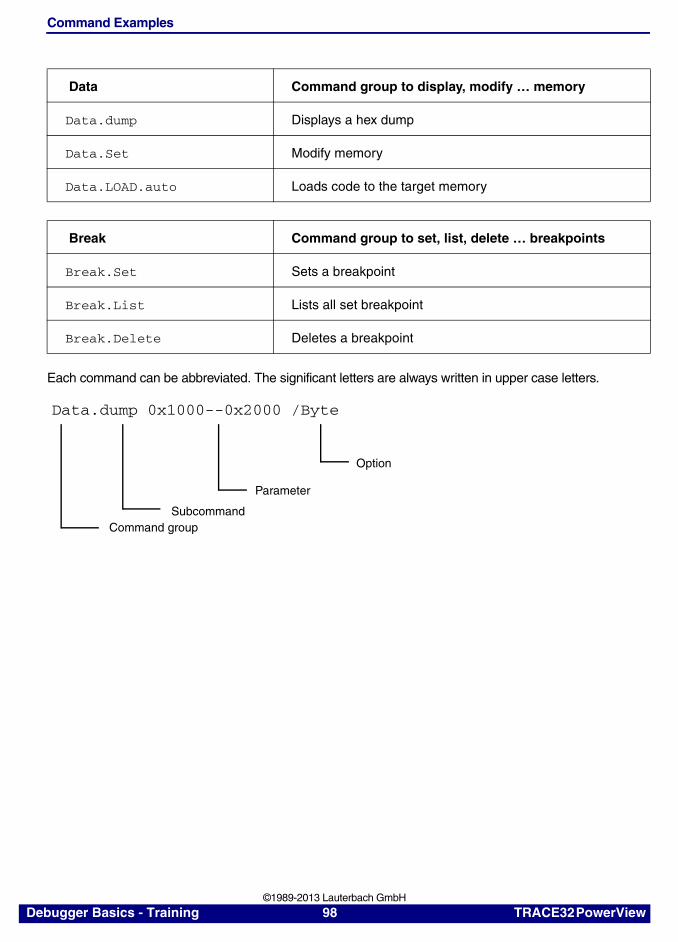
Command Examples
Each command can be abbreviated. The significant letters are always written in upper case letters.
Data Command group to display, modify … memory
Data.dump Displays a hex dump
Data.Set Modify memory
Data.LOAD.auto Loads code to the target memory
Break Command group to set, list, delete … breakpoints
Break.Set Sets a breakpoint
Break.List Lists all set breakpoint
Break.Delete Deletes a breakpoint
Data.dump 0x1000--0x2000 /Byte
Command groupSubcommand
Parameter
Option
Debugger Basics - Training 98 TRACE32 PowerView ©1989-2013 Lauterbach GmbH
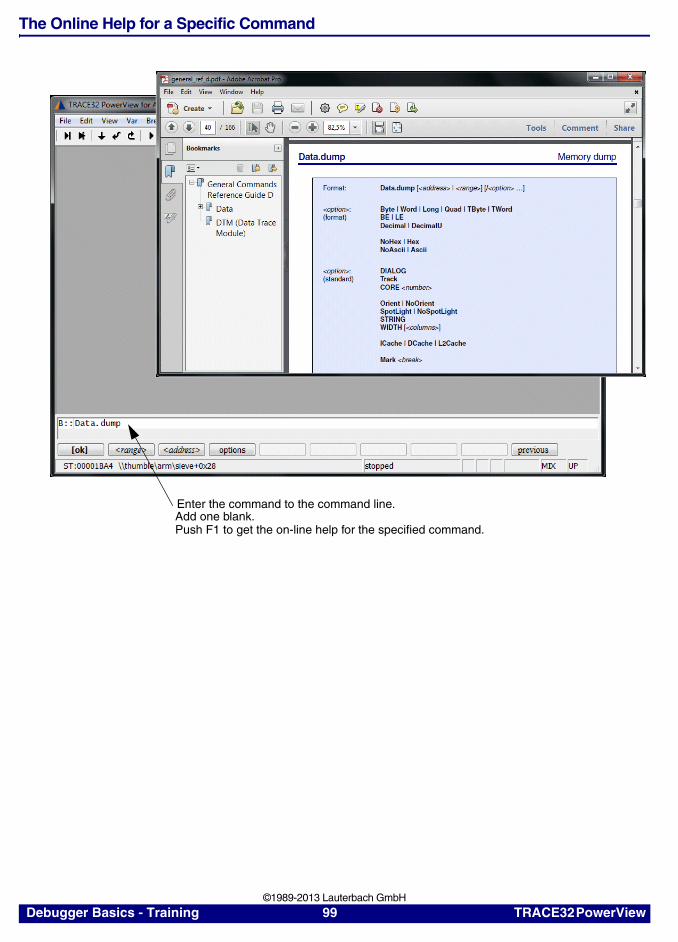
The Online Help for a Specific Command
Push F1 to get the on-line help for the specified command.Add one blank. Enter the command to the command line.
Debugger Basics - Training 99 TRACE32 PowerView ©1989-2013 Lauterbach GmbH
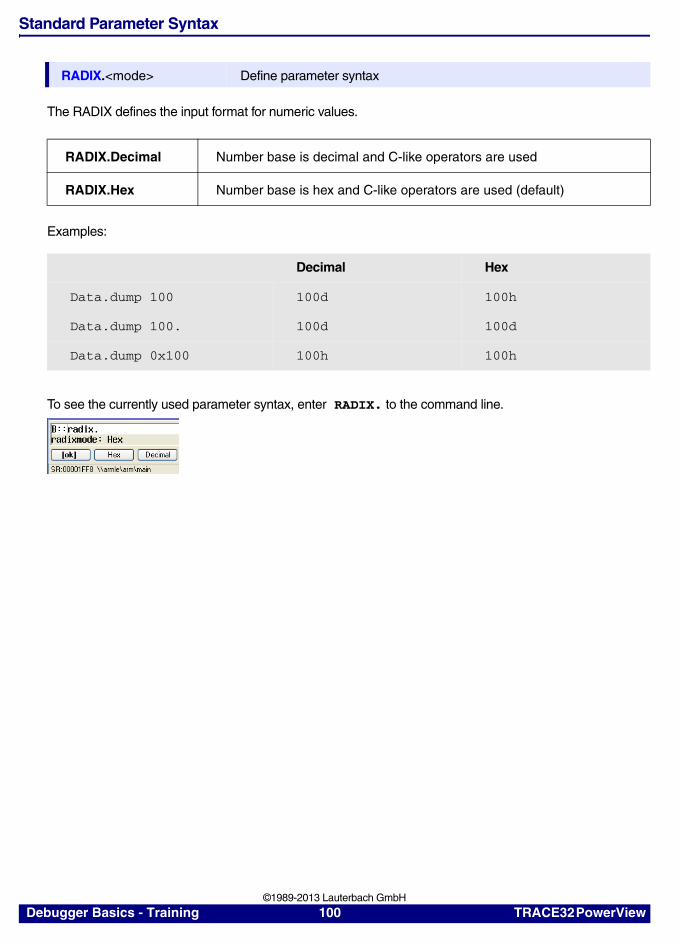
Standard Parameter Syntax
The RADIX defines the input format for numeric values.
Examples:
To see the currently used parameter syntax, enter RADIX. to the command line.
RADIX.<mode> Define parameter syntax
RADIX.Decimal Number base is decimal and C-like operators are used
RADIX.Hex Number base is hex and C-like operators are used (default)
Decimal Hex
Data.dump 100 100d 100h
Data.dump 100. 100d 100d
Data.dump 0x100 100h 100h
Debugger Basics - Training 100 TRACE32 PowerView ©1989-2013 Lauterbach GmbH
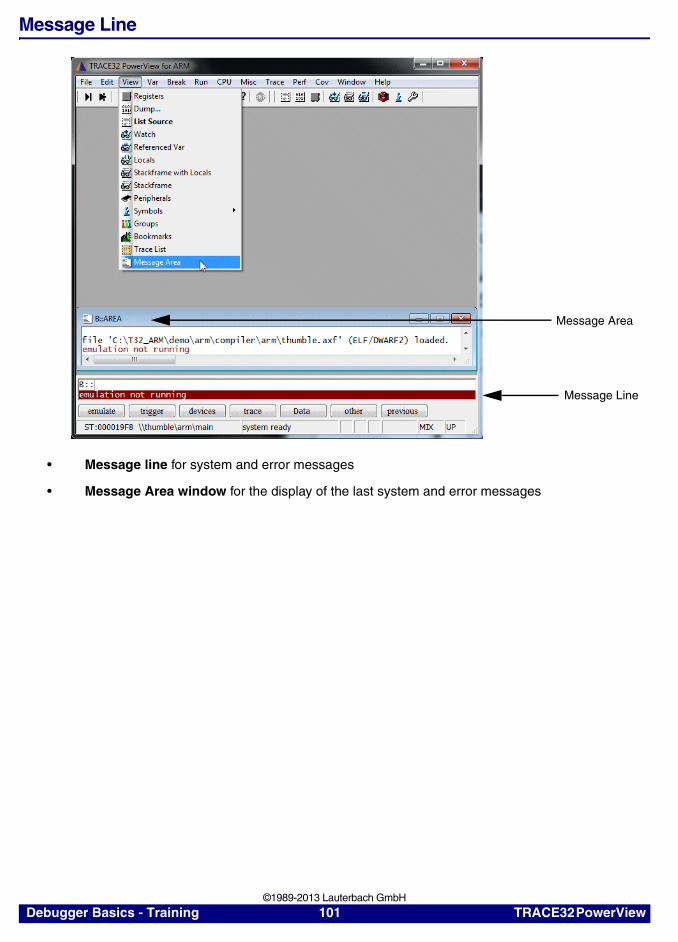
Message Line
• Message line for system and error messages
• Message Area window for the display of the last system and error messages
Message Line
Message Area
Debugger Basics - Training 101 TRACE32 PowerView ©1989-2013 Lauterbach GmbH

Softkeys
The softkey line allows to enter a specific command step by step.
Select the command group
Select the subcommand
Angle brackets request an entry from the user. Here e.g. the entry of an <address> or a <range>.
Get a display of all options
Select an option
Debugger Basics - Training 102 TRACE32 PowerView ©1989-2013 Lauterbach GmbH
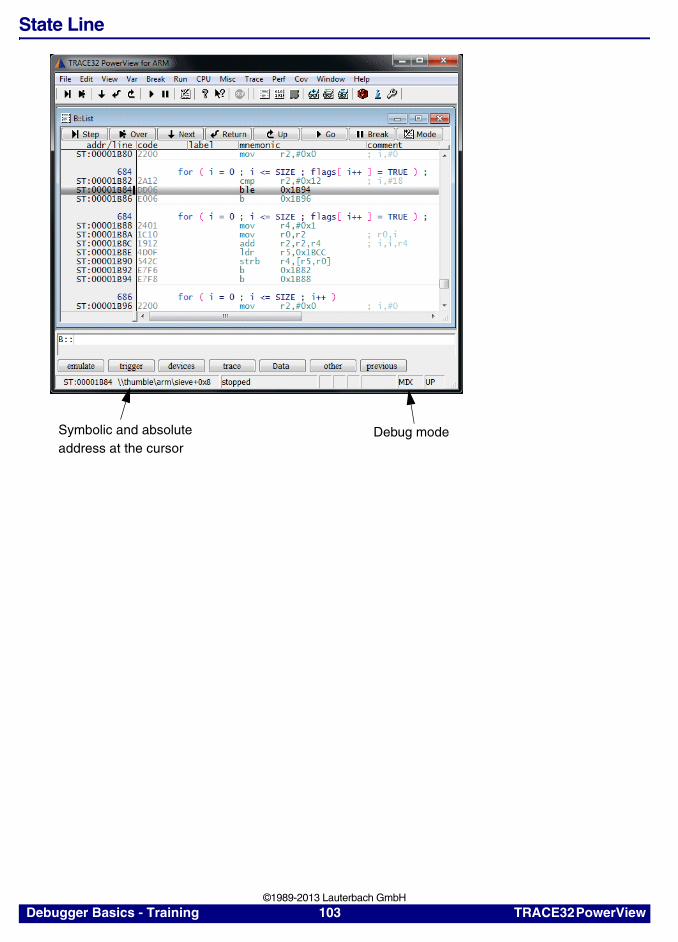
State Line
Symbolic and absoluteaddress at the cursor
Debug mode
Debugger Basics - Training 103 TRACE32 PowerView ©1989-2013 Lauterbach GmbH

Registers
Display the Core Registers
Register.view
Debugger Basics - Training 104 Registers ©1989-2013 Lauterbach GmbH
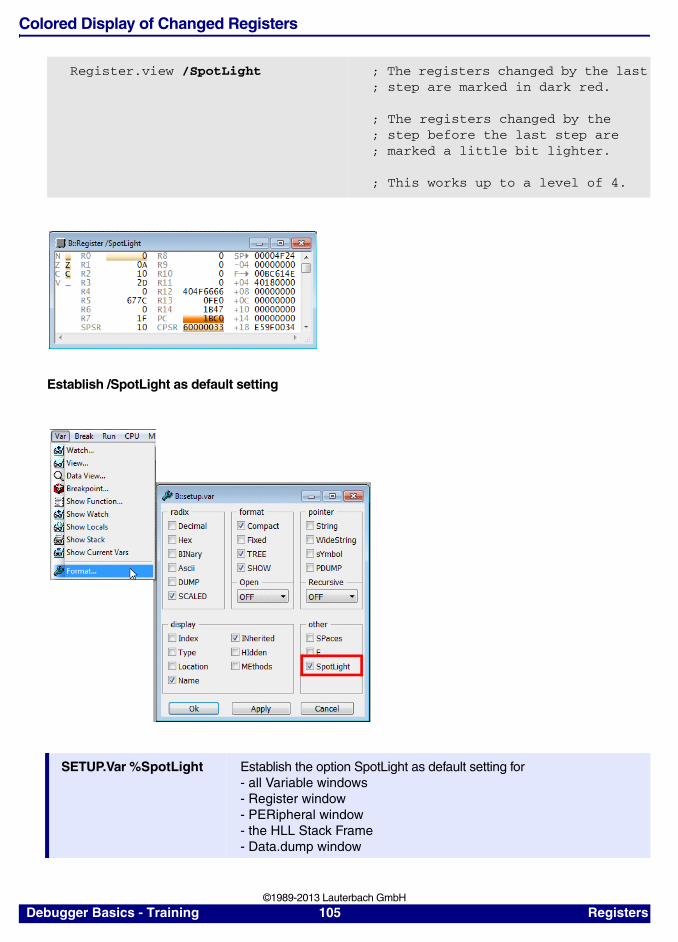
Colored Display of Changed Registers
Establish /SpotLight as default setting
Register.view /SpotLight ; The registers changed by the last; step are marked in dark red.
; The registers changed by the; step before the last step are; marked a little bit lighter.
; This works up to a level of 4.
SETUP.Var %SpotLight Establish the option SpotLight as default setting for - all Variable windows- Register window - PERipheral window- the HLL Stack Frame - Data.dump window
Debugger Basics - Training 105 Registers ©1989-2013 Lauterbach GmbH
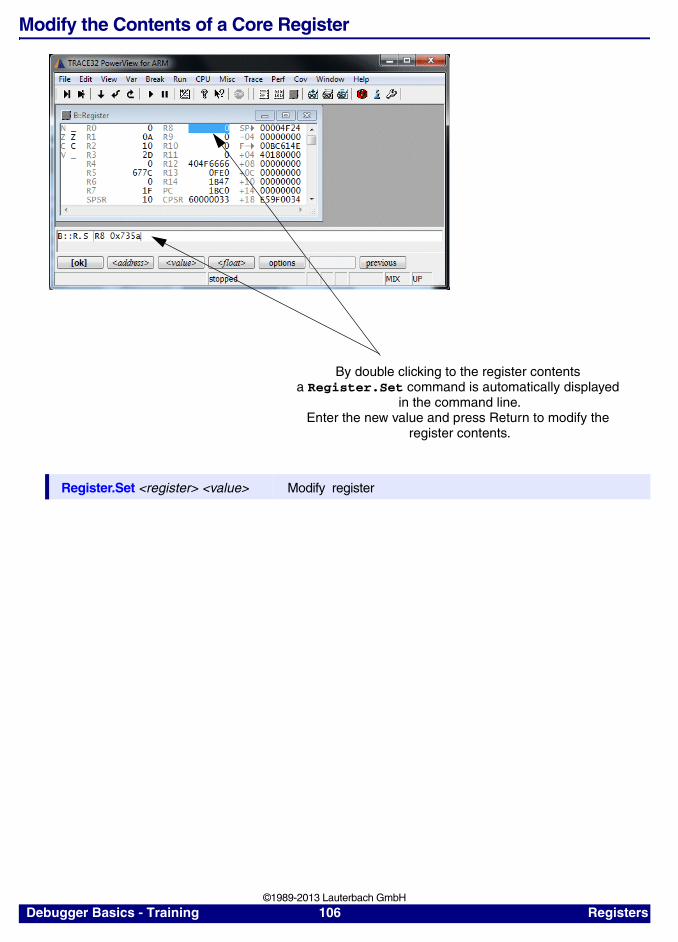
Modify the Contents of a Core Register
Register.Set <register> <value> Modify register
By double clicking to the register contents a Register.Set command is automatically displayed
in the command line.Enter the new value and press Return to modify the
register contents.
Debugger Basics - Training 106 Registers ©1989-2013 Lauterbach GmbH
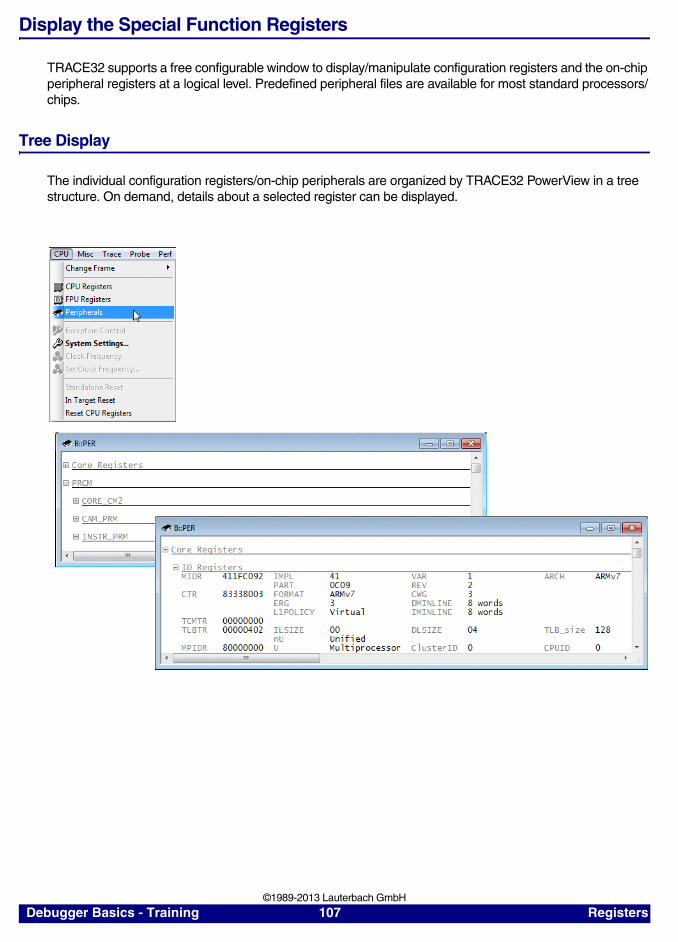
Display the Special Function Registers
TRACE32 supports a free configurable window to display/manipulate configuration registers and the on-chip peripheral registers at a logical level. Predefined peripheral files are available for most standard processors/chips.
Tree Display
The individual configuration registers/on-chip peripherals are organized by TRACE32 PowerView in a tree structure. On demand, details about a selected register can be displayed.
Debugger Basics - Training 107 Registers ©1989-2013 Lauterbach GmbH
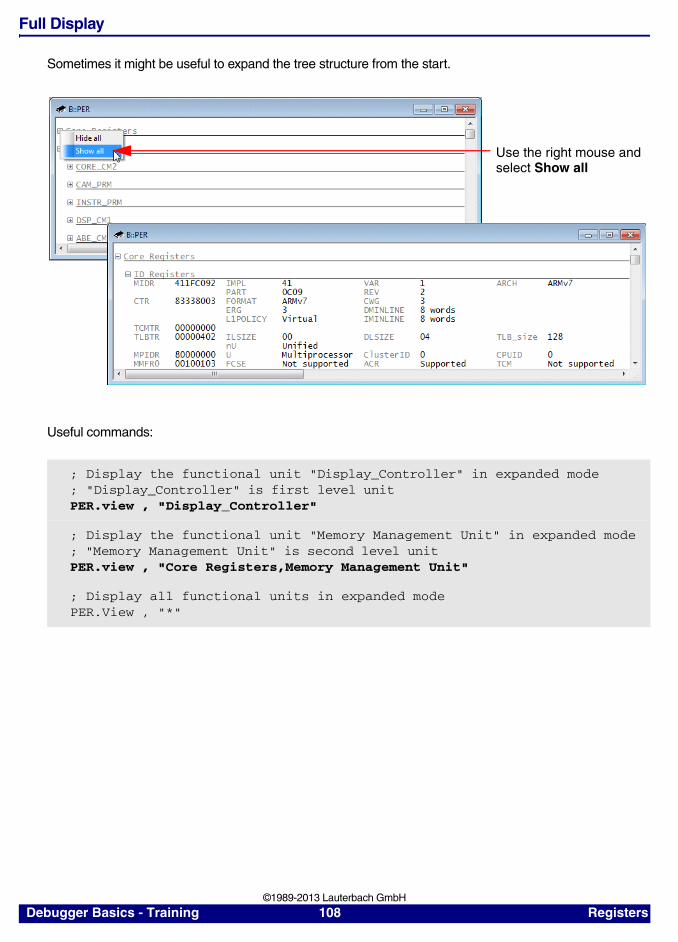
Full Display
Sometimes it might be useful to expand the tree structure from the start.
Useful commands:
; Display the functional unit "Display_Controller" in expanded mode; "Display_Controller" is first level unitPER.view , "Display_Controller"
; Display the functional unit "Memory Management Unit" in expanded mode; "Memory Management Unit" is second level unitPER.view , "Core Registers,Memory Management Unit"
; Display all functional units in expanded modePER.View , "*"
Use the right mouse and select Show all
Debugger Basics - Training 108 Registers ©1989-2013 Lauterbach GmbH
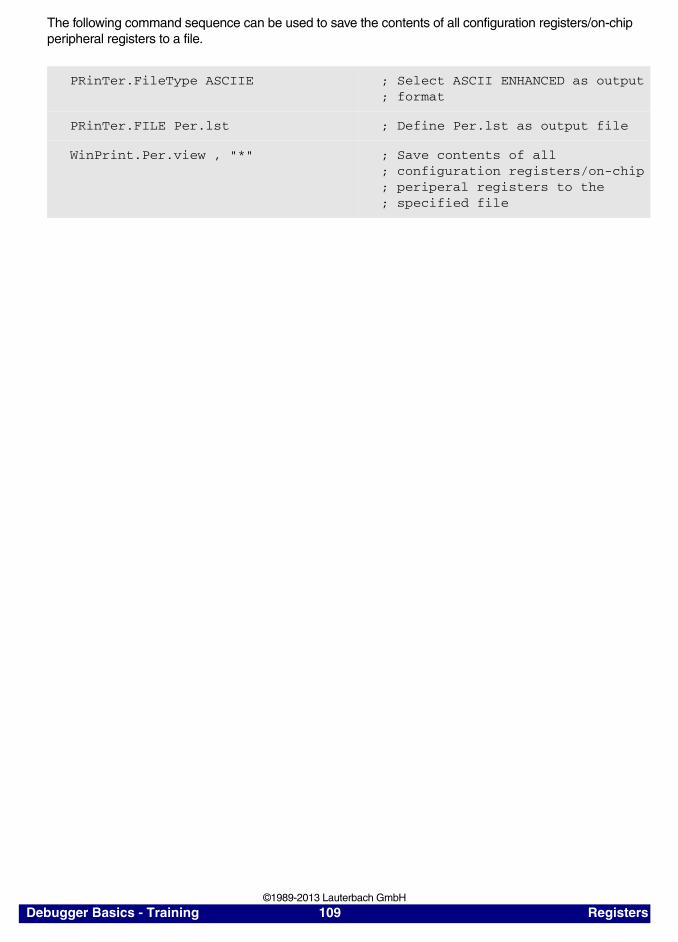
The following command sequence can be used to save the contents of all configuration registers/on-chip peripheral registers to a file.
PRinTer.FileType ASCIIE ; Select ASCII ENHANCED as output; format
PRinTer.FILE Per.lst ; Define Per.lst as output file
WinPrint.Per.view , "*" ; Save contents of all; configuration registers/on-chip; periperal registers to the; specified file
Debugger Basics - Training 109 Registers ©1989-2013 Lauterbach GmbH
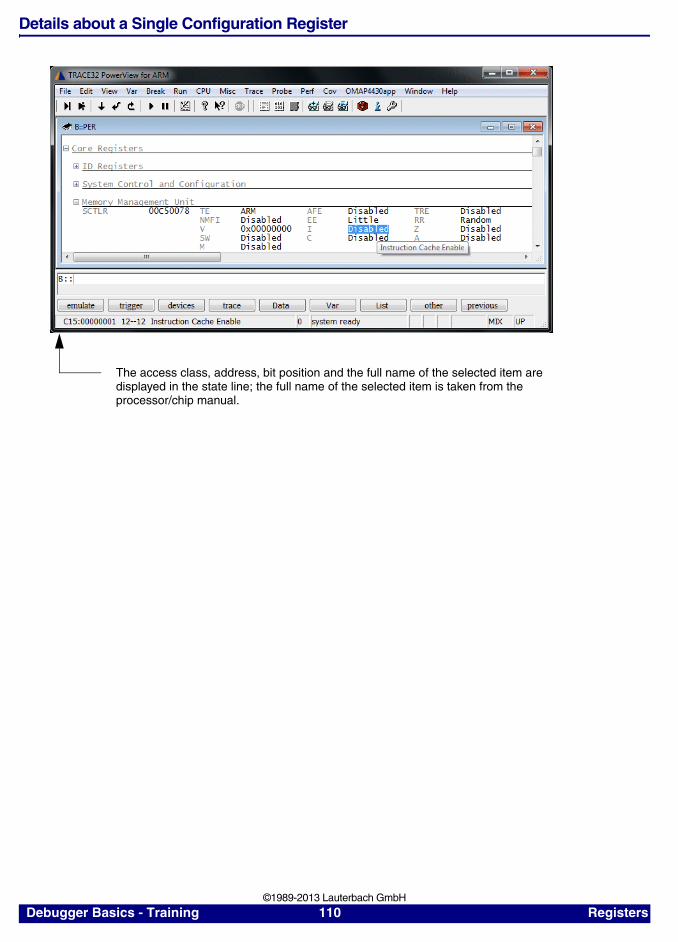
Details about a Single Configuration Register
The access class, address, bit position and the full name of the selected item are displayed in the state line; the full name of the selected item is taken from theprocessor/chip manual.
Debugger Basics - Training 110 Registers ©1989-2013 Lauterbach GmbH
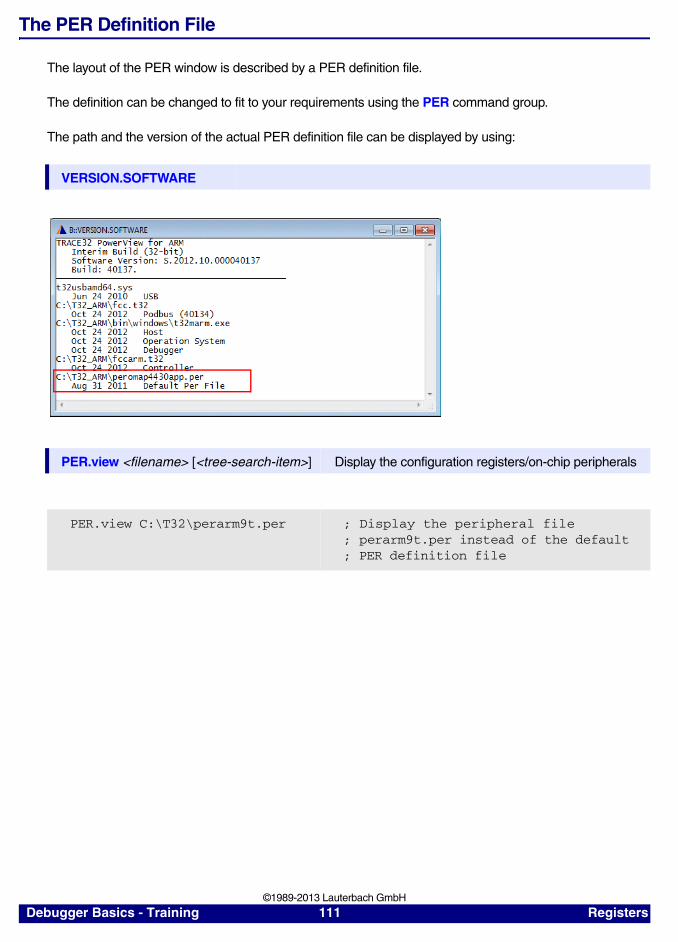
The PER Definition File
The layout of the PER window is described by a PER definition file.
The definition can be changed to fit to your requirements using the PER command group.
The path and the version of the actual PER definition file can be displayed by using:
VERSION.SOFTWARE
PER.view <filename> [<tree-search-item>] Display the configuration registers/on-chip peripherals
PER.view C:\T32\perarm9t.per ; Display the peripheral file ; perarm9t.per instead of the default ; PER definition file
Debugger Basics - Training 111 Registers ©1989-2013 Lauterbach GmbH
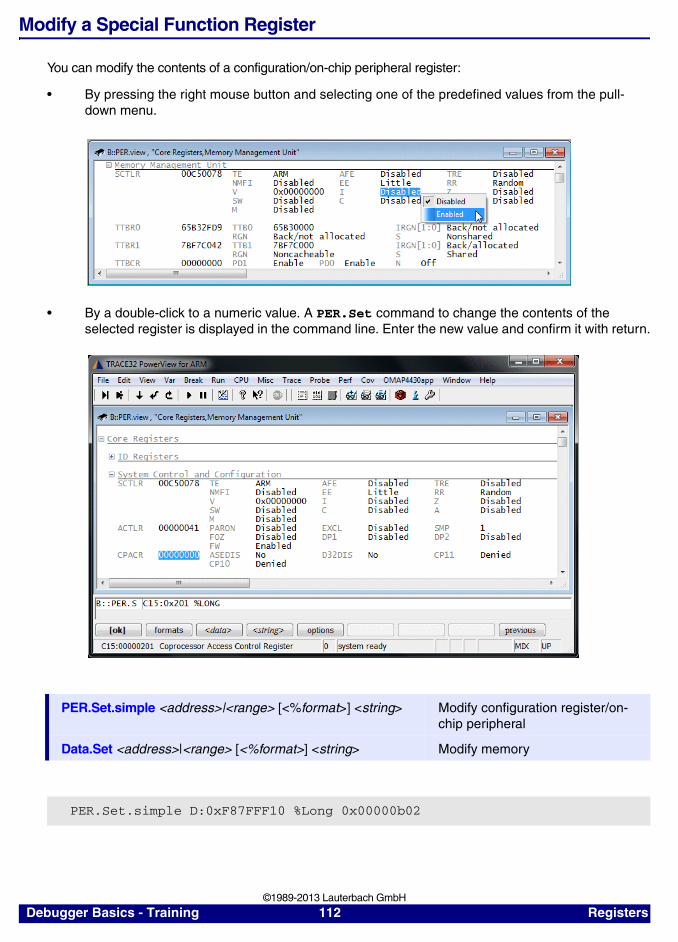
Modify a Special Function Register
You can modify the contents of a configuration/on-chip peripheral register:
• By pressing the right mouse button and selecting one of the predefined values from the pull-down menu.
• By a double-click to a numeric value. A PER.Set command to change the contents of the selected register is displayed in the command line. Enter the new value and confirm it with return.
PER.Set.simple <address>|<range> [<%format>] <string> Modify configuration register/on-chip peripheral
Data.Set <address>|<range> [<%format>] <string> Modify memory
PER.Set.simple D:0xF87FFF10 %Long 0x00000b02
Debugger Basics - Training 112 Registers ©1989-2013 Lauterbach GmbH
Memory Display and Modification
This training section introduces the most often used methods to display and modify memory:
• The Data.dump window, that displays a hex dump of a memory area, and the Data.Set command that allows to modify the contents of a memory address.
• The List (former Data.List) window, that displays the memory contents as source code listing.
A so-called access class is always displayed together with a memory address. The following access classes are available for all processor architectures:
For additional access classes provided by your processor architecture refer to your Processor Architecture Manual.
P:1000 Program address 0x1000
D:6814 Data address 0x6814
Debugger Basics - Training 113 Memory Display and Modification ©1989-2013 Lauterbach GmbH
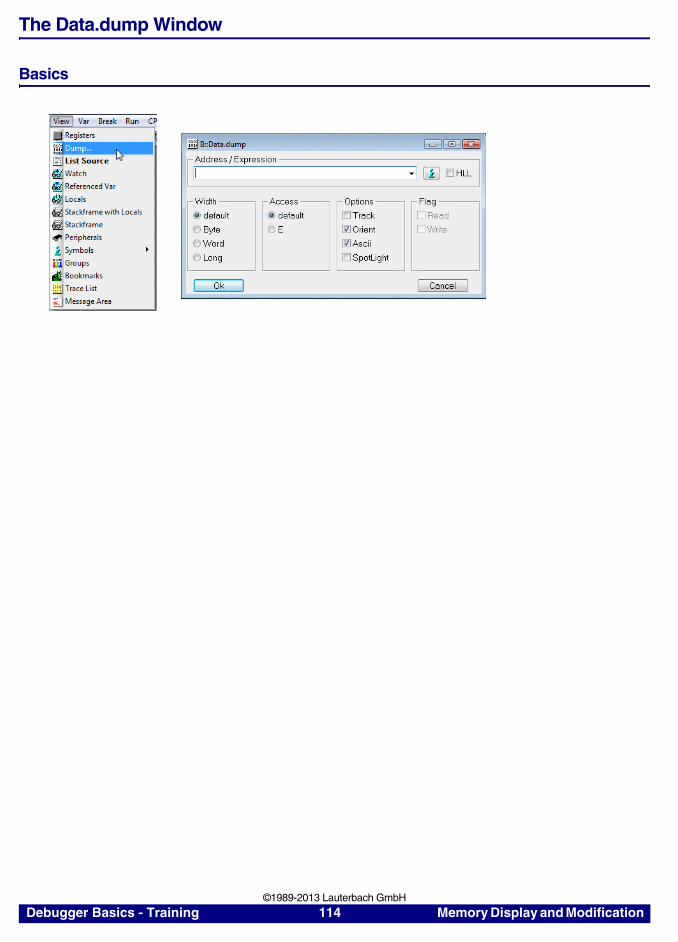
The Data.dump Window
Basics
Debugger Basics - Training 114 Memory Display and Modification ©1989-2013 Lauterbach GmbH
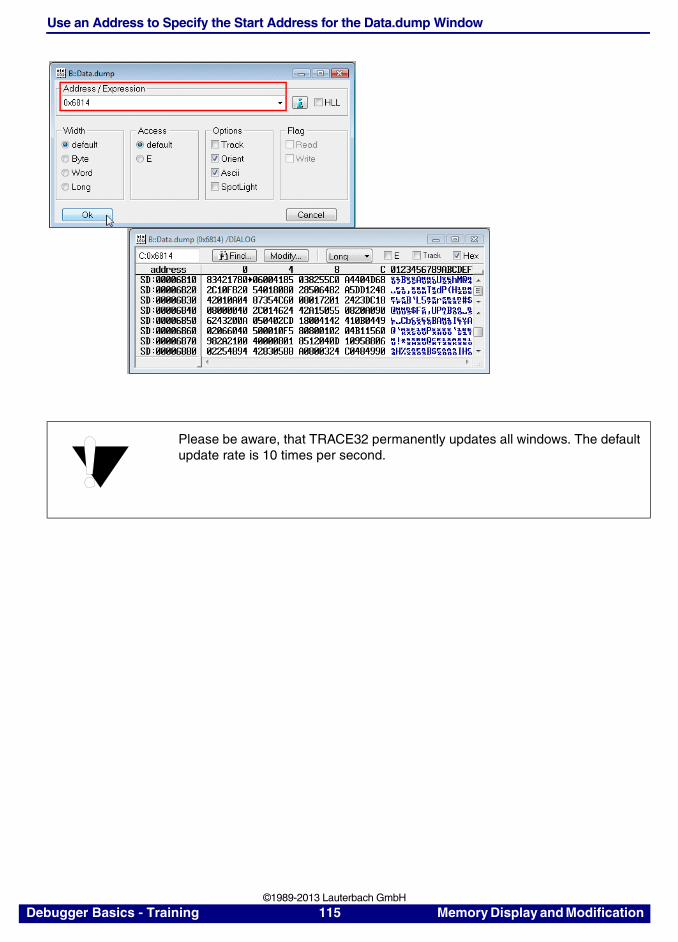
Use an Address to Specify the Start Address for the Data.dump Window
Please be aware, that TRACE32 permanently updates all windows. The default update rate is 10 times per second.
Debugger Basics - Training 115 Memory Display and Modification ©1989-2013 Lauterbach GmbH
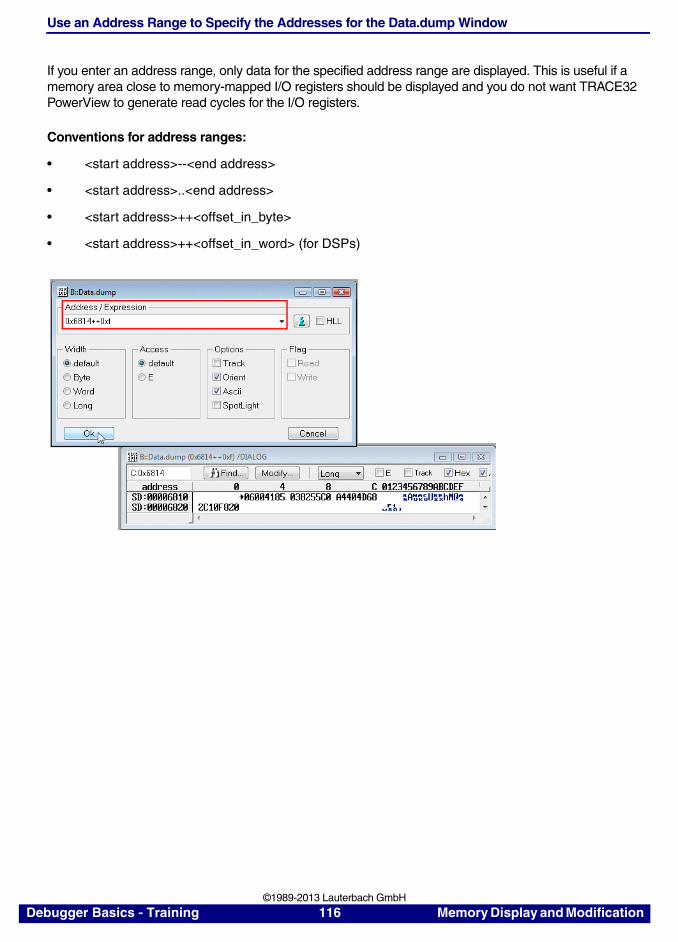
Use an Address Range to Specify the Addresses for the Data.dump Window
If you enter an address range, only data for the specified address range are displayed. This is useful if a memory area close to memory-mapped I/O registers should be displayed and you do not want TRACE32 PowerView to generate read cycles for the I/O registers.
Conventions for address ranges:
• <start address>--<end address>
• <start address>..<end address>
• <start address>++<offset_in_byte>
• <start address>++<offset_in_word> (for DSPs)
Debugger Basics - Training 116 Memory Display and Modification ©1989-2013 Lauterbach GmbH
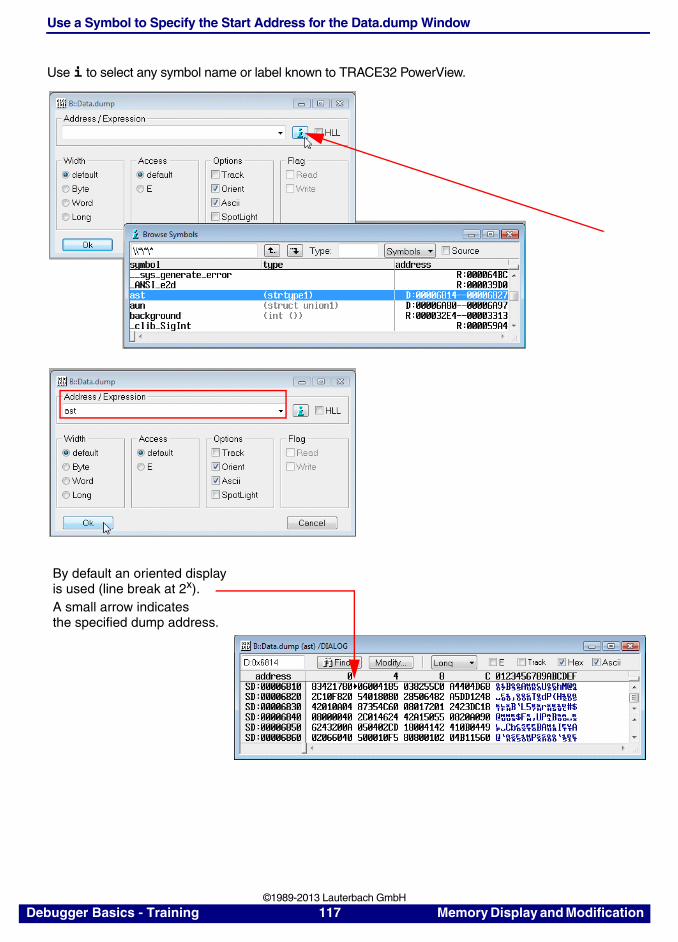
Use a Symbol to Specify the Start Address for the Data.dump Window
Use i to select any symbol name or label known to TRACE32 PowerView.
By default an oriented displayis used (line break at 2x).A small arrow indicatesthe specified dump address.
Debugger Basics - Training 117 Memory Display and Modification ©1989-2013 Lauterbach GmbH
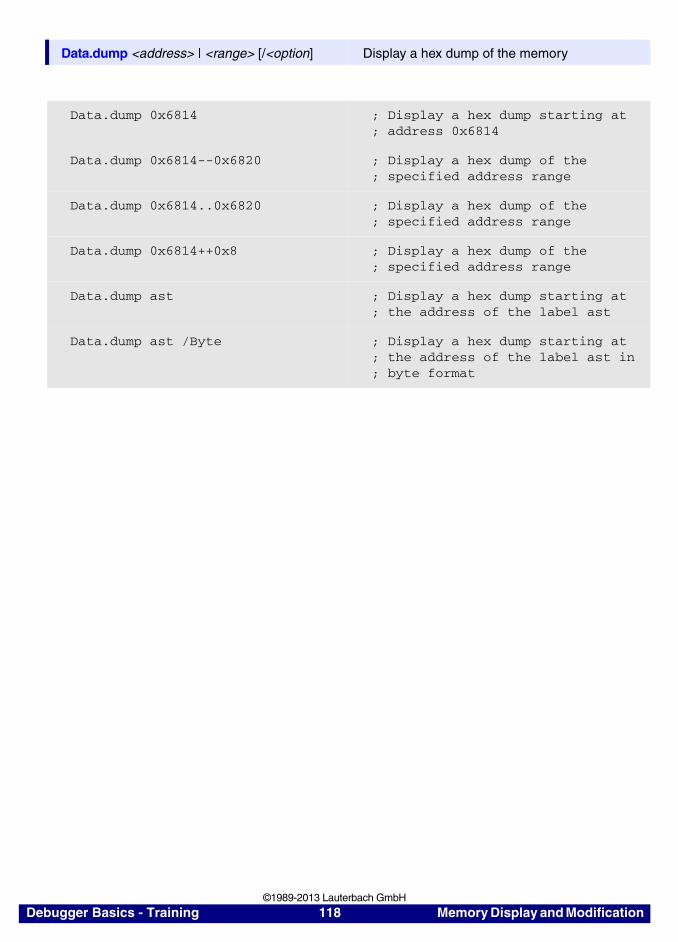
Data.dump <address> | <range> [/<option] Display a hex dump of the memory
Data.dump 0x6814 ; Display a hex dump starting at; address 0x6814
Data.dump 0x6814--0x6820 ; Display a hex dump of the; specified address range
Data.dump 0x6814..0x6820 ; Display a hex dump of the; specified address range
Data.dump 0x6814++0x8 ; Display a hex dump of the; specified address range
Data.dump ast ; Display a hex dump starting at; the address of the label ast
Data.dump ast /Byte ; Display a hex dump starting at; the address of the label ast in; byte format
Debugger Basics - Training 118 Memory Display and Modification ©1989-2013 Lauterbach GmbH
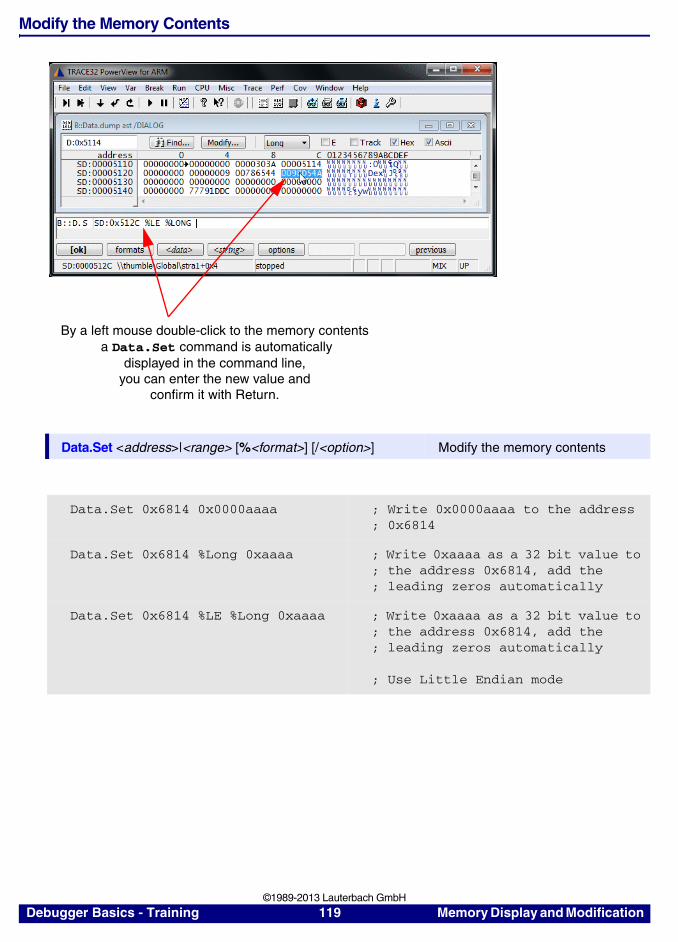
Modify the Memory Contents
Data.Set <address>|<range> [%<format>] [/<option>] Modify the memory contents
Data.Set 0x6814 0x0000aaaa ; Write 0x0000aaaa to the address; 0x6814
Data.Set 0x6814 %Long 0xaaaa ; Write 0xaaaa as a 32 bit value to ; the address 0x6814, add the ; leading zeros automatically
Data.Set 0x6814 %LE %Long 0xaaaa ; Write 0xaaaa as a 32 bit value to ; the address 0x6814, add the ; leading zeros automatically
; Use Little Endian mode
By a left mouse double-click to the memory contents a Data.Set command is automatically
displayed in the command line,you can enter the new value and
confirm it with Return.
Debugger Basics - Training 119 Memory Display and Modification ©1989-2013 Lauterbach GmbH
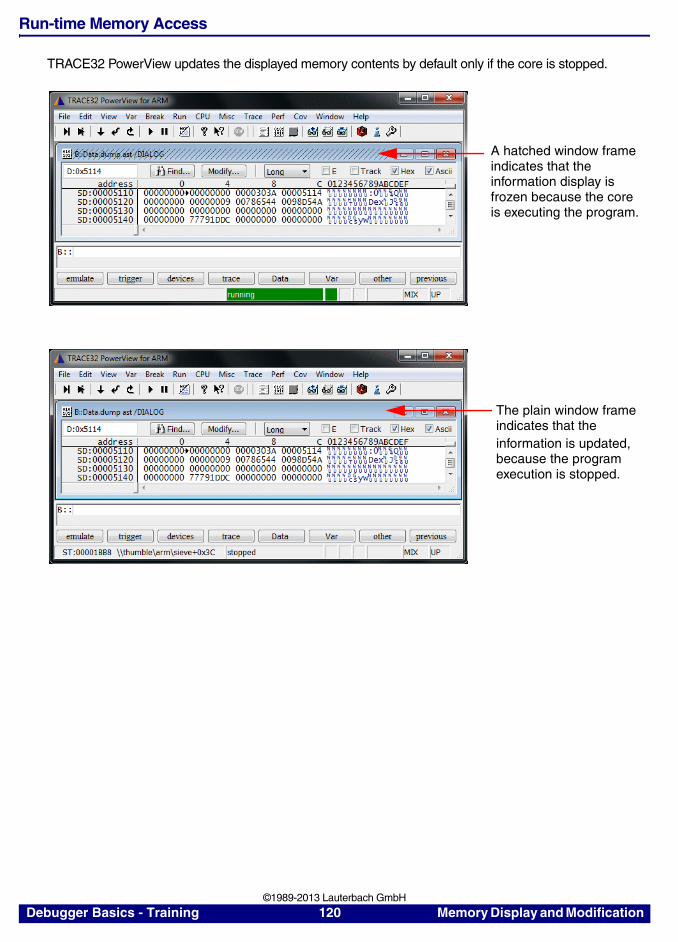
Run-time Memory Access
TRACE32 PowerView updates the displayed memory contents by default only if the core is stopped.
A hatched window frameindicates that theinformation display is frozen because the coreis executing the program.
The plain window frame
information is updated, because the programexecution is stopped.
indicates that the
Debugger Basics - Training 120 Memory Display and Modification ©1989-2013 Lauterbach GmbH
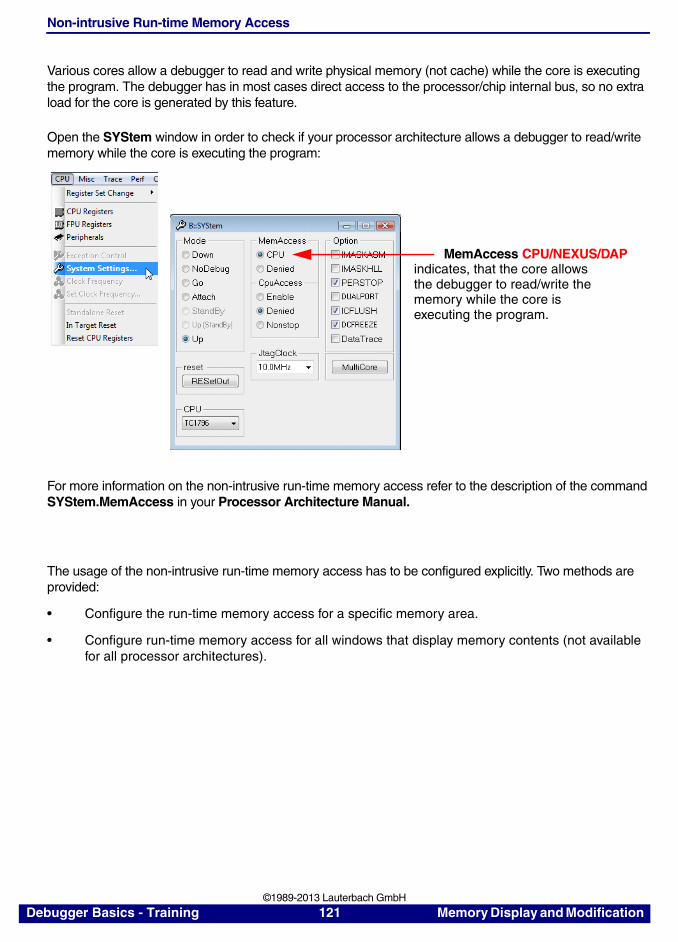
Non-intrusive Run-time Memory Access
Various cores allow a debugger to read and write physical memory (not cache) while the core is executing the program. The debugger has in most cases direct access to the processor/chip internal bus, so no extra load for the core is generated by this feature.
Open the SYStem window in order to check if your processor architecture allows a debugger to read/write memory while the core is executing the program:
For more information on the non-intrusive run-time memory access refer to the description of the command SYStem.MemAccess in your Processor Architecture Manual.
The usage of the non-intrusive run-time memory access has to be configured explicitly. Two methods are provided:
• Configure the run-time memory access for a specific memory area.
• Configure run-time memory access for all windows that display memory contents (not available for all processor architectures).
MemAccess CPU/NEXUS/DAPindicates, that the core allowsthe debugger to read/write the memory while the core is executing the program.
Debugger Basics - Training 121 Memory Display and Modification ©1989-2013 Lauterbach GmbH
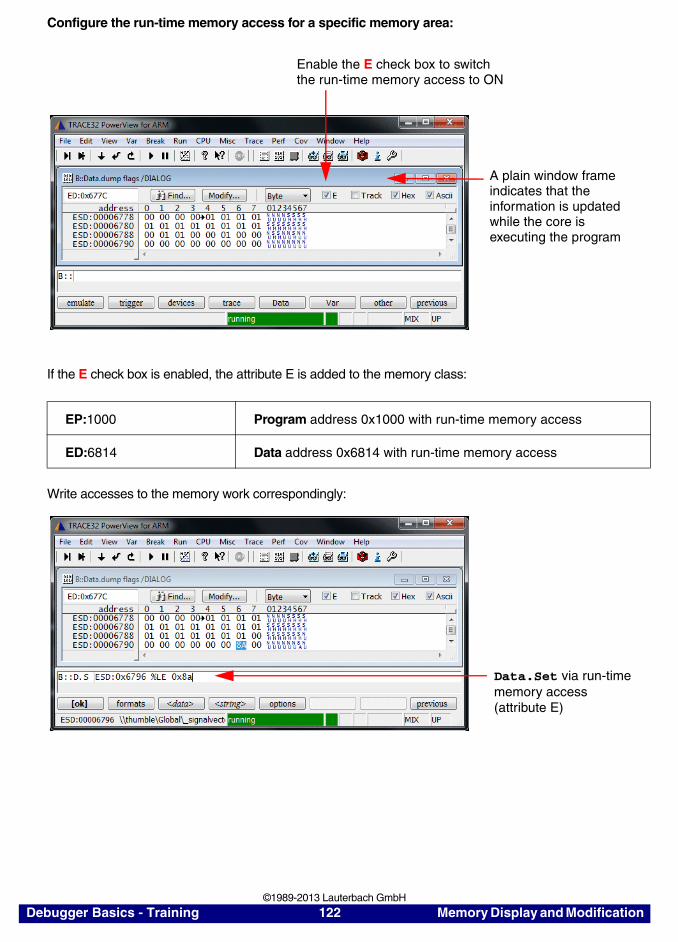
Configure the run-time memory access for a specific memory area:
If the E check box is enabled, the attribute E is added to the memory class:
Write accesses to the memory work correspondingly:
EP:1000 Program address 0x1000 with run-time memory access
ED:6814 Data address 0x6814 with run-time memory access
Enable the E check box to switch the run-time memory access to ON
A plain window frame indicates that the information is updatedwhile the core is executing the program
Data.Set via run-time
(attribute E)memory access
Debugger Basics - Training 122 Memory Display and Modification ©1989-2013 Lauterbach GmbH
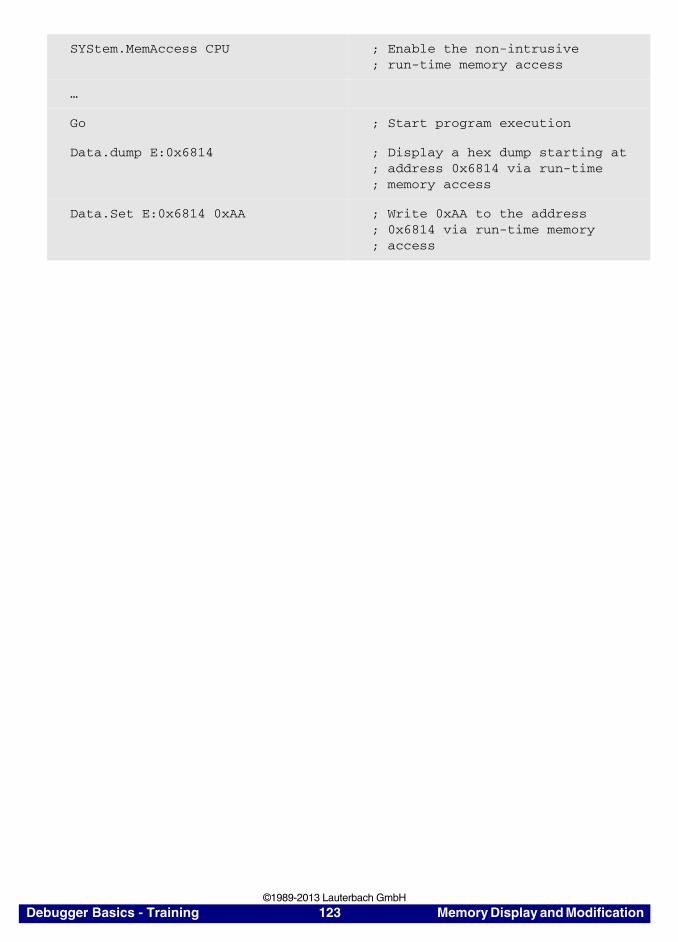
SYStem.MemAccess CPU ; Enable the non-intrusive; run-time memory access
…
Go ; Start program execution
Data.dump E:0x6814 ; Display a hex dump starting at; address 0x6814 via run-time ; memory access
Data.Set E:0x6814 0xAA ; Write 0xAA to the address; 0x6814 via run-time memory; access
Debugger Basics - Training 123 Memory Display and Modification ©1989-2013 Lauterbach GmbH
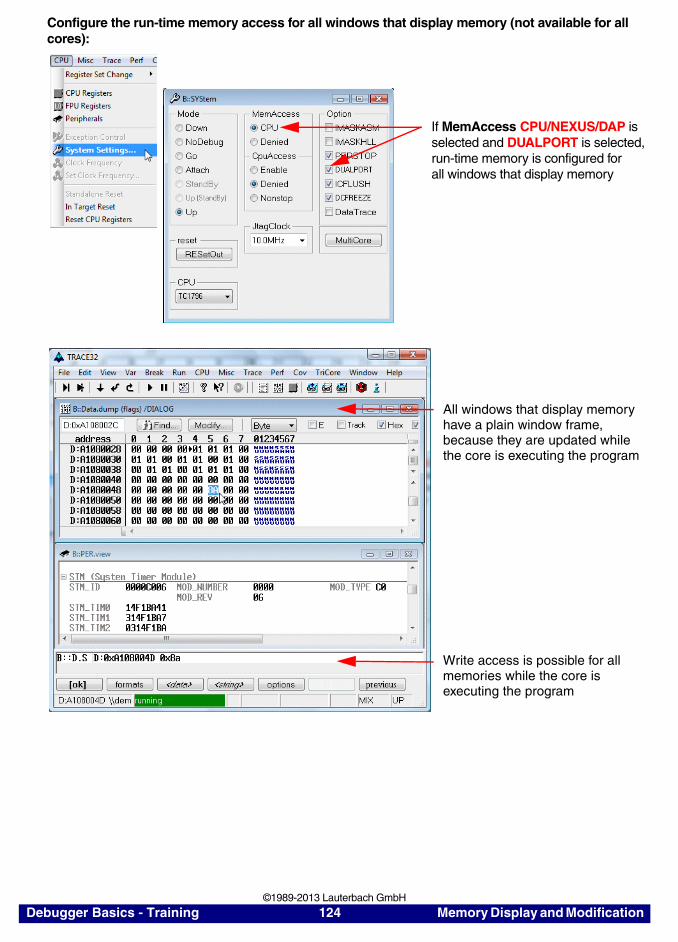
Configure the run-time memory access for all windows that display memory (not available for all cores):
If MemAccess CPU/NEXUS/DAP isselected and DUALPORT is selected,run-time memory is configured forall windows that display memory
All windows that display memoryhave a plain window frame, because they are updated whilethe core is executing the program
Write access is possible for allmemories while the core isexecuting the program
Debugger Basics - Training 124 Memory Display and Modification ©1989-2013 Lauterbach GmbH

SYStem.MemAccess CPU ; Enable the non-intrusive; run-time memory access
SYStem.Option DUALPORT ON ; Activate the run-time memory; access for all windows that; display memory
…
Go ; Start program execution
Data.dump 0x6814 ; Display a hex dump starting at; address 0x6814 via run-time ; memory access
Data.Set 0x6814 0xAA ; Write 0xAA to the address; 0x6814 via run-time memory; access
Debugger Basics - Training 125 Memory Display and Modification ©1989-2013 Lauterbach GmbH
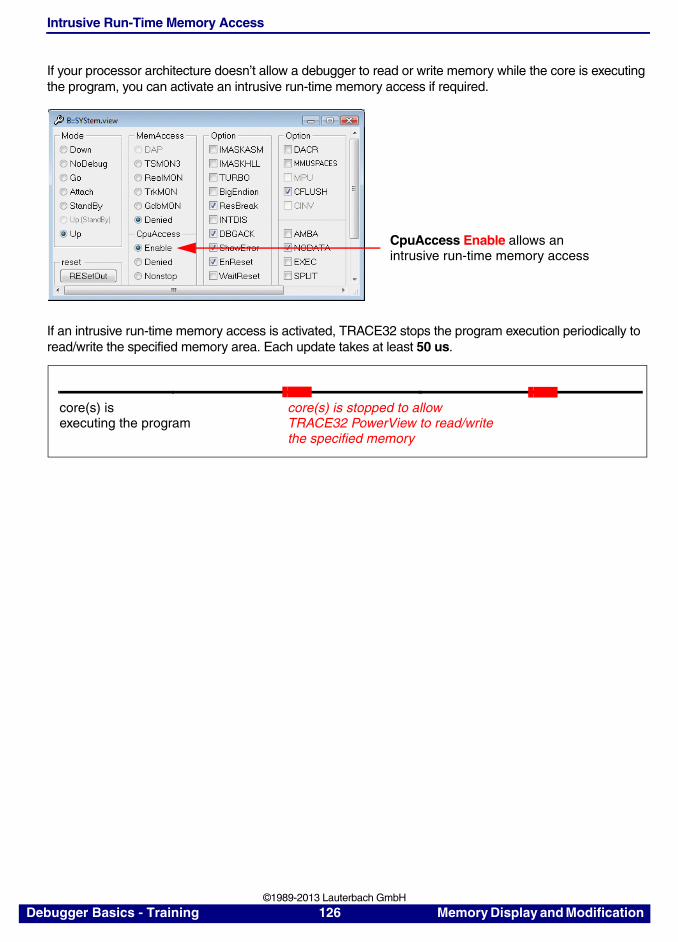
Intrusive Run-Time Memory Access
If your processor architecture doesn’t allow a debugger to read or write memory while the core is executing the program, you can activate an intrusive run-time memory access if required.
If an intrusive run-time memory access is activated, TRACE32 stops the program execution periodically to read/write the specified memory area. Each update takes at least 50 us.
CpuAccess Enable allows anintrusive run-time memory access
core(s) is core(s) is stopped to allow TRACE32 PowerView to read/write the specified memory
executing the program
Debugger Basics - Training 126 Memory Display and Modification ©1989-2013 Lauterbach GmbH
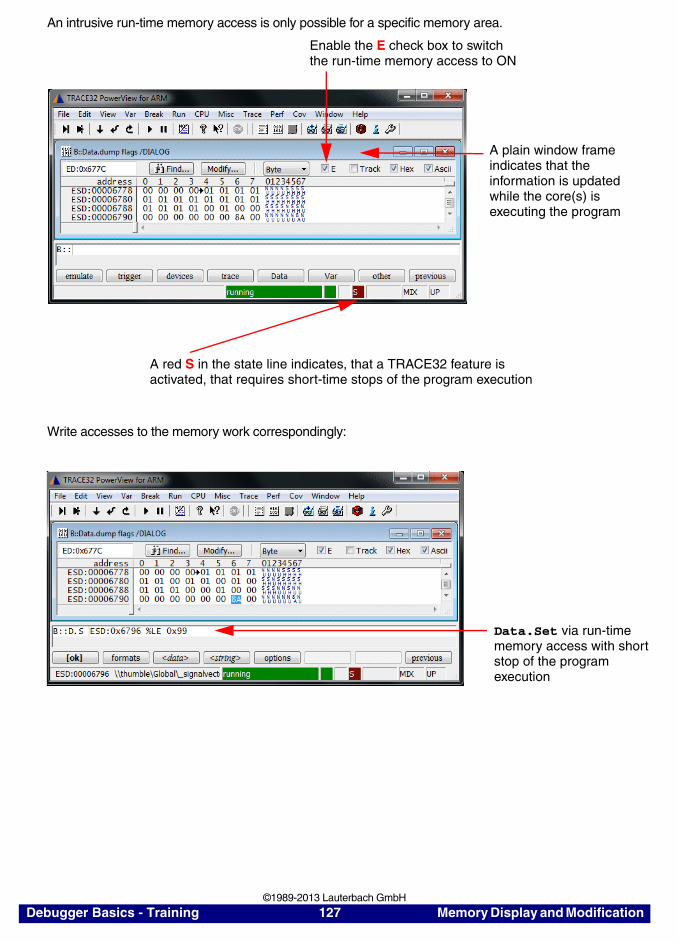
An intrusive run-time memory access is only possible for a specific memory area.
Write accesses to the memory work correspondingly:
Enable the E check box to switch the run-time memory access to ON
A plain window frame indicates that the information is updatedwhile the core(s) is executing the program
A red S in the state line indicates, that a TRACE32 feature isactivated, that requires short-time stops of the program execution
Data.Set via run-timememory access with shortstop of the programexecution
Debugger Basics - Training 127 Memory Display and Modification ©1989-2013 Lauterbach GmbH
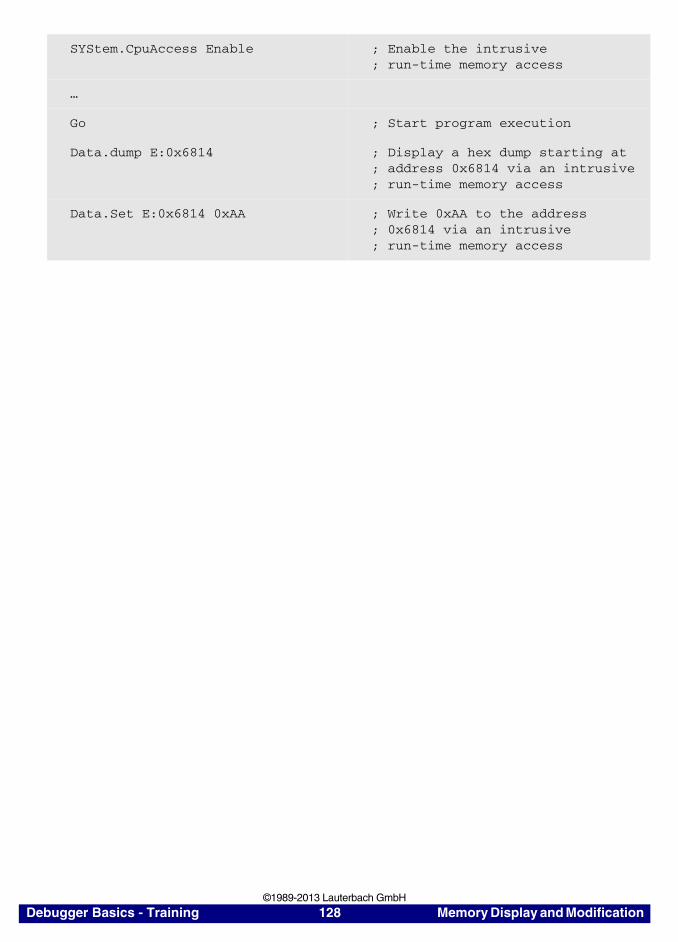
SYStem.CpuAccess Enable ; Enable the intrusive; run-time memory access
…
Go ; Start program execution
Data.dump E:0x6814 ; Display a hex dump starting at; address 0x6814 via an intrusive; run-time memory access
Data.Set E:0x6814 0xAA ; Write 0xAA to the address; 0x6814 via an intrusive; run-time memory access
Debugger Basics - Training 128 Memory Display and Modification ©1989-2013 Lauterbach GmbH

Colored Display of Changed Memory Contents
Data.dump flags /SpotLight ; Display a hex dump starting at; the address of the label flags
; Mark changes
Enable the option SpotLight to mark thememory contents changed by the last4 single steps in rubiginous becoming lighter
Debugger Basics - Training 129 Memory Display and Modification ©1989-2013 Lauterbach GmbH
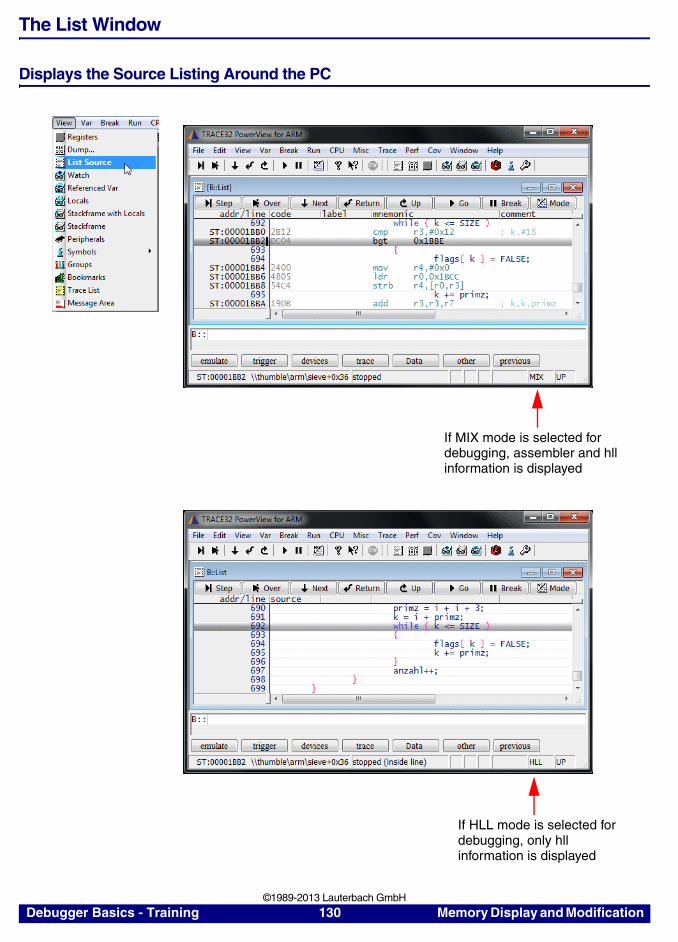
The List Window
Displays the Source Listing Around the PC
If MIX mode is selected fordebugging, assembler and hllinformation is displayed
If HLL mode is selected fordebugging, only hllinformation is displayed
Debugger Basics - Training 130 Memory Display and Modification ©1989-2013 Lauterbach GmbH
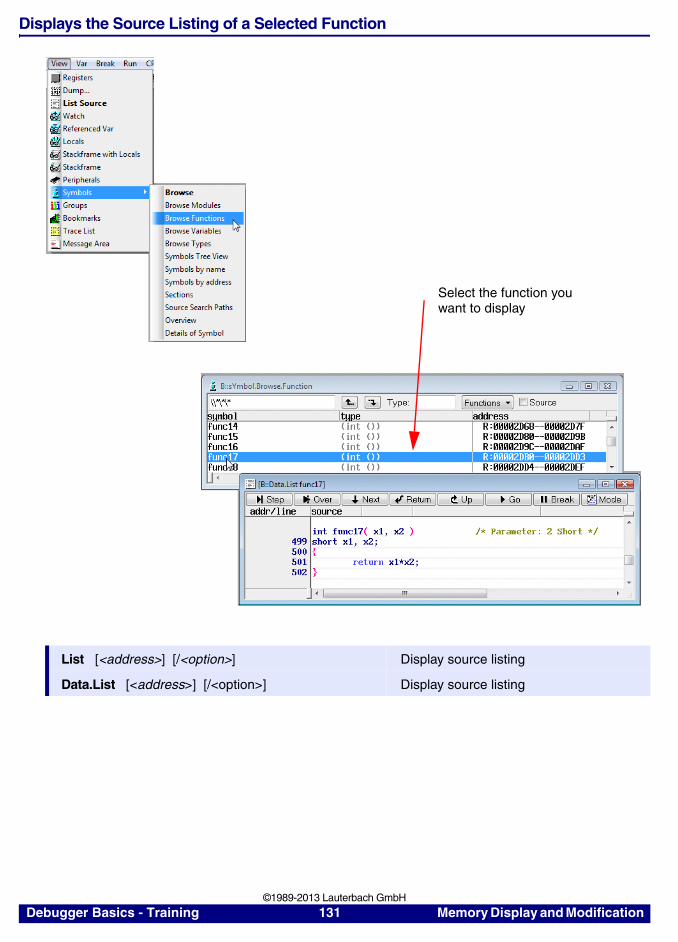
Displays the Source Listing of a Selected Function
List [<address>] [/<option>] Display source listing
Data.List [<address>] [/<option>] Display source listing
Select the function youwant to display
Debugger Basics - Training 131 Memory Display and Modification ©1989-2013 Lauterbach GmbH
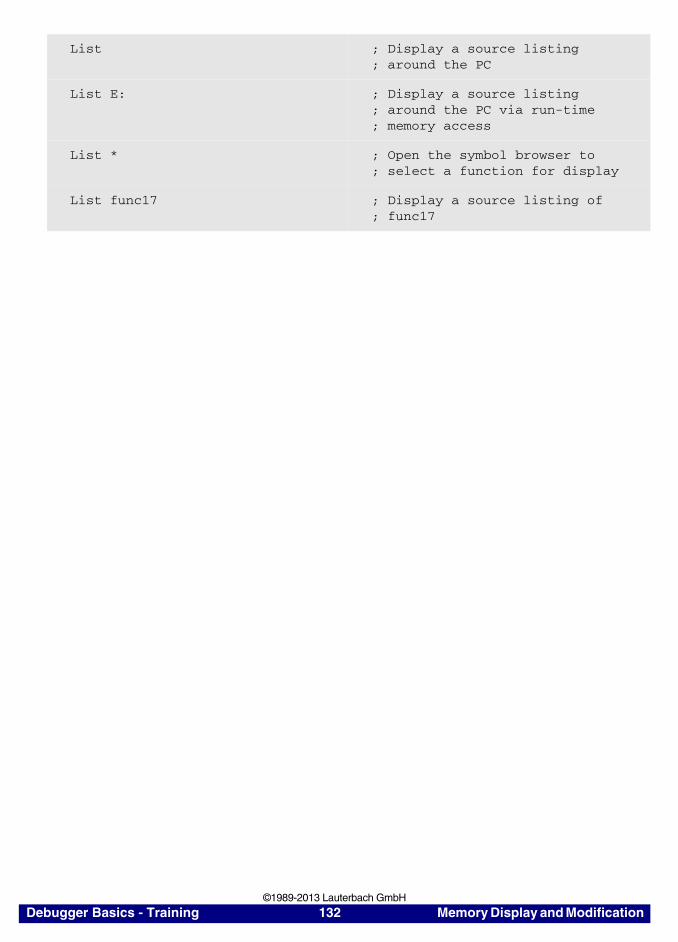
List ; Display a source listing; around the PC
List E: ; Display a source listing; around the PC via run-time; memory access
List * ; Open the symbol browser to ; select a function for display
List func17 ; Display a source listing of; func17
Debugger Basics - Training 132 Memory Display and Modification ©1989-2013 Lauterbach GmbH
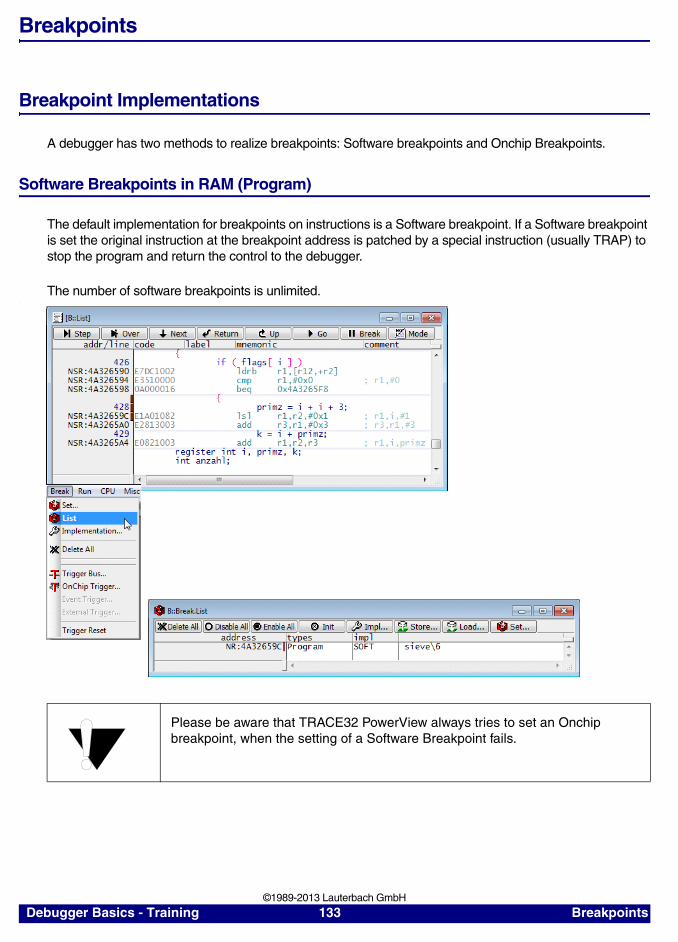
Breakpoints
Breakpoint Implementations
A debugger has two methods to realize breakpoints: Software breakpoints and Onchip Breakpoints.
Software Breakpoints in RAM (Program)
The default implementation for breakpoints on instructions is a Software breakpoint. If a Software breakpoint is set the original instruction at the breakpoint address is patched by a special instruction (usually TRAP) to stop the program and return the control to the debugger.
The number of software breakpoints is unlimited..
Please be aware that TRACE32 PowerView always tries to set an Onchip breakpoint, when the setting of a Software Breakpoint fails.
Debugger Basics - Training 133 Breakpoints ©1989-2013 Lauterbach GmbH
Software Breakpoints in FLASH (Program)
TRACE32 allows to set software breakpoints to FLASH. Refer to the section “Software Breakpoints in FLASH” in NOR FLASH Programming User’s Guide (norflash.pdf).
Debugger Basics - Training 134 Breakpoints ©1989-2013 Lauterbach GmbH
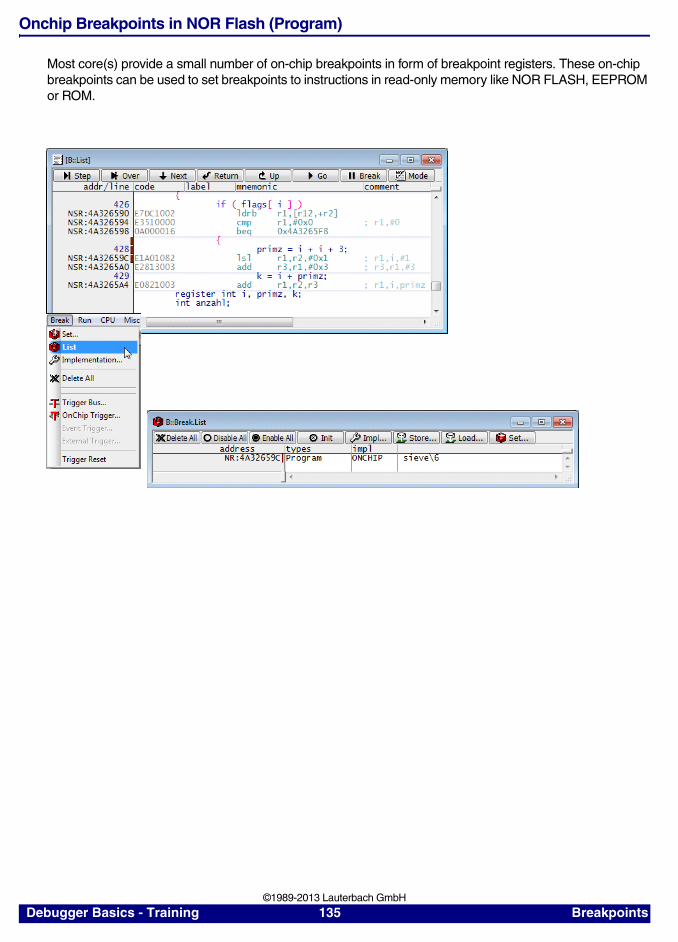
Onchip Breakpoints in NOR Flash (Program)
Most core(s) provide a small number of on-chip breakpoints in form of breakpoint registers. These on-chip breakpoints can be used to set breakpoints to instructions in read-only memory like NOR FLASH, EEPROM or ROM.
Debugger Basics - Training 135 Breakpoints ©1989-2013 Lauterbach GmbH
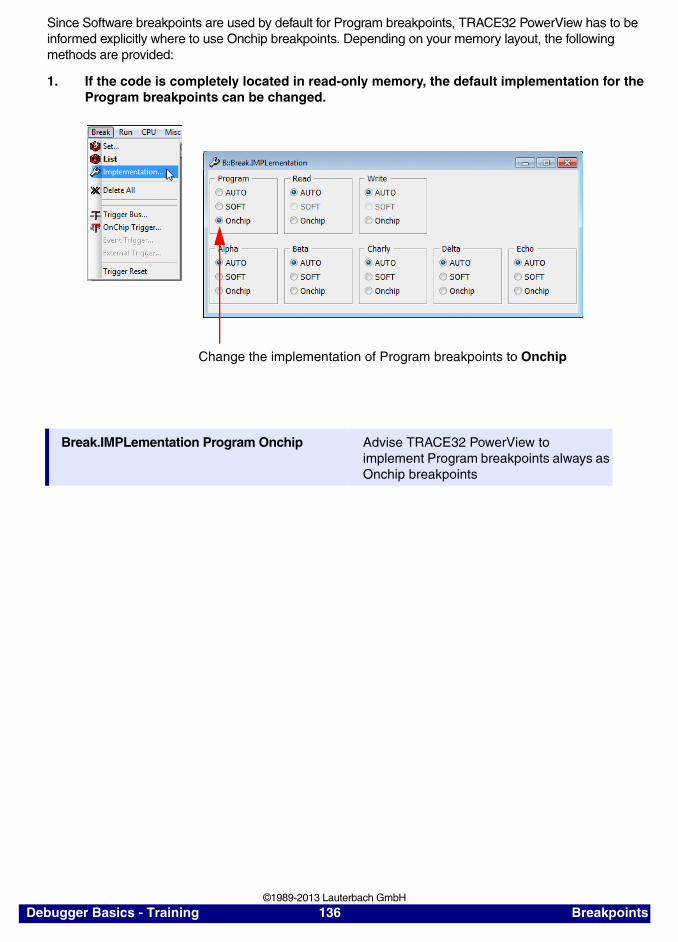
Since Software breakpoints are used by default for Program breakpoints, TRACE32 PowerView has to be informed explicitly where to use Onchip breakpoints. Depending on your memory layout, the following methods are provided:
1. If the code is completely located in read-only memory, the default implementation for the Program breakpoints can be changed.
Break.IMPLementation Program Onchip Advise TRACE32 PowerView to implement Program breakpoints always as Onchip breakpoints
Change the implementation of Program breakpoints to Onchip
Debugger Basics - Training 136 Breakpoints ©1989-2013 Lauterbach GmbH
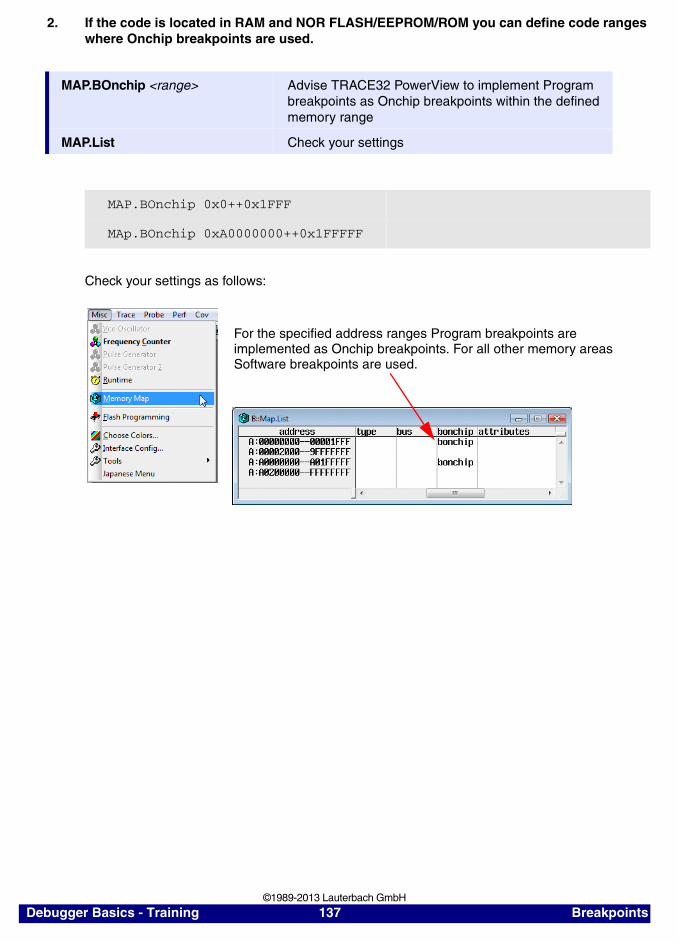
2. If the code is located in RAM and NOR FLASH/EEPROM/ROM you can define code ranges where Onchip breakpoints are used.
Check your settings as follows:
MAP.BOnchip <range> Advise TRACE32 PowerView to implement Program breakpoints as Onchip breakpoints within the defined memory range
MAP.List Check your settings
MAP.BOnchip 0x0++0x1FFF
MAp.BOnchip 0xA0000000++0x1FFFFF
For the specified address ranges Program breakpoints are implemented as Onchip breakpoints. For all other memory areasSoftware breakpoints are used.
Debugger Basics - Training 137 Breakpoints ©1989-2013 Lauterbach GmbH
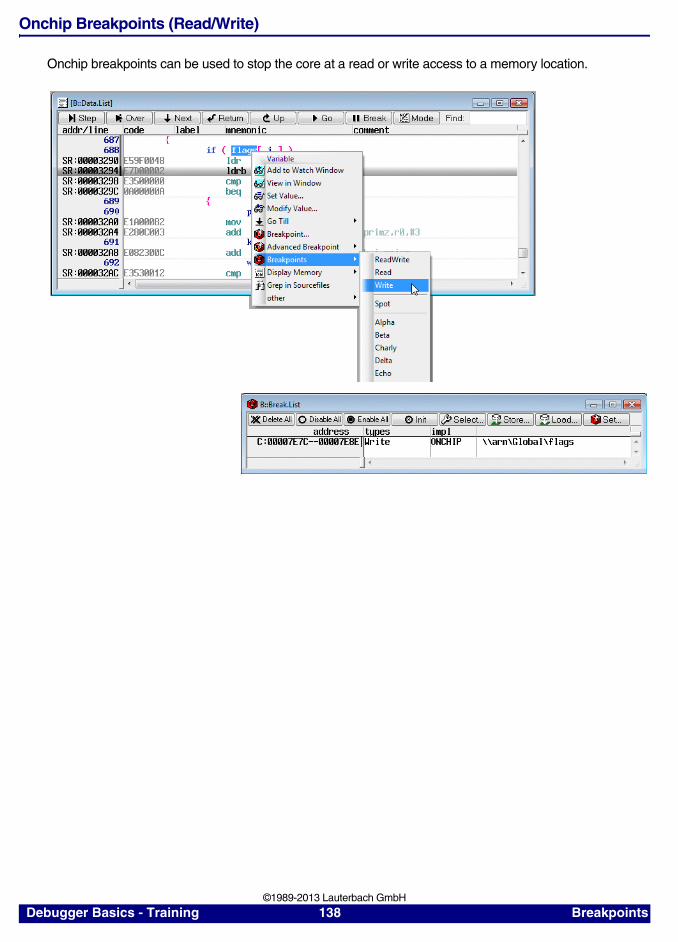
Onchip Breakpoints (Read/Write)
Onchip breakpoints can be used to stop the core at a read or write access to a memory location.
Debugger Basics - Training 138 Breakpoints ©1989-2013 Lauterbach GmbH
Onchip Breakpoints by Processor Architecture
The list on the next page gives an overview of the availability and the usage of the on-chip breakpoints. The following notations are used:
• On-chip breakpoints: Total amount of available on-chip breakpoints.
• Program breakpoints: Number of on-chip breakpoints that can be used to set Program break-points into FLASH/EEPROM/ROM.
• Read/Write breakpoints: Number of on-chip breakpoints that stop the program when a read or write to a certain address happens.
• Data value breakpoint: Number of on-chip data breakpoints that stop the program when a spe-cific data value is written to an address or when a specific data value is read from an address.
Single address/address ranges/bit masks
For some processor architectures on-chip breakpoints can only mark single addresses (e.g ARM11).
Most processor architectures allow to mark address ranges with on-chip breakpoints. It is very common that one on-chip breakpoint marks the start address of the address range while the second on-chip breakpoint marks the end address (e.g. MPC55xx).
Debugger Basics - Training 139 Breakpoints ©1989-2013 Lauterbach GmbH
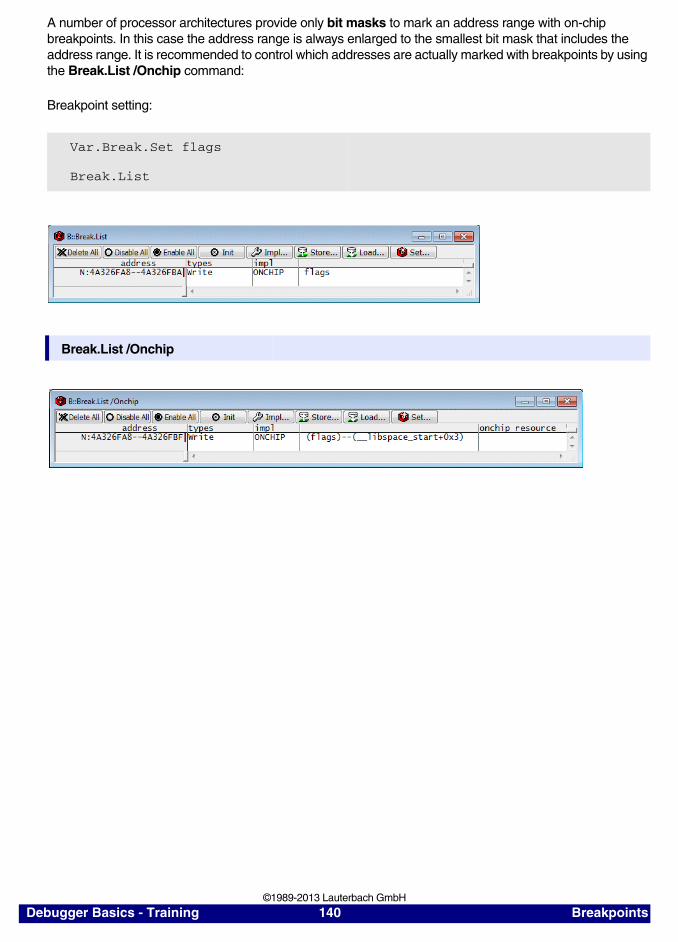
A number of processor architectures provide only bit masks to mark an address range with on-chip breakpoints. In this case the address range is always enlarged to the smallest bit mask that includes the address range. It is recommended to control which addresses are actually marked with breakpoints by using the Break.List /Onchip command:
Breakpoint setting:
Var.Break.Set flags
Break.List
Break.List /Onchip
Debugger Basics - Training 140 Breakpoints ©1989-2013 Lauterbach GmbH

RISC/CISC Processors
FamilyOn-chipBreakpoints
Instruction Breakpoints
Read/WriteBreakpoint
Data ValueBreakpoints
68k6833x6834x68360
——1
——1
——1
———
68HC1268HC12A
up to 2 up to 2 single address
up to 2 single address
1
68HC16 — — — —
78K0R 1 1 single address 1 single address 1
Andes 0 … 8 up to 8 up to 8range as bit mask
up to 8
APS 3 instruction 3 single address — —
ARM7ARM9Janus
2 or(1 if software breakpoints are used)
up to 2range as bit mask
up to 2range as bit mask
2
ARM10/ARM11
2 … 16 instruction2 … 16 read/write
2 … 16single address
2 … 16single address
—
ARMv8 2 … 16 instruction2 … 16 read/write
2 … 16single address
2 … 16single address
—
ATOM 4 4single address
4single address or very small ranges
—
AVR32 6 instruction2 read/write
6range as bit mask
2range as bit mask
2
C166SV2 4 up to 4 up to 4 writeup to 1 read
up to 4 writeup to 1 read
Cortex-A5 3 instruction2 read/write
3single address
2range as bit mask, break before make
—
Debugger Basics - Training 141 Breakpoints ©1989-2013 Lauterbach GmbH
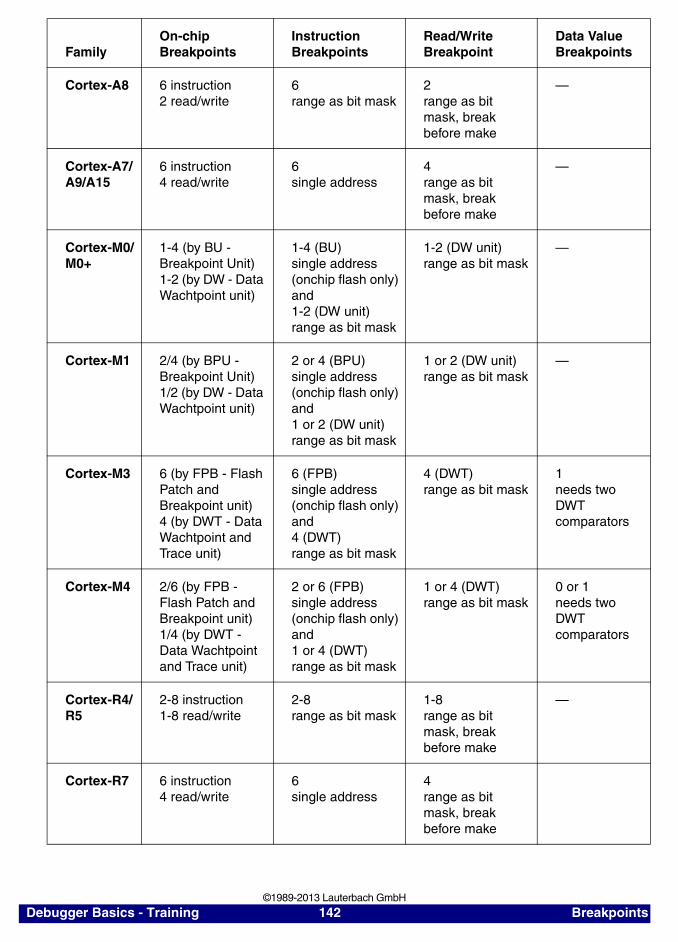
Cortex-A8 6 instruction2 read/write
6range as bit mask
2range as bit mask, break before make
—
Cortex-A7/A9/A15
6 instruction4 read/write
6single address
4range as bit mask, break before make
—
Cortex-M0/M0+
1-4 (by BU - Breakpoint Unit)1-2 (by DW - Data Wachtpoint unit)
1-4 (BU) single address (onchip flash only)and1-2 (DW unit) range as bit mask
1-2 (DW unit) range as bit mask
—
Cortex-M1 2/4 (by BPU - Breakpoint Unit)1/2 (by DW - Data Wachtpoint unit)
2 or 4 (BPU) single address (onchip flash only)and1 or 2 (DW unit) range as bit mask
1 or 2 (DW unit) range as bit mask
—
Cortex-M3 6 (by FPB - Flash Patch and Breakpoint unit)4 (by DWT - Data Wachtpoint and Trace unit)
6 (FPB) single address (onchip flash only)and4 (DWT) range as bit mask
4 (DWT) range as bit mask
1needs two DWT comparators
Cortex-M4 2/6 (by FPB - Flash Patch and Breakpoint unit)1/4 (by DWT - Data Wachtpoint and Trace unit)
2 or 6 (FPB) single address (onchip flash only)and1 or 4 (DWT) range as bit mask
1 or 4 (DWT) range as bit mask
0 or 1needs two DWT comparators
Cortex-R4/R5
2-8 instruction1-8 read/write
2-8range as bit mask
1-8range as bit mask, break before make
—
Cortex-R7 6 instruction4 read/write
6single address
4range as bit mask, break before make
FamilyOn-chipBreakpoints
Instruction Breakpoints
Read/WriteBreakpoint
Data ValueBreakpoints
Debugger Basics - Training 142 Breakpoints ©1989-2013 Lauterbach GmbH
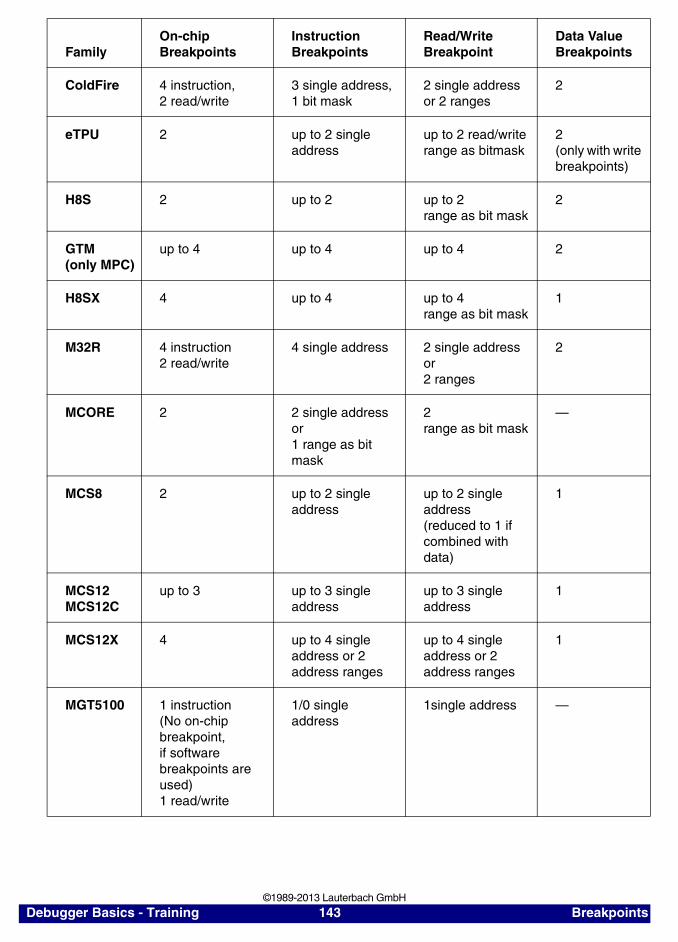
ColdFire 4 instruction, 2 read/write
3 single address, 1 bit mask
2 single address or 2 ranges
2
eTPU 2 up to 2 single address
up to 2 read/writerange as bitmask
2(only with write breakpoints)
H8S 2 up to 2 up to 2range as bit mask
2
GTM(only MPC)
up to 4 up to 4 up to 4 2
H8SX 4 up to 4 up to 4range as bit mask
1
M32R 4 instruction2 read/write
4 single address 2 single address or2 ranges
2
MCORE 2 2 single address or1 range as bit mask
2range as bit mask
—
MCS8 2 up to 2 single address
up to 2 single address(reduced to 1 if combined with data)
1
MCS12MCS12C
up to 3 up to 3 single address
up to 3 single address
1
MCS12X 4 up to 4 single address or 2 address ranges
up to 4 single address or 2 address ranges
1
MGT5100 1 instruction(No on-chip breakpoint,if software breakpoints are used)1 read/write
1/0 single address
1single address —
FamilyOn-chipBreakpoints
Instruction Breakpoints
Read/WriteBreakpoint
Data ValueBreakpoints
Debugger Basics - Training 143 Breakpoints ©1989-2013 Lauterbach GmbH
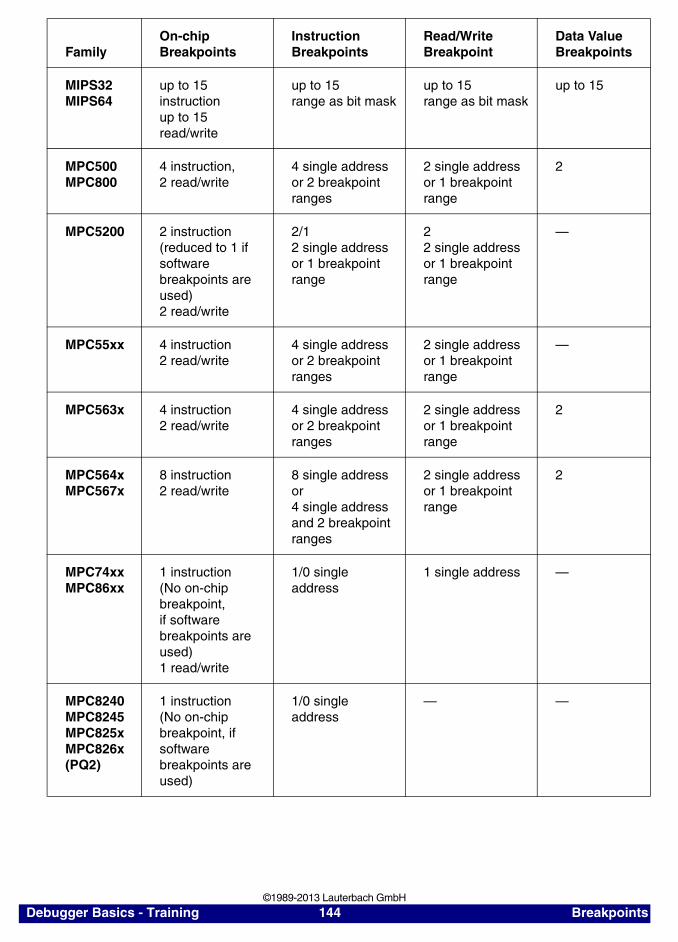
MIPS32MIPS64
up to 15 instructionup to 15 read/write
up to 15range as bit mask
up to 15range as bit mask
up to 15
MPC500MPC800
4 instruction,2 read/write
4 single address or 2 breakpoint ranges
2 single address or 1 breakpoint range
2
MPC5200 2 instruction (reduced to 1 if software breakpoints are used)2 read/write
2/12 single address or 1 breakpoint range
22 single address or 1 breakpoint range
—
MPC55xx 4 instruction2 read/write
4 single address or 2 breakpoint ranges
2 single address or 1 breakpoint range
—
MPC563x 4 instruction2 read/write
4 single address or 2 breakpoint ranges
2 single address or 1 breakpoint range
2
MPC564xMPC567x
8 instruction2 read/write
8 single addressor4 single address and 2 breakpoint ranges
2 single address or 1 breakpoint range
2
MPC74xxMPC86xx
1 instruction(No on-chip breakpoint,if software breakpoints are used)1 read/write
1/0 single address
1 single address —
MPC8240MPC8245MPC825xMPC826x(PQ2)
1 instruction(No on-chip breakpoint, if software breakpoints are used)
1/0 single address
— —
FamilyOn-chipBreakpoints
Instruction Breakpoints
Read/WriteBreakpoint
Data ValueBreakpoints
Debugger Basics - Training 144 Breakpoints ©1989-2013 Lauterbach GmbH
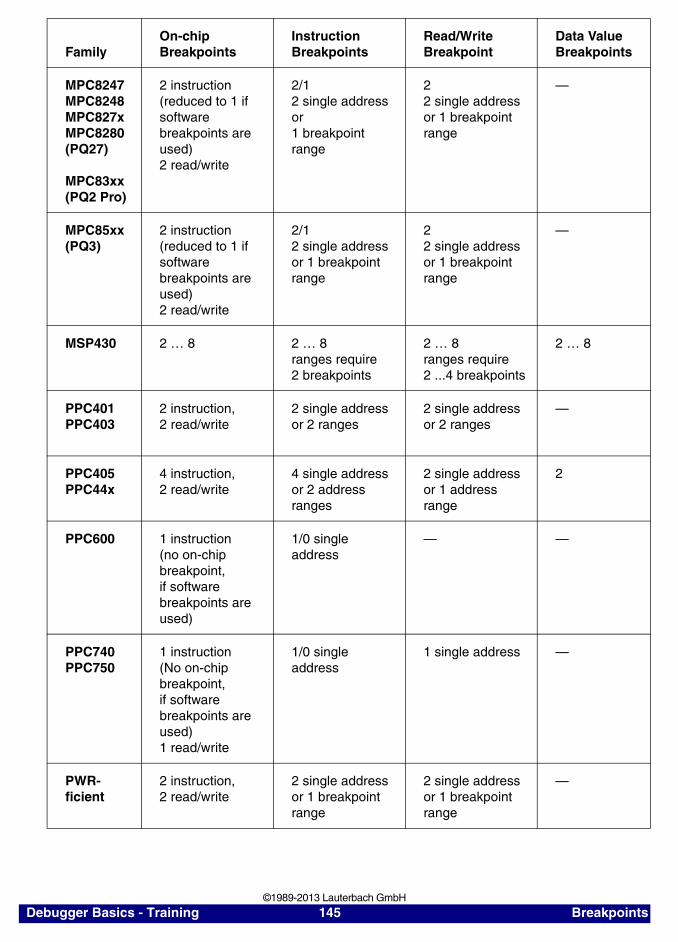
MPC8247MPC8248MPC827xMPC8280(PQ27)
MPC83xx(PQ2 Pro)
2 instruction (reduced to 1 if software breakpoints are used)2 read/write
2/12 single address or1 breakpoint range
22 single address or 1 breakpoint range
—
MPC85xx(PQ3)
2 instruction (reduced to 1 if software breakpoints are used)2 read/write
2/12 single address or 1 breakpoint range
2 2 single address or 1 breakpoint range
—
MSP430 2 … 8 2 … 8ranges require 2 breakpoints
2 … 8ranges require 2 ...4 breakpoints
2 … 8
PPC401PPC403
2 instruction, 2 read/write
2 single address or 2 ranges
2 single address or 2 ranges
—
PPC405PPC44x
4 instruction, 2 read/write
4 single address or 2 address ranges
2 single address or 1 address range
2
PPC600 1 instruction(no on-chip breakpoint,if software breakpoints are used)
1/0 single address
— —
PPC740PPC750
1 instruction(No on-chip breakpoint,if software breakpoints are used)1 read/write
1/0 single address
1 single address —
PWR-ficient
2 instruction, 2 read/write
2 single address or 1 breakpoint range
2 single address or 1 breakpoint range
—
FamilyOn-chipBreakpoints
Instruction Breakpoints
Read/WriteBreakpoint
Data ValueBreakpoints
Debugger Basics - Training 145 Breakpoints ©1989-2013 Lauterbach GmbH
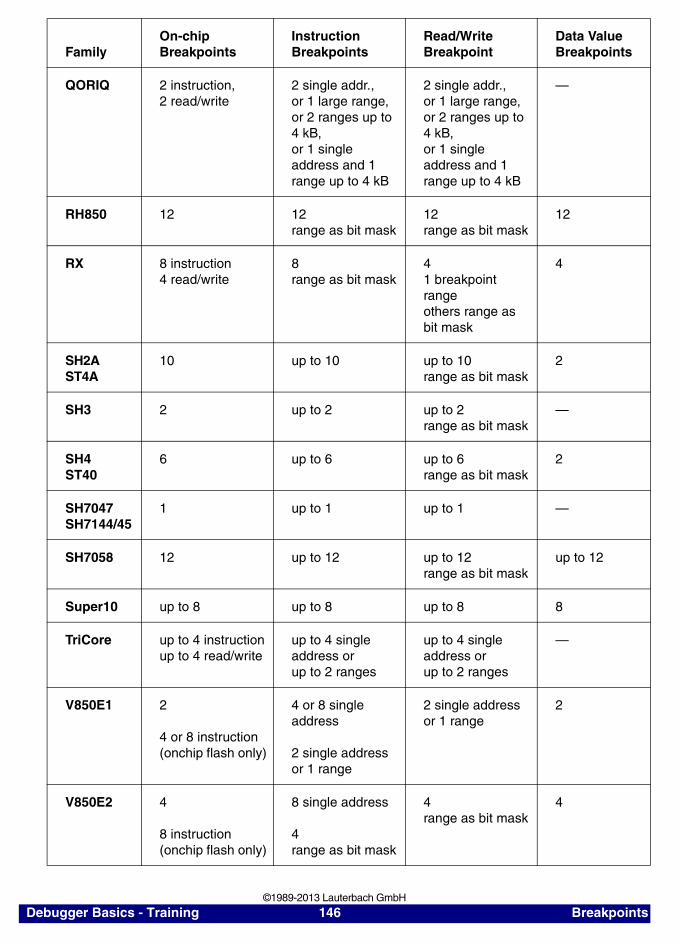
QORIQ 2 instruction, 2 read/write
2 single addr.,or 1 large range,or 2 ranges up to 4 kB, or 1 single address and 1 range up to 4 kB
2 single addr.,or 1 large range,or 2 ranges up to 4 kB, or 1 single address and 1 range up to 4 kB
—
RH850 12 12range as bit mask
12range as bit mask
12
RX 8 instruction4 read/write
8 range as bit mask
41 breakpoint rangeothers range as bit mask
4
SH2AST4A
10 up to 10 up to 10range as bit mask
2
SH3 2 up to 2 up to 2range as bit mask
—
SH4ST40
6 up to 6 up to 6range as bit mask
2
SH7047SH7144/45
1 up to 1 up to 1 —
SH7058 12 up to 12 up to 12range as bit mask
up to 12
Super10 up to 8 up to 8 up to 8 8
TriCore up to 4 instructionup to 4 read/write
up to 4 single address orup to 2 ranges
up to 4 single address orup to 2 ranges
—
V850E1 2
4 or 8 instruction(onchip flash only)
4 or 8 single address
2 single address or 1 range
2 single address or 1 range
2
V850E2 4
8 instruction(onchip flash only)
8 single address
4range as bit mask
4range as bit mask
4
FamilyOn-chipBreakpoints
Instruction Breakpoints
Read/WriteBreakpoint
Data ValueBreakpoints
Debugger Basics - Training 146 Breakpoints ©1989-2013 Lauterbach GmbH
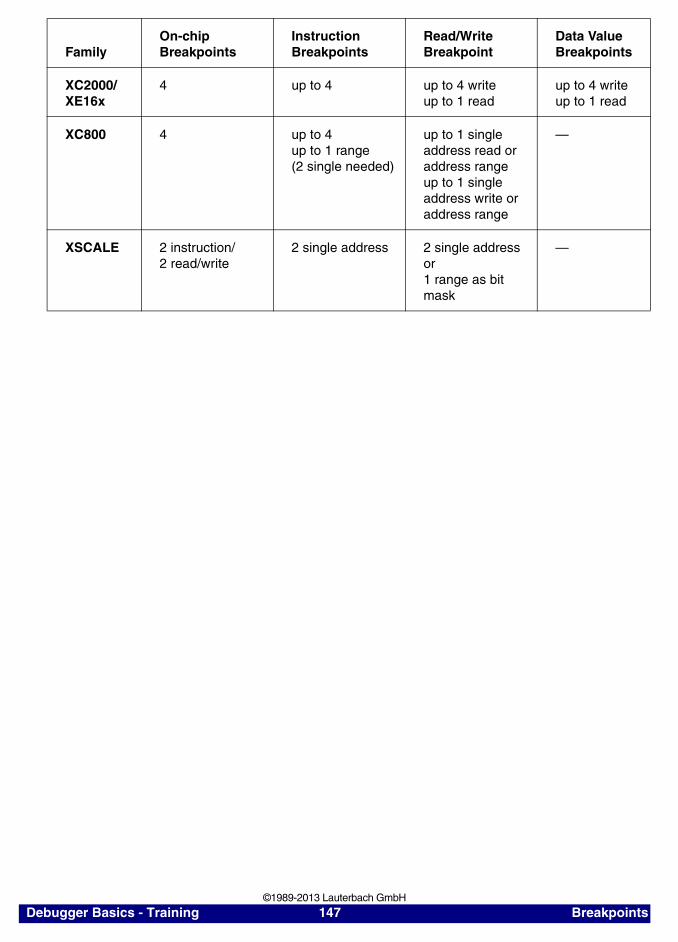
XC2000/XE16x
4 up to 4 up to 4 writeup to 1 read
up to 4 writeup to 1 read
XC800 4 up to 4up to 1 range (2 single needed)
up to 1 single address read or address rangeup to 1 single address write or address range
—
XSCALE 2 instruction/2 read/write
2 single address 2 single address or1 range as bit mask
—
FamilyOn-chipBreakpoints
Instruction Breakpoints
Read/WriteBreakpoint
Data ValueBreakpoints
Debugger Basics - Training 147 Breakpoints ©1989-2013 Lauterbach GmbH
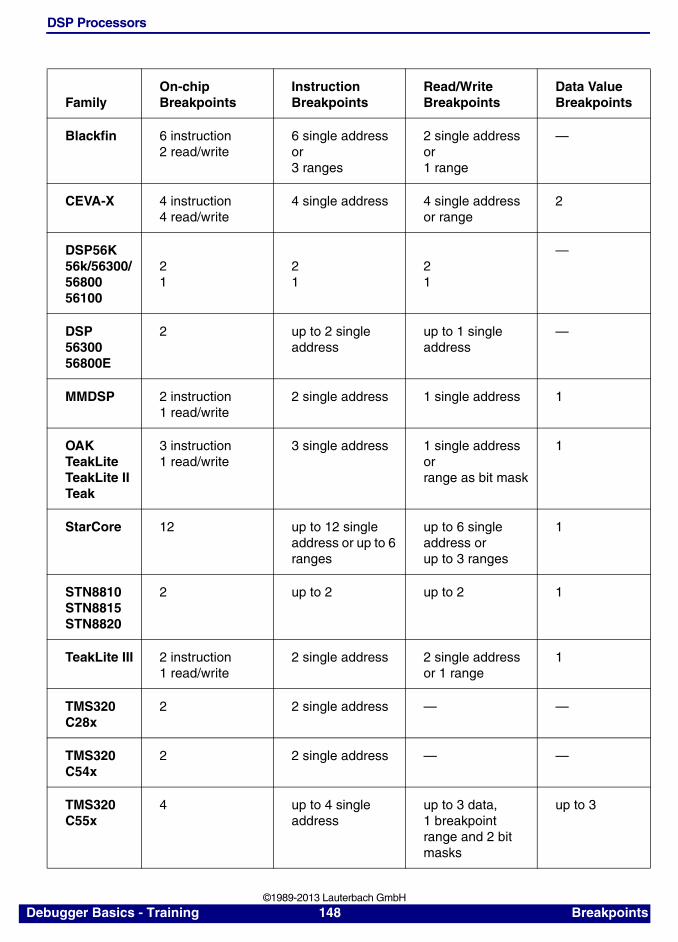
DSP Processors
FamilyOn-chipBreakpoints
InstructionBreakpoints
Read/WriteBreakpoints
Data ValueBreakpoints
Blackfin 6 instruction2 read/write
6 single address or3 ranges
2 single address or1 range
—
CEVA-X 4 instruction4 read/write
4 single address 4 single address or range
2
DSP56K56k/56300/5680056100
21
21
21
—
DSP5630056800E
2 up to 2 single address
up to 1 single address
—
MMDSP 2 instruction1 read/write
2 single address 1 single address 1
OAKTeakLiteTeakLite IITeak
3 instruction1 read/write
3 single address 1 single addressorrange as bit mask
1
StarCore 12 up to 12 single address or up to 6 ranges
up to 6 single address orup to 3 ranges
1
STN8810STN8815STN8820
2 up to 2 up to 2 1
TeakLite III 2 instruction1 read/write
2 single address 2 single address or 1 range
1
TMS320C28x
2 2 single address — —
TMS320C54x
2 2 single address — —
TMS320C55x
4 up to 4 single address
up to 3 data, 1 breakpoint range and 2 bit masks
up to 3
Debugger Basics - Training 148 Breakpoints ©1989-2013 Lauterbach GmbH
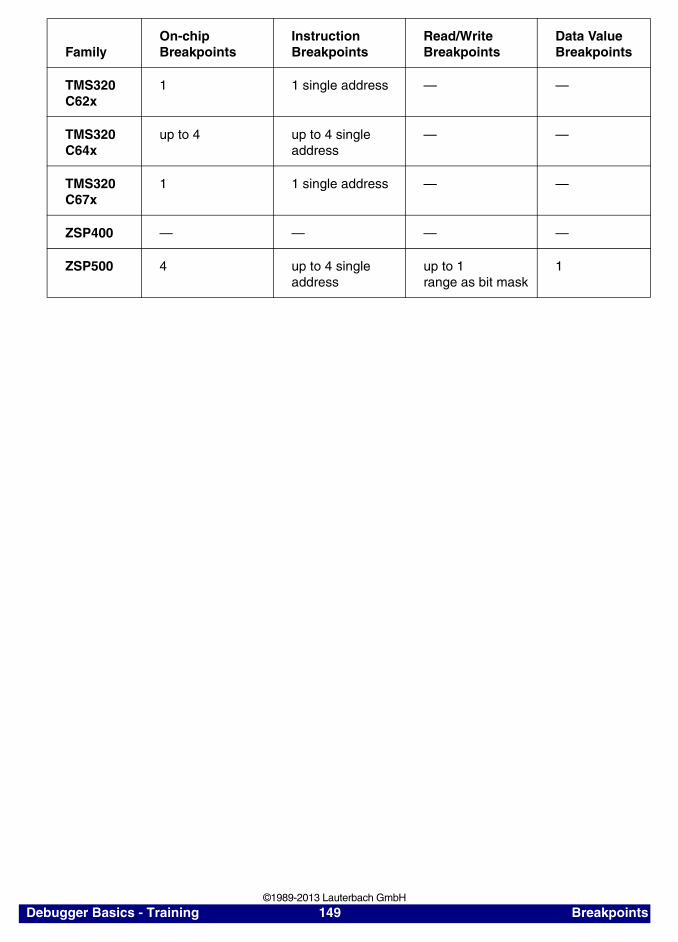
TMS320C62x
1 1 single address — —
TMS320C64x
up to 4 up to 4 single address
— —
TMS320C67x
1 1 single address — —
ZSP400 — — — —
ZSP500 4 up to 4 single address
up to 1range as bit mask
1
FamilyOn-chipBreakpoints
InstructionBreakpoints
Read/WriteBreakpoints
Data ValueBreakpoints
Debugger Basics - Training 149 Breakpoints ©1989-2013 Lauterbach GmbH
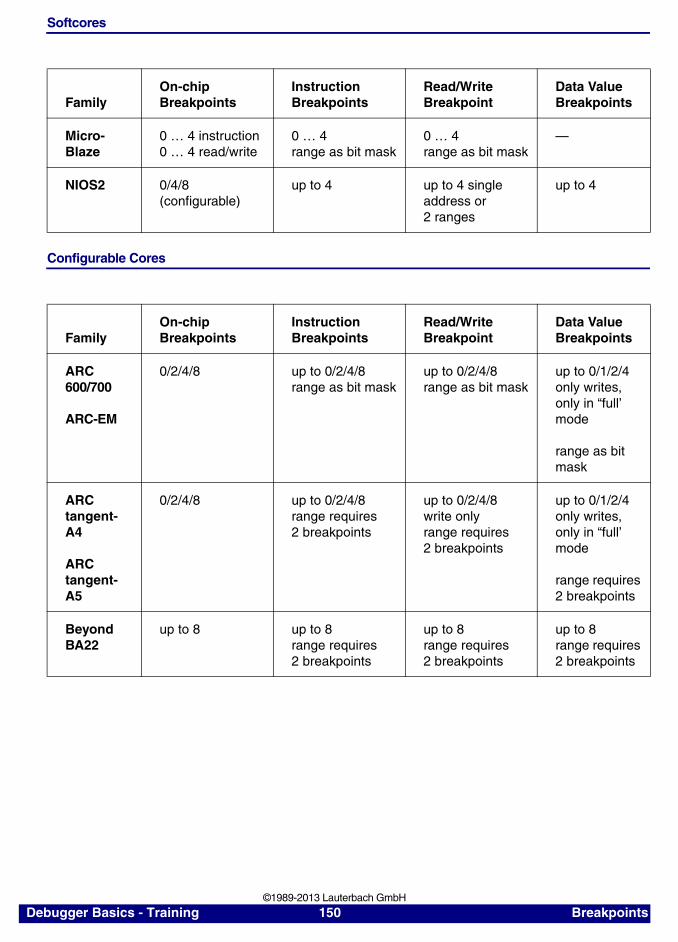
Softcores
Configurable Cores
FamilyOn-chipBreakpoints
Instruction Breakpoints
Read/Write Breakpoint
Data ValueBreakpoints
Micro-Blaze
0 … 4 instruction0 … 4 read/write
0 … 4range as bit mask
0 … 4range as bit mask
—
NIOS2 0/4/8(configurable)
up to 4 up to 4 single address or2 ranges
up to 4
FamilyOn-chipBreakpoints
Instruction Breakpoints
Read/Write Breakpoint
Data ValueBreakpoints
ARC600/700
ARC-EM
0/2/4/8 up to 0/2/4/8range as bit mask
up to 0/2/4/8range as bit mask
up to 0/1/2/4only writes,only in “full’ mode
range as bit mask
ARCtangent-A4
ARCtangent-A5
0/2/4/8 up to 0/2/4/8range requires 2 breakpoints
up to 0/2/4/8write onlyrange requires 2 breakpoints
up to 0/1/2/4only writes,only in “full’ mode
range requires 2 breakpoints
BeyondBA22
up to 8 up to 8 range requires 2 breakpoints
up to 8 range requires 2 breakpoints
up to 8 range requires 2 breakpoints
Debugger Basics - Training 150 Breakpoints ©1989-2013 Lauterbach GmbH
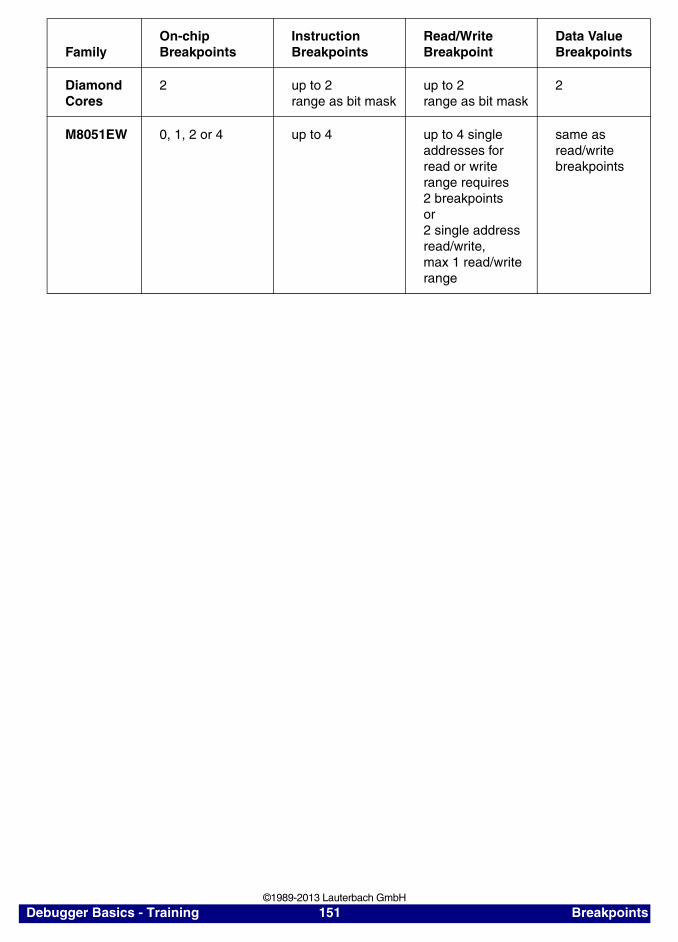
Diamond Cores
2 up to 2range as bit mask
up to 2range as bit mask
2
M8051EW 0, 1, 2 or 4 up to 4 up to 4 single addresses for read or writerange requires 2 breakpointsor 2 single address read/write,max 1 read/write range
same as read/writebreakpoints
FamilyOn-chipBreakpoints
Instruction Breakpoints
Read/Write Breakpoint
Data ValueBreakpoints
Debugger Basics - Training 151 Breakpoints ©1989-2013 Lauterbach GmbH
ETM Breakpoints (Read/Write) for ARM or Cortex-A/-R
The on-chip breakpoints offered by ARM and Cortex-A/-R cores provide sometimes restricted functionality on Read/Write breakpoints:
• Breakpoints on address ranges are implemented as bit masks.
• Breakpoints on address ranges are not supported at all.
• No data value can be specified for a Read/Write breakpoint.
In most cases better feature can be provided, if ETM breakpoints are added to the Onchip breakpoints. TRACE32 PowerView supports the usage of two ETM breakpoints.
ETM breakpoints can only be used by the TRACE32 debugger, if the ETM provides address information on load/store operations (data address information). For details refer to the chapter ETM Features and Settings in training_arm_etm.pdf.
Since the ETM is configured via the JTAG interface, Read and Write breakpoints from the ETM can be used by the TRACE32 debugger even if no ETM AutoFocus preprocessor is connected.
Debugger Basics - Training 152 Breakpoints ©1989-2013 Lauterbach GmbH
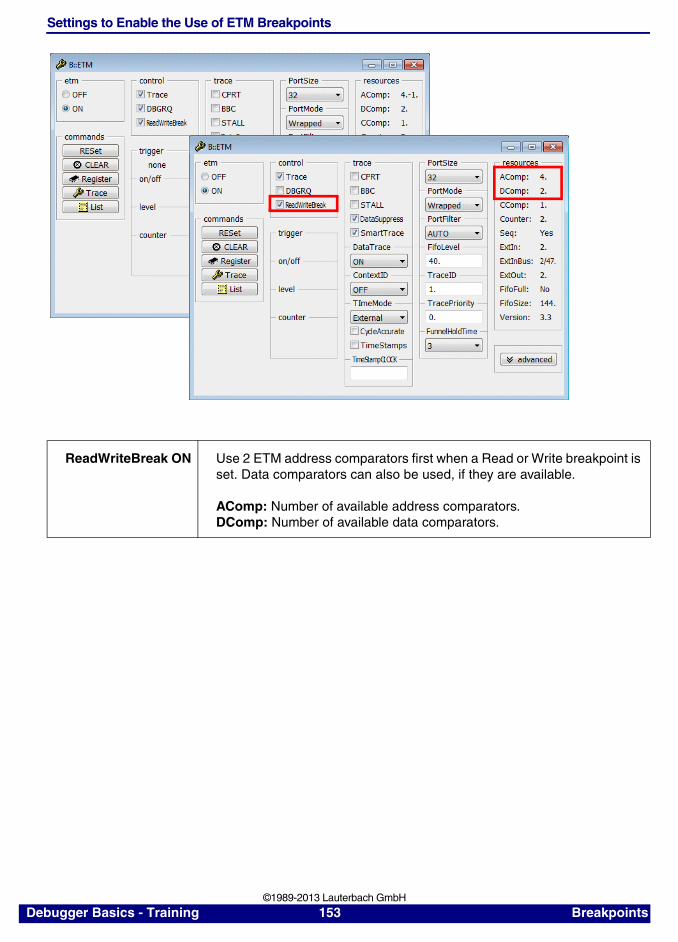
Settings to Enable the Use of ETM Breakpoints
ReadWriteBreak ON Use 2 ETM address comparators first when a Read or Write breakpoint is set. Data comparators can also be used, if they are available.
AComp: Number of available address comparators.DComp: Number of available data comparators.
Debugger Basics - Training 153 Breakpoints ©1989-2013 Lauterbach GmbH
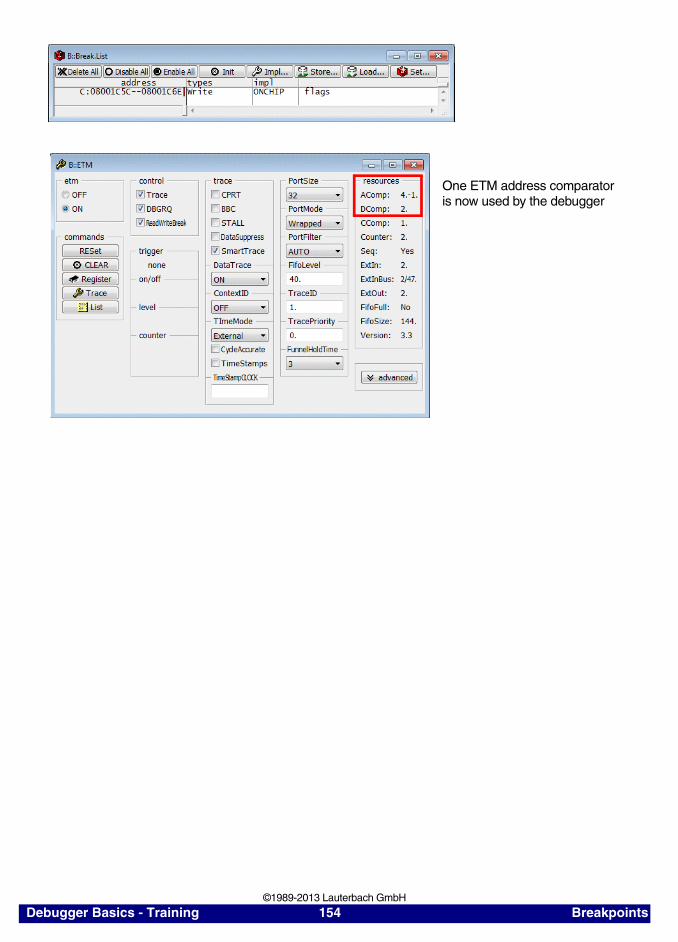
One ETM address comparatoris now used by the debugger
Debugger Basics - Training 154 Breakpoints ©1989-2013 Lauterbach GmbH
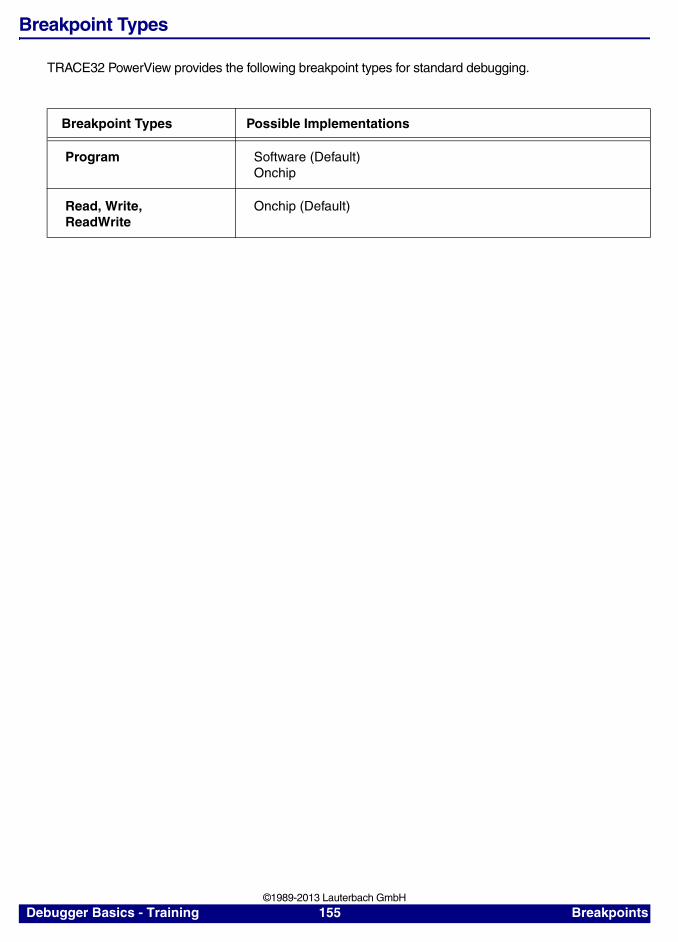
Breakpoint Types
TRACE32 PowerView provides the following breakpoint types for standard debugging.
Breakpoint Types Possible Implementations
Program Software (Default)Onchip
Read, Write, ReadWrite
Onchip (Default)
Debugger Basics - Training 155 Breakpoints ©1989-2013 Lauterbach GmbH
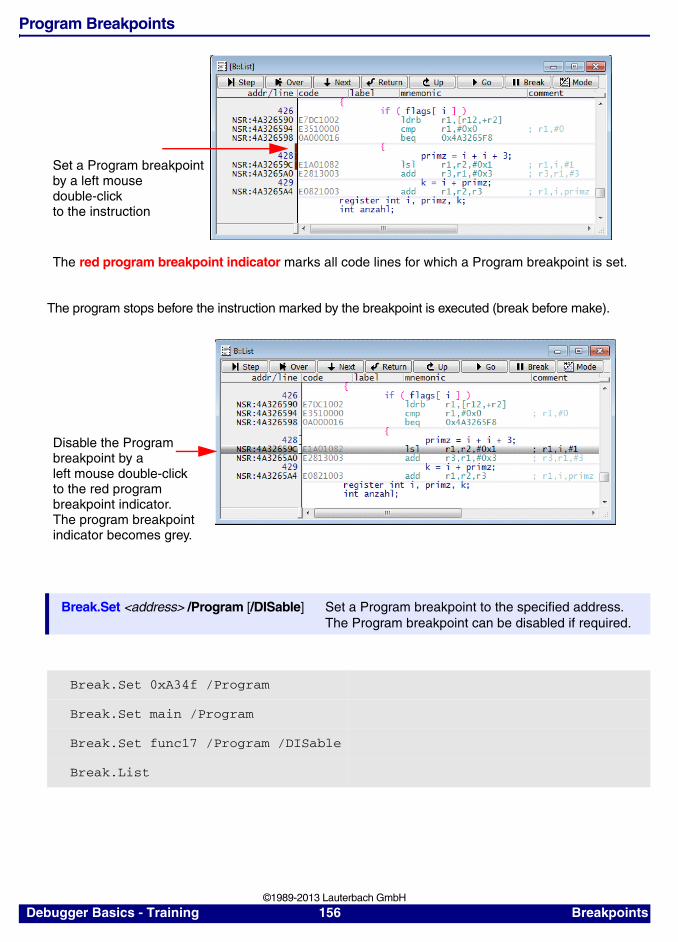
Program Breakpoints
The program stops before the instruction marked by the breakpoint is executed (break before make).
Break.Set <address> /Program [/DISable] Set a Program breakpoint to the specified address. The Program breakpoint can be disabled if required.
Break.Set 0xA34f /Program
Break.Set main /Program
Break.Set func17 /Program /DISable
Break.List
Set a Program breakpointby a left mouse double-clickto the instruction
The red program breakpoint indicator marks all code lines for which a Program breakpoint is set.
Disable the Programbreakpoint by a left mouse double-click to the red program breakpoint indicator.The program breakpointindicator becomes grey.
Debugger Basics - Training 156 Breakpoints ©1989-2013 Lauterbach GmbH
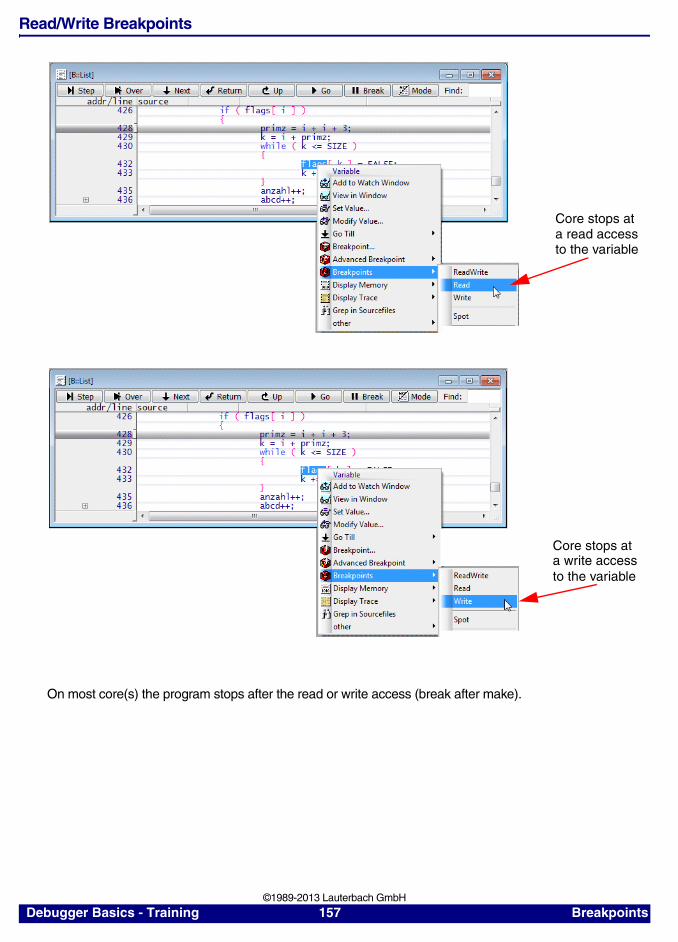
Read/Write Breakpoints
On most core(s) the program stops after the read or write access (break after make).
Core stops ata read accessto the variable
Core stops ata write accessto the variable
Debugger Basics - Training 157 Breakpoints ©1989-2013 Lauterbach GmbH
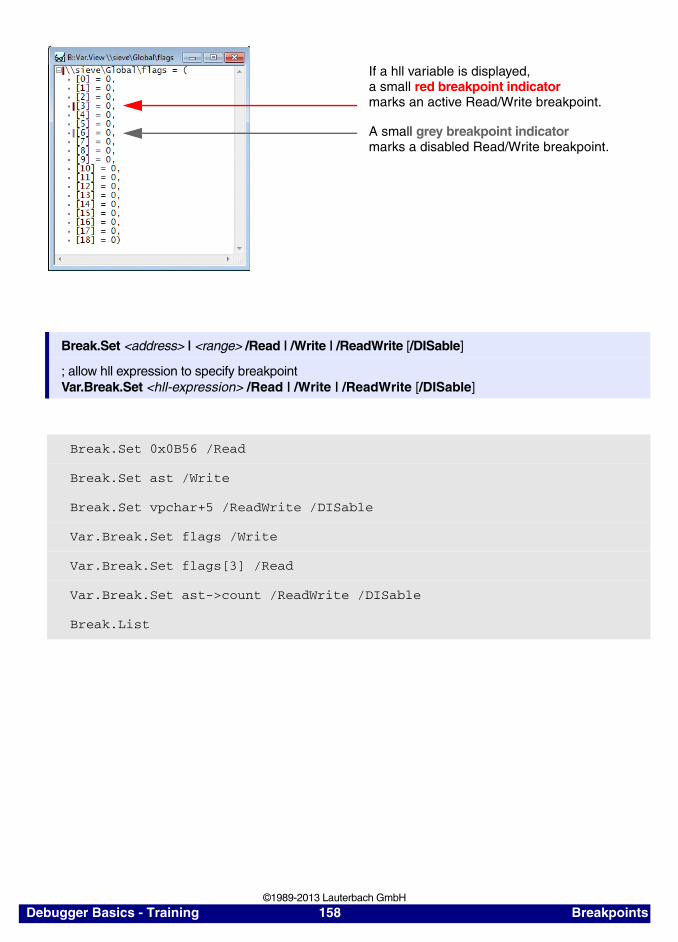
Break.Set <address> | <range> /Read | /Write | /ReadWrite [/DISable]
; allow hll expression to specify breakpointVar.Break.Set <hll-expression> /Read | /Write | /ReadWrite [/DISable]
Break.Set 0x0B56 /Read
Break.Set ast /Write
Break.Set vpchar+5 /ReadWrite /DISable
Var.Break.Set flags /Write
Var.Break.Set flags[3] /Read
Var.Break.Set ast->count /ReadWrite /DISable
Break.List
If a hll variable is displayed, a small red breakpoint indicator
A small grey breakpoint indicator
marks an active Read/Write breakpoint.
marks a disabled Read/Write breakpoint.
Debugger Basics - Training 158 Breakpoints ©1989-2013 Lauterbach GmbH

Breakpoint Handling
Breakpoint Setting at Run-time
Software breakpoints
• If MemAccess is CPU/NEXUS/DAP or CPUAccess is Enable, Software breakpoints can be set while the core(s) is executing the program. If the breakpoint is set via CPUAccess the realtime behavior is influenced.
• If MemAccess and CPUAccess is Denied Software breakpoints can only be set when the program execution is stopped.
The behavior of Onchip breakpoints is core dependent. E.g. on all ARM/Cortex cores Onchip breakpoints can be set while the program execution is running.
Debugger Basics - Training 159 Breakpoint Handling ©1989-2013 Lauterbach GmbH
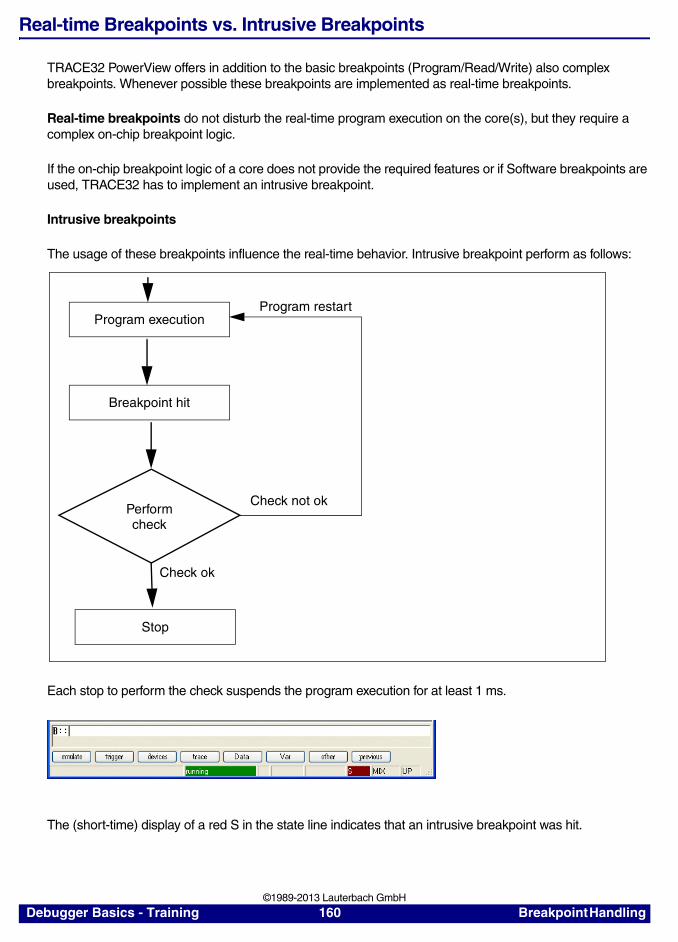
Real-time Breakpoints vs. Intrusive Breakpoints
TRACE32 PowerView offers in addition to the basic breakpoints (Program/Read/Write) also complex breakpoints. Whenever possible these breakpoints are implemented as real-time breakpoints.
Real-time breakpoints do not disturb the real-time program execution on the core(s), but they require a complex on-chip breakpoint logic.
If the on-chip breakpoint logic of a core does not provide the required features or if Software breakpoints are used, TRACE32 has to implement an intrusive breakpoint.
Intrusive breakpoints
The usage of these breakpoints influence the real-time behavior. Intrusive breakpoint perform as follows:
Each stop to perform the check suspends the program execution for at least 1 ms.
The (short-time) display of a red S in the state line indicates that an intrusive breakpoint was hit.
Perform check
Check not ok
Check ok
Program execution
Breakpoint hit
Stop
Program restart
Debugger Basics - Training 160 Breakpoint Handling ©1989-2013 Lauterbach GmbH
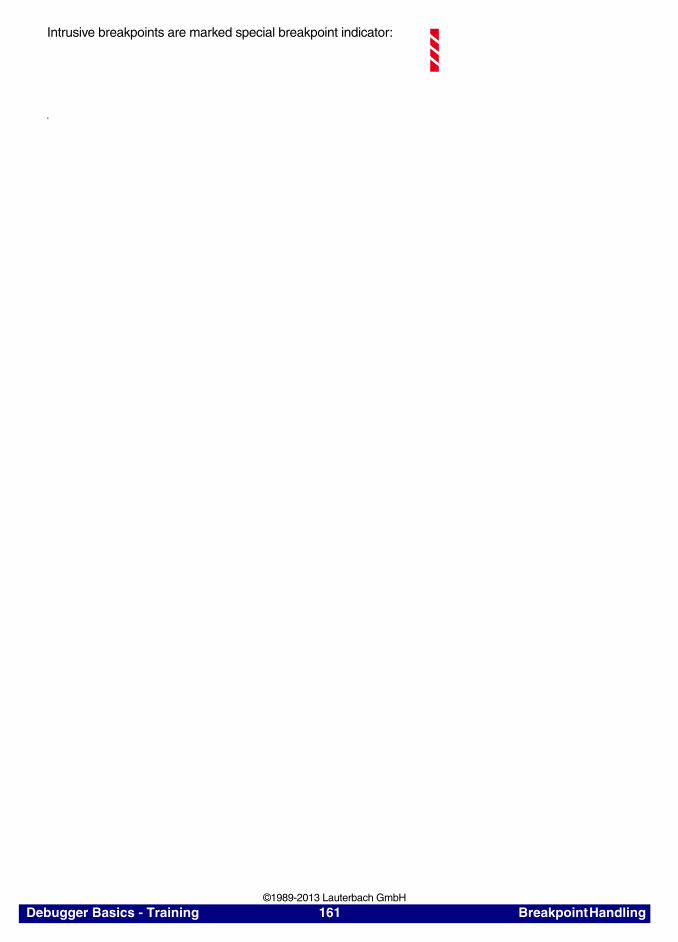
Intrusive breakpoints are marked special breakpoint indicator:
E
Debugger Basics - Training 161 Breakpoint Handling ©1989-2013 Lauterbach GmbH
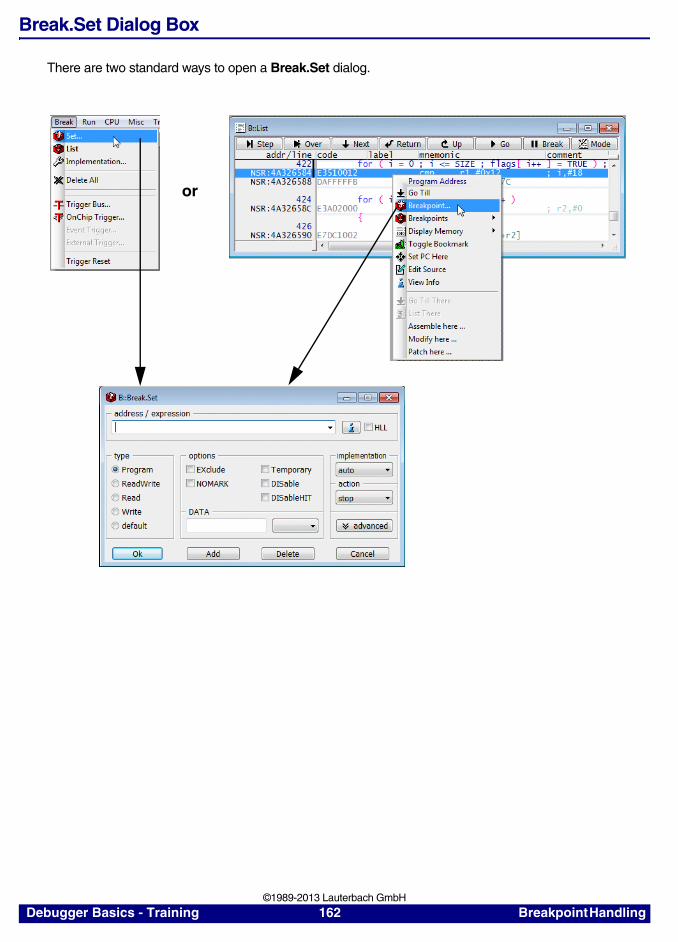
Break.Set Dialog Box
There are two standard ways to open a Break.Set dialog.
or
Debugger Basics - Training 162 Breakpoint Handling ©1989-2013 Lauterbach GmbH
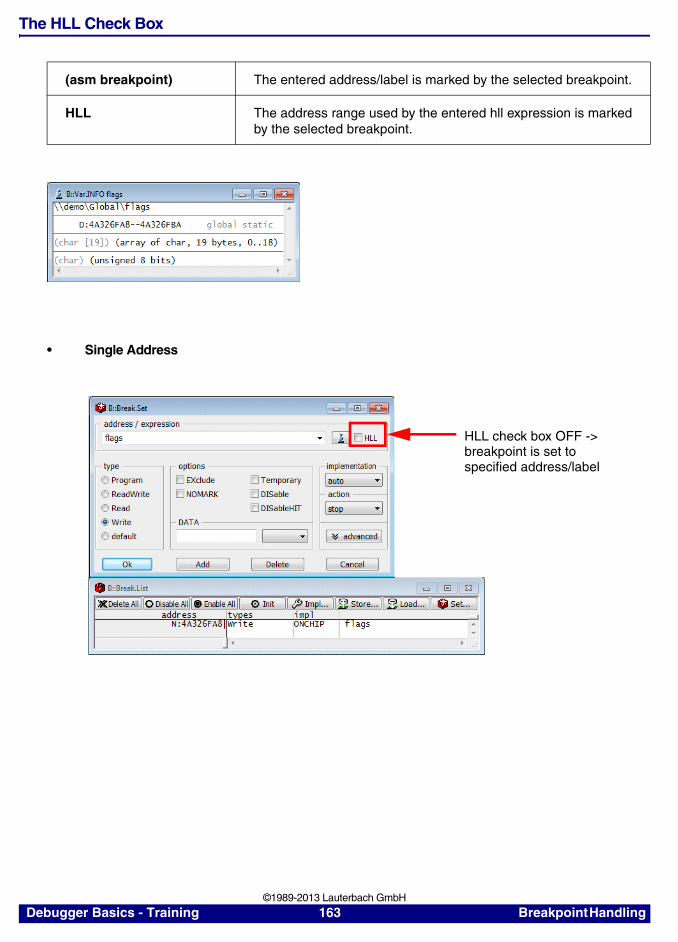
The HLL Check Box
• Single Address
(asm breakpoint) The entered address/label is marked by the selected breakpoint.
HLL The address range used by the entered hll expression is marked by the selected breakpoint.
HLL check box OFF ->breakpoint is set tospecified address/label
Debugger Basics - Training 163 Breakpoint Handling ©1989-2013 Lauterbach GmbH
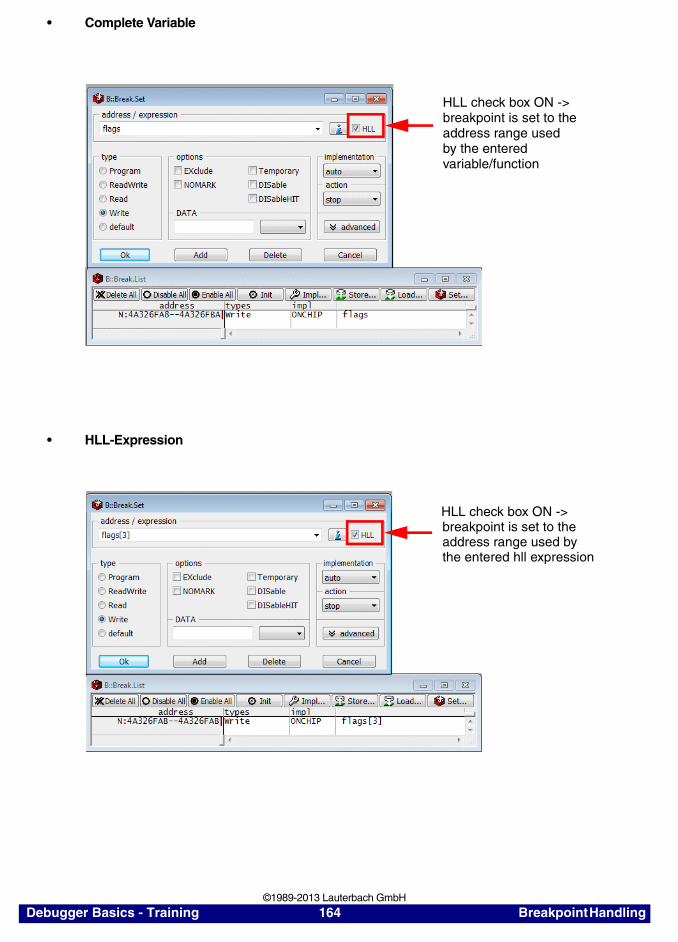
• Complete Variable
• HLL-Expression
HLL check box ON ->breakpoint is set to theaddress range usedby the enteredvariable/function
HLL check box ON ->breakpoint is set to theaddress range used bythe entered hll expression
Debugger Basics - Training 164 Breakpoint Handling ©1989-2013 Lauterbach GmbH
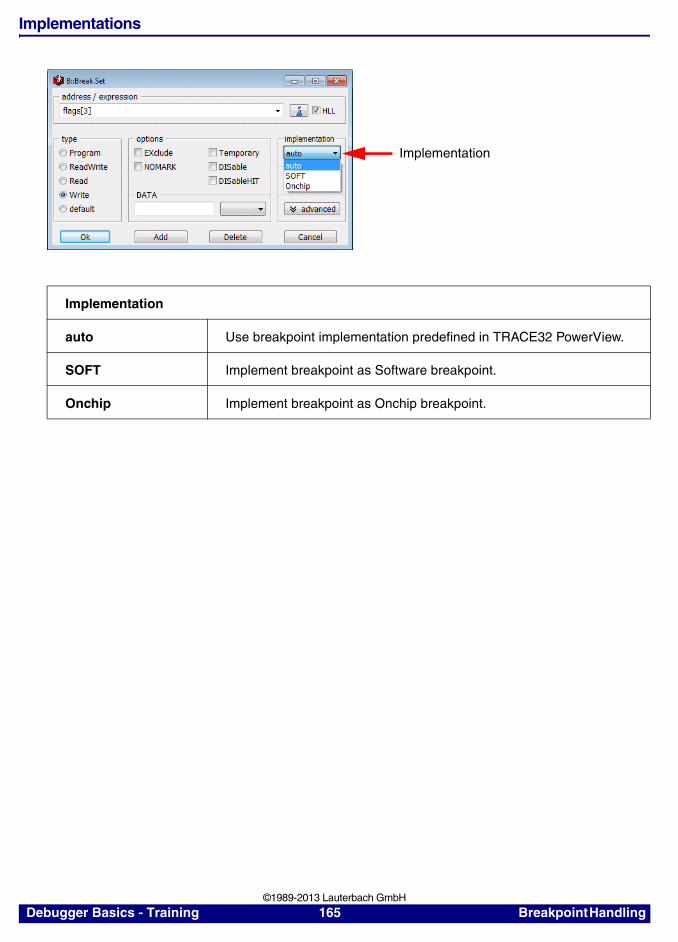
Implementations
Implementation
auto Use breakpoint implementation predefined in TRACE32 PowerView.
SOFT Implement breakpoint as Software breakpoint.
Onchip Implement breakpoint as Onchip breakpoint.
Implementation
Debugger Basics - Training 165 Breakpoint Handling ©1989-2013 Lauterbach GmbH

Actions
By default the program execution is stopped when a breakpoint is hit (action stop). TRACE32 PowerView provides the following additional reactions on a breakpoint hit:
Alpha, Beta, Charly, Delta and Echo breakpoint are only used in very special cases. For this reason no description is given in the general part of the training material.
Action (debugger)
Spot The program execution is stopped shortly at a breakpoint hit to update the screen. As soon as the screen is updated, the program execution continues.
Alpha Set an Alpha breakpoint.
Beta Set a Beta breakpoint.
Charly Set a Charly breakpoint.
Delta Set a Delta breakpoint.
Echo Set an Echo breakpoint.
WATCH Trigger the debug pin at the specified event (not available for all processor architectures).
Debugger Basics - Training 166 Breakpoint Handling ©1989-2013 Lauterbach GmbH
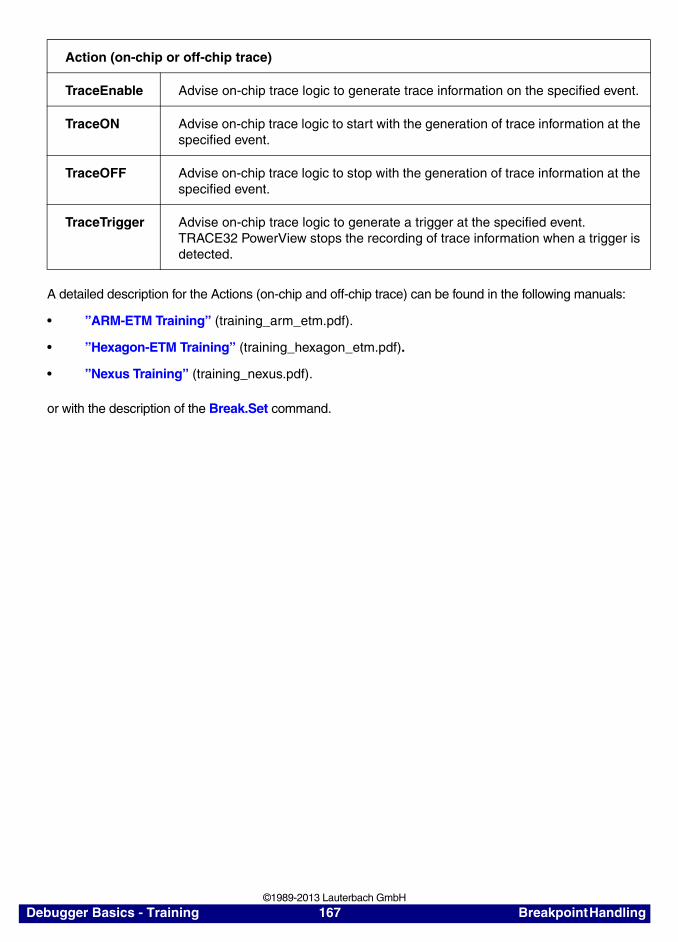
A detailed description for the Actions (on-chip and off-chip trace) can be found in the following manuals:
• ”ARM-ETM Training” (training_arm_etm.pdf).
• ”Hexagon-ETM Training” (training_hexagon_etm.pdf).
• ”Nexus Training” (training_nexus.pdf).
or with the description of the Break.Set command.
Action (on-chip or off-chip trace)
TraceEnable Advise on-chip trace logic to generate trace information on the specified event.
TraceON Advise on-chip trace logic to start with the generation of trace information at the specified event.
TraceOFF Advise on-chip trace logic to stop with the generation of trace information at the specified event.
TraceTrigger Advise on-chip trace logic to generate a trigger at the specified event. TRACE32 PowerView stops the recording of trace information when a trigger is detected.
Debugger Basics - Training 167 Breakpoint Handling ©1989-2013 Lauterbach GmbH
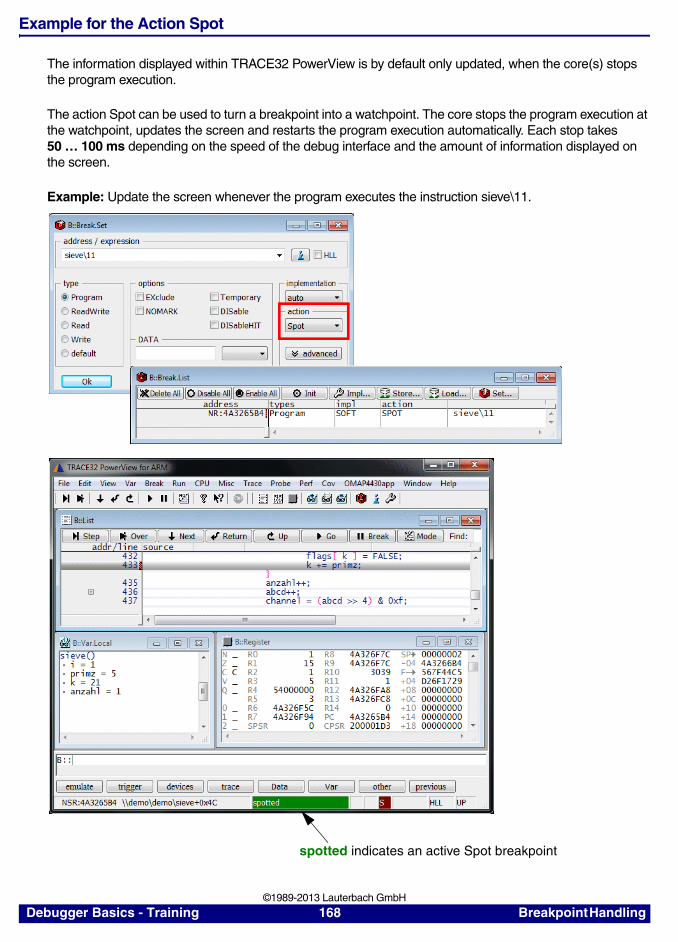
Example for the Action Spot
The information displayed within TRACE32 PowerView is by default only updated, when the core(s) stops the program execution.
The action Spot can be used to turn a breakpoint into a watchpoint. The core stops the program execution at the watchpoint, updates the screen and restarts the program execution automatically. Each stop takes 50 … 100 ms depending on the speed of the debug interface and the amount of information displayed on the screen.
Example: Update the screen whenever the program executes the instruction sieve\11.
spotted indicates an active Spot breakpoint
Debugger Basics - Training 168 Breakpoint Handling ©1989-2013 Lauterbach GmbH
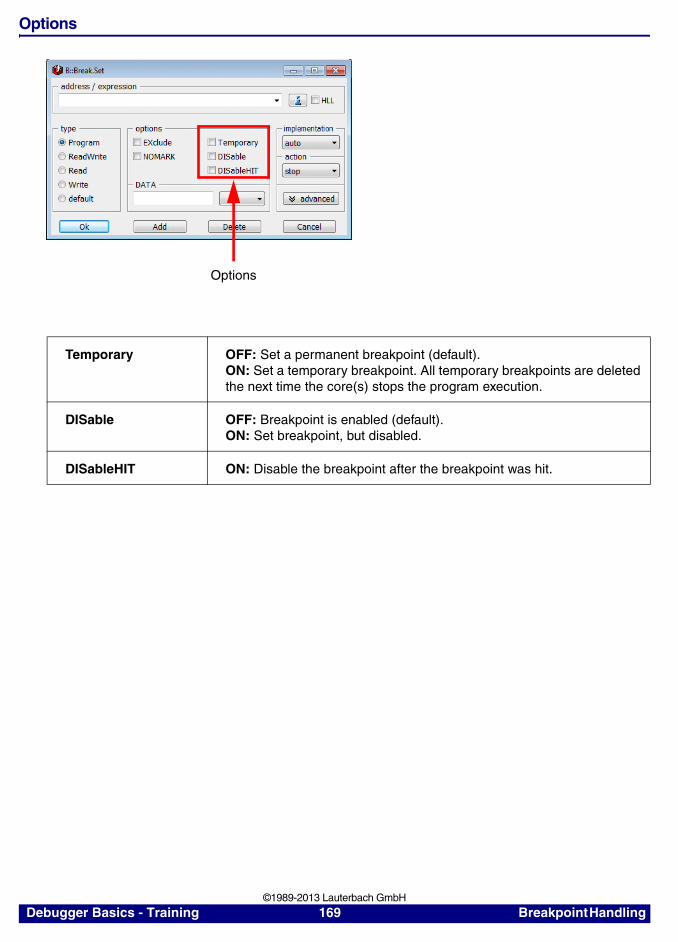
Options
Temporary OFF: Set a permanent breakpoint (default).ON: Set a temporary breakpoint. All temporary breakpoints are deleted the next time the core(s) stops the program execution.
DISable OFF: Breakpoint is enabled (default).ON: Set breakpoint, but disabled.
DISableHIT ON: Disable the breakpoint after the breakpoint was hit.
Options
Debugger Basics - Training 169 Breakpoint Handling ©1989-2013 Lauterbach GmbH
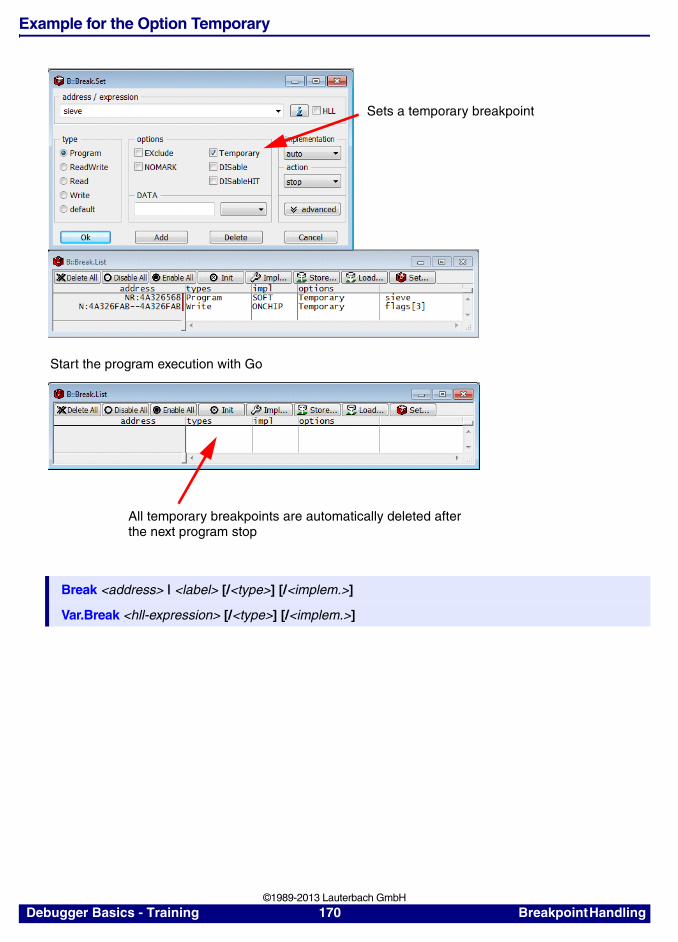
Example for the Option Temporary
Break <address> | <label> [/<type>] [/<implem.>]
Var.Break <hll-expression> [/<type>] [/<implem.>]
Sets a temporary breakpoint
All temporary breakpoints are automatically deleted after the next program stop
Start the program execution with Go
Debugger Basics - Training 170 Breakpoint Handling ©1989-2013 Lauterbach GmbH
DATA Breakpoints
The DATA field offers the possibility to combine a Read/Write breakpoint with a specific data value.
Data breakpoints are implemented as real-time breakpoints if the core supports Data Value Breakpoints (for details on your core refer to page 139). Otherwise an intrusive breakpoint is used (for details on the intrusive DATA breakpoints refer to page 160)
Debugger Basics - Training 171 Breakpoint Handling ©1989-2013 Lauterbach GmbH
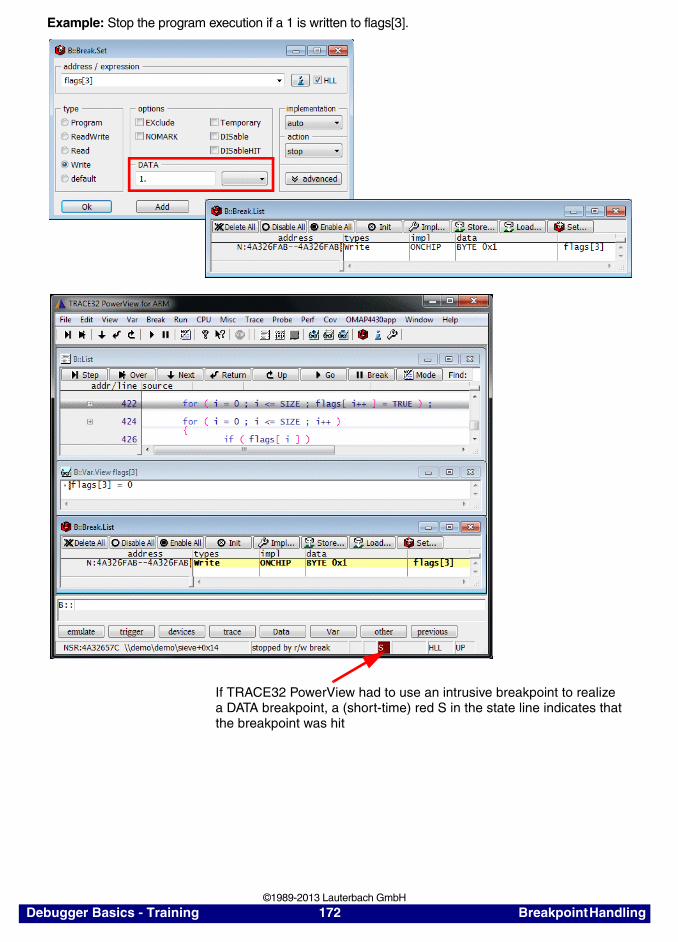
Example: Stop the program execution if a 1 is written to flags[3].
If TRACE32 PowerView had to use an intrusive breakpoint to realize a DATA breakpoint, a (short-time) red S in the state line indicates thatthe breakpoint was hit
Debugger Basics - Training 172 Breakpoint Handling ©1989-2013 Lauterbach GmbH
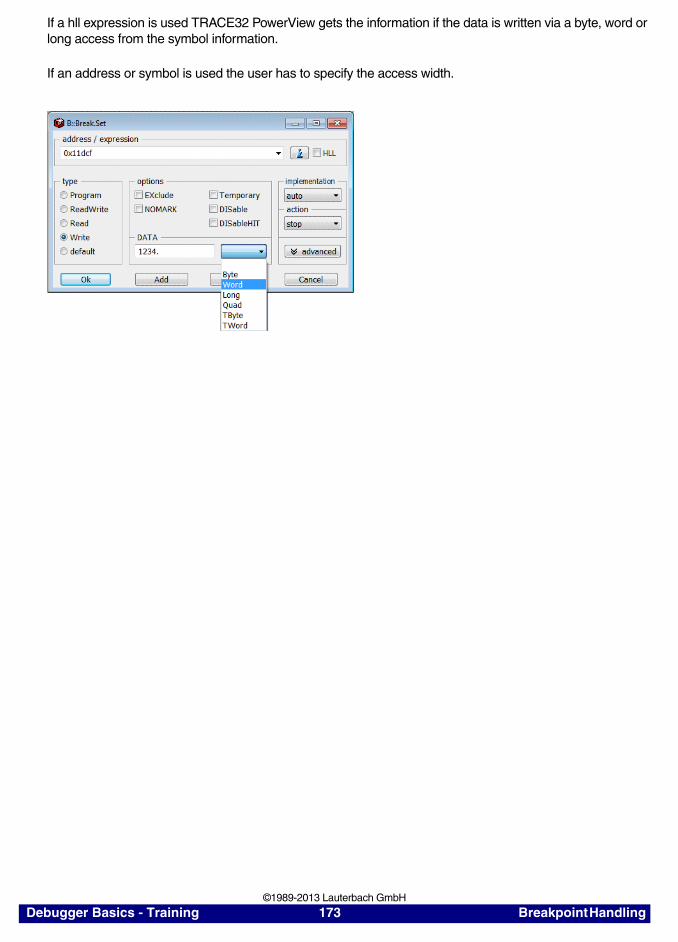
If a hll expression is used TRACE32 PowerView gets the information if the data is written via a byte, word or long access from the symbol information.
If an address or symbol is used the user has to specify the access width.
Debugger Basics - Training 173 Breakpoint Handling ©1989-2013 Lauterbach GmbH
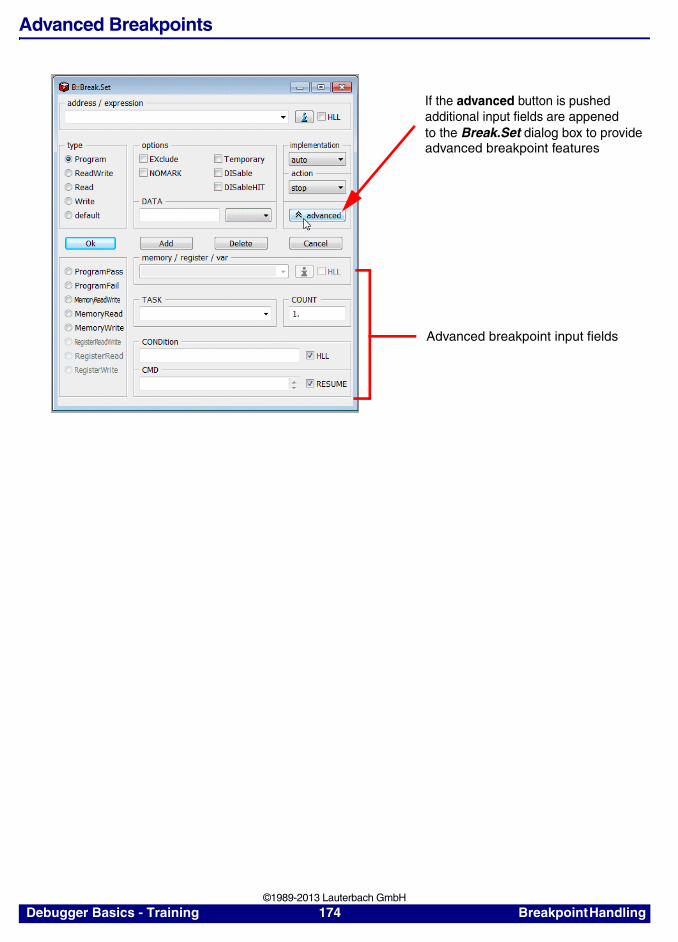
Advanced Breakpoints
If the advanced button is pushed
to the Break.Set dialog box to provideadvanced breakpoint features
Advanced breakpoint input fields
additional input fields are appened
Debugger Basics - Training 174 Breakpoint Handling ©1989-2013 Lauterbach GmbH
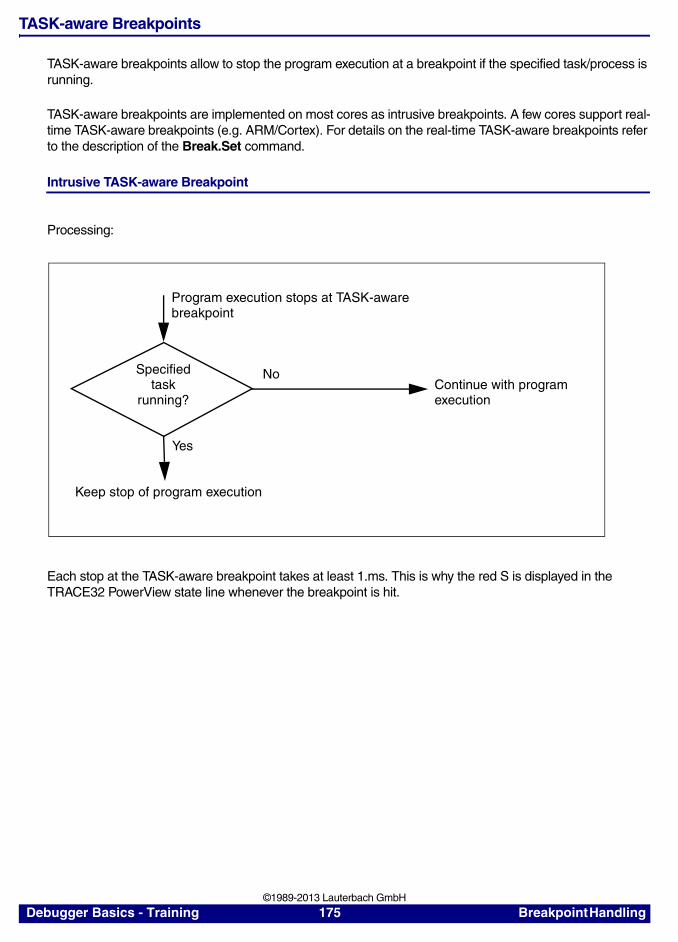
TASK-aware Breakpoints
TASK-aware breakpoints allow to stop the program execution at a breakpoint if the specified task/process is running.
TASK-aware breakpoints are implemented on most cores as intrusive breakpoints. A few cores support real-time TASK-aware breakpoints (e.g. ARM/Cortex). For details on the real-time TASK-aware breakpoints refer to the description of the Break.Set command.
Intrusive TASK-aware Breakpoint
Processing:
Each stop at the TASK-aware breakpoint takes at least 1.ms. This is why the red S is displayed in the TRACE32 PowerView state line whenever the breakpoint is hit.
Program execution stops at TASK-awarebreakpoint
NoContinue with programexecution
Keep stop of program execution
Yes
Specifiedtask
running?
Debugger Basics - Training 175 Breakpoint Handling ©1989-2013 Lauterbach GmbH
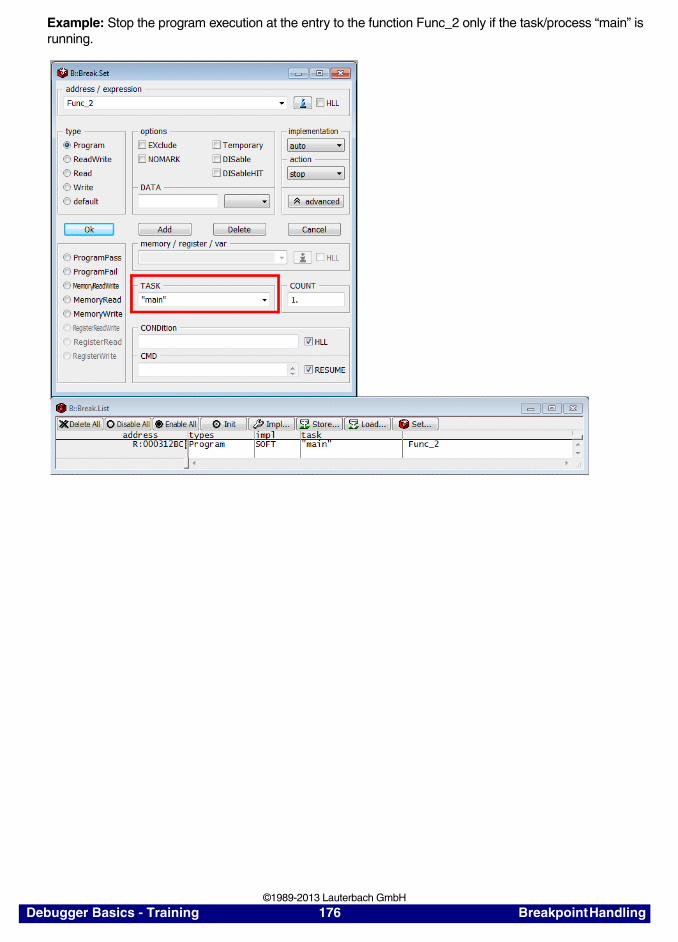
Example: Stop the program execution at the entry to the function Func_2 only if the task/process “main” is running.
Debugger Basics - Training 176 Breakpoint Handling ©1989-2013 Lauterbach GmbH
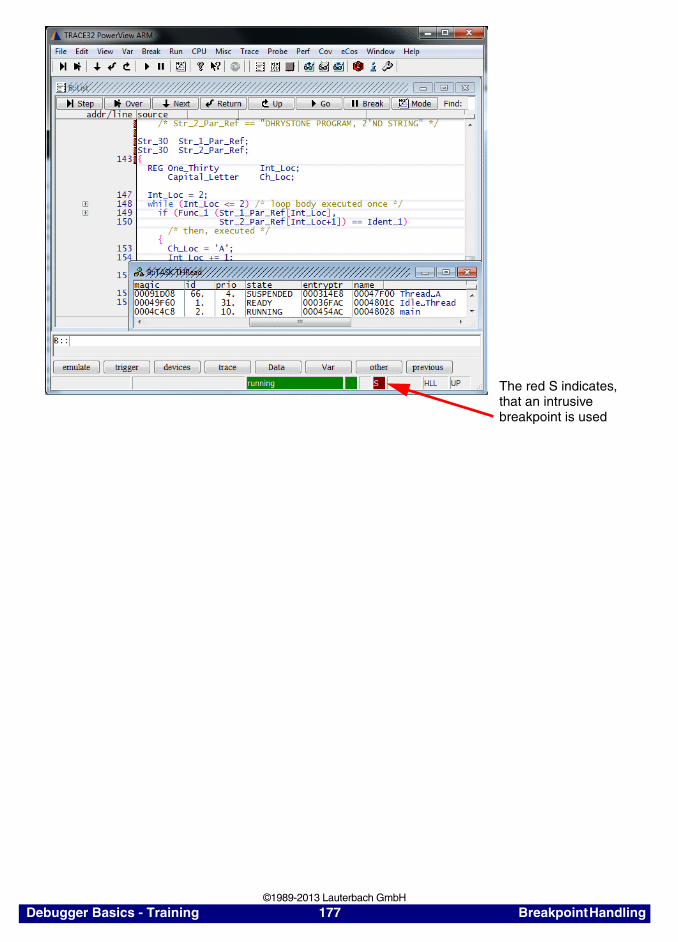
The red S indicates,that an intrusive breakpoint is used
Debugger Basics - Training 177 Breakpoint Handling ©1989-2013 Lauterbach GmbH
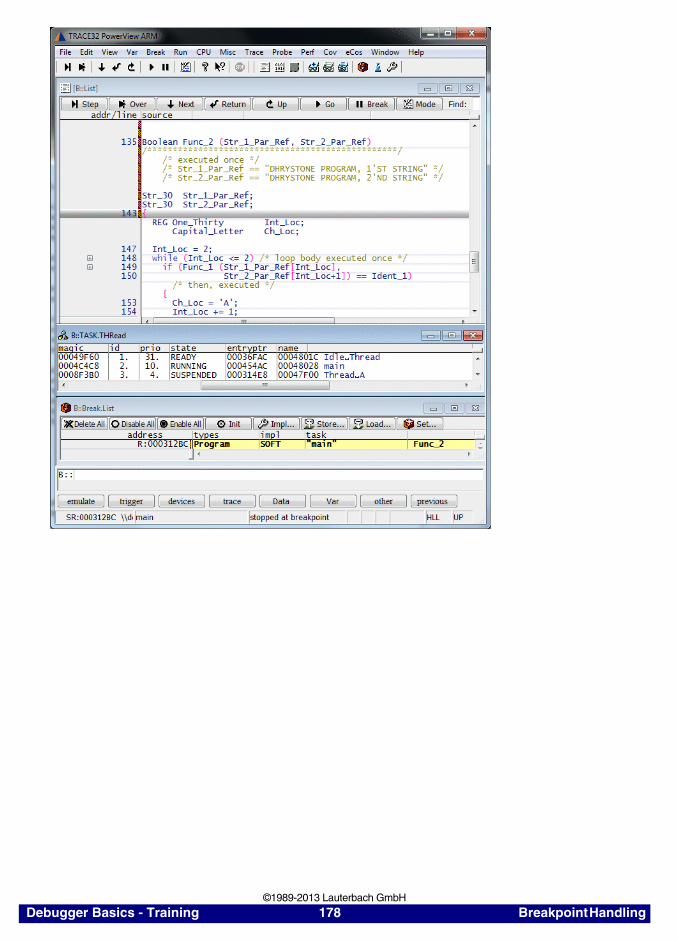
Debugger Basics - Training 178 Breakpoint Handling ©1989-2013 Lauterbach GmbH
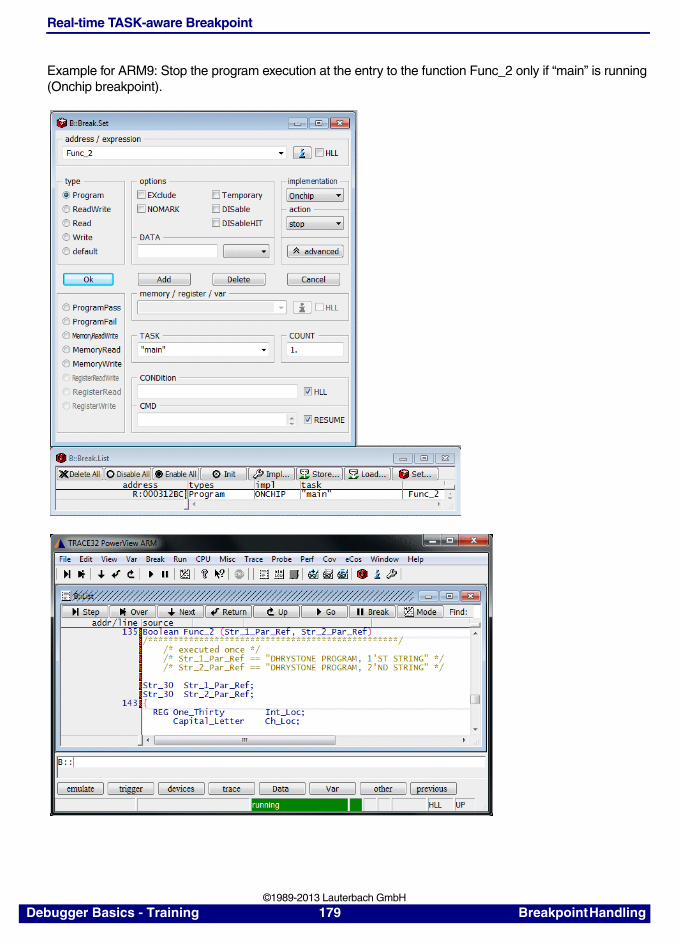
Real-time TASK-aware Breakpoint
Example for ARM9: Stop the program execution at the entry to the function Func_2 only if “main” is running (Onchip breakpoint).
Debugger Basics - Training 179 Breakpoint Handling ©1989-2013 Lauterbach GmbH
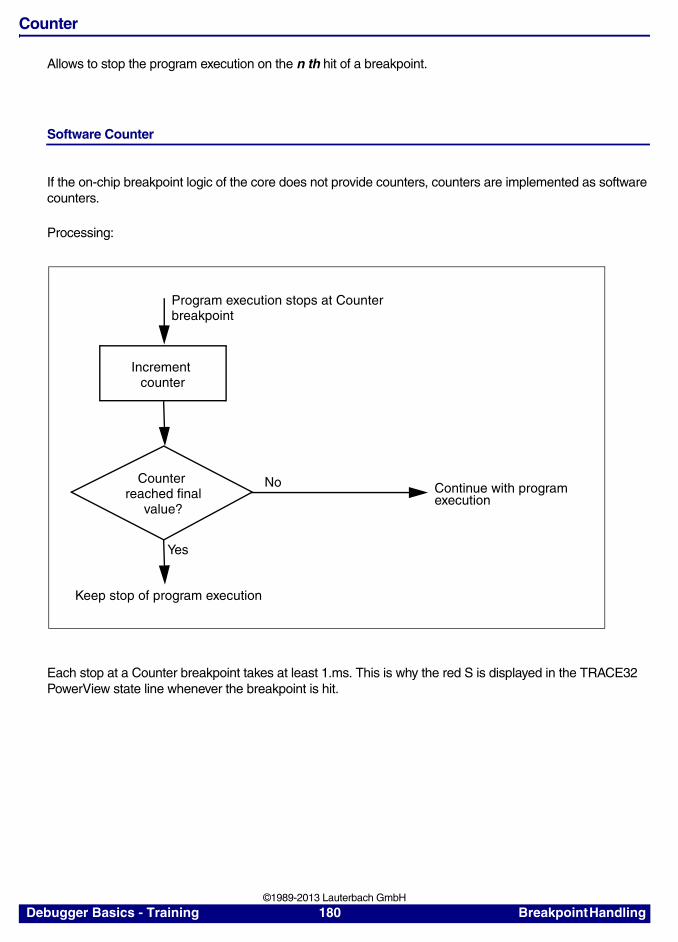
Counter
Allows to stop the program execution on the n th hit of a breakpoint.
Software Counter
If the on-chip breakpoint logic of the core does not provide counters, counters are implemented as software counters.
Processing:
Each stop at a Counter breakpoint takes at least 1.ms. This is why the red S is displayed in the TRACE32 PowerView state line whenever the breakpoint is hit.
Program execution stops at Counterbreakpoint
No Continue with programexecution
Keep stop of program execution
Yes
Counter reached final
value?
Increment counter
Debugger Basics - Training 180 Breakpoint Handling ©1989-2013 Lauterbach GmbH
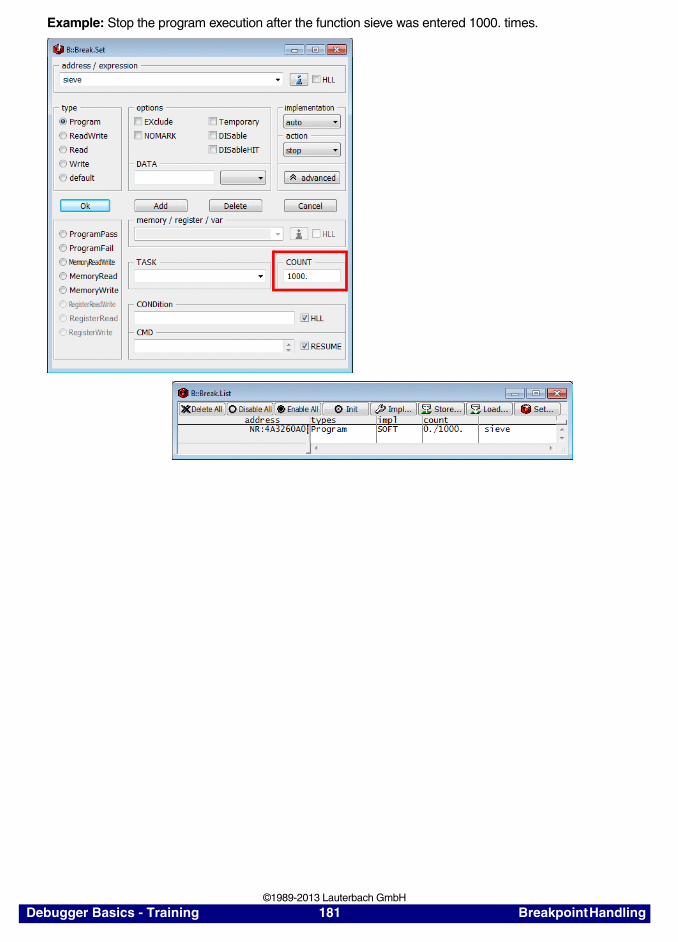
Example: Stop the program execution after the function sieve was entered 1000. times.
Debugger Basics - Training 181 Breakpoint Handling ©1989-2013 Lauterbach GmbH
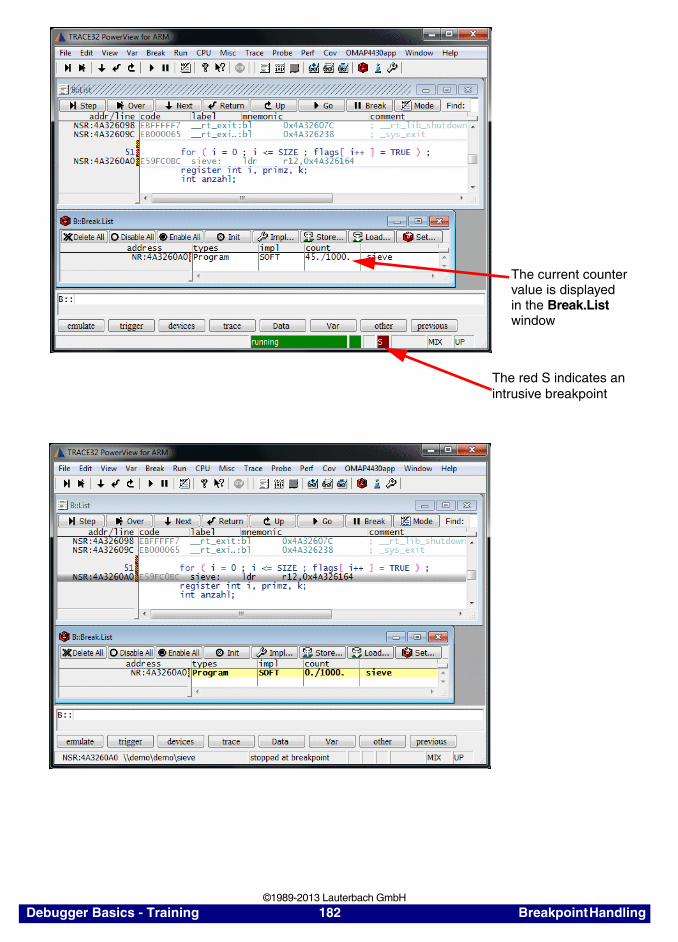
The red S indicates an intrusive breakpoint
The current countervalue is displayedin the Break.List window
Debugger Basics - Training 182 Breakpoint Handling ©1989-2013 Lauterbach GmbH
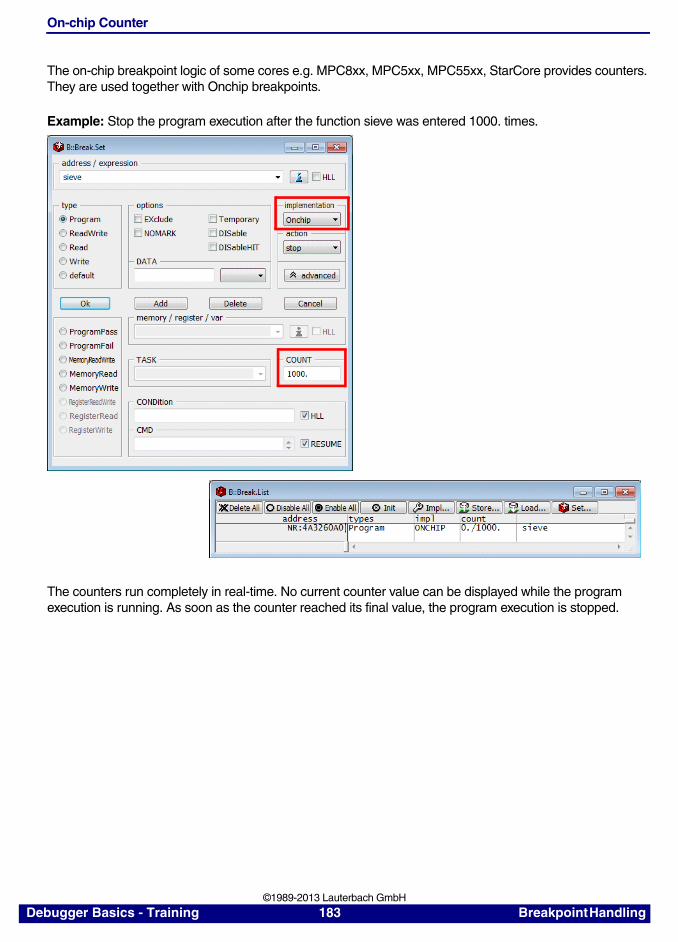
On-chip Counter
The on-chip breakpoint logic of some cores e.g. MPC8xx, MPC5xx, MPC55xx, StarCore provides counters. They are used together with Onchip breakpoints.
Example: Stop the program execution after the function sieve was entered 1000. times.
The counters run completely in real-time. No current counter value can be displayed while the program execution is running. As soon as the counter reached its final value, the program execution is stopped.
Debugger Basics - Training 183 Breakpoint Handling ©1989-2013 Lauterbach GmbH
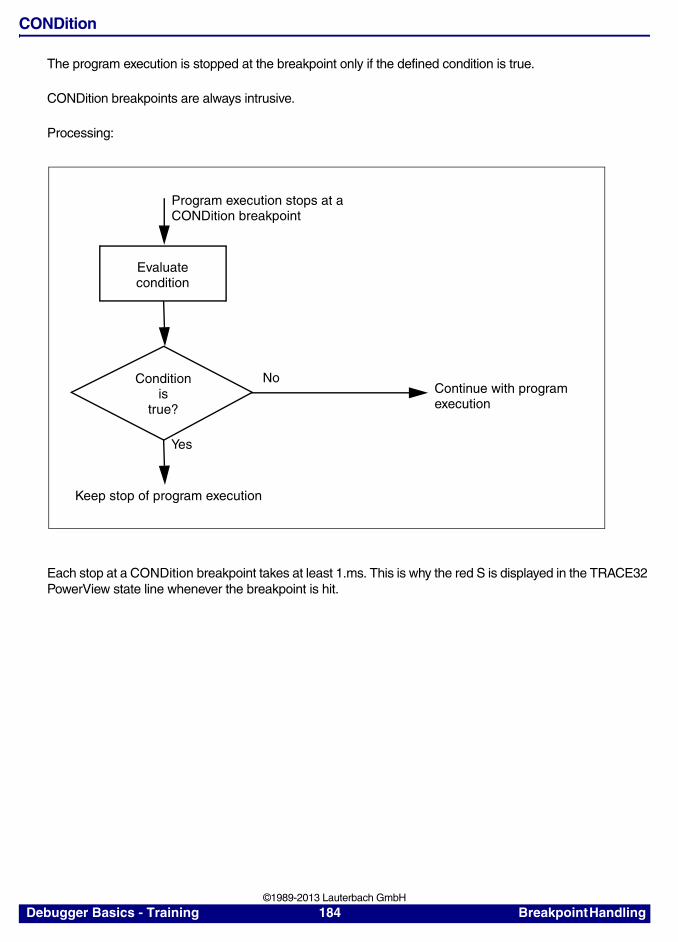
CONDition
The program execution is stopped at the breakpoint only if the defined condition is true.
CONDition breakpoints are always intrusive.
Processing:
Each stop at a CONDition breakpoint takes at least 1.ms. This is why the red S is displayed in the TRACE32 PowerView state line whenever the breakpoint is hit.
Program execution stops at a CONDition breakpoint
NoContinue with program
Keep stop of program execution
Yes
Conditionis
true?
Evaluatecondition
execution
Debugger Basics - Training 184 Breakpoint Handling ©1989-2013 Lauterbach GmbH
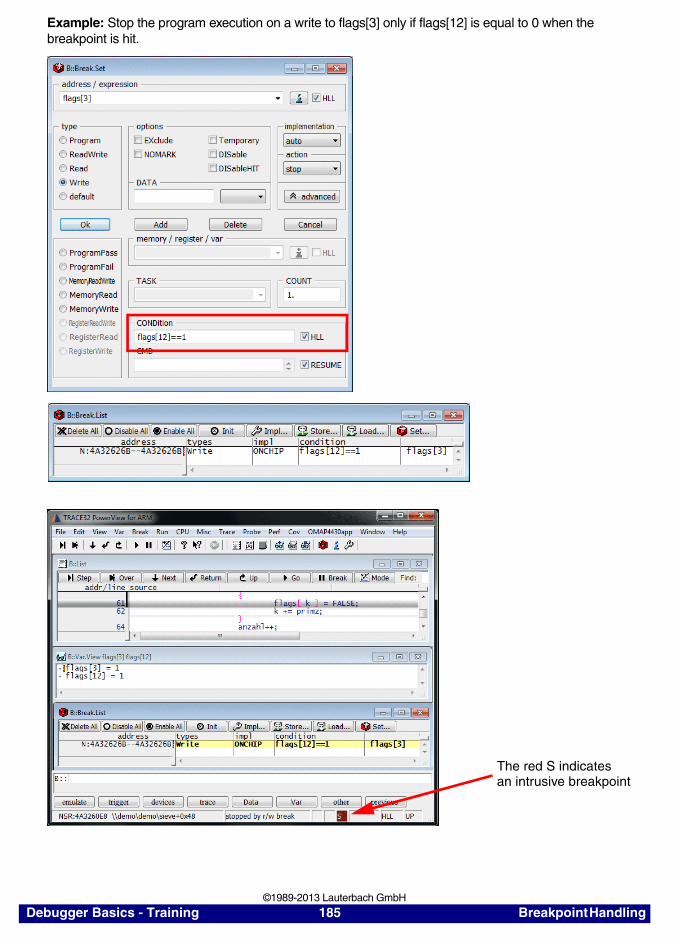
Example: Stop the program execution on a write to flags[3] only if flags[12] is equal to 0 when the breakpoint is hit.
The red S indicatesan intrusive breakpoint
Debugger Basics - Training 185 Breakpoint Handling ©1989-2013 Lauterbach GmbH
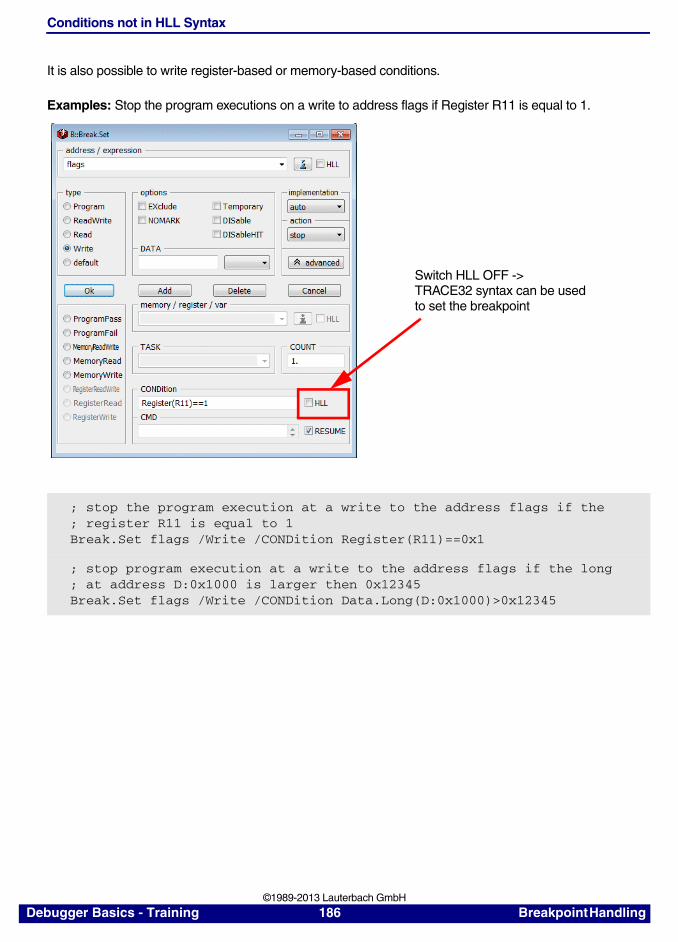
Conditions not in HLL Syntax
It is also possible to write register-based or memory-based conditions.
Examples: Stop the program executions on a write to address flags if Register R11 is equal to 1.
; stop the program execution at a write to the address flags if the; register R11 is equal to 1Break.Set flags /Write /CONDition Register(R11)==0x1
; stop program execution at a write to the address flags if the long; at address D:0x1000 is larger then 0x12345Break.Set flags /Write /CONDition Data.Long(D:0x1000)>0x12345
Switch HLL OFF ->TRACE32 syntax can be usedto set the breakpoint
Debugger Basics - Training 186 Breakpoint Handling ©1989-2013 Lauterbach GmbH
CMD
The field CMD allows to specify one or more commands that are executed when the breakpoint is hit.
Debugger Basics - Training 187 Breakpoint Handling ©1989-2013 Lauterbach GmbH
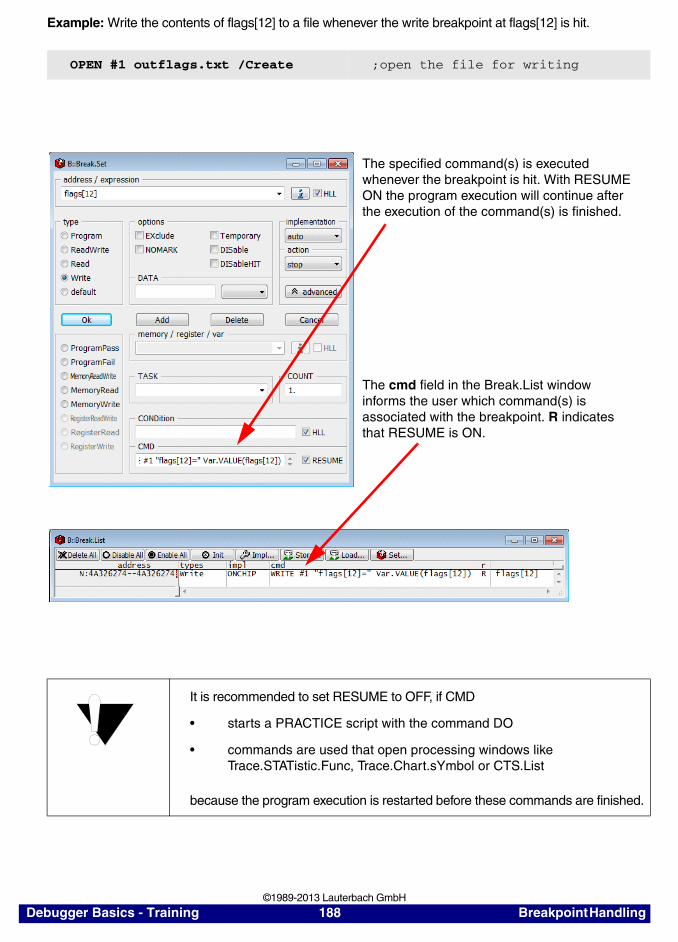
Example: Write the contents of flags[12] to a file whenever the write breakpoint at flags[12] is hit.
OPEN #1 outflags.txt /Create ;open the file for writing
It is recommended to set RESUME to OFF, if CMD
• starts a PRACTICE script with the command DO
• commands are used that open processing windows like Trace.STATistic.Func, Trace.Chart.sYmbol or CTS.List
because the program execution is restarted before these commands are finished.
The specified command(s) is executed whenever the breakpoint is hit. With RESUME ON the program execution will continue after the execution of the command(s) is finished.
The cmd field in the Break.List window informs the user which command(s) is associated with the breakpoint. R indicates that RESUME is ON.
Debugger Basics - Training 188 Breakpoint Handling ©1989-2013 Lauterbach GmbH
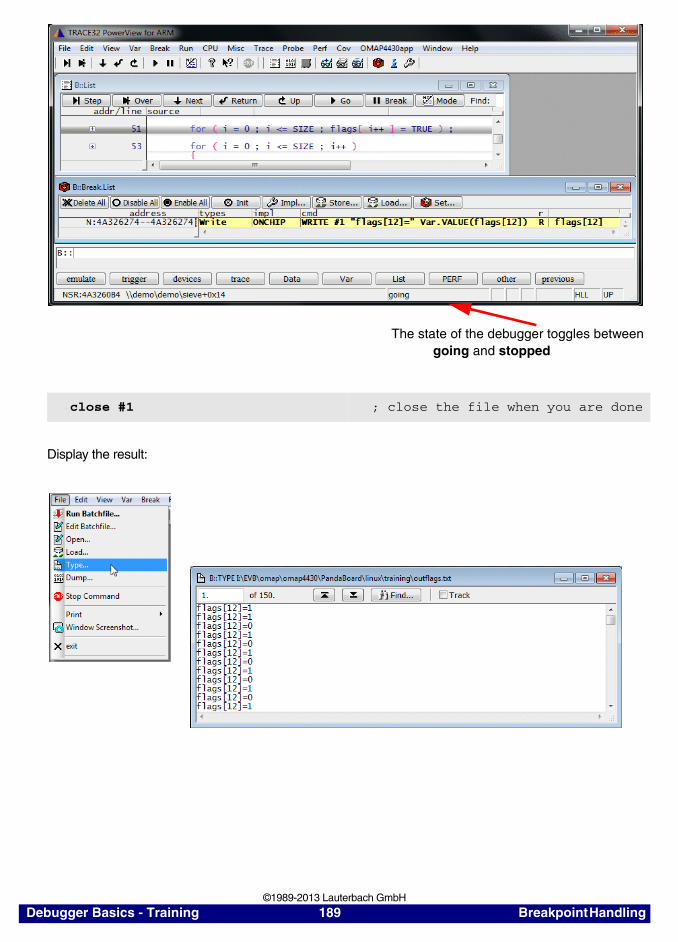
Display the result:
close #1 ; close the file when you are done
The state of the debugger toggles betweengoing and stopped
Debugger Basics - Training 189 Breakpoint Handling ©1989-2013 Lauterbach GmbH
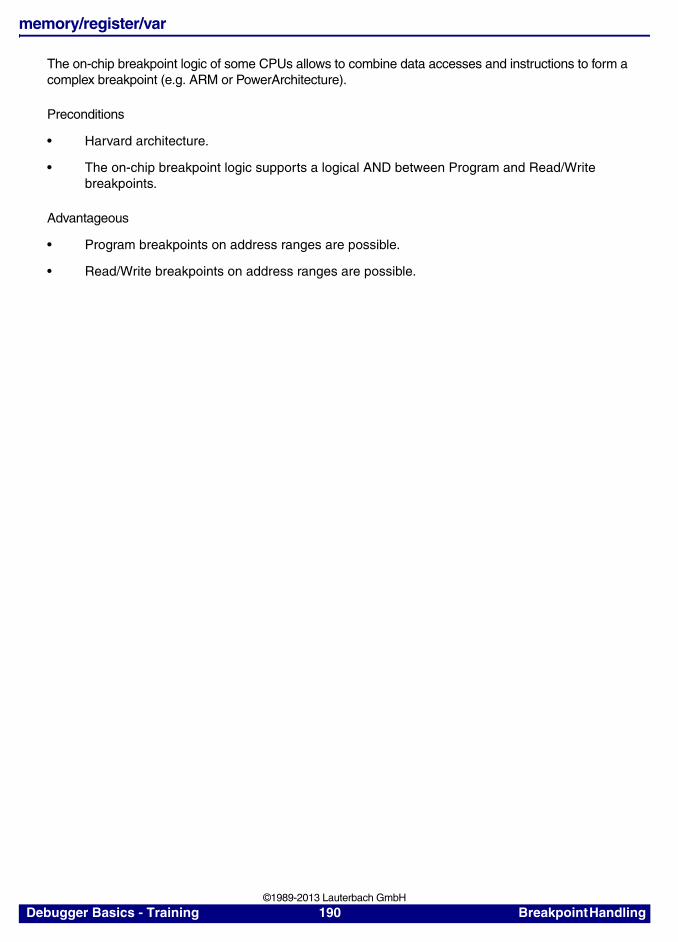
memory/register/var
The on-chip breakpoint logic of some CPUs allows to combine data accesses and instructions to form a complex breakpoint (e.g. ARM or PowerArchitecture).
Preconditions
• Harvard architecture.
• The on-chip breakpoint logic supports a logical AND between Program and Read/Write breakpoints.
Advantageous
• Program breakpoints on address ranges are possible.
• Read/Write breakpoints on address ranges are possible.
Debugger Basics - Training 190 Breakpoint Handling ©1989-2013 Lauterbach GmbH
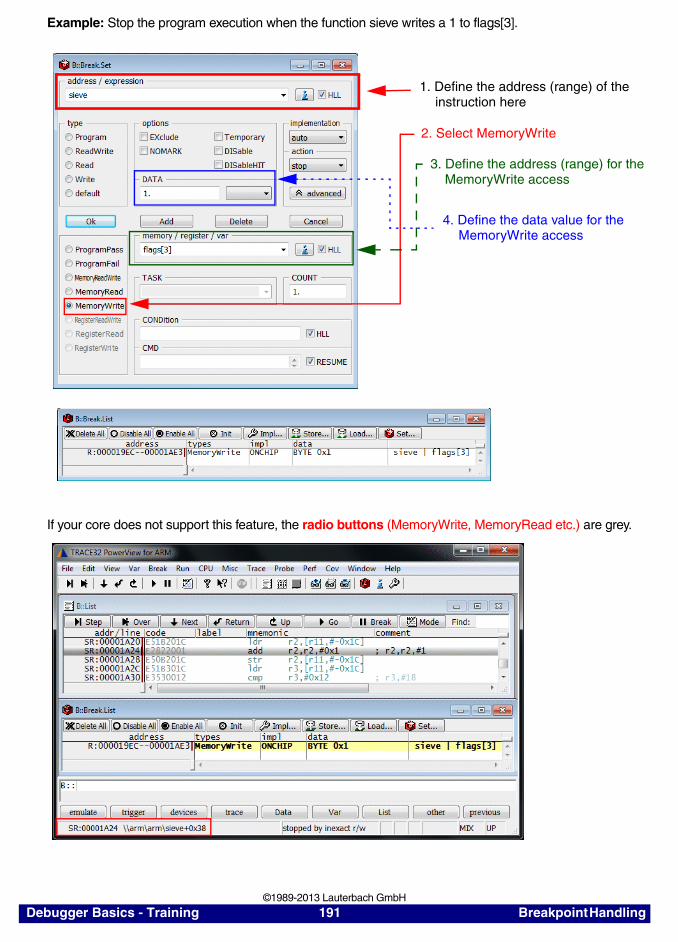
Example: Stop the program execution when the function sieve writes a 1 to flags[3].
If your core does not support this feature, the radio buttons (MemoryWrite, MemoryRead etc.) are grey.
1. Define the address (range) of theinstruction here
2. Select MemoryWrite
3. Define the address (range) for theMemoryWrite access
4. Define the data value for the MemoryWrite access
Debugger Basics - Training 191 Breakpoint Handling ©1989-2013 Lauterbach GmbH
Exclude (Advanced users only, not available on all cores)
The breakpoint is inverted.
• by the inverting logic of the on-chip breakpoint logic
• by setting the specified breakpoint type to the following 2 address ranges0x0--(start_of_breakpoint_range-1)(end_of_breakpoint_range+1)--end_of_memory
The EXclude option applies only to Onchip breakpoints.
If the on-chip breakpoint logic does not provide an inverting logic, the core has to provide the facility to set the specified breakpoint type on 2 address ranges.
Debugger Basics - Training 192 Breakpoint Handling ©1989-2013 Lauterbach GmbH
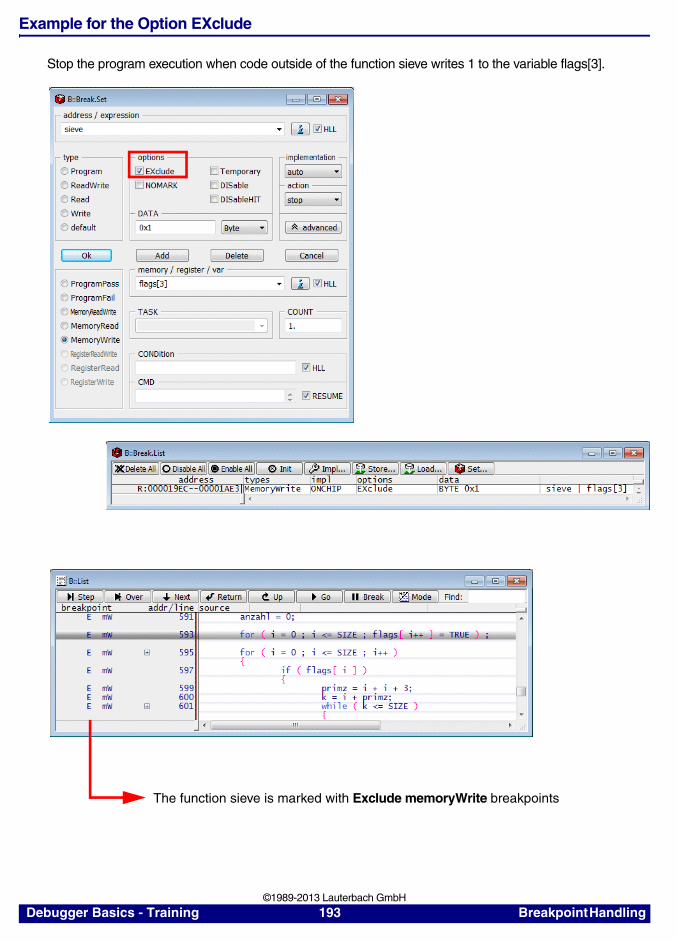
Example for the Option EXclude
Stop the program execution when code outside of the function sieve writes 1 to the variable flags[3].
The function sieve is marked with Exclude memoryWrite breakpoints
Debugger Basics - Training 193 Breakpoint Handling ©1989-2013 Lauterbach GmbH
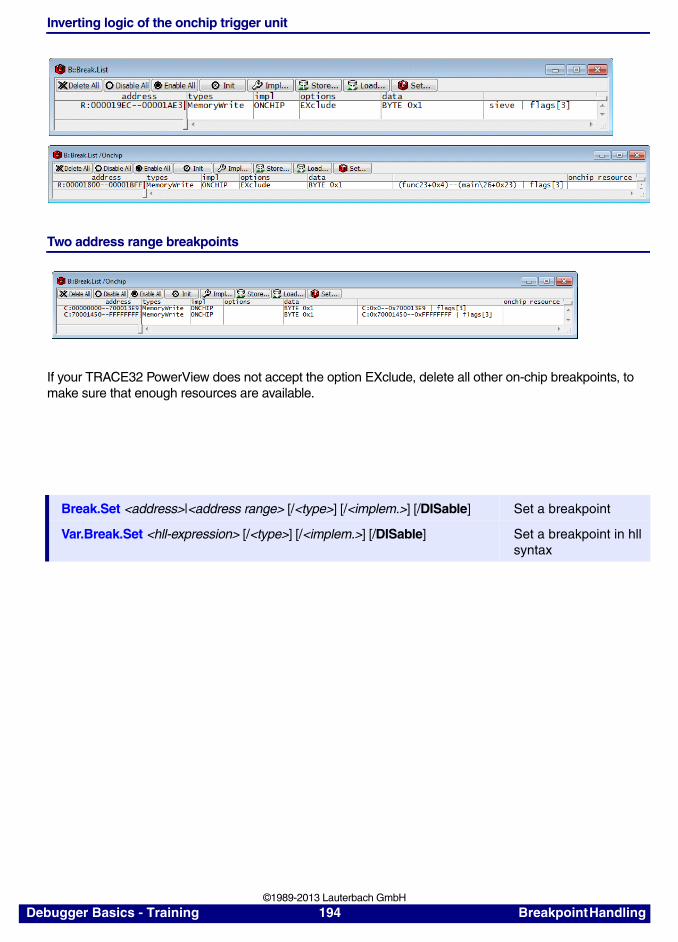
Inverting logic of the onchip trigger unit
Two address range breakpoints
If your TRACE32 PowerView does not accept the option EXclude, delete all other on-chip breakpoints, to make sure that enough resources are available.
Break.Set <address>|<address range> [/<type>] [/<implem.>] [/DISable] Set a breakpoint
Var.Break.Set <hll-expression> [/<type>] [/<implem.>] [/DISable] Set a breakpoint in hll syntax
Debugger Basics - Training 194 Breakpoint Handling ©1989-2013 Lauterbach GmbH
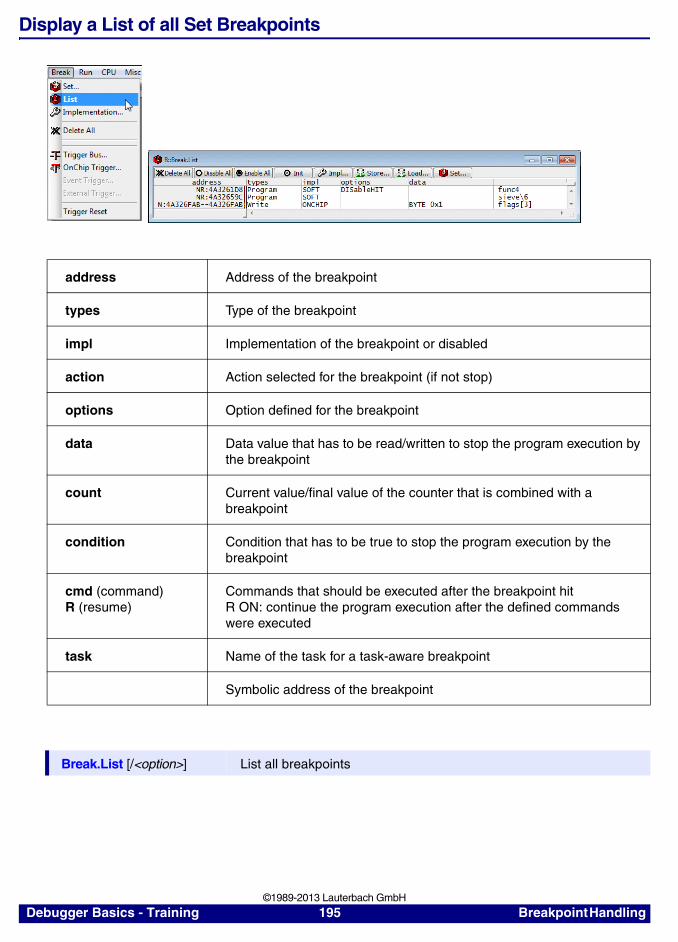
Display a List of all Set Breakpoints
address Address of the breakpoint
types Type of the breakpoint
impl Implementation of the breakpoint or disabled
action Action selected for the breakpoint (if not stop)
options Option defined for the breakpoint
data Data value that has to be read/written to stop the program execution by the breakpoint
count Current value/final value of the counter that is combined with a breakpoint
condition Condition that has to be true to stop the program execution by the breakpoint
cmd (command)R (resume)
Commands that should be executed after the breakpoint hitR ON: continue the program execution after the defined commands were executed
task Name of the task for a task-aware breakpoint
Symbolic address of the breakpoint
Break.List [/<option>] List all breakpoints
Debugger Basics - Training 195 Breakpoint Handling ©1989-2013 Lauterbach GmbH
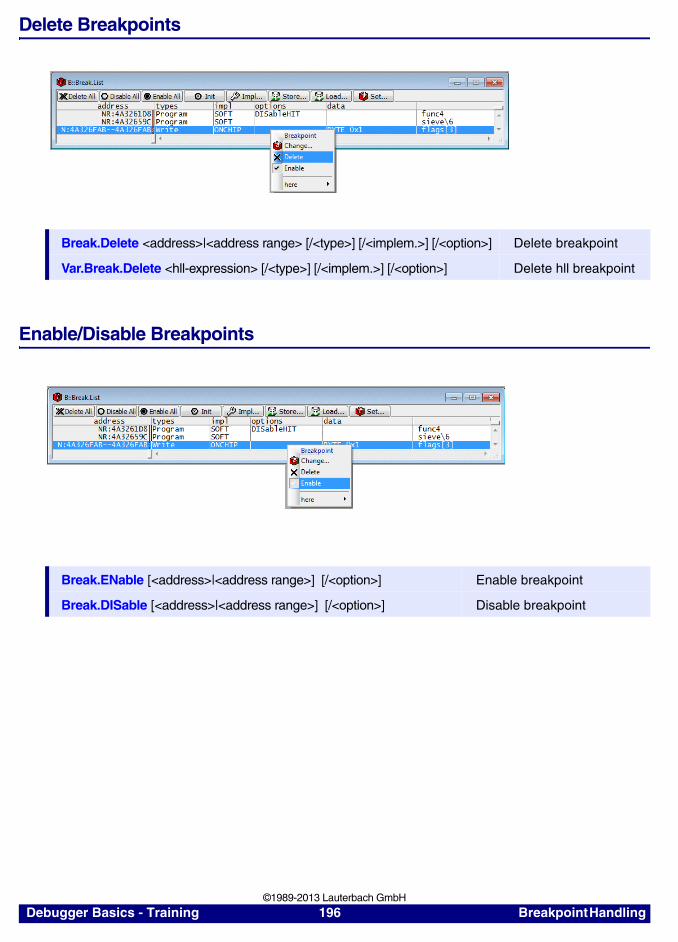
Delete Breakpoints
Enable/Disable Breakpoints
Break.Delete <address>|<address range> [/<type>] [/<implem.>] [/<option>] Delete breakpoint
Var.Break.Delete <hll-expression> [/<type>] [/<implem.>] [/<option>] Delete hll breakpoint
Break.ENable [<address>|<address range>] [/<option>] Enable breakpoint
Break.DISable [<address>|<address range>] [/<option>] Disable breakpoint
Debugger Basics - Training 196 Breakpoint Handling ©1989-2013 Lauterbach GmbH
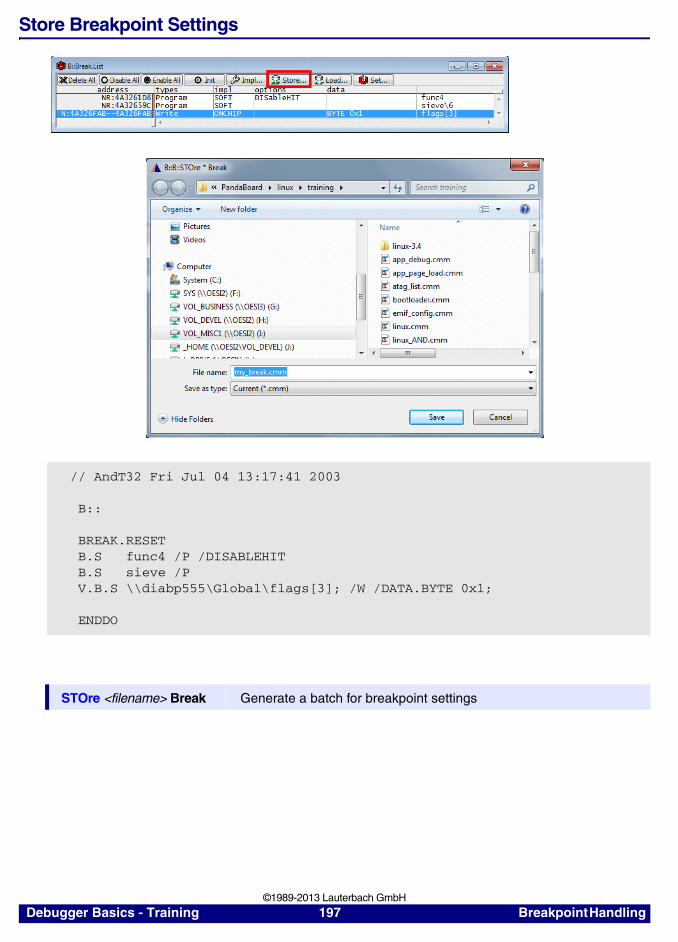
Store Breakpoint Settings
// AndT32 Fri Jul 04 13:17:41 2003
B:: BREAK.RESET B.S func4 /P /DISABLEHIT B.S sieve /P V.B.S \\diabp555\Global\flags[3]; /W /DATA.BYTE 0x1; ENDDO
STOre <filename> Break Generate a batch for breakpoint settings
Debugger Basics - Training 197 Breakpoint Handling ©1989-2013 Lauterbach GmbH
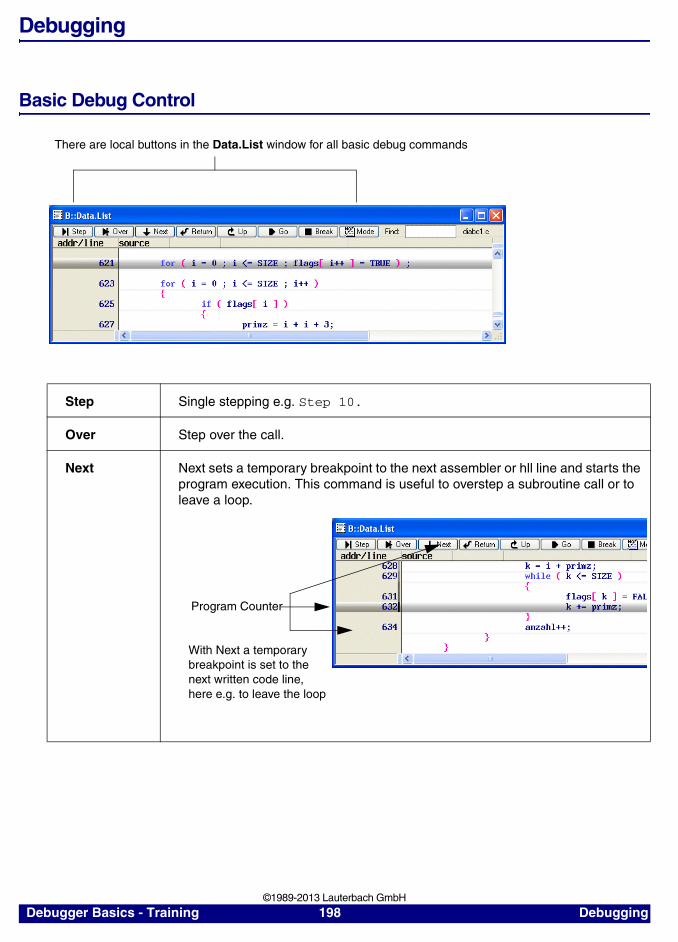
Debugging
Basic Debug Control
Step Single stepping e.g. Step 10.
Over Step over the call.
Next Next sets a temporary breakpoint to the next assembler or hll line and starts the program execution. This command is useful to overstep a subroutine call or to leave a loop.
There are local buttons in the Data.List window for all basic debug commands
Program Counter
With Next a temporary breakpoint is set to the next written code line, here e.g. to leave the loop
Debugger Basics - Training 198 Debugging ©1989-2013 Lauterbach GmbH
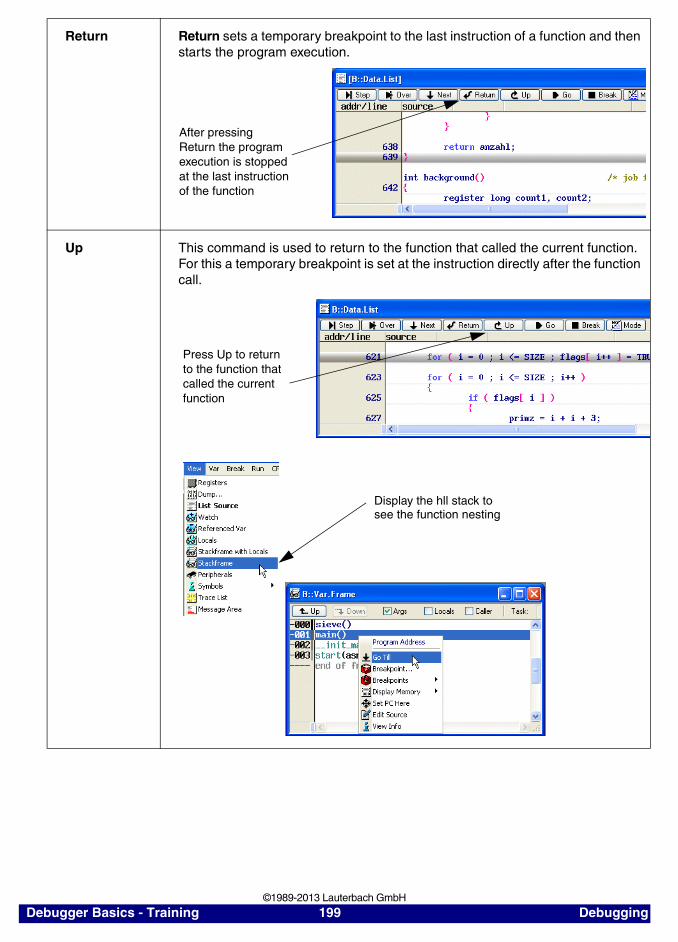
Return Return sets a temporary breakpoint to the last instruction of a function and then starts the program execution.
Up This command is used to return to the function that called the current function. For this a temporary breakpoint is set at the instruction directly after the function call.
After pressing Return the program execution is stopped at the last instruction of the function
Press Up to return to the function that called the current function
Display the hll stack tosee the function nesting
Debugger Basics - Training 199 Debugging ©1989-2013 Lauterbach GmbH

Step <count> Single step
Step.Change <expression> Step until <expression> changes
Step.Till <boolean _expression> Step until <boolean _expression> becomes true
Var.Step.Change <hll_expression> Step until <hll_expression> changes
Var.Step.Till <boolean _hll_expression> Step until <boolean _hll_expression> becomes true
Step.Over Step over call
Go [<address>|<label>] Start program execution
Go.Next Run program until the next code line is reached
Go.Return Run program until the end of the hll function is reached
Go.Up [<level>|<address>] Run program until it returns to the caller function
Debugger Basics - Training 200 Debugging ©1989-2013 Lauterbach GmbH
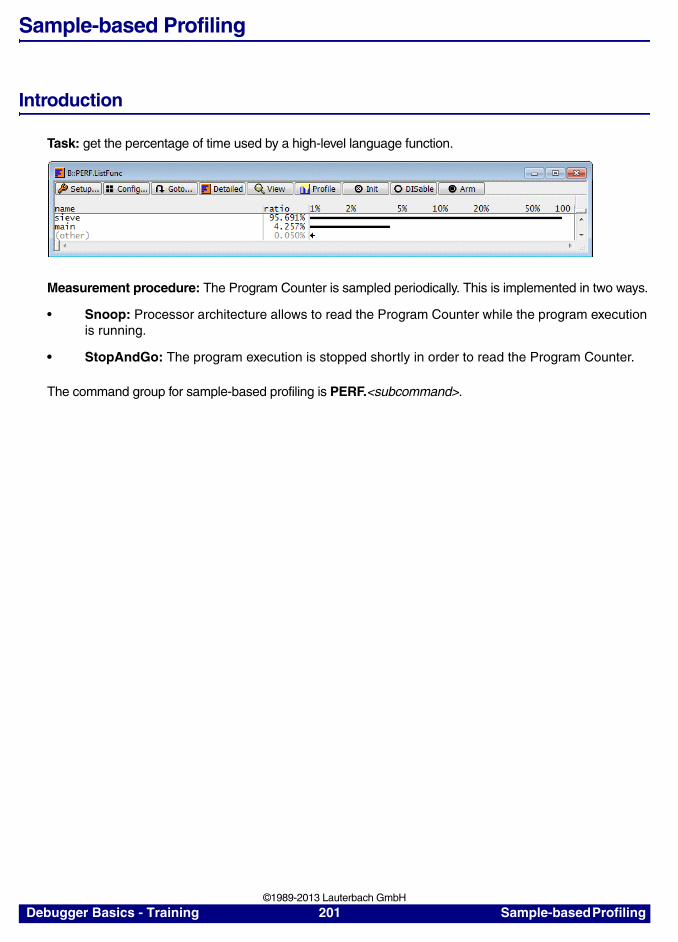
Sample-based Profiling
Introduction
Task: get the percentage of time used by a high-level language function.
Measurement procedure: The Program Counter is sampled periodically. This is implemented in two ways.
• Snoop: Processor architecture allows to read the Program Counter while the program execution is running.
• StopAndGo: The program execution is stopped shortly in order to read the Program Counter.
The command group for sample-based profiling is PERF.<subcommand>.
Debugger Basics - Training 201 Sample-based Profiling ©1989-2013 Lauterbach GmbH
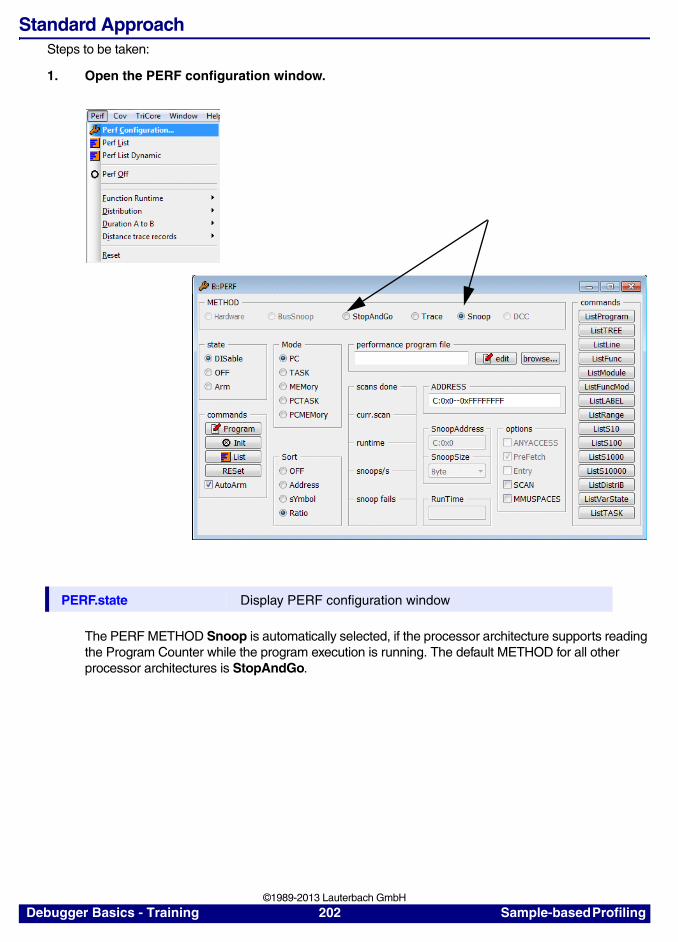
Standard ApproachSteps to be taken:
1. Open the PERF configuration window.
The PERF METHOD Snoop is automatically selected, if the processor architecture supports reading the Program Counter while the program execution is running. The default METHOD for all other processor architectures is StopAndGo.
PERF.state Display PERF configuration window
Debugger Basics - Training 202 Sample-based Profiling ©1989-2013 Lauterbach GmbH
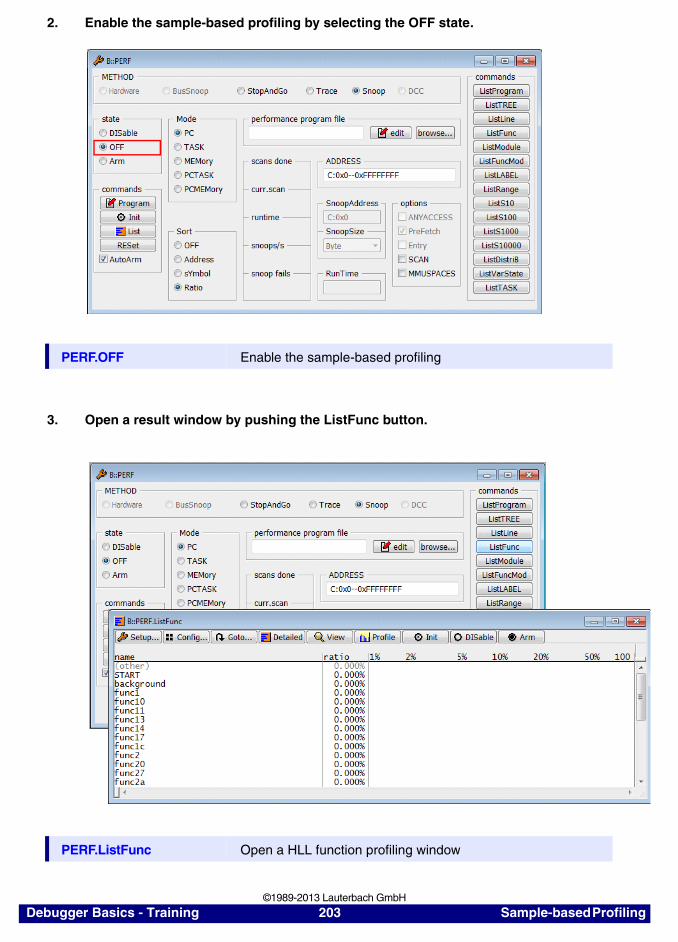
2. Enable the sample-based profiling by selecting the OFF state.
3. Open a result window by pushing the ListFunc button.
PERF.OFF Enable the sample-based profiling
PERF.ListFunc Open a HLL function profiling window
Debugger Basics - Training 203 Sample-based Profiling ©1989-2013 Lauterbach GmbH

4. Start the program execution and the sampling.
Remarks on the StopAndGo method
The target processor is stopped periodically in order to get the actual Program Counter. Such a stop can take more than 1 ms in a worst case scenario.
The display of a red S in the TRACE32 state line indicates, that the program execution is periodically interrupted by the sample-based profiling.
TRACE32 tunes the sampling rate so that more the 99% of the run-time is retained for the actual program run (runtime). The smallest possible sampling rate is nevertheless 10 (snoops/s).
Debugger Basics - Training 204 Sample-based Profiling ©1989-2013 Lauterbach GmbH
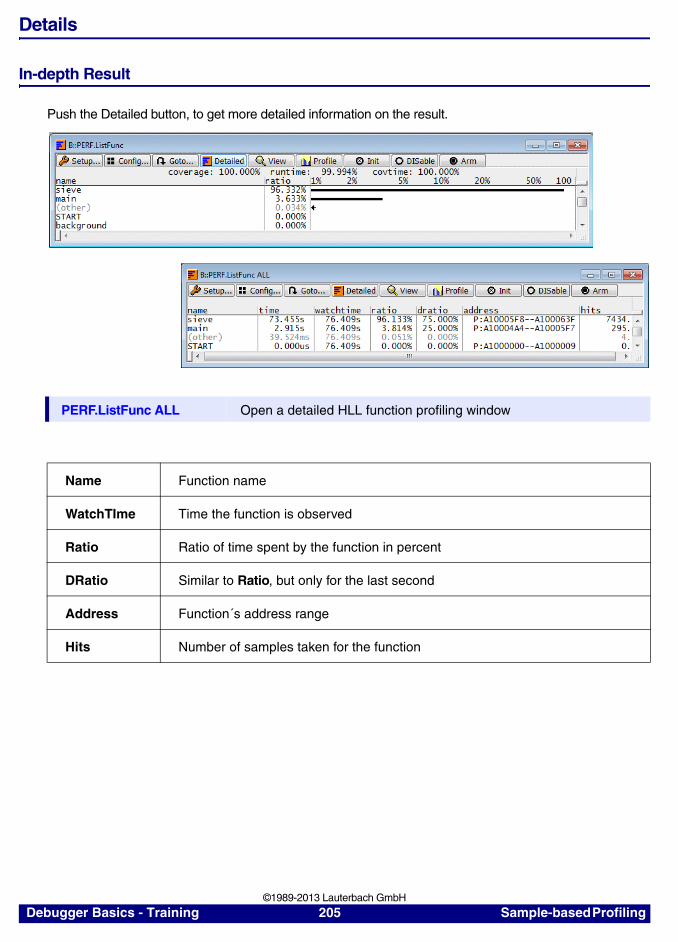
Details
In-depth Result
Push the Detailed button, to get more detailed information on the result.
PERF.ListFunc ALL Open a detailed HLL function profiling window
Name Function name
WatchTIme Time the function is observed
Ratio Ratio of time spent by the function in percent
DRatio Similar to Ratio, but only for the last second
Address Function´s address range
Hits Number of samples taken for the function
Debugger Basics - Training 205 Sample-based Profiling ©1989-2013 Lauterbach GmbH
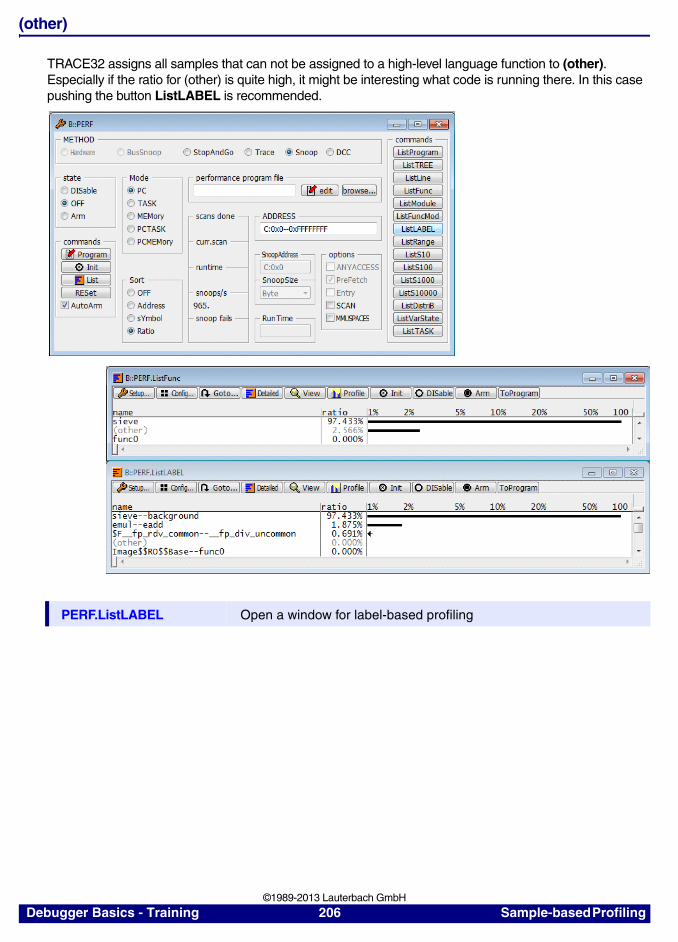
(other)
TRACE32 assigns all samples that can not be assigned to a high-level language function to (other). Especially if the ratio for (other) is quite high, it might be interesting what code is running there. In this case pushing the button ListLABEL is recommended.
PERF.ListLABEL Open a window for label-based profiling
Debugger Basics - Training 206 Sample-based Profiling ©1989-2013 Lauterbach GmbH
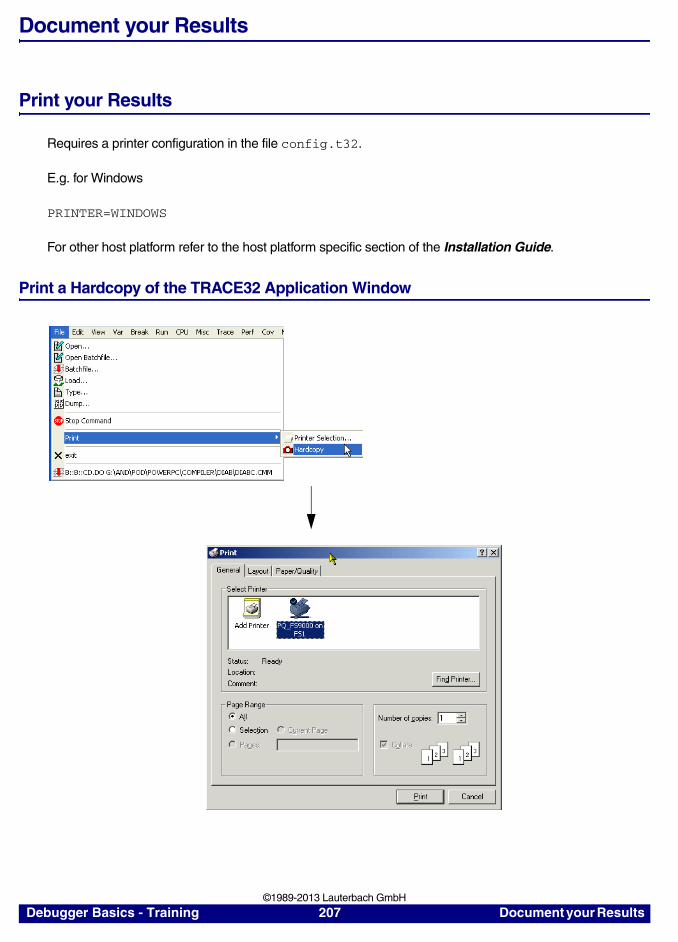
Document your Results
Print your Results
Requires a printer configuration in the file config.t32.
E.g. for Windows
PRINTER=WINDOWS
For other host platform refer to the host platform specific section of the Installation Guide.
Print a Hardcopy of the TRACE32 Application Window
Debugger Basics - Training 207 Document your Results ©1989-2013 Lauterbach GmbH
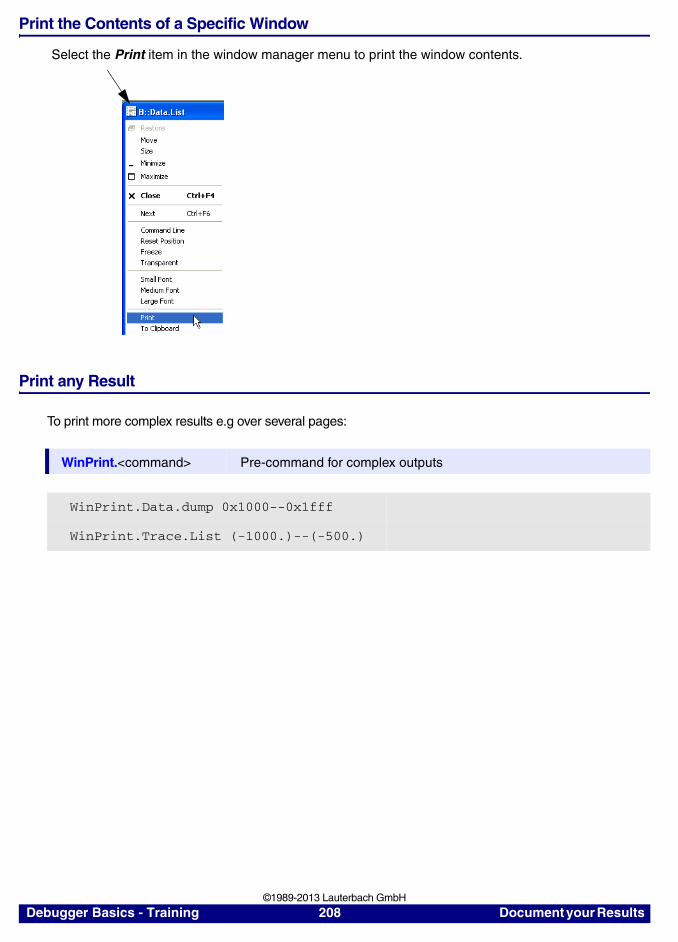
Print the Contents of a Specific Window
Print any Result
To print more complex results e.g over several pages:
WinPrint.<command> Pre-command for complex outputs
WinPrint.Data.dump 0x1000--0x1fff
WinPrint.Trace.List (-1000.)--(-500.)
Select the Print item in the window manager menu to print the window contents.
Debugger Basics - Training 208 Document your Results ©1989-2013 Lauterbach GmbH

Save your Results to a File
Select the Output Format for the File
PRinTer.FileType <format> Select file format
Switch the Fileradio button to ON
Debugger Basics - Training 209 Document your Results ©1989-2013 Lauterbach GmbH
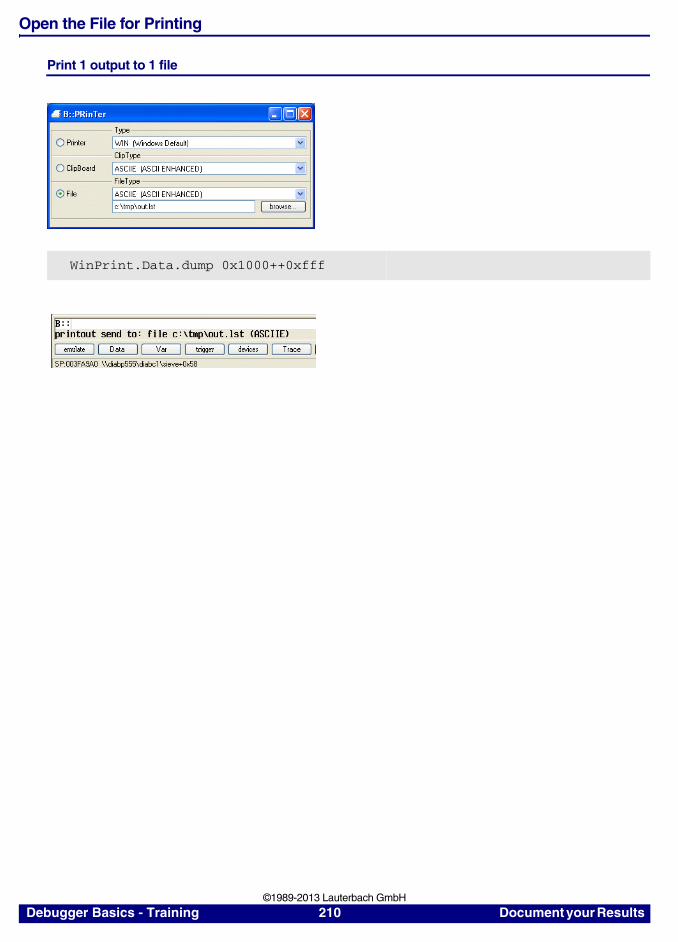
Open the File for Printing
Print 1 output to 1 file
WinPrint.Data.dump 0x1000++0xfff
Debugger Basics - Training 210 Document your Results ©1989-2013 Lauterbach GmbH
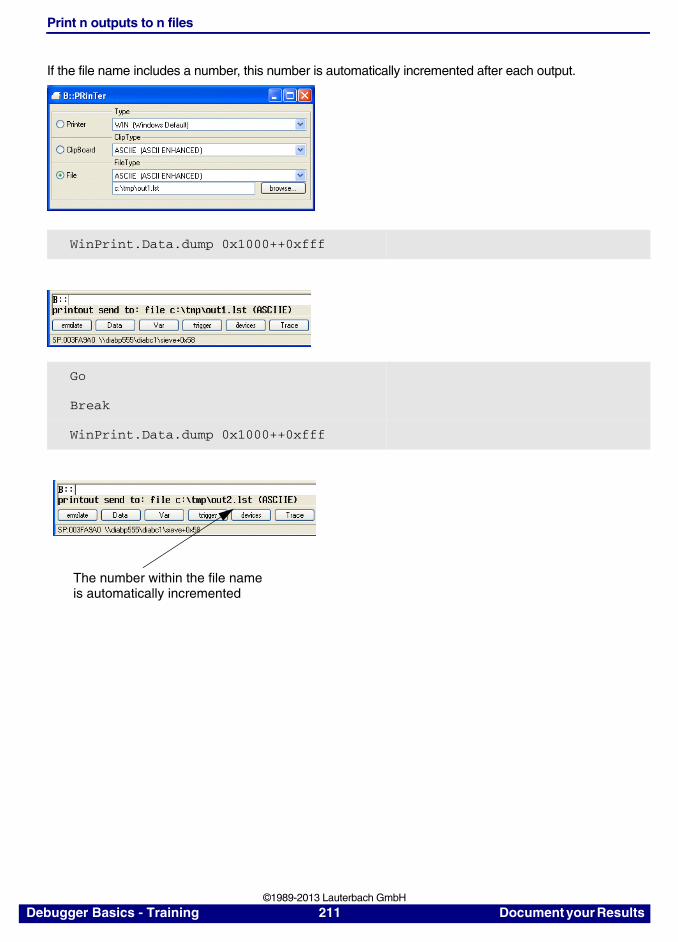
Print n outputs to n files
If the file name includes a number, this number is automatically incremented after each output.
WinPrint.Data.dump 0x1000++0xfff
Go
Break
WinPrint.Data.dump 0x1000++0xfff
The number within the file nameis automatically incremented
Debugger Basics - Training 211 Document your Results ©1989-2013 Lauterbach GmbH
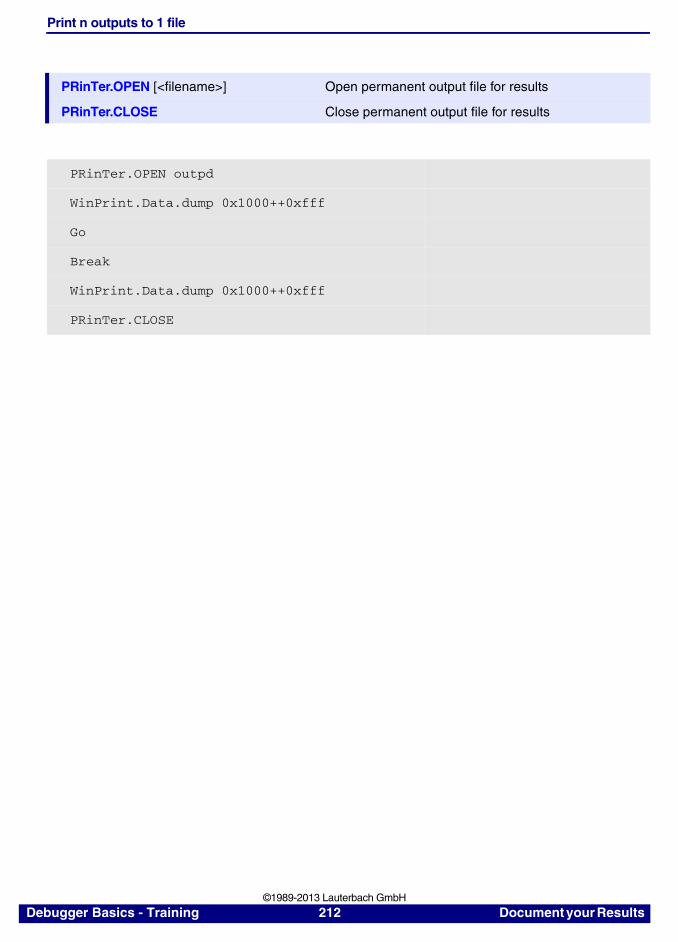
Print n outputs to 1 file
PRinTer.OPEN [<filename>] Open permanent output file for results
PRinTer.CLOSE Close permanent output file for results
PRinTer.OPEN outpd
WinPrint.Data.dump 0x1000++0xfff
Go
Break
WinPrint.Data.dump 0x1000++0xfff
PRinTer.CLOSE
Debugger Basics - Training 212 Document your Results ©1989-2013 Lauterbach GmbH
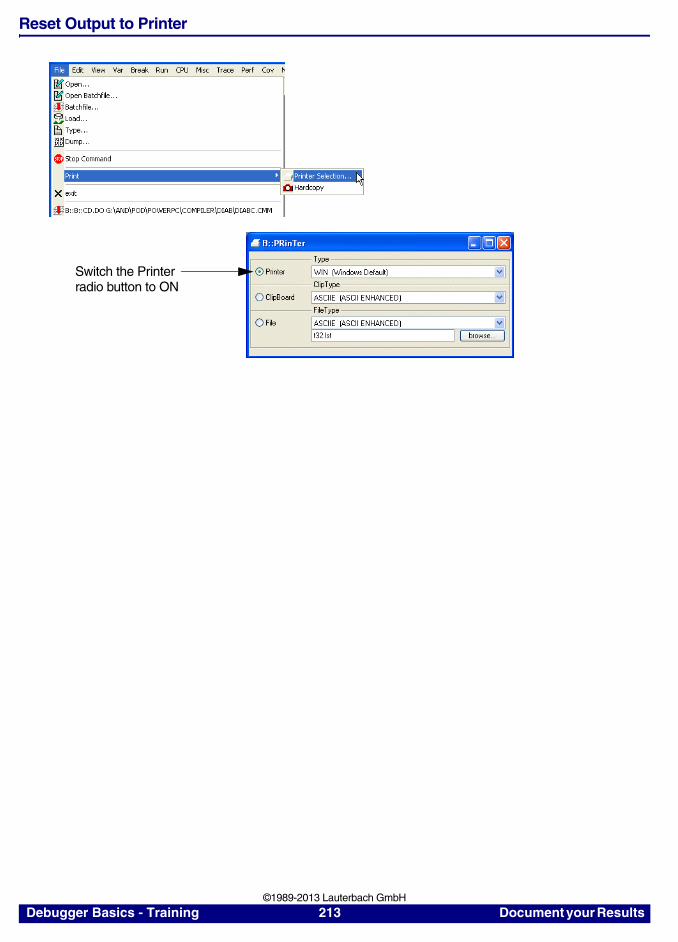
Reset Output to Printer
Switch the Printerradio button to ON
Debugger Basics - Training 213 Document your Results ©1989-2013 Lauterbach GmbH