training-intensity distribution, physiological adaptation ... · training-intensity distribution,...
TRANSCRIPT

i
TRAINING-INTENSITY DISTRIBUTION, PHYSIOLOGICAL
ADAPTATION AND IMMUNE FUNCTION IN ENDURANCE
ATHLETES
BY
CRAIG MICHAEL NEAL
A Thesis Submitted for the Degree of
Doctor of Philosophy
School of Sport, University of Stirling
October 2011

ii
DECLARATION
I declare that this thesis was composed by myself and that all the data were collected and
analysed by myself. Neither the thesis nor the original work therein has been submitted to this
or any other institution for a higher degree.
Craig Neal
25/10/11
“The copyright of this thesis belongs to the author, under the terms of the United Kingdom
copyright act, as qualified by the University of Stirling regulations. Due acknowledgement
must always be made of the use of any material contained in, or derived from this thesis”

iii
ABSTRACT
Exercise intensity and its distribution is probably the most important and most heavily
debated variable of endurance training. Training induces adaptation but also induces stress
responses. Controlling the training-intensity distribution may provide a mechanism for
balancing these two effects. It has been reported that elite endurance athletes train with a
high volume and load, relative to the sport. These athletes spend the vast majority (>80%) of
training time at relatively low intensities (lower than the lactate threshold, zone one), and
therefore <20% of training time above the lactate threshold (zones two and three).
Experimental studies support the beneficial effects of a high training volume in zone one, and
show detrimental effects of replacing zone one training with training in zone two. This is likely
due to enhanced recovery from training in zone one compared with training in zone two. The
acute recovery following training sessions in zones two and three has been reported to not be
different, but the recovery following training in zone one has been reported to be faster.
Improvements in physiological adaptation and endurance performance have been reported to
be greater following training programmes with higher exercise intensities. Therefore, it has
been suggested that a polarised training model, which includes ~80% of training in zone one
with ~20% of training in zone three is more beneficial than a threshold training model, with
the majority of training in zone two. However, research into an optimal training-intensity
distribution is limited. Therefore, the aims of this thesis were to assess the effectiveness of
training-intensity distribution on the improvements in physiological adaptation, endurance
performance and assess if manipulating training-intensity distribution had an effect on
immune function.

iv
Study one revealed that the lactate threshold, the lactate turnpoint and maximal performance
measures in swimming, cycling and running, assessed using the methods outlined in the study,
are reproducible in trained endurance athletes. These tests can therefore be used by trained
endurance athletes as part of a physiological testing programme to assess not only endurance
performance, but also to demarcate training intensity zones for exercise intensity prescription
and monitor moderate to large adaptations to training. Practitioners should take care when
deciding on the duration between tests to test for adaptations from training, as adaptations
need to be greater than these detected test-retest variations to be considered physiologically
meaningful.
To the best of the author’s knowledge, study two was the first study to have assessed training-
intensity distribution in a group of multisport athletes. Training was monitored over a 6-
month period, and testing took place every two months to assess the effect of the training on
physiological adaptation. Although speculative due to the number of variables involved, the
results suggest that a greater proportion of training time spent in zone one and a lower
proportion of training time spent in zone two is beneficial to physiological adaptation.
However, given the number of variables associated with assessing the training-intensity
distribution in multisport athletes, it is not easy to draw conclusions as to the effectiveness of
the training in the different disciplines on the key measures of adaptation in the different
disciplines. Study two highlighted the need for future research to focus on experimental
manipulation of training-intensity distribution and thus improve our understanding of its
impact on the training-induced adaptations in endurance athletes.
Study three manipulated the training-intensity distribution in trained endurance athletes in
just one discipline, to reduce the number of variables involved. A polarised training model was

v
compared to a threshold training model on the effectiveness to improve physiological
adaptation and endurance performance. Results revealed that a polarised training model is
recommended for trained cyclists wishing to maximally improve performance and
physiological adaptation over a short-term (six week) training period.
The first part of study four assessed the effect of a polarised and a threshold training model on
immune function markers in trained cyclists. Both endurance training programmes had similar
volume, and were sufficient to induce improvements in performance and physiological
adaptation. However, despite likely differences in recovery, both training programmes had no
effect on the proportion of low or high differentiated or senescent CD8+ or CD4+ T-cells in
blood. Therefore, training adaptation was achieved at no cost to this particular aspect of
immune function. From these results and evidence from previous studies, it seems likely that
athletes need to be overreached to induce any change in immune function following a period
of intensified training.
The second part of study four assessed the impact of an ironman triathlon race on Epstein-
Barr virus (EBV) and Varicella-Zoster virus (VZV) antibody titres and the frequency of low and
high differentiated and senescent blood T-cells in trained endurance athletes. Previous work
has revealed that an ironman triathlon race increases the proportion of senescent CD4+ T cells
and decreases the proportion of naive CD4+ T cells, and thus induces changes the immune
space which could leave an individual at a greater risk of infection. This study however, did
not find any changes in the proportions of these T cell subsets following an ironman triathlon
race. The mean results of this study suggest that there is no relationship between EBV and
VZV-specific antibody concentrations and the proportion of senescent, low and highly
differientiated T cells. However, on analysis of individual subject data, it seems possible that
subjects with a high antibody titre for EBV or VZV 3 wks before a competition might be more

vi
at risk of infection post race. A greater subject number would be needed in order to make a
more conclusive statement about this relationship.
The results of this thesis suggest that future research is required in the area of training-
intensity distribution. Firstly, our understanding of the physiological mechanisms responsible
for the effectiveness of a polarised training model in trained endurance athletes is limited, and
thus studies should attempt to address this issue. Our current knowledge on the mechanisms
underlying a blunted T cell response following strenous exercise is also limited. A change in
the immune space to a greater proportion of senescent T cells and a lower proportion of naive
T cells might contribute to this blunted response. In the current thesis however, the
proportions of these T cell markers were unchanged following the training/racing
interventions. It is possible that with a higher training load, there could be changes in these
markers, and thus this is an exciting area that could have potential implications on athlete
health. Finally, testing for antibody titres in endurance athletes is possibly an avenue to detect
individuals at the greatest risk of infection if subjected to a large physical and/or mental stress.
This could have implications on maintaining athlete health and therefore, allowing athletes to
train consistently.

vii
ACKNOWLEDGEMENTS
I would like to thank my girlfriend, Shemane Murtagh for all of her support throughout my
PhD. You are an inspiration, and I couldn’t have done it without you.
Thank you to my supervisors, Angus Hunter and Stuart Galloway. Thanks for the many edits
of my work and being so supportive throughout the process.
To The Subjects that took part in my studies – thank you for your effort, blood, sweat, tears
and muscle. A special thank you to Stirling Triathlon Club for the support and help, and in
particular to Graham Coull for always being on the end of an email or text message and
making such an effort to get members of the club involved in the studies – much appreciated,
Graham. Thanks also to Stirling Bike Club for being involved in the arduous training study, and
in particular to Robin Wilkins for organising the guys and for spreading the word about the
study.
Thanks to Blair Cartmell for helping with pilot testing – you were a great help mate, and it was
a pleasure to see some very big numbers from a very talented athlete.
To all of My Good Friends at Central Athletics Club – thank you for helping me to keep a
balanced lifestyle during my PhD. The training sessions and races were absolutely brutal at
times, as were the nights out!
Thanks to Barbara Kettlewell and Karen Caldwell for your help and support over the past four
years.
To my friends and colleagues at the University of Stirling, and in particular, the School of Sport
– thank you for making my time at the University of Stirling so enjoyable.
Finally, thank you to; my parents, Paul and Dawn Neal; my brother, Peter Neal; and my
Grandparents, Mike and Maureen Selman for always being there for me.

viii
TABLE OF CONTENTS
Title i
Declaration ii
Abstract iii
Acknowledgements vii
Table of Contents viii
Publications xv
Conference Presentations xvi
List of Figures xvii
List of Tables xix
1 INTRODUCTION AND AIMS 1
1.1 Introduction 2
1.2 Aims 4
2 REVIEW OF THE LITERATURE 7
2.1 ADAPTATIONS TO ENDURANCE TRAINING 8
2.1.1. The Training Process 8
2.1.2. The Key Adaptations to Endurance Training 8
2.1.2.1. Adaptations that Enhance VO2max 9
2.1.2.2. Adaptations that Enhance the Lactate Threshold 10
2.1.2.3. Adaptations that Enhance Exercise Economy 14
2.1.3 Summary of the Adaptations to Endurance Training Section 14
2.2. TRAINING-INTENSITY DISTRIBUTION 16
2.2.1 Introduction to Training-Intensity Distribution 16
2.2.2. Measurement of Training-Intensity Distribution 17
2.2.2.1. Measurement of Exercise Intensity 17
2.2.2.2. Establishing Training Intensity Zones 17
2.2.3. Polarised and Threshold Training Models 21
2.2.4. Studies to have Assessed the Training-Intensity Distribution 23
2.2.4.1. Descriptive Studies 23

ix
2.2.4.1.1. Training Volume and Load 24
2.2.4.1.2. Methods of Assessing Training-Intensity Distribution 25
2.2.4.1.2.1. Time In Zone Approach and Session Goal Approach 25
2.2.4.1.2.2. Additional Methods to Quantify Training-Intensity Distribution 26
2.2.4.1.3. Training-Intensity Distribution of Different Performance Levels 28
2.2.4.1.4. Comparing Different Training-Intensity Distributions in Similar Studies 30
2.2.4.2. Experimental Studies 31
2.2.5. The Polarised Training Model 35
2.2.6. The Threshold Training Model 36
2.2.6.1. Well-Trained Endurance Athletes 36
2.2.6.2. Untrained Individuals 37
2.2.7. Training in Zone One 38
2.2.8. Training in Zone Two 40
2.2.9. Training in Zone Three 42
2.2.9.1. Well-Trained Endurance Athletes 43
2.2.9.2. Optimising High Intensity Training 45
2.2.9.2.1. Programme 45
2.2.9.2.2. A Single High Intensity Training Session 46
2.2.10. Training Intensity Distribution During Competition 48
2.2.11 Summary of the Training-Intensity Distribution Section 49
2.3. TRAINING-INTENSITY SPECIFIC ADAPTATIONS 51
2.3.1. Studies Assessing the Impact of Exercise Intensity 51
2.3.2. Exercise Intensity Effects on Physiological Adaptation 55
2.3.2.1. VO2max 55
2.3.2.2. Lactate Threshold 56
2.3.2.3. Exercise Economy 58
2.3.2.4. Mitochondrial Biogenesis 58
2.3.3 Summary of the Training-Intensity Specific Adaptations Section 63

x
2.4. OVERTRAINING 65
2.4.1. The Overtraining Process 65
2.4.2. Causes of Overtraining 65
2.4.3. Types of Overtraining 66
2.4.3.1. Sympathetic Type Overtraining 67
2.4.3.2. Parasympathetic Type Overtraining 67
2.4.4. Measures of Overtraining 69
2.4.4.1. Performance Tests 69
2.4.4.2. Physiological Markers 70
2.4.5 Summary of the Overtraining Section 71
2.5. SENESCENT T CELLS AND EXERCISE 72
2.5.1. Introduction to the Human Immune System 72
2.5.2. T-cells 72
2.5.3 B-Cells 73
2.5.4. Cellular Senescence 74
2.5.5. Mechanisms Responsible for Cellular Senescence 75
2.5.5.1. Telomere Shortening 75
2.5.5.2. Oxidative Stress 75
2.5.5.3. Latent Herpesviruses 76
2.5.6. Markers of Senescence 76
2.5.7. The Impact of Cellular Senescence 78
2.5.8. Immunosuppression Following Strenuous Exercise 79
2.5.9. Mechanisms Responsible for a Decreased Immune Function Following Strenuous Training
81
2.5.9.1. Multifactorial 81
2.5.9.2. Senescent Cells Due to Oxidative Stress 82
2.5.9.3. Viral Reactivation 85
2.5.10. Effect of Chronic Exercise on Senescent T cells 85
2.5.11 Summary of the Senescent T Cells and Exercise Section 86
2.6 Conclusions to the Review of the Literature 87

xi
3 REPRODUCIBILITY OF THE LACTATE THRESHOLDS TO DETERMINE TRAINING INTENSITY ZONES AND ADAPTATION IN SWIMMING, CYCLING AND RUNNING
88
3.1. Abstract 89
3.2. Introduction 90
3.3. Methods 93
3.3.1 Participants 93
3.3.2 Experimental Approach to the Problem 93
3.3.3 Swimming test 93
3.3.4 Cycling test 94
3.3.5 Running test 94
3.3.6 Statistical Analyses 96
3.4. Results 97
3.4.1 Absolute and Percentage Test-Retest Differences 97
3.4.2. Limits of Agreement, Typical Error of Measurement and Pearson’s Correlation Coefficient
97
3.4.3
Ordinary Least Products Regression Analysis
98
3.4.4 Bland Altman Plots 98
3.4.5 Relationship between the Magnitude of the Measure and Test-Retest Difference
98
3.5.
Discussion
104
3.6. Conclusions 108
4 A 6-MONTH ANALYSIS OF TRAINING-INTENSITY DISTRIBUTION AND PHYSIOLOGICAL ADAPTATION IN IRONMAN TRIATHLETES
110
4.1. Abstract 111
4.2. Introduction 112
4.3. Methods 114
4.3.1 Participants 114
4.3.2 Experimental Approach to the Problem 114
4.3.3 Procedures 115
4.3.3.1 Habituation 115

xii
4.3.3.2 Swimming Test 115
4.3.3.3 Cycling Test 116
4.3.3.4 Running Test 116
4.3.4 Reproducibility of the Measures 118
4.3.5 Anthropometry, Cardiovascular and Pulmonary Measures 118
4.3.6 Statistical Analyses 119
4.4. Results 120
4.4.1 Training Volume and Training-Intensity Distribution 120
4.4.2 Incremental Test Responses 125
4.4.3 Anthropometry, Cardiovascular and Pulmonary Measures 125
4.4.4 Relationships 126
4.5. Discussion 131
4.6. Conclusions 134
5 THE IMPACT OF MANIPULATING TRAINING-INTENSITY DISTRIBUTION IN TRAINED CYCLISTS
135
5.1. Abstract 136
5.2. Introduction 138
5.3. Methods 142
5.3.1 Subject Information 142
5.3.2 Study Design 142
5.3.3 Wash-Out Period 142
5.3.4 Training 142
5.3.4.1 Polarised Training Group 143
5.3.4.2 Threshold Training Group 143
5.3.4.3 Zone One Training 144
5.3.5 Laboratory Testing 144
5.3.5.1 Peak Power Output Determination 145
5.3.5.2 Time to Exhaustion at 95% Peak Power Output 146
5.3.5.3 40km Time Trial 146
5.3.6 Reproducibility of the Measures 146

xiii
5.3.7 Mood Questionnaire 147
5.3.8 Statistical Analyses 147
5.4. Results 149
5.4.1 Training 149
5.4.1.1 Polarised Training Model 149
5.4.1.2 Threshold Training Model 150
5.4.2 Endurance Performance and Physiological Adaptation 150
5.4.2.1 40km Time Trial 150
5.4.2.2 Responses from the Incremental Intensity Test to Exhaustion 150
5.4.2.3 Time to Exhaustion at 95% Pre-Training Peak Power Output 151
5.4.2.4 Skeletal Muscle Oxidative Enzymes 151
5.4.2.5 Brunel Mood Scale 151
5.4.2.6 Body Mass 151
5.5. Discussion 155
5.6. Conclusions 160
6 – PART 1
THE FREQUENCY OF SENESCENT BLOOD T-CELLS FOLLOWING TWO DIFFERENT ENDURANCE TRAINING PROGRAMMES
161
6.1. Abstract 162
6.2. Introduction 163
6.3. Methods 167
6.3.1 Subject Information 167
6.3.2 Study Design 167
6.3.3 Endurance Training Programmes 167
6.3.4 Isolation and Preservation of PBMCs 168
6.3.5 Labelling of Cell Surface Antigens 168
6.3.6 Flow Cytometry 169
6.3.7 Statistical Analysis 169
6.4. Results 171

xiv
6.5. Discussion 174
6.6. Conclusions 178
6 – PART 2 THE IMPACT OF AN IRONMAN TRIATHLON RACE ON EPSTEIN - BARR VIRUS AND VARICELLA - ZOSTER VIRUS ANTIBODY TITRES AND THE FREQUENCY OF HIGHLY DIFFERENTIATED AND SENESCENT BLOOD T-CELLS
179
6.7 Abstract 180
6.8 Introduction 181
6.9 Methods 183
6.9.1 Statistical Analyses 183
6.10 Results 184
6.11 Discussion 188
6.12 Conclusion 191
7 SUMMARY AND CONCLUSIONS 192
8 REFERENCES 209

xv
PUBLICATIONS
Neal CM, Hunter AM & Galloway SDR. (2011). A 6-month analysis of training-intensity
distribution and physiological adaptation in ironman triathletes. Journal of Sports Sciences, 29
(14), 1515-1523.
Neal CM, Hunter AM, Brennan L, Hamilton DL, DeVito G & Galloway SDR. (2012). Six weeks of a
polarised training intensity distribution leads to greater physiological and performance
adaptations than a threshold model in trained cyclists. Journal of Applied Physiology (In
Review).
Neal CM, Simpson, RJ, Brown FF, Spielmann G, LaVoy E, Hunter AM & Galloway SDR. (2012).
The proportion of senescent blood T-cells following two different endurance training
programmes. Medicine and Science in Sports and Exercise (In Preparation)
Neal CM, Hunter AM & Galloway SDR. (2011) Reproducibility of two blood lactate thresholds
in swimming, cycling and running. International Journal of Sports Physiology and Performance
(In Preparation)
Cosgrove C, Galloway, SDR, Neal CM, Hunter, AM, McFarlin, BK, Spielmann, G, Simpson, RJ.
(2012). The impact of six months training preparation for an Ironman triathlon on the
proportions of naïve, memory, effector-memory and senescent T-cells in resting blood.
European Journal of Applied Physiology, 112 (8), 2989-2998.

xvi
CONFERENCE PRESENTATIONS
Neal CM, Hunter AM & Galloway, SDR. A 6-month analysis of training intensity distribution
and physiological adaptation in ironman triathletes. Free communication: International
Conference of Sports Science and Sports Medicine, Newcastle, UK, August 2009.
Abstract published in British Journal of Sports Medicine (2009)
Neal CM, Hunter AM, De Vito, G & Galloway, SDR. The impact of manipulating training-
intensity distribution in trained cyclists. Free communication: Stirling Graduate Research
School Annual Conference, Stirling, Scotland, UK, May 2010.
Neal CM, Hunter AM & Galloway, SDR. A 6-month analysis of training intensity distribution
and physiological adaptation in ironman triathletes. Poster session: Stirling Graduate Research
School Annual Conference, Stirling, Scotland, UK, May 2010.
Neal CM, Hunter AM, De Vito, G & Galloway, SDR. The impact of manipulating training-
intensity distribution in trained cyclists. Free communication: BASES Annual Conference,
University of Glasgow, Scotland, UK, September 2010.
Abstract published in Journal of Sports Sciences (2010)
Neal CM, Simpson, RJ, Brown FF, Spielmann, G, LaVoy, E, Hunter AM & Galloway SDR. (2011).
The proportion of senescent blood T-cells following two different endurance training
programmes. Poster session: American College of Sports Medicine Annual Conference, Denver,
Colorado, USA, June 2011.
Abstract published in Medicine and Science in Sports and Exercise (2011)

xvii
LIST OF FIGURES
Figure Figure Title Page
2.1 The process of positive training adaptation (top line), overreaching and
overtraining (bottom line)
8
2.2. Flow diagram illustrating that endurance performance (mean race pace) is
primarily determined by the VO2max, the lactate threshold and exercise
economy
9
2.3. The blood lactate concentration response to increasing exercise intensities 11
2.4.
2.5
The sequence of events leading to mitochondrial biogenesis
An example of a MLSS profile
14
18
2.6. Blood lactate concentration response to increasing exercise intensities 19
2.7. Determination of VT1 and VT2 20
2.8. Training-Intensity Distribution Models 22
2.9. Exercise intensity dependent adaptations of VO2max and cardiomyocyte
function/structure
56
2.10 The role of T cells and B cells in the adaptive immune system 74
2.11 Potential mechanisms by which acute and chronic exercise affects adaptive
immunity
81
3.1 Bland Altman plots show the relationship between the individual test-retest
differences and the mean of test one and test two for the swimming LT and
LTP (A and B, respectively), the cycling LT and LTP (C and D, respectively) and
the running LT and LTP (E and F, respectively).
102
4.1. Outline of the study period 115
4.2a. Mean (±SD) training volume per week 121
4.2b. Mean (±SD) training volume for each discipline per week 121
4.3a. Mean (±SD) training load per week 122
4.3b. Mean (±SD) training load for each discipline per week 122
4.4. Mean (±SD) time spent in each zone per week 123
5.1
5.2
Bland Altman plot to show the relationship between the individual test-retest
differences and the mean of test one and test two for the 40km TT mean
power output.
Mean (±SD) 40km time trial mean power output and mean heart rate
147
152

xviii
5.3. Mean (±SD) power output corresponding to the LT, LTP and PPO 152
5.4. Mean (±SD) TTE at 95% pre PPO 153
6.1. The proportion of senescent (A, B), highly differentiated (C, D) and low
differentiated (E, F) T-cells within the CD4+ (A, C, E) and CD8+ (B, D, F) T-cell
subsets
172
6.2 Timeline of the study 183
6.3 Mean (±SD) EBV antibody concentrations at each time point (left) and the individual VZV antibody concentrations for each subject at each time point (right).
184
6.4 Mean (±SD) VZV antibody concentrations at each time point (left) and the individual VZV antibody concentrations for each subject at each time point (right).
184
6.5 Mean (±SD) proportion of CD28-/CVD57+ on CD4+ at each time point (left) and the individual values for the proprtion of CD28-/CVD57+ on CD4+ for each subject at each time point (right)
185
6.6 Mean (±SD) proportion of CD28-/CVD57+ on CD8+ at each time point (left) and the individual values for the proportion of CD28-/CVD57+ on CD8+ for each subject at each time point (right)
185
6.7 Mean (±SD) proportion of CD28+/CVD57+ on CD4+ at each time point (left) and the individual values for the proportion of CD28+/CVD57+ on CD4+ for each subject at each time point (right)
185
6.8 Mean (±SD) proportion of CD28+/CVD57+ on CD8+ at each time point (left) and the individual values for the proportion of CD28+/CVD57+ on CD8+ for each subject at each time point (right)
186
6.9 Mean (±SD) proportion of CD28+/CVD57- on CD4+ at each time point (left) and the individual values for the proportion of CD28+/CVD57- on CD4+ for each subject at each time point (right)
186
6.10 Mean (±SD) proportion of CD28+/CVD57- on CD8+ at each time point (left) and the individual values for the proportion of CD28+/CVD57- on CD8+ for each subject at each time point (right)
186
6.11
7.1
Mean (±SD) training volume in each of the three weeks leading up to the race,
and in each of the six weeks after the race.
Fig. 7.1 A study design to assess the effectiveness of an increased volume of
training in zone one on already well-trained endurance athletes
187
198

xix
LIST OF TABLES
Table Table Title Page
2.1. The key physiological adaptations leading to an increased VO2max 10
2.2. Descriptive studies assessing the training-intensity distribution in trained
endurance athletes
23
2.3. Experimental studies to have manipulated TID in well-trained endurance
athletes
32
2.4. Case studies 1 and 2. Training-intensity distribution and training volume for
the two seasons assessed
33
2.5. Results of the study by Gaskill et al (1999) 34
2.6. Results of the study by Evertsen et al (1999) 35
2.7. Studies showing a physiological adaptation following training in zone two in
untrained subjects
37
2.8. Performance and physiological changes following a period of high intensity
interval training in trained endurance athletes
44
2.9. Responses to an acute interval training session 44
2.10. Studies to have assessed the optimisation of interval training in well-trained
endurance cyclists
46
2.11. The Training-intensity distribution in 3wk cycle tour races in professional
road cyclists.
49
2.12. Studies to have assessed responses to exercise of different intensity with
matched total work and frequency and found intensity-dependent responses
in favour of higher exercise intensities
52
2.13. Studies to have assessed responses to exercise of different intensity with
matched total work and frequency and found mixed results for intensity-
dependent responses
53
2.14. Studies to have assessed responses to exercise of different intensity with
matched total work and frequency and found no intensity-dependent
responses
54
2.15. Responses to different exercise intensities on key measures of endurance 54
2.16. Data from the study by Dudley et al (1982) 60
2.17. The influence of high intensity training on enzyme activities in well-trained 62

xx
endurance athletes
2.18. The influence of aerobic HIT on enzyme activities in moderately trained
individuals
62
2.19. The influence of short, very high intensity training on enzyme activities in
untrained or moderately trained individuals
63
2.20. Studies to have assessed the impact of training at different intensities in
untrained individuals, but with very different total work
63
3.1. Mean (±SD) values for all measures for test one and test two and the values
for the difference between test one and test two
99
3.2. Limits of agreement, typical error of the measurement with 95% confidence
intervals, and Pearson’s correlation coefficient for all measures
100
3.3. The slope and intercept for all measures using Ordinary Least Products
Regression along with 95% confidence intervals
101
3.4 The relationship between the difference between test one and test two and
the mean value from test one and test two
103
4.1. Mean (±SD) percentage of time spent in each zone during periods A-C 124
4.2. Mean (±SD) responses to the swimming incremental test to exhaustion 127
4.3. Mean (±SD) responses to the cycling incremental test to exhaustion 128
4.4. Mean (±SD) responses to the running incremental test to exhaustion 128
4.5. Effect sizes for the key responses to the swimming, cycling and running
incremental tests to exhaustion from baseline to 6 months
129
4.6 The relationship between the magnitude of the key responses at baseline
and the magnitude of the change in the response from baseline to 6-months.
130
5.1. Mean (±SD) Details of the training for the polarised and the threshold
training models
149
5.2. Effect sizes for the key performance measures 153
5.3 Mean (±SD) responses from the BRUMS questionnaire. Data are the mean
from the weekly responses.
154
6.1 Performance and heart rate responses before and after the two training interventions
171
6.2.
The proportions of CD4+ and CD8+ cells among total T-lymphocytes (CD3+)
and the percentage of all T-cells expressing CD57 and CD28 before and after
each training period
173

xxi
7.1 A proposed study to assess the effectiveness of the training intensity in zone
one
200

1
CHAPTER ONE
INTRODUCTION AND AIMS

2
1.1 INTRODUCTION
The aim of exercise training for an endurance athlete is to maximally improve endurance
performance. This is achieved by maximally improving the components of endurance
performance, whilst avoiding overtraining. In this thesis, endurance performance will be
classified as the performance in an event that is predominantly aerobic. In well trained
runners, maximal running for greater than 75 seconds is mostly aerobically driven (Duffield et
al, 2004, 2005a, b). Endurance training leads to numerous adaptations to the cardiovascular,
respiratory, metabolic, neuromuscular and endocrine systems. Manipulation of the
frequency, intensity and duration of training can cause different rates of improvement in
physiological adaptation, endurance performance, but can also lead to an increased
susceptibility to overtraining and viral infections. One of the most important variables an
endurance athlete can manipulate over a training period is the training intensity and its
distribution.
Descriptive studies have revealed that elite endurance athletes train with a large volume,
relative to the sport in which they compete. In addition, many anecdotal reports exist of
World class endurance athletes utilising high volume training with great success. One such
example is that of Sir Peter Snell, who broke the 800m World record in 1962 following high
volume training (up to 100 miles per week). It may seem surprising that such large volumes of
training were carried out for an event that lasts less than two minutes. In the descriptive
studies mentioned, in most cases, of the large volume, a high proportion (~80%) is performed
at a relatively low intensity, and the remaining training time (~20%) at a relatively high
intensity. It can be assumed that this represents an effective training-intensity distribution, as
it is adopted by a number of elite endurance athletes, although research is yet to support this.
However, it has been reported that by making major adjustments to the training-intensity

3
distribution, large improvements in physiological adaptation and performance can be
achieved. Therefore, it is possible that adjusting the training-intensity distribution may
improve endurance performance, physiological adaptation and recovery, and reduce potential
overtraining and the probability of illness.
There is still much to be understood regarding effective distributions in training intensity in
endurance athletes. The aim of this thesis is to answer some questions in the overall area of
how endurance athletes respond to different distributions in training intensity.

4
1.2 AIMS
The overall aim of this thesis was:
To determine the impact of training-intensity distribution on endurance performance,
physiological adaptation and immune function in endurance athletes.
The lactate threshold and the lactate turnpoint demarcate training zones one, two and three;
therefore it was important to assess the reproducibility of these measures. Once the training
zones are determined, the amount of time an athlete spends in each training zone, the
training-intensity distribution can be determined. The maximal performance measure is a
good measure of endurance performance. As these measures would be used for the
remaining chapters in the thesis, reproducibility was important to establish.
No study has yet assessed the training-intensity distribution in multisport athletes. With three
disciplines in a triathlon, we aimed to assess how much time was spent in each training zone in
each of the three disciplines (swimming, cycling and running) and whether there were any
relationships between the amount of time spent in each zone and the physiological adaptation
throughout the 6-month lead up to an important race.
Research in the area of manipulating training-intensity distribution in endurance athletes is
limited. Previous research has suggested that a polarised training model is more effective
than a threshold training model, yet no study has directly compared these two training
models. In order to minimise the effect of other variables, a single discipline was chosen
(cycling), and all training above the lactate threshold was carefully controlled. Endurance
performance was assessed using a 40km time trial, peak power output and time to exhaustion
at 95% of pre-training peak power output, and physiological adaptation was assessed by
monitoring changes in the lactate threshold, the lactate turnpoint, the maximal activities of

5
mitochondrial enzymes, heart rate and mood was monitored to give an indication of
overtraining.
Training periods with a different training-intensity distribution lead to different rates of
improvement in physiological adaptation and endurance performance, and different rates of
recovery in trained endurance athletes. It is therefore possible that different training-intensity
distributions leave an athlete at a higher risk of infection, which may impair overall
adaptation. Following intensive periods of endurance training in trained endurance athletes,
the cell mediated immune response has been reported to be decreased. Although
speculative, it is possible that this is due to an increase in the proportion of senescent T cells,
as these are unable to proliferate in response to antigenic stimuli. It has been reported that
an increase in senescent T cells can be caused by oxidative stress or reactivation of latent
herpes viruses. The aim of this study was therefore to assess the changes in the proportion of
low and high differentiated and senescent blood T cells following two 6wk periods of
endurance training with different training-intensity distributions. It was hypothesised that as
the polarised training model has been suggested to lead to enhanced recovery over the
threshold training model, that the polarised training model would have less of an effect on the
change in the proportion of the T cell subsets.
In a previous study (Cosgrove et al, 2011), we found that 3wks after an ironman triathlon race,
there was a significant increase in the proportion of senescent T cells in resting, fasted blood,
compared with 3wks before the race. In addition, there was a significant decrease in the
proportion of naive T cells 3wks after the ironman triathlon race, suggesting that there were
changes taking place in the immune space. However, from our previous study (Cosgrove et al,
2011), we did not establish the time course of these changes, as we only compared immune
function changes from 3wks before the ironman traithlon race to 3wks following the race. An

6
aim of this study was therefore to confirm the findings from Cosgrove et al (2011), but also to
establish when these changes in the immune function markers take place following an
ironman triathlon race. We also did not establish the mechanisms responsible for these
changes in the immune space. Therefore, another aim of this study was to assess whether
there were changes in the Epstein-Barr virus and Varicella-Zoster virus antibody titres
following training, and whether these changes were related to the changes in the immune
space.
The objectives of this thesis were therefore to determine:
1. The reproducibility of the lactate threshold, the lactate turnpoint and a maximal
performance measure in swimming, cycling and running in trained endurance
athletes.
2. The training-intensity distribution in a group of trained triathletes in the 6-month
lead up to an ironman triathlon, and the effect upon physiological adaptation.
3. The effect of manipulating the training-intensity distribution in trained cyclists on
endurance performance and physiological adaptation.
4. The effect of manipulating the training-intensity distribution in trained cyclists on
the proportion on low and high differentiated and senescent blood T cells.
5. The impact of an ironman triathlon race on Epstein - Barr virus and Varicella - Zoster
virus antibody titres and the frequency of highly differentiated and senescent blood
T-cells

7
CHAPTER TWO
REVIEW OF THE LITERATURE

8
2.1. ADAPTATIONS TO ENDURANCE TRAINING
2.1.1. The Training Process
A training stimulus of sufficient intensity, duration and frequency can cause a temporary
decline in exercise performance (Morton 1997); Fig 2.1). After adequate recovery, the
performance can be increased to above baseline values, in a process known as
supercompensation. However, if recovery from the training stimulus is inadequate,
performance will remain lower level than baseline. If inadequate recovery continues,
overreaching and eventually, overtraining can result (Fig 2.1).
Fig 2.1 The process of positive training adaptation (top line), overreaching and overtraining
(bottom line). Taken from Budgett (1998).
2.1.2. The Key Adaptations to Endurance Training
Numerous adaptations to the metabolic, cardiovascular, respiratory, neuromuscular and
endocrine systems occur following endurance exercise (Jones & Carter 2000). The results of
these adaptations are improvements in the key parameters of endurance performance; such
as maximal oxygen uptake (VO2max), the lactate threshold (LT) and exercise economy (Midgley
et al., 2007); Fig 2.2).

9
Fig. 2.2 Flow diagram illustrating that endurance performance (mean race pace) is primarily
determined by the VO2max, the lactate threshold and exercise economy. ATP = Adenosine
triphosphate. Taken from Midgley et al.,(2007)
2.1.2.1. Adaptations that Enhance VO2max
In the Fick equation (Eq. 1), VO2max is a product of the cardiac output (Q) and the difference
between the arterial oxygen content (CaO2) and the venous oxygen content (CavO2).
VO2max = Q (CaO2– CavO2) (Eq. 1)
A greater VO2max after endurance training has therefore been associated with an increased Q
and an enhanced extraction of oxygen by the exercising muscle (Spina et al.,1996; Shephard
1992). Adaptations in the heart, blood and skeletal muscle lead to increases in Q and the
arterio-venous oxygen difference (Table 2.1).

10
Table. 2.1 The key physiological adaptations leading to an increased VO2max (Adapted from
Midgley and colleagues (Midgley et al., 2007)
Site of adaptation Increase
Heart Left ventricular size and wall thickness
Blood Erythrocyte mass
Plasma volume
Skeletal muscle Mitochondrial density
Oxidative enzyme concentration
Capillarity
Myoglobin concentration
CO: Cardiac Output, a-VO2diff: Arterio-venous oxygen difference.
However, increases in endurance performance in already well-trained endurance athletes
have been shown to occur in the absence of improvements in VO2max (Costill et al., 1976).
Therefore, in highly trained endurance athletes, the LT and the economy are more sensitive at
differentiating between performance standards (Jones & Carter 2000).
2.1.2.2. Adaptations that Enhance the Lactate Threshold
The blood lactate concentration response to increasing exercise intensities is shown in Fig. 2.3.
Following endurance training, the curve shifts to the right, and therefore, the exercise
intensities corresponding to the LT and the lactate turnpoint (LTP) increase.

11
Fig. 2.3 The blood lactate concentration response to increasing exercise intensities (line A),
and following a successful period of endurance training, with the line shifted to the right (line
B). LT: Lactate threshold, LTP: Lactate turnpoint. (Adapted from Midgley et al., 2007).
Due to an enhanced O2 delivery following endurance training, there is less reliance on
anaerobic glycolysis to supply ATP at the same absolute exercise intensity. The result is a
reduced lactate accumulation at absolute exercise intensities, and therefore, an enhanced LT
due to a reduced rate of lactate production (Favier et al., 1986). Alongside the rate of lactate
production, the blood lactate concentration is dependent upon the rate of efflux of lactate
from the muscles to the blood and the clearance of lactate from the blood (Phillips et al.,
1995; MacRae et al., 1992). Indeed, endurance training has been reported to increase the
muscle specific clearing of lactate (Donovan & Brooks 1983). This is likely due to the increased
abundance of the monocarboxylate transport (MCT) proteins, as endurance training has
increased both the clearance capacity of lactate and the expression of MCTs (Juel 2001).
MCT1 is the major MCT located in slow twitch muscle fibres, and is responsible for the import
of lactate to the muscle for oxidation (McCullagh et al., 1996). MCT1 may also export lactate
from skeletal muscle due to lactate movement being driven by the concentration gradient
across the sarcolemma (Bonen et al., 2000). MCT4 is located in fast twitch muscle fibres, and
is responsible for the efflux of lactate produced by anaerobic glycolysis (Wilson et al., 1998).
The concentration of MCT4 does not increase as much as the concentration of MCT1 following

12
endurance training (Pilegaard et al., 1999a; Pilegaard et al., 1999b). Therefore, an increase in
the LT is due to the capacity to transport lactate out of the muscle fibre, and the capacity of
skeletal muscle to take up lactate. A muscle with primarily type II fibres has just 50% of the
lactate transport capacity of a muscle composed of type I fibres (Hawley & Stepto 2001).
Endurance training has been reported to cause a selected hypertrophy of type I muscle fibres,
and it is also possible that long-term endurance training can cause a transformation of type IIb
to type IIa (Spina et al., 1996; Andersen & Henriksson 1977) and from type IIa to type I
(Simoneau et al., 1985; Sale et al., 1990).
Endurance exercise has been reported to lead to mitochondrial biogenesis (Morgan et al.,
1971; Gollnick & Ianuzzo 1972; Hoppeler et al., 1973). Mitochondrial biogenesis is the
increase in mitochondrial content, and is closely related to improved endurance (Irrcher et al.,
2003; Adhihetty et al., 2003). This is due to an improved oxidative capacity and enhanced
resistance to fatigue (Hood et al., 2000b). Indeed, VO2max, LT and exercise economy have been
found to be improved following mitochondrial biogenesis (Sjodin et al., 1982; Hoppeler et al.,
1985; Holloszy et al., 1977). Mitochondrial biogenesis has been reported to change the
phenotype of skeletal muscle from low-oxidative white muscle, to high oxidative red muscle
(Hood 2001) and the sequence of events leading to mitochondrial biogenesis are shown in
Fig.2.4.
Exercise training-induced mitochondrial biogenesis has been reported to cause a shift in
substrate use (Holloszy & Coyle 1984). A decreased carbohydrate utilisation and a
proportional increase in fat utilisation at the same absolute and relative exercise intensity is
the result of a greater mitochondrial density (Coggan et al., 1995). The result of this shift in
substrate use is a sparing of muscle glycogen (Hermansen et al., 1967), which can lead to
improved endurance performance. In addition, the lowered reliance on carbohydrate

13
oxidation and anaerobic metabolism leads to a reduction in lactate production, and therefore
an enhanced LT (Holloszy & Coyle 1984). Therefore, mitochondrial biogenesis is central to the
improvement in LT following endurance training. Alongside the shift in substrate use causing a
lowered lactate production, the increase in mitochondrial density also leads to an increase in
lactate clearance through an enhanced lactate oxidation due to an increase in MCT1, which
leads to lower rates of release of lactate from the muscle (Dubouchaud et al., 2000).
Endurance exercise causes an increase in cytosolic calcium concentration, as required for
excitation-contraction coupling (Hood 2001; Fig.2.4). A high calcium concentration activates a
number of kinases (calcium-calmodulin kinases) and phosphatases (calcineurin), which
translocate their signals to the nucleus to alter the rate of gene transcription (Hood 2001);
Fig.2.4). Endurance training also accelerates adenosine triphosphate (ATP) consumption and
inhibits ATP synthesis, leading to an increased adenosine monophosphate (AMP):ATP ratio,
which has been reported to activate adenosine monophosphate activated protein kinase
(AMPK) (Hardie & Sakamoto 2006). Both calcium and AMPK-signalling mechanisms are
involved in the initiation of mitochondrial biogenesis, through the regulation of peroxisome
proliferator receptor-γ co-activator-1α (PGC-1α) expression and activity (Ojuka 2004;
Puigserver & Spiegelman 2003). It is well established that endurance training increases PGC-
1α mRNA and protein (Taylor et al., 2005). PCG-1α has been described as the master regulator
of mitochondrial biogenesis (Baar 2004; Puigserver & Spiegelman 2003), as it coordinates the
expression of the nuclear and mitochondrial genes needed for mitochondrial biogenesis (Baar
2006). An upregulation of oxidative enzymes and the conversion from ‘white’ glycolytic
muscle to ‘red’ oxidative muscle was reported following muscle-specific overexpression of
PCG-1α. In addition, a reduced expression of genes/proteins involved in oxidative metabolism
occurred in both whole body and muscle specific PCG-1α knockout mice (Arany et al., 2005;
Handschin et al., 2007; Leick et al., 2008).

14
Fig.2.4 The sequence of events leading to mitochondrial biogenesis. Taken from Hood (2001)
2.1.2.3. Adaptations that Enhance Exercise Economy
Exercise economy is the oxygen uptake required at a given absolute exercise intensity (Jones &
Carter 2000). An increase in exercise economy is associated with a change in the expression of
fast twitch skeletal muscle fibres towards a more slow twitch phenotype (Dubouchaud et al.,
2000). The result is a reduced energy cost for developing a particular level of force (Crow &
Kushmerick 1982). As previously mentioned, endurance training can cause a transformation in
muscle fibre type, and therefore, in exercise economy.
2.1.3 Summary of the Adaptations to Endurance Training Section
Long-term endurance training can cause numerous physiological adaptations, which in the
most part can be detected by assessing the VO2max, the LT and exercise economy. For long-
term endurance training to lead to positive adaptations, adequate recovery is required. A
failure to adequately recover from a period of endurance training before adding more training
stress has the potential to lead to decreased exercise performance and overtraining.
However, endurance athletes purposely stress themselves to decrease endurance
performance, before resting and achieving supercompensation. Therefore, successful

15
endurance training is a careful balance between stressing the body adequately to improve, but
not excessively, which could lead to overtraining.

16
2.2. TRAINING INTENSITY DISTRIBUTION
2.2.1 Introduction to Training Intensity Distribution
The main aim of endurance training is to improve performance and develop the components
of endurance performance whilst avoiding overtraining (Fiskerstrand & Seiler 2004). In order
to achieve this aim, there are many essential endurance exercise training variables that need
to be considered. Probably the most critical and heavily debated is that of training intensity
distribution (TID) (Seiler & Kjerland 2006). There is still a lack of consensus on the optimal TID
required to achieve maximal performance gains. An optimal TID involves a training load which
evokes maximal positive adaptations while avoiding excessive sympathetic stress leading to
overtraining (Guellich et al., 2009). This is vital in the long-term development of endurance
athletes as both the positive adaptations and the stress-related side-effects are cumulative
(Seiler et al., 2007; Fig.2.1).
The TID of successful endurance athletes gives a good indication of an effective, but not
necessarily optimal TID. Over time, each individual endurance athlete is involved in their own
experimental setting. In response to specific blocks of training, an athlete and coach will make
several iterative adjustments to the training programme in an attempt to optimise
performance (Seiler & Kjerland 2006). How these changes to training affect athlete health,
daily training tolerance and performance need to be closely assessed (Seiler & Tonnessen
2009). In agreement, it has been suggested that the International competition is an effective
experimental arena, in a Darwinistic sense (Guellich et al, 2009). Endurance training is an
individualised process, with each individual athlete responding slightly differently to different
training stimuli (Gaskill et al., 1999; Vollaard et al., 2009). However, Seiler & Tonneson (2009)
suggest that any consistent TID that emerges from different endurance sports is likely to be a
result of successful self-organisation towards a population optimum. That is, an approach that
results in most athletes staying healthy, making good progress and performing well in their

17
most important events. It has been proposed that TID may self-organise around two of the
most important factors in elite endurance training: a high training volume and adequate
exposure to or near race-pace intensity in training (Seiler et al., 2007). However, scientific
evidence linking a specific TID to optimal improvements in endurance performance is lacking.
2.2.2 Measurement of Training Intensity Distribution
2.2.2.1 Measurement of Exercise Intensity
A linear relationship exists between heart rate and metabolic exercise intensity during
dynamic exercise involving large muscle groups (e.g. running, cycling and swimming) (Gilman
1996). Therefore, exercise intensity during training and competitions can be estimated with
the use of a heart rate monitor (HRM). Heart rate is an indicator of exercise intensity up to
levels close to VO2max (Gilman 1996). There are however, a few limitations with the use of
heart rate monitoring, the main one being cardiac drift; this is the slow rise in heart rate that
occurs during moderate to high workloads, when exercise duration is prolonged for >20min,
indicating additional stress to the body due to an increase in heat storage (Gilman 1996).
Despite these limitations, there are currently no other means of continuously and non-
intrusively examining the exercise intensity in endurance athletes during both training and
competition.
2.2.2.2 Establishing Training Intensity Zones
Training intensity is commonly organised into specific zones, which is vital in order to assess
the TID. The most common methods of establishing exercise-intensity zones are blood lactate
concentration thresholds (Fig. 2.6) and ventilatory thresholds (Fig. 2.7) at exercise of
increasing intensity. Three specific zones can be established from blood lactate concentration
using the aerobic-anaerobic transition, as first described by Kindermann et al (1979). Using
blood lactate concentration thresholds, exercise intensities below the LT are in zone one

18
(Seiler & Kjerland 2006); Fig.2.6). The LT has been defined as the final exercise intensity
before the blood lactate concentration increases distinctly from its resting concentration
(Aunola & Rusko 1984). Exercise intensities above the LT but below the maximal lactate
steady state (MLSS) or LTP are in zone two (Seiler & Kjerland 2006; Fig.2.6). The LTP has been
defined as the final exercise intensity before the observation of a sudden and sustained
increase in blood lactate concentration between the LT and the VO2max (Smith & Jones 2001).
The MLSS has been defined as the highest exercise intensity at which blood lactate
concentration remains stable between 10 and 20 minutes of constant load exercise (Beneke,
1995; Fig. 2.5).
Fig.2.5 An example MLSS profile, showing the MLSS (MLaSS) at 15.5km.hr-1, to the nearest
0.5km.hr-1. (Taken from Almarwaey et al, 2004).
Exercise intensities above the MLSS/LTP are in zone three (Seiler & Kjerland 2006); Fig.2.6).
Seiler & Kjerland (2006) have named these three intensity zones in terms of blood lactate
concentration characteristics: first, a low lactate zone, second a lactate accommodation zone
(where blood lactate concentration is elevated but production and removal rates re-establish
equilibrium), and third a lactate accumulation zone, where blood lactate production exceeds
maximum clearance rates, and muscle fatigue is imminent.

19
Fig.2.6 Blood lactate concentration response to increasing exercise intensities. (Taken from
Seiler & Tonnessen (2009)
Lucia et al., (1999a); Lucia et al., (1998); Fig. 2.7) identified two specific ventilatory changes
that correspond to the aerobic and anaerobic thresholds introduced by Kindermann et al
(1979), from using breath-by-breath gas exchange measurements. These two changes have
been called ventilatory threshold 1 (VT1) and ventilatory threshold 2 (VT2)/Respiratory
Compensation Point (RCP): VT1 occurs when there is an increase in both the ventilatory
equivalent for oxygen (VE VO2-1) and end-tidal partial pressure of oxygen with no concomitant
increase in the ventilatory equivalent for carbon dioxide (VE VCO2-1) (Davis 1985); Fig. 2.7). VT2
occurs when there is an increase in both (VE VO2-1) and (VE VCO2
-1) and a decrease in the end-
tidal partial pressure of carbon dioxide (Davis 1985); Fig. 2.7). Therefore, at VT2, blood lactate
accumulation increases significantly, along with an additional hyperventilation in an attempt
to buffer the additional hydrogen ions (Kindermann et al., 1979).

20
Fig.2.7 Determination of VT1 and VT2. Each gas-exchange data point corresponds to a 15-s
interval. VE∙VO2: Ventilatory equivalent for oxygen, VE∙VCO2: Ventilatory equivalent for
carbon dioxide, PETO2: End-tidal pressure of oxygen, PETCO2, End-tidal pressure of carbon
dioxide. (Taken from Lucia et al., (2000a)).
The relationships between VT1, LT1 and VT2, LT2 have been demonstrated in a study by Lucia et
al (1998). This study found no significant differences in the power output corresponding to
VT1 and LT1 or VT2 and LT2 in a group of 28 professional or elite amateur cyclists undergoing a
continuous incremental test to exhaustion. In this study, VT1, VT2 and LT1 were defined as
described previously and LT2 was defined as the power output at a blood lactate concentration
of 4mmol∙L-1. This study also found no significant difference between both VT1 and LT1 and the
first surface electromyography (sEMG) amplitude threshold in the vastus lateralis and rectus
femoris muscles. In addition, the second sEMG amplitude threshold also occurred at similar
time/power points as both VT2 and LT2 in the same muscle groups. In support, Chwalbinska-

21
Moneta et al (1998) have also demonstrated a close correlation between blood lactate
concentration, EMG, and catecholamine thresholds. The EMG threshold could be the result of
a progressive recruitment of motor units, with a possible participation of type IIa and type IIb
fibres at the two thresholds, respectively. Seiler & Kjerland (2006) state that the
aforementioned studies support the use of LT1/VT1 and LT2/VT2 as defensible physiological
anchor points for the establishment of three training intensity zones. Although the
determination of VT1, VT2 and LT seem to be consistent in the literature, the zone 2/3
boundary using blood lactate concentration is less clear. Therefore, care needs to be taken in
interpreting results, as the onset of blood lactate accumulation (OBLA; 4mmol∙L-1); LTP or
MLSS could all be used to demarcate zones 2 and 3 when using blood lactate concentrations.
In addition, there is a potential limitation of using the HR corresponding to the two thresholds
in the three intensity zone model to assess TID, as the HR is irrelevant at very high training
intensities (Seiler & Kjerland 2006).
2.2.3 Polarised and Threshold Training Models
Seiler & Kjerland (2006) propose that two basic patterns of TID emerge from the research
literature (Fig. 2.8). These authors state that the polarised and threshold training models
provide a basic framework for future investigations exploring the endurance training process.

22
Fig.2.8. Conceptual TIDs associated with; the threshold training model (top) – emphasising
training between the first and second lactate/ventilatory thresholds and the polarised training
model (bottom) – emphasising a large volume of training below the first lactate or ventilatory
threshold combined with significant doses of training with loads eliciting 90–100% of VO2max.
Taken from Seiler & Kjerland (2006).

23
2.2.4 Studies to have Assessed the Training-Intensity Distribution
2.2.4.1 Descriptive Studies
Table. 2.2 Descriptive studies assessing the training-intensity distribution in trained endurance athletes
SGA: Session Goal Approach, TIZA: Time in Zone Approach, XC: Cross-country, HR: Heart Rate, RPE:
Rating of Perceived Exertion, Bla: Blood lactate concentration. TID: Training-Intensity Distribution
(displayed as the percentage of time spent in zone 1, 2 and 3, respectively), Zones: How the training
zones were determined, VT: Ventilatory Threshold, RP: Race Pace, Pace: Using the time for a particular
distance to quantify the training zone the exercise took place.
Study Subjects Training Volume
Duration Zones Method TID
Seiler & Kjerland
2006
12 elite XC skiers 10-12hrs∙wk-1
32d VT/HR RPE/RPE Bla/BLa VT/HR
SGA SGA SGA TIZA
75-8-17 76-6-18 71-7-22 91-6-3
Esteve-
Lanao et al., 2005
8 well-trained runners
~70km∙wk-1
24wk VT/HR TIZA 71-21-8
Guellich et al., 2009
36 elite rowers 13hrs∙wk-1
(all) 6.5hrs∙wk (rowing)
37wks Bla/HR TIZA 95-2-3
Lucia et al., 2000a; Lucia et al., 2000
13 elite cyclists ~750km∙wk-1
7mo (3 periods)
VT/HR VT/HR VT/HR
TIZA TIZA TIZA
88-11-1 78-17-5 77-15-8
Schumacher & Mueller
2002
7 elite cyclists ~400mi∙wk-1
7mo Bla/HR TIZA 94-4-2
Zapico et al., 2007
14 elite cyclists ~17hrs∙wk-1
7mo (2 periods)
VT/HR TIZA 78-20-2 70-22-8
Mujika et al., 1995
18 elite swimmers
17-33km∙wk-1
44wk Bla/Pace SGA 78-12-10
Billat et al., 2001
20 elite runners 140-200km∙wk-1
12wk RP/Pace SGA 78-4-18
Billat et al., 2003
20 elite runners (2 groups)
120-200km∙wk-1
8wk Bla/Pace SGA SGA
84-7-9 85-14-1
Sandbakk et al., 2010
16 elite XC skiers (2 groups)
13-19hrs∙wk-1
6mo HR/Bla/ HR
SGA SGA
88-7-5 88-5-7
Tjelta & Enoksen
2010
4 elite runners 115-145km∙wk-1
12mo (3 periods)
HR/HR/ Pace
SGA SGA SGA
78-20-2 81-12-7 78-18-4

24
To date, there have been a number of descriptive studies to have assessed the TID in elite and
well-trained athletes in a number of different disciplines (Table 2.2). It is of significant use to
coaches and exercise physiologists to observe how these elite athletes from different
disciplines organise their training and can give some insight into effective TIDs. A high training
volume, relative to the sport is common to all of these studies on elite endurance athletes.
2.2.4.1.1 Training Volume and Load
Elite and well-trained endurance athletes train with a high training volume and load (Table
2.2). This is presumably at the threshold of what the athlete can tolerate (at least temporarily)
in order to maximise performance. It has been reported that higher performing athletes train
with a higher volume (Billat et al., 2001; Fiskerstrand & Seiler 2004; Sandbakk et al., 2010), and
a positive relationship has been reported between training volume and success in
championships in rowers (Steinacker et al., 1998). It has been suggested that the benefits of
high intensity training are only possible once the minimum training volume for the particular
event is achieved (Jones & Carter 2000). In the long term, it has been suggested that a high
training volume may facilitate endocrine adaptations (Kjaer 1998). However, there seems to
be a ceiling for the amount of training volume that will continue to lead to positive
adaptations. Studies have shown that in highly trained athletes with already high training
volume, an additional increase through increased submaximal training does not appear to
further enhance endurance performance or associated variables (Costill et al., 1988; Londeree
1997). For example, in rowing, this has been shown to occur at approximately 5000 to 6000
km·yr-1 (Steinacker 1993). In addition, with an increase in training load, there is an increased
risk of overtraining, especially with monotonic training (Steinacker et al., 1998).

25
2.2.4.1.2 Methods of Assessing Training Intensity Distribution
2.2.4.1.2.1 Time in Zone Approach and Session Goal Approach
There are two methods of quantifying TID from HR recordings. Firstly the Time in Zone
Approach (TIZA) whereupon the HRM is set with two threshold HRs corresponding to VT1/LT1
and VT2/LT2. The HRM then records all HR recordings for the entirety of each training session
and determines how much time was spent in the three training zones (Seiler & Kjerland 2006).
The TIZA is very user friendly, with most HRM manufacturers providing a function to record HR
in different intensity zones. In addition, every training minute can be incorporated into the
training analysis from the start to the finish of every training session. However, it has been
suggested that a HR based TIZA will tend to underestimate the actual time and energetic and
sympathetic stress at high exercise intensities such as interval training, due to delays in HR
responses (Guellich et al., 2009). For example, in using this approach for a cycling interval
training session, despite the power output corresponding to zone three for each bout, the HR
may only enter zone three for a very short period of time during each interval.
Secondly, the Session Goal Approach (SGA) whereupon each training session is analysed
according to the goals of steady state, threshold and interval training sessions. For steady
state training sessions, the intensity zone of the average HR for the entire session is used. For
threshold training sessions, the intensity zone corresponding to average HR of the specific
threshold bout of training is used. For interval training, the intensity zone of the average peak
HR attained during each interval bout is used. The intensity zone of the warm up and cool
down for any training session is quantified in the same way as for the steady state training
sessions.
Care needs to be taken when analysing the TID research, as differences in TID can occur for
the same training period using either the TIZA or the SGA, based on HR recordings. Two

26
studies to date have analysed the TID using both the TIZA and the SGA. Seiler & Kjerland
(2006) found that in a group of well-trained junior cross country skiers, training over 32
consecutive days, the TID using the TIZA was 91, 6.4 and 2.6% of training time spent in zones
one, two and three, respectively, and using the SGA was 75, 8 and 17%. Similarly, Esteve-
Lanao et al (2007) found that in a group of well-trained runners training over 5 months, the
TID using the TIZA was 80, 12 and 8% and using the SGA was 74, 11 and 15%. These studies
both show that the percentage of training time in zone one is considerably lower and the
percentage of training time in zone three is considerably higher when using the SGA compared
to the TIZA. The percentage of training time in zone two seems to be similar using both
approaches.
2.2.4.1.2.2 Additional Methods to Quantify TID
In addition to HR recordings, the rating of perceived exertion (RPE) and blood lactate
concentration measurements have been used to quantify the TID, using the SGA (Seiler &
Kjerland 2006). Pilot work revealed that a 10-point RPE developed by Foster and colleagues
(Foster et al., 1996; Foster 1998) can be demarcated into three training intensity zones (Seiler
& Kjerland 2006). Using this approach, points 1 to 4 (easy to somewhat hard) are classified as
zone one, points 5 and 6 are classified as zone two (hard) and points 7 to 10 are classified as
zone three (very hard to maximal effort). The agreement between ventilatory threshold
derived HR assessment of the TID using the SGA and this RPE approach was 92%, with no
significant difference (Seiler & Kjerland 2006). There were also no significant differences
between the ventilatory threshold derived HR assessment of the TID using the SGA, and the
TID using the fixed blood lactate values of 2 and 4mmol.L-1 to demarcate zones one to two and
two to three, respectively. This was the first study to use more than one method to analyse
TID and to compare them, which adds substantially to the understanding of how to assess the
TID in endurance athletes.

27
The studies reviewed in table 2.2 used different methods to determine the training intensity
zones, with the HR associated with ventilatory thresholds (VT1 and VT2) and blood lactate
concentration thresholds the most common. Fixed blood lactate concentrations of 2 and
4mmol·L-1 have been used to demarcate training intensity zones (Mujika et al., 1995; Seiler &
Kjerland 2006; Guellich et al., 2009). However, there is considerable interindividual
differences in the fixed blood lactate concentrations, which may over- or underestimate the
true endurance capacity (Faude et al., 2009). The physiological stress might therefore be over-
or underestimated for athletes with especially high or low lactate production, and this could
be influenced by training and diet, as reduced muscle glycogen availability leads to lower
lactate production (Faude et al., 2009). The pace of training sessions in relation to the
previously established training zones by blood lactate concentration thresholds has been used
to quantify TID (Mujika et al., 1995; Billat et al., 2003). The study by Mujika et al (1995)
assessed the TID in swimmers, in which training paces are very easily quantified, and the
training environment is very stable, and therefore it is likely that this was an accurate method
to assess the TID. However, the study by Billat et al (2003) was in runners, and therefore is
likely that this was less accurate, due to a less stable environment (hills, temperature, and
humidity). Relating the pace adopted in training to that of racing has also been used to
quantify the TID (Billat et al., 2001). In this study, the training of runners was related to
marathon pace in order to quantify three training zones (below marathon pace, at marathon
pace and above marathon pace). It has been reported that marathon pace is at or very close
to the LT (Sjodin & Svedenhag 1985). The studies that assess TID using pace instead of HR
should be treated with caution. This could potentially underestimate exercise intensity due to
the so-called slow component, the gradual increase in VO2 occurring after the third minute of
exercise bouts performed over the LT/VT (Xu & Rhodes 1999), which obviously only effects the
data for zones two and three. The percentage of maximum HR has been used to demarcate

28
three training zones (Tjelta & Enoksen 2010). This study used 62-82% HRmax as zone one, 82-
92% for zone two and then used 10, 000m pace or quicker as zone three. The metabolic
challenge of exercise in each of these zones may be different between individuals, and thus
the results from this study also need to be treated with caution.
2.2.4.1.3 Training-Intensity Distribution of Different Performance Levels
It has been reported that in the 12 week lead up to the Olympic trials, the general TID of both
male and female elite marathon runners of different standards was generally the same (78, 4
and 18% of training time below, at and above marathon pace, respectively) (Billat et al., 2001).
However, the top-class male runners (marathon time: <2hr 11) had a 23% higher training
volume (206 vs. 168km) and therefore spent more time in each training zone than the high-
level male runners (marathon time: >2hr 11, <2hr 16). In contrast, there was no difference in
the training volume between the top class female runners (marathon time: <2hr 31) and the
high level female runners (marathon time: >2hr 31, <2hr 38). However, of the training
performed at and faster than 10km race pace, the top class female runners spent more time at
higher intensities (3km pace) than the high level female runners. Similarly, Sandbakk et al
(2010) compared the training of World class and National standard male cross country skiers
over 6 months and found essentially the same TID. However, the World class skiers trained
with 30% more volume than the National standard skiers, a similar result to that of the males
in the study by Billat et al (2001). In another study by Billat and colleagues (Billat et al., 2003),
a group of elite male 10km runners were separated into those that train at the velocity
associated with the VO2max (vVO2max) (HI) and those that complete no training at this intensity
(LO) during an 8 week build up to an important race. HI completed 84, 7, 4 and 5% of training
at a sub-LT intensity, at the LT intensity, between the LT and the VO2max and at vVO2max,
respectively. In contrast, LO completed 85, 14, 1 and 0% of running at the same training
intensities. Therefore, the major difference in the TID between the two groups was that HI
29
completed more high intensity training: 5 and 4% of training at vVO2max and halfway between
the LT and the vVO2max, respectively in comparison to 0 and 1%, respectively in LO. In addition,
LO completed more training time at the LT intensity (14%) in comparison to HI (7%). There
was no difference in the training time spent at a sub-LT intensity between HI and LO. LO
achieved a significantly higher training volume (174km.wk-1) than HI (158km.wk-1). It is likely,
however, that HI achieved a greater training load, due to more training at high intensities than
LO, although this is not reported. HI ran faster over 10km (28min 15s) than LO (28min 54s),
and also had a higher VO2max and vVO2max. However, the runners in LO were more economical.
This study demonstrates that despite a significantly lower training volume, a training
programme with more training at high intensities (zone three) in place of training at the LT
intensity (zone two) can be beneficial. In addition, in relation to the TID models proposed by
Seiler & Kjerland (2006), the training completed by HI was more polarised than that in LO.
With the exception of period two in the study by Zapico and colleagues (Zapico et al., 2007),
the descriptive studies assessing the TID using the TIZA in elite athletes seem to follow a
general pattern of ~80% and ~20% of training time below and above zone one (VT1, LT). The
elite athletes also all train with very high volume. It may be relevant that the only study
assessing sub-elite athletes (Esteve-Lanao et al., 2005) revealed that these athletes spend
more time in zones two and three, combined (~30%) and consequently, less time in zone one
(~70%) than the elite athletes. They also have a lower training volume in relation to their
discipline, and so this has the effect of increasing the time spent at higher intensities (zones
two and three). A significant relationship has been found between the time spent in zone one
and performance (Esteve-Lanao et al., 2005). In addition, no significant correlation was found
between the training time spent in zones two and three, and performance. It would therefore
seem that the sub-elite athletes in the study by Esteve-Lanao et al (2005) would benefit from
increasing training volume through an increase in zone one training time and this would also

30
decrease the percentage of training time spent in zones two and three to <20%, in line with
the studies on elite endurance athletes.
2.2.4.1.4 Comparing Different Training-Intensity Distributions in Similar Studies
Elite male road cyclists have been reported to gain large physiological adaptations following a
winter mesocycle of training, with high training volume (Zapico et al., 2007). The TID of these
cyclists was 78, 20 and 2% of training time in zones one, two and three, respectively, analysed
using the TIZA. Physiological adaptations included increases in the power corresponding to
VT1 and VT2, the peak power output, the MLSS and the VO2max. The training volume of these
cyclists significantly increased during the spring mesocycle, and the TID shifted to 70, 22 and
8% of training time in zones one, two and three, respectively. None of the previously
improved physiological adaptations were further improved following the spring mesocycle and
in fact, the mean peak power output decreased back to a pre-training value. The authors
suggest that the lack of further improvement following the spring mesocycle reflects either a
physiological ceiling was reached, or an accumulation of training volume. A very similar study
on a group of elite male road cyclists assessed the effect of TID on physiological adaptation,
using the TIZA (Lucia et al., 2000a; Lucia et al., 2000b). This study also assessed the cyclists
over an entire season, but was split into three training periods. The training volume increased
in each training period, and was very high in the final two training periods. The TID was 88, 11
and 1% of training time in zones one, two and three, respectively in period one, 78, 17 and 5%,
respectively in period two and 77, 15 and 8%, respectively in period three. The most striking
difference between this study and the study by Zapico et al (2007) is the continual
improvement in LT. The power associated with the LT was 319, 350 and 379W, respectively in
periods one, two and three in the study by Lucia and colleagues (Lucia et al., 2000a; Lucia et
al., 2000b). In both of these studies (Zapico et al., 2007; Lucia et al., 2000a; Lucia et al.,
2000b), the cyclists trained with a high volume and this increased throughout the season. In

31
the study by Lucia and colleagues (Lucia et al., 2000a; Lucia et al., 2000b) and in the first
period of training in the study by Zapico et al (2007), the training time in zone one is high
(>77%), which has been suggested to be beneficial (Ingham et al., 2008; Esteve-Lanao et al.,
2007; Esteve-Lanao et al., 2005; Fiskerstrand & Seiler 2004) and was beneficial in both of these
studies. However, in the second period of training in the study by Zapico et al (2007), the time
spent in zone one decreased to 70%, and this is a potential explanation of the lack of
physiological adaptation following this second period of training. In addition, the time spent in
zone two in the second period of training in the study by Zapico et al (2007) rose to above
20%, which has been suggested to result in a physiological adaptation plateau as opposed to
increasing training time in zone one (Esteve-Lanao et al., 2007). This therefore provides
another potential explanation for the lack of physiological adaptation following the second
period.
2.2.4.2 Experimental Studies
Experimental studies have attempted to manipulate the TID in elite and well-trained
endurance athletes, to assess if different responses are present, due to the TID (Table 2.3). A
group of elite rowers were found to have a greater improvement in the power corresponding
to both the LT and to 4mmol·L-1 blood lactate concentration following 12 weeks of a
predominantly low intensity training programme compared to a group following a mixed
intensity training programme of equal training volume (Ingham et al., 2008; Table 2.3.). The
low and the mixed intensity groups spent 98 and 72% of training time sub-LT, respectively.
However, there were no changes in the performance (2km time trial) between the groups. As
the groups were matched for training volume, the low intensity group would have been
training with a lower training load, and so this result is intriguing. In addition, the mixed
intensity group showed no signs of overtraining, and therefore this result was unlikely to be
caused by excessive sympathetic stress in the mixed group. This study provides further

32
evidence of the importance of training in zone one. The manipulation of training time spent in
zones one and two was assessed in two groups of well-trained runners over a five month
training period (Esteve-Lanao et al., 2007; Table 2.3). The two groups were matched for
performance and physiological attributes before the training period and were prescribed
training with no difference in the total training load or the time spent in zone three, but
differences in the time spent in zones one and two. The TID for group 1 was 80, 12 and 8% of
training time in zones 1, 2 and 3, respectively and the TID for group 2 was 67, 25 and 8%,
respectively. The major difference in the training between the groups was that group 2 did
zone two ‘tempo runs’ whilst group 1 did longer runs in zone one, and there was no sign of
overtraining in either group. The magnitude of improvement in a simulated 10.4km cross-
country race was significantly greater in group one (7%) than group two (5%). In agreement
with Esteve-Lanao et al (2005) and Ingham et al (2008), this study shows a greater
improvement with a training programme including more training in zone one.
Table. 2.3 Experimental studies to have manipulated TID in well-trained endurance athletes.
> One group performed better than the other, nsd: No significant difference, XC: Cross-Country
Two case studies illustrate how increasing training volume and decreasing the intensity of high
intensity training sessions can provide large improvements in performance in already well-
trained endurance athletes (Seiler & Tonnessen 2009). In both case studies, the athletes
replaced a high intensity, low volume programme with a high volume, low intensity
programme. In the first case study on a cyclist, training volume was roughly doubled, training
Study Subjects/ Study Duration
Groups Results
Ingham et al., 2008
Elite rowers/ 12wks
1. 98% <LT, 2% >LT 2. 78% <LT, 22% >LT
Power at LT: 1>2 Power at 4mmol.L
-1 Bla: 1>2
2km rowing performance: nsd
Esteve-Lanao et al., 2007
Well-trained runners/ 5mo
1. 80-12-8 2. 67-25-8
Improvement in XC race: 1>2

33
time in HR zone five was replaced with training time in HR zones three and four and training
time in HR zone two was reduced (Table 2.4). Following the change in training, there were
large improvements in an already high VO2max (11%; 81-88ml.kg-1.min-1) and LT power (14%;
375 – 440W). In the second case study on a runner, a similar redistribution took place (Table
2.4). This change in training also resulted in an increase in an already high VO2max (9%; 76-
83mL∙kg-1∙min-1) and LT velocity (5%; 16.9-17.7km∙hr-1).
Table.2.4 Case studies 1 and 2. TID and training volume for the two seasons assessed.
(Data from Seiler & Tonnessen (2009)
Intensity Zone
(%HRmax)
Case Study 1
Season One
(h:min·wk-1
)
Case Study 1
Season Two
(h:min·wk-1
)
Case Study 2
Season One
(h:min·yr-1
)
Case Study 2
Season Two
(h:min·yr-1
)
5 (95-100%) 0:45 (8.5%) 0:05 (0.5%) 8:00 (3.0%) 2:00 (0.5%)
4 (90-95%) - 0:40 (4.0%) 33:00 (12.0%) 13:00 (2.5%)
3 (85-90%) 0:30 (5.5%) 1:00 (5.5%) 36:00 (13.0%) 50:00 (10.0%)
2 (75-85%) 3:05 (36%) 1:00 (5.5%) 49:00 (18.0%) 20:00 (4.0%)
1 (55-75%) 4:20 (50%) 15:20 (85%) 149:00 (54%) 412:00 (83.0%)
Weekly total
Annual total
8:40
420:00
18:05
850:00
275:00
497:00
The effectiveness of a large volume of low intensity training is challenged by a study
manipulating the training of well-trained cross-country skiers over two years (Gaskill et al.,
1999; Table 2.5). All of the athletes completed the same high volume training in the first year,
consisting of 84 and 16% of training below and above the LT, respectively. Half of the group
responded positively to this training, with increases in VO2max and LT of >7 and >10%,
respectively, and these athletes maintained the same training for year two. The athletes that
did not respond, more than doubled their high intensity training time above the LT to 45%,
subsequently decreasing sub-LT training to 55%. There was no difference in the overall
training volume between the groups in the second year of training, although the increased
high intensity training meant that the treatment group had a significantly higher training load.

34
In the second year of training, both groups improved VO2max and LT (Table. 2.5). The TID in the
first year of training is very similar to that of other elite endurance athletes (Table. 2.2). The
response of the treatment group is in contrast to the studies that have reported a greater
improvement in performance and physiological adaptation following more training in zone
one (Ingham et al., 2008; Esteve-Lanao et al., 2007; Esteve-Lanao et al., 2005).
Table.2.5 Results of the study by Gaskill et al., (1999)
Year Group TID Result
One Both 84% <LT, 16% >LT Half of the group responded positively (Responders) Half of the group did not respond (Non-responders)
Two Responders Non-responders
84% <LT, 16% >LT 55% <LT, 45% >LT
Responded positively Responded positively
LT: Lactate Threshold (sudden increase in blood lactate concentration at 3-5mmol∙L-1)
The concept that a more effective training programme includes both a high overall training
volume and a high training volume in zone one is also challenged by Evertsen et al (1999);
Table. 2.6). For two months, the training of a group of elite cross-country skiers trained was
the same. For the following five months, two training groups were formed, that differed in
both training volume and training intensity. A moderate intensity group trained with 86% of
training time in zone one (<1.5mmol.L-1 blood lactate concentration) and 14% in zone two (3-
4mmol.L-1 blood lactate concentration). In contrast, a high intensity group trained with 17 and
86% of training in zones one and two, respectively. The performance in a simulated 20min
race was improved significantly more in the high intensity group. In addition, the LT improved
in the high intensity group, but not the moderate intensity group. Therefore, despite the
training volume being lower in the high intensity group, and this group only using zone one
training for restitution, the performance and physiological adaptation was higher in this group
than a group training with a greater overall volume and a greater volume in zone one.

35
Table.2.6 Results of the study by Evertsen et al., (1999)
Group Duration Volume (hrs∙wk
-1)
Zone 1 (%)
Zone 2 (%)
Performance improvement (%)
Both 2mo 10 84 16 - Mod 5mo 16 86 14 1.9 High 5mo 12 17 83 3.8*
Mod: Moderate intensity group, High: High intensity group, Performance: 20min simulated race,
* Significantly higher than Mod group.
2.2.5 The Polarised Training Model
Studies using the SGA have shown that a polarised training model (Fig. 2.8) is effective in elite
and well-trained endurance athletes (Esteve-Lanao et al., 2007; Seiler & Kjerland 2006;
Fiskerstrand & Seiler 2004; Billat et al., 2001). Indeed, Fiskerstrand & Seiler (2004) reported
how the training in elite rowers had become more polarised in the past 30 years. In addition,
a polarised training model was reported to be more effective than a training model
emphasising more training time in zone two (Esteve-Lanao et al., 2007). However, it is not
possible to tell if a training programme was polarised when analysing the training using the
TIZA (Sandbakk et al., 2010; Guellich et al., 2009; Zapico et al., 2007; Lucia et al., 2000a; Lucia
et al., 2000b). The TIZA underestimates time in zone three, and can therefore make a training
programme that is polarised in nature, appear otherwise (Esteve-Lanao et al., 2007; Seiler &
Kjerland 2006).
It has been reported that the periodisation of TID over the course of a season involves shifting
the zone one training to a lower intensity and the higher intensity training (zones two and
three) to higher intensities (Guellich et al., 2009). This can be achieved through race selection
in elite cyclists, with races containing mainly flat profiles early in the season and mountainous
races as the season progresses (Schumacher & Mueller 2002). It therefore seems that training
becomes more polarised throughout a training season.

36
Less experienced athletes have been found to train harder than prescribed (zone two) during
prescribed low intensity sessions (zone one) and not hard enough (zone two) during
prescribed high intensity sessions (zone three) (Foster et al., 2001b). The zone three training
sessions are believed to be essential in eliciting maximal performances, yet they cannot be
performed optimally if prescribed zone one training sessions are actually performed in zone
two (Bruin et al., 1994), at least in part due to the delayed recovery (Seiler et al., 2007).
2.2.6 The Threshold Training Model
2.2.6.1 Well-Trained Endurance Athletes
Groups of cross country skiers and marathon runners have been reported to spend less time in
zone two than in zone three, using the SGA (Seiler & Kjerland 2006; Billat et al., 2001); Table.
2.2). Even though it was the intensity of their specialist distance, elite marathon runners have
been shown to spend just 4% of training time at the intensity corresponding to the LT (Billat et
al., 2001). A group of elite runners spending more time in zone two (14%) and a higher
training volume (174km) were reported to be slower over 10km and had a lower VO2max than a
group with a lower training volume (158km) and less time spent in zone two (7%) (Billat et al.,
2003). This could be suggestive that training in zone two could have a negative effect upon
performance and physiological adaptation.
It has been suggested that in elite endurance athletes training with high training loads, too
much training in zone two might generate excessive sympathetic stress (Chwalbinska-Moneta
et al., 1998) while still providing a sub-optimal stimulus for eliciting further gains in capacity
(Londeree 1997). This may lead to excessive fatigue, potentially via a down-regulation of the
sympathetic nervous system (Esteve-Lanao et al., 2007). The overstrain due to training
excessively in zone two has also been suggested to be due to substrate depletion and
incomplete recovery (Steinacker et al., 1993). With very high training loads, the intensity has

37
to be reduced, and thus there has been more attention on training in zone one (Steinacker et
al., 1993). In well-trained runners with a mean weekly time of ≥6 hours, when training time in
zone two exceeded 20%, no further beneficial adaptations occurred as opposed to increasing
time in zone one (Esteve-Lanao et al., 2007). In addition, it has been suggested that a high
percentage of tempo training in zone two (>30%) does not improve performance and VO2max
compared to training with only 5-10% tempo training (Jensen et al., 1993).
2.2.6.2 Untrained Individuals
Moderate intensity training (~55-85% HRmax) for 20 to 60 minutes (at least 3d·wk-1) is
recommended for improving and maintaining cardiorespiratory fitness in non-athletes (ACSM,
1998). This type of training has been reported to be effective at inducing large gains in
physiological adaptation in previously untrained individuals (Table. 2.7). The highest exercise
intensity that can be maintained for a prolonged period of time is the intensity at the zone 2/3
boundary (Beneke, 1995), and is therefore very attractive to untrained individuals. This TID
corresponds to the threshold training model (Seiler & Kjerland 2006).
Table.2.7 Studies showing a physiological adaptation following training in zone two in untrained subjects. All studies used cycling and 100% of training was completed in zone two.
Study Frequency (d·wk
-1)
Duration (wks)
Training duration and intensity
Improvements
Yoshida et al., 1982
3 8 15min at an intensity corresponding to
4mmol.L-1 Bla
VO2max (14%) VO2 at LT (37%)
Denis et al., 1984 3-4 20 60min at 80-85% VO2max VO2max (19%) Power at 4mmol.L
-1
Bla (42%)
Takeshima et al., 1993
3 8 30min at LT VO2max (10%) VO2 at LT (18%)
Gaskill et al., 2001 3 6 50min at VT VO2max (16%)
VT (46%)
Bla: Blood lactate concentration.
The large increase in physiological adaptation in previously untrained individuals (Table 2.7)
does not appear to be limited to training in zone two (Londeree 1997). Indeed, a meta-

38
analysis coded training status and training intensities from 85 study groups and reported that
in sedentary subjects, every training intensity from below LT to above 4mmol·L-1 blood lactate
concentration improved performance, with no significant difference between the intensities
(Londeree 1997).
2.2.7 Training in Zone 1
Training in zone one has been reported to be effective in elite and well-trained endurance
athletes (Ingham et al., 2008; Esteve-Lanao et al., 2005; Fiskerstrand & Seiler 2004), but the
physiological mechanisms underlying this effectiveness are not well understood. Zone one
represents a wide intensity range in elite endurance athletes, due to the LT/VT1 being so high.
It has been suggested that a large fraction of zone one training takes place at ~60-65% VO2max
(Seiler & Tonnessen 2009). An elite endurance athlete (VO2max: 70-80mL·kg-1·min-1) training at
65% of VO2max (zone one) would have about the same muscular oxidative flux as an untrained
person training at or near VO2max, assuming similar active muscle mass (Seiler & Kjerland
2006). An elite athlete can train at 65% VO2max (zone one) for a long duration of time, and so
along with a large cellular energy turnover, this seems to be sufficient to provide an effective
stimulus for the induction of the various genes involved in mitochondrial biogenesis (Hood et
al., 2000a). Indeed, it has been reported in animals that low intensity training of
approximately 50% VO2max is sufficient to maximise the increase in mitochondria in type I
muscle fibres, but to induce significant increases in type II muscle fibres, much higher
intensities are needed (Dudley et al., 1987; Harms & Hickson 1983). As elite endurance
athletes have a large proportion of type I fibres, and maximising mitochondrial volume in
these fibres can occur with sub-LT training, it is no surprise that this constitutes the majority of
the training. Low intensity exercise of approximately 65% of VO2max has also been shown to
approximate the same intensity associated with maximal fat utilisation in trained subjects
(Achten & Jeukendrup 2003). It is possible that this stimulates an increase in lipolysis, which

39
will consequently decrease the blood lactate concentration, due to decreased carbohydrate
oxidation. Indeed, it has been reported that long distance runners have higher LTs than
middle distance runners (MacDougall et al., 1977), which is indirect evidence that a large
volume of sub-LT training is effective at increasing the LT. It is also possible that low intensity
training enhances recovery from high intensity training through in increase in peripheral blood
flow (Steinacker et al., 1998).
Zone one training causes less stress than training in zone two. It has been reported that in a
group of elite female rowers, a 2hr training session at approximately 60% VO2max (zone one)
caused minimal changes in blood hormones (cortisol, growth hormone, epinephrine,
norepinephrine) and immune-function measures (Nieman et al., 1999). A ‘J shaped curve’ has
been used to model the relationship between exercise and susceptibility to infection (Nieman
1994). An enhanced immune function above sedentary levels might be achieved with
moderate exercise (Matthews et al., 2002). In contrast, impaired immune function might
result from excessive amounts of prolonged, high-intensity exercise. Mechanisms behind
these changes are not well understood, but may relate to an increased level of catecholamines
(Moynihan et al., 1998). A catecholamine threshold occurs at the zone one-zone two
boundary (Chwalbinska-Moneta et al., 1998), and it is therefore possible that sub-LT training
causes less of an increase in catecholamines and therefore less chance of picking up an
infection.
A group of well-trained runners were found to have a faster recovery of the autonomic
nervous system (ANS; heart rate variability (HRV)) following up to 2hrs of training in zone one,
compared with training in zones two and three (Seiler et al., 2007). This study also showed no
difference in the recovery time of the ANS following training sessions in zones two and three.
The authors suggest that VT1 may demarcate a ‘binary’ threshold for ANS/HRV recovery in

40
highly trained athletes; because further delays in HRV recovery with even higher training
intensities were not observed. The results of this study could explain the results of some of
the descriptive studies (Table 2.2). The elite athletes spent a high percentage of training time
in zone one and this could have been because they are able to recover so quickly from zone
one training, whereas a large amount of training in zone two would have led to a longer
recovery time for the ANS.
2.2.8 Training in Zone 2
Training in zone 2 (at the MLSS) twice per week for six weeks has been reported to lead to
increases in physiological adaptation in trained endurance runners (Billat et al., 2004).
Training time at the MLSS increased from 30 to 60 min and the result was increases in VO2max,
LT, MLSS and time to exhaustion at the MLSS. The authors suggest that the most probable
explanation for this improvement was an increase in lactate clearance. Improvements in the
running speed associated with a blood lactate concentration of 4mmol·L-1 have been reported
in a group of well-trained runners following 14wks of training, including one 20min training
session with a blood lactate concentration of 4mmol.L-1 (Sjodin et al., 1982). This study also
reported a negative relationship between the change in the blood lactate concentration
during the 20min training session and the improvement in the speed associated when it was
4mmol.L-1, suggesting the training stimulus was greatest at this sustained intensity.
Improvements in both performance and physiological adaptation have been reported to be
higher when 83% of training time was spent in zone two as opposed to 14% for five months in
well-trained cross-country skiers (Evertsen et al., 1999). In fact, other studies have shown elite
athletes to spend more time in zone two than zone three during a period of training (Tjelta &
Enoksen 2010; Billat et al., 2003; Mujika et al., 1995). Performance was improved by 4-11% in
the elite swimmers in the study by Mujika et al (1995). These studies provide evidence that

41
training in zone two can be beneficial in trained endurance athletes, but the reported time
spent in zone 2 is still relatively low.
Two similar studies reported no difference in physiological adaptation after training
continuously at the MLSS/anaerobic threshold (AnT) (zone two) compared with intervals at
alternating intensities above and below the MLSS/AnT (Philp et al., 2008; Keith et al., 1992).
Both studies used moderately trained males, training for 8wk. In the study by Keith et al
(1992), the subjects progressed from cycling 2 to 4d·wk-1, with the continuous group cycling
for 30min at the AnT, while the interval group alternated between intensities 30% above and
below the AnT for 7.5min each, for the same total duration. Improvements were found in
both groups for VO2max, AnT and TTE at AnT, with no differences between the groups. In the
study by Philp et al (2008), the subjects trained on a treadmill for 2d·wk-1, progressing from 21
to 33min·session-1. The continuous group ran at the MLSS, while the interval group alternated
between 0.5km.hr-1 above and below the MLSS for the same total duration. Improvements
were found in both groups for VO2max, LT and MLSS, with no differences between the groups.
It has been suggested that the optimum training intensity for eliciting maximum gains in
endurance performance is from the highest intensity maintained in a steady state
(Kindermann et al., 1979). At this exercise intensity, the skeletal muscle cells experience a
high stimulation of oxidative metabolism and can be held for a prolonged period of time, as
the mechanisms which lead to blood lactate production are only being used minimally
(Kindermann et al., 1979). It has been proposed that the exercise intensity which elicits the
maximal blood lactate removal from the circulation (MLSS) should induce specific adaptations
of the lactate removal mechanism. However, as seen previously, Keith et al (1992) found no
support for the blood lactate at the AnT representing the optimal training intensity.

42
2.2.9 Training in Zone 3
High intensity training (HIT) needs to be carefully incorporated into a training programme, as
large volumes of HIT can lead to a down regulation of the central nervous system (Esteve-
Lanao et al., 2007). This is consistent with a hormonal exhaustion syndrome (Lucia et al.,
2001). In a pilot study, Esteve-Lanao et al (2007) assessed the effect of an increased amount
of zone three training. When zone three training accounted for up to 15% using the TIZA (this
would be a considerably larger percentage for the SGA), the training was too demanding for
well-trained runners to be followed for more than two to three weeks, and resulted in most of
the runners showing signs of overreaching/overtraining. In fact, during highly demanding
endurance events such as the Tour de France, the amount of time spent in zone three during
the race does not surpass 10% of the total race time, using the TIZA (Foster et al., 2005; Lucia
et al., 2003; Lucia et al., 1999b). However, with the correct amount of training in zone three,
large performance gains are possible in already well trained endurance athletes (Westgarth-
Taylor et al., 1997; Weston et al., 1997; Lindsay et al., 1996). Indeed, it has been reported that
for well-trained endurance athletes, some training needs to take place in zone three for an
enhancement in physiological adaptation and performance (Londeree 1997). However, it
seems that for HIT to be as effective as possible, the minimal training volume for the particular
event first needs to be achieved (Iaia et al., 2009). High intensity sessions appear to be well
tolerated when variation in intensity of training is ensured (Lehmann et al., 1992). Therefore,
the effectiveness of a polarised training model could be in some way due to the very different
training intensities (zone one and zone three), as opposed to a monotonic zone two training in
the TTM, as this has been shown to protect against overtraining (Foster 1998). Research on
TID has shown that the training programmes of all elite and well trained endurance athletes
include high intensity training (zone three) (Table. 2.2). Training in zone three has been
reported to be the most effective training for inducing increases in VO2max (Rusko & Bosco
1987), which has been shown to be an important determinant of endurance performance

43
(Billat et al., 2003). HIT normally involves repeated bouts of exercise at an intensity
corresponding to zone three, in a three-zone training intensity model. These bouts are usually
ten seconds to five minutes in duration, with a short period of low intensity exercise or rest in
between to allow a partial, but often not a full recovery (Laursen & Jenkins 2002b).
2.2.9.1 Well-Trained Endurance Athletes
Three studies from South Africa were the first to experimentally assess the effectiveness of HIT
in well-trained athletes (Westgarth-Taylor et al., 1997; Weston et al., 1997; Lindsay et al.,
1996); Table 2.8). No HIT was completed in the 3-4 months before the commencement of the
studies, and HIT replaced ~15% of the ~300km training volume in this group of cyclists, and
this training volume was not different during the intervention as before. Moderate intensity,
prolonged training at 70-75% VO2peak made up the rest of the training. These studies show the
effectiveness of this interval training programme at improving performance in already well-
trained cyclists. The significant improvements in the 40km TT were associated with the
subjects being able to sustain a significantly higher absolute and relative power output
(Westgarth-Taylor et al., 1997; Lindsay et al., 1996). The improvements in TTE at 150% PPO
demonstrate an improvement in muscular resistance to fatigue and therefore, anaerobic
performance (Lindsay et al., 1996). The acute responses and effects to an interval training
session might give insight into the effectiveness of these interval training sessions. An interval
training session involving 8*5min at 82.5% PPO (1min active recovery) was assessed in highly
trained endurance athletes (Stepto et al., 2001); Table 2.9). These findings demonstrate that
this particular interval training session involves high rates of glycogenolysis and total energy
expenditure.

44
Table. 2.8 Performance and physiological changes following a period of high intensity interval
training in trained endurance athletes
HIT: High Intensity Training, PPO: Peak Power Output, TT: Time Trial, TTE: Time To Exhaustion,
Vmax: The minimum intensity during an incremental test in which VO2max is attained, Pmax:
The minimum power to elicit VO2, Tmax: The TTE at Vmax/Pmax, VT: Ventilatory Threshold, LT:
Lactate Threshold.
Table.2.9 Responses to an acute interval training session (Stepto et al., 2001)
BLa: Blood Lactate Concentration, HR: Heart Rate, CHO: Carbohydrate, RER: Respiratory Exchange
Ratio.
Study Duration (wks)/ No. of
HIT sessions
Interval session Discipline
Reps: (no*duration@intensity) (Rest duration)
Performance improvements
Physiological changes
Lindsay et al., 1996
4 6
Cycling 6-8*5min@80%PPO (1min)
40km TT (8%) PPO (4%) TTE at 150% PPO (20%)
Weston et al., 1997
4 6
Cycling 6-8*5min@80%PPO (1min)
40km TT (2%) PPO (3%) TTE at 150% PPO (22%)
Westgarth-Taylor et al., 1997
6-7 12
Cycling 6-9*5min@80%PPO (1min)
40km TT (12%) PPO (5%) TTE at 150% PPO (22%)
Creer et al., 2004
4 8
Cycling 4-10*30s@all-out (4min)
PPO (6%)
VO2max (5%) Motor unit activation
Smith et al.,
2003
4 8
Running 6*60%Tmax@Pmax (1:2)
3km run time (3%) Tmax (23%)
VT (7%)
Driller et al., 2009
4 8
Rowing 8*2.5min@90%PPO
(≤70%HRmax)
2km TT power (6%) VO2peak (7%)
Physiological measure Value (rep no.)
Bla (mmol·L-1
) 5-6 (1-8)
HR (bpm) 156(1), 162-167(2-8)
Arterial oxygen saturation (%) 95.6 (1), 94 (2-7)
CHO oxidation (μmol·kg-1
·min-1
) 340 (1-8)
Fat oxidation (μmol·kg-1
·min-1
) 16-25 (1-8)
RER 0.97-0.92 (1-8)
Muscle glycogen (mmol·kg-1
) dry mass 501-243 (pre to post)

45
2.2.9.2 Optimising High Intensity Training
2.2.9.2.1 Programme
It is not possible to assess whether the interval training sessions presented in Table. 2.8 are
optimal at inducing performance and physiological gains. Intervals of 4min duration at 85%
peak power output (PPO) were found to be the most effective at inducing improvements in
both 40km TT performance and PPO in trained cyclists (Stepto et al., 1999); Table. 2.10).
Intervals of 30s duration at 175% PPO with 4.5 min recovery were also found to be effective at
inducing an improvement in 40km TT performance, but not for inducing an improvement in
PPO. This is intriguing, as it does not conform to the concept of specificity, which states that
training has to be at or near the intensity of the event to have the greatest benefit. Little or no
enhancement in 40km TT performance was found following the 1min and the 8min intervals.
These different responses between the 4min and the 30s intervals of different intensities
suggests that different mechanisms are responsible for the improved performance following
HIT. Pmax has been defined as the minimum power required to elicit VO2max and Tmax is the time
to exhaustion at Pmax. Intervals of 60%Tmax duration at an intensity of Pmax with a recovery
consisting of the HR dropping to 65% HRmax (mean 2.6min) were shown to provide the most
consistent improvements in endurance performance (Laursen et al., 2002b); Table. 2.10). All
three interval training groups in the study by Laursen et al (2002b) improved 40km TT
performance, PPO and VO2peak, but group 2 improved more than group 3 in PPO and VO2peak,
whereas group 1 did not improve these measures to a greater extent than group 3 (Table.
2.10). Although these interval training sessions have been found to be effective, it should be
stressed that the minimum volume of training should also be completed in a particular event
for the high intensity training to be most effective (Iaia et al., 2009; Jones & Carter 2000).
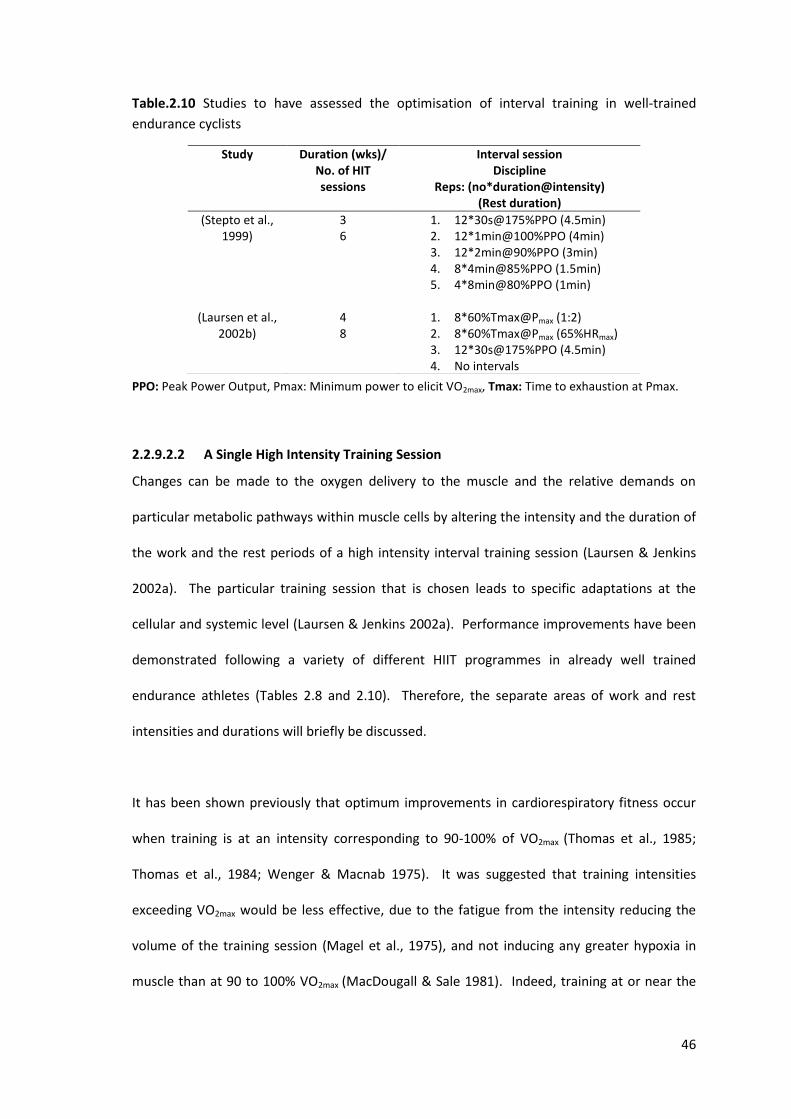
46
Table.2.10 Studies to have assessed the optimisation of interval training in well-trained
endurance cyclists
PPO: Peak Power Output, Pmax: Minimum power to elicit VO2max, Tmax: Time to exhaustion at Pmax.
2.2.9.2.2 A Single High Intensity Training Session
Changes can be made to the oxygen delivery to the muscle and the relative demands on
particular metabolic pathways within muscle cells by altering the intensity and the duration of
the work and the rest periods of a high intensity interval training session (Laursen & Jenkins
2002a). The particular training session that is chosen leads to specific adaptations at the
cellular and systemic level (Laursen & Jenkins 2002a). Performance improvements have been
demonstrated following a variety of different HIIT programmes in already well trained
endurance athletes (Tables 2.8 and 2.10). Therefore, the separate areas of work and rest
intensities and durations will briefly be discussed.
It has been shown previously that optimum improvements in cardiorespiratory fitness occur
when training is at an intensity corresponding to 90-100% of VO2max (Thomas et al., 1985;
Thomas et al., 1984; Wenger & Macnab 1975). It was suggested that training intensities
exceeding VO2max would be less effective, due to the fatigue from the intensity reducing the
volume of the training session (Magel et al., 1975), and not inducing any greater hypoxia in
muscle than at 90 to 100% VO2max (MacDougall & Sale 1981). Indeed, training at or near the
Study Duration (wks)/ No. of HIT sessions
Interval session Discipline
Reps: (no*duration@intensity) (Rest duration)
(Stepto et al., 1999)
3 6
1. 12*30s@175%PPO (4.5min) 2. 12*1min@100%PPO (4min) 3. 12*2min@90%PPO (3min) 4. 8*4min@85%PPO (1.5min) 5. 4*8min@80%PPO (1min)
(Laursen et al.,
2002b)
4 8
1. 8*60%Tmax@Pmax (1:2) 2. 8*60%Tmax@Pmax (65%HRmax) 3. 12*30s@175%PPO (4.5min) 4. No intervals

47
VO2max should provide the optimal stimulus for adaptation in this measure, as this is the
intensity whereby the physiological processes and structures are under maximal stress
(Midgley & Mc Naughton 2006). Interval training has been reported to be more effective than
continuous training at eliciting VO2max, and VO2max has been shown to be maintained for longer
during interval training (Billat et al., 2000). To achieve peak cardiovascular responses, the
optimal duration of each interval appears to be 4min (Seiler & Sjursen 2004). In the study by
Seiler and Sjursen (Seiler & Sjursen 2004), a group of well-trained runners replaced one HIT
session per week for four weeks with a training session in the laboratory. These sessions were
self-paced, and performed with a 1:1 work: recovery ratio; 24*1min, 12*2min, 6*4min and
4*6min. The highest average VO2 and HR was achieved by 6 of the 12 runners during the 4min
intervals. In an individual interval training session involving 4 min intervals, it has been
suggested that 30min of work in the near VO2max range is the upper limit (Seiler & Hetlelid
2005).
The research therefore suggests that 4min intervals at an intensity of 95-100% VO2max are most
likely to lead to optimal performance benefits. During a 6*4min interval training session in
well trained runners, a 2min recovery period has been reported to be optimal (Seiler &
Hetlelid 2005). In this study, the intensity of the 4min work periods were self-selected and the
subjects used either 1, 2 or 4min recovery periods during separate training sessions, one week
apart. The instruction given for the work periods was to maintain the highest average running
speed. From 1 to 2min recovery, there was an increase in running speed and VO2, but there
was no additional effect from increasing the recovery period to 4min. In addition, there was
no difference between the different recovery periods for blood lactate concentration or HR.
The average work intensity was 95-100% VO2max and 6-7mmol·L-1 blood lactate concentration.
To further emphasise the effectiveness of a 2min recovery period, the same authors (Seiler &
Hetlelid 2005), asked the same runners to complete 6*4min intervals at the highest average

48
speed from the original study. The runners were instructed to self-select a recovery period
that would allow them to complete the interval session and were provided no feedback (time,
HR). Despite RPE and blood lactate concentration increasing throughout the intervals, the
recovery period remained essentially unchanged between each interval, with the mean
recovery time being 118s. The authors suggest that this recovery may be effective, as it allows
for the re-establishment of intracellular concentrations of [Pi] and [H2PO4], which are
important in contractile fatigue. In support of the 2min rest periods, two groups of well-
trained athletes completing the same interval training session with the exception of the rest
duration found that a recovery period of 2.6min was more effective at inducing increases in
performance and physiological adaptation than a recovery period of 4.2min (Laursen et al.,
2002a).
2.2.10 Training Intensity Distribution During Competition
Assessing the training load and the TID of world class endurance cyclists during a three week
cycle stage race may give us an enhanced understanding of what an elite endurance athlete is
capable of (Table. 2.11). The training load (TRIMP) is very similar between different 3wk cycle
tour events, despite the different lengths of the tours (Lucia et al., 2003) and also from the
same tour but in different years (Foster et al., 2005). Therefore, there might be an upper limit
to the sustainable rate of relative energy expenditure in these events (Foster et al., 2005). It
seems that athletes pace themselves over these multi-day events (Foster et al., 2005; Foster et
al., 2004)), just as they would over a single event (Foster et al., 2004). Indeed, it has been
suggested that anticipation of the total activity and metabolic changes required to complete a
given exercise task uses a central ‘programmer’ (Ulmer 1996). The athletes’ body avoids
damage and premature fatigue by allowing the programmer to regulate the systems. This
type of regulation from the central nervous system is known as “teleoanticipation” (St Clair et
al., 2001).

49
Table. 2.11 The TID in 3wk cycle tour races in professional road cyclists. All studies used VT to demarcate three intensity zones assessed the TID using HR and the TIZA.
TdeF: Tour De France, VaE: Vuelta a Espana.
The TID in different 3wk cycle tours and between different years is remarkably similar (Table.
2.11). This is presumably what an elite endurance cyclist is capable of over a prolonged period
of time. It is interesting that the TID in these 3wk races is similar to that during a ~3month
period of training in elite road cyclists (Zapico et al., 2007). There was no improvement in
physiological adaptation after this training period in the study by Zapico et al (2007), but there
was in another group of elite road cyclists spending more time in zone one and less time in
zone two (Lucia et al., 2000a; Lucia et al., 2000b). During the 3wk cycle tour races, there is a
progressive decrease in HRmax (Lucia et al., 2003). This is a sign of decreased sympathetic
nervous activity and overreaching (Hedelin et al., 2000). As elite road cyclists are accustomed
to the training volume required during a 3wk cycle tour race (Lucia et al., 2000a;Lucia et al.,
2000b), the overreaching must be caused by the increased training load. The cyclists in the
study by Zapico et al (2007) had a lower HRmax following the training, and therefore were likely
to be overreaching. It is therefore likely that the TID in a 3wk cycle tour race may not be
optimal to maximise the physiological adaptation and performance gains during training.
2.2.11 Summary of the Training-Intensity Distribution Section
Descriptive studies assessing the training-intensity distribution in elite endurance athletes in a
number of different sports have reported that these athletes train with a high training volume.
These athletes spend more than 80% of their training time at exercise intensities lower than
the LT, and therefore, less than 20% of training time below the LT. This training-intensity
Study Race TID
Lucia et al., 1999b TdeF 70-23-7
Lucia et al., 2003 TdeF VaE
75-23-2 72-25-3
Foster et al., 2005 TdF and VaE Yr 1: 70-24-6 Yr 2: 71-24-5

50
distribution is therefore effective, as it is adopted by elite endurance athletes, but not
necessarily optimal. In addition, this training-intensity distribution may be effective in only the
most successful endurance athletes. Experimental studies support the effectiveness of
training in zone one, and this is likely due to physiological adaptations that can be achieved
with high volume endurance training, and an enhanced recovery compared with training in
zones two or three. There are however, some studies that have reported greater
improvements in performance following an increase in the proportion of higher intensity
training. The research assessing an optimal training-intensity distribution is therefore
inconclusive.

51
2.3 TRAINING-INTENSITY SPECIFIC ADAPTATIONS
2.3.1 Studies Assessing the Impact of Exercise Intensity
When the total workload is matched, several responses to exercise of different intensities do
not show a consistent trend (Tables 2.12-2.15). However, the literature reveals that there is a
more consistent increase in performance and physiological adaptation following higher-
intensity exercise (Tables 2.12 and 2.15). The lack of difference in response from exercising at
different intensities could be due to the differences in the exercise intensity not being
sufficiently high enough in these particular studies. If the metabolic stresses on the different
exercise intensities are too similar, this may not be sensitive enough to detect a different
response. For example, if two different exercise intensities are between the LT and the MLSS
(zone 2), the metabolic stress will be similar, and therefore responses are likely to be similar.
However, by training in the different training zones in a three zone training-intensity model,
demarcated with either blood lactate concentration or ventilatory equivalents, differences are
more likely.

52
Table. 2.12 Studies to have assessed responses to exercise of different intensity with matched
total work and frequency and found intensity-dependent responses in favour of higher
exercise intensities.
>: A greater improvement, VO2max: Maximal Oxygen Consumption, SV: Stroke Volume, CO: Cardiac
Output, LT: Lactate Threshold, VT: Ventilatory Threshold, HR: Heart Rate. nsd: No significant difference,
Bla: Blood lactate concentration, TT: Time trial, a-VO2diff: Arterio-venous oxygen difference, MAOD:
Maximal Accumulated Oxygen Deficit, PPO: Peak Power Output, RSA: Repeated Sprint Ability, VE:
Ventilation.
Study/ Training Status/
(Study no.)
Frequency/ Duration
Discipline/ Groups
Results
(Helgerud et al., 2007)
Moderately trained
(1)
3d.wk-1
8wk
Running/treadmill 1. 47*15s at 90-95% HRmax 2. 4*4min at 90-95% HRmax 3. 45min at 70% HRmax 4. 24.25min at 85% HRmax
VO2max: 1,2 > 3,4 SV: 1,2 > 3,4 LT: nsd Economy: nsd
Daussin et al., 2007)
Untrained (2)
3d.wk-1
8wk
Cycling Randomised cross-over study design
1. 1min at 90% Pmax, 4min at VT 2. 61% Pmax continuously
VO2max: 1>2 COmax: 1>2 a-VO2diff: nsd PPO: 1>2 Peak BLa: 1>2
(Driller et al., 2009)
Well-trained (3)
2d.wk-1
4wk
Rowing Randomised cross-over study design
1. 8*2.5min at 90% all-out 2. 35-40min at 2-3mmol.L
-1 Bla
VO2peak: nsd 4min rowing power: nsd Power at 4mmol.L
-1 Bla: nsd
2km TT: 1>2
(Tabata et al., 1996)
Untrained (4)
5d.wk-1
6wk
Cycling 1. 7-8*20s at 170% VO2max 2. 60min at 70%VO2max
VO2max: nsd Anaerobic capacity (MAOD): 1>2
(Edge et al., 2005)
Untrained (5)
3d.wk-1
5wk
Cycling 1. 6-10*2min at 120-140% LT (90-100%
VO2max) 2. 20-30min at 80-95% LT (60-70%
VO2max)
VO2peak: nsd LT: nsd PPO: nsd Peak Bla: nsd RSA: 1>2
(Cunningham et al., 1979) Untrained
(6)
4d.wk-1
12wk
Cycling 1. 2min at 90-100% VO2max 2. 20min at 70-80% VO2max
VO2max: nsd a-VO2diff: 1>2
(Poole & Gaesser 1985)
Untrained (7)
3d.wk-1
8wk
Cycling 1. 10*2min at 105% VO2max 2. 35min at 70% VO2max (4-8mmol.L
-1
Bla) 3. 55min at 50% VO2max (<2mmol.L
-1
Bla)
VO2max: nsd LT: nsd VT: 1>2,3 VEmax: 1>2,3
(Edge et al., 2006)
Moderately trained
(8)
3d.wk-1
5wk
Cycling 3 6-10*2min at 90-100% VO2peak (120-
140% LT) 4 20-30min at 60-75% VO2peak (80-95%
LT)
VO2peak: nsd LT: nsd Buffering capacity: 1>2

53
Table 2.13 Studies to have assessed responses to exercise of different intensity with matched total work and frequency and found mixed results for intensity-dependent responses
MOC: Skeletal muscle mitochondrial oxidative capacity, TTE: Time to exhaustion, VT: Ventilatory
Threshold, PPO: Peak Power Output, ADK: Adenylate Kinase, Bla: Blood lactate concentration, RER:
Respiratory exchange ratio, CS: Citrate Synthase, HR: Heart Rate, SV: Stroke Volume.
Study/ Training Status
Frequency/ Duration
Discipline/ Groups
Results
(Franch et al., 1998)
Recreational runners
(9)
3d.wk-1
6wk
Running 1. 30-40*15s (20.4km.hr
-1)
2. 4-6*4min (16.6km.hr-1
) 3. 26min at 15km.hr
-1
VO2max: 3,2>1 TTE at 85% VO2max:3>2,1
(Gorostiaga et al., 1991)
Untrained (10)
3d.wk-1
8wk
Cycling 5 30s at 100% VO2max, 30s rest 6 30min at 50% VO2max
VO2max: 1>2 PPO: 1>2 ADK activity: 1>2 Bla and RER at a relative work rate: 2>1 CS activity: 2>1
(Daussin et al., 2008)
Untrained (11)
3d.wk-1
8wk
Cycling Randomised cross-over study
7 1min at 90%Pmax, 4min at VT 8 61% Pmax continuously
VO2max: nsd HRmax: 1>2 SV: 1>2 TTE: 1>2 VO2 kinetics: 1>2 MOC: 1>2 Capillary density: 2>1

54
Table 2.14 Studies to have assessed responses to exercise of different intensity with matched
total work and frequency and found no intensity-dependent responses.
AnT: Anaerobic Threshold, MLSS: Maximal Lactate Steady State, TTE: Time To Exhaustion, HR: Heart
Rate, Bla: Blood lactate concentration, VT: Ventilatory Threshold, PPO: Peak Power Output, CS: Citrate
Synthase, HAD: β-hydroxyacyl-coenzyme A dehydrogenase, PFK: Phosphofructokinase.
Table 2.15 Responses to different exercise intensities on key measures of endurance, from the
studies reviewed in tables 2.12 to 2.14
Measure Higher intensity>lower intensity
No difference between exercise intensities
Lower intensity>higher intensity
VO2max/VO2peak 1, 2, 10 3-9, 11-16 LT/VT1 7 1, 2, 7, 8, 13, 15, 16
VT2/AnT/MLSS 2 3, 14, 16 Economy 1, 2
Maximal performance 1, 3, 5, 10, 11 3, 5, 12, 14, 15
LT: Lactate Threshold, VT: Ventilatory Threshold, AnT: Anaerobic Threshold, MLSS: Maximal Lactate
Steady State.
Study/ Training Status
Frequency/ Duration
Discipline/ Groups
Results
(Eddy et al., 1977)
Untrained (12)
4d.wk-1
7wk
Cycling 1. 1min at 100% VO2max 2. 70% VO2max
VO2max: nsd TTE at 80% VO2max: nsd Submax HR, VO2, Bla: nsd Peak Bla: nsd
(Overend et al., 1992)
Untrained (13)
4d.wk-1
10wk
Cycling 1. 30s at 120%VO2max 2. 3min at 100% VO2max 3. 80% VO2max
VO2max: nsd VT: nsd
(Keith et al., 1992)
Moderately trained
(14)
2-4d.wk-1
8wk
Cycling 1. AnT 2. 30% above and below AnT
VO2max: nsd AnT: nsd TTE at AnT: nsd CS, HAD, PFK activity: nsd
(Berger et al., 2006)
Untrained (15)
3-4d.wk-1
6wk
Cycling 1. 60% VO2max 2. 20*1min at 90% VO2max
VO2peak: nsd VT: nsd PPO: nsd
(Philp et al., 2008)
Moderately trained
(16)
2d.wk-1
8wk
Running/treadmill 1. MLSS 2. 0.5km.hr
-1 above and below the
MLSS
VO2max: nsd LT: nsd MLSS: nsd

55
2.3.2 Exercise Intensity Effects on Physiological Adaptation
2.3.2.1 VO2max
When the total work performed during a period of training is matched, it has been reported
that the VO2max is increased more following exercise of a higher intensity (Helgerud et al.,2007;
Daussin et al., 2007; Gorostiaga et al., 1991). These three studies compared high intensity
interval training with moderate intensity continuous training (Table. 2.12). It would appear
that the greater increase in VO2max in these studies following the higher exercise intensity was
due to cardiovascular adaptations. Indeed, Helgerud et al (2007) and Daussin et al (2007) both
reported greater increases in stroke volume following the higher intensity training. In
addition, Gorostiaga et al (1991) reported lower blood lactate concentrations at relative
intensities, lower respiratory exchange ratio and an enhanced citrate synthase activity
following the moderate intensity training, despite the VO2max increasing more following high
intensity training. This would suggest that cardiovascular adaptations (SV, CO) were the cause
of the greater increase in VO2max. Indeed, despite reporting no difference in the increase in
VO2max between high and moderate intensity exercise training, Daussin et al (2008) also found
a greater increase in SV following high intensity training. However, Cunningham et al (1979)
reported the a-vO2diff to be improved more following high than moderate intensity training,
but there were no differences in the increase in VO2max. The increased SV following high
intensity exercise training in these studies is likely to be due to an increased left ventricular
size and wall thickness, along with increases in erythrocyte mass and plasma volume (Table.
2.1). Indeed, high intensity training (85-90% VO2max) 5d·wk-1 for 10wk led to a 71% increase in
VO2max compared to training at a lower intensity (60-70% VO2max) in rats and mice (Kemi et al.,
2005). Isolated heart muscle cells (cardiomyocytes) from the left ventricle were analysed to
assess the effectiveness of these different training intensities on adaptations to the heart.
High intensity interval training lead to a greater increase in contractile capacity of the
cardiomyocytes than moderate intensity training. This was reported to be due to increasing

56
the extent and the rate with which it shortens during systole and relaxes during diastole and
by improving its ability to generate force, independent of neurohormonal influences. In
addition, high intensity exercise has been reported to induce a hypertrophic response in the
cardiomyocytes (Wisloff et al., 2001). The intensity specific adaptations to an isolated
cardiomyocyte are shown in Fig. 2.9.
Fig. 2.9 Exercise intensity dependent adaptations of VO2max and cardiomyocyte
function/structure. Taken from Wisloff et al (2009).
2.3.2.2 Lactate Threshold
The majority of studies to have compared exercise training of different intensities, but with
the total work matched, have found no difference in the improvement in LT following high
intensity versus moderate intensity exercise (Tables 2.12 to 2.15). An increase in LT has been
linked with an increased concentration of the lactate transporters, MCT1 and MCT4 (Wilson et
al., 1998; McCullagh et al., 1996). It has been reported that 5 months of training in a group of
elite cross country skiers, including 83% of training at a high intensity (3-4mmol·L-1 blood
lactate concentration) and 17% of training at a lower intensity (<1.5mmol·L-1 blood lactate
concentration) significantly improved the LT (Evertsen et al., 2001). However, following 86%
low intensity training and 14% high intensity training, the LT did not improve and
concentration of MCT1 actually fell over the 5 month training period. The authors suggest this

57
was due to the training not including as much high intensity as during the season, as the pre-
training biopsies were taken soon after the racing season, and so the concentration of MCT1
was likely to be high due to the high intensity racing. Therefore, although neither group
improved the concentration of either MCT1 or MCT4, the concentration of MCT1 was
maintained more effectively with the higher intensity training. It has been reported that
MCT4 is less active at lactate concentrations of less than 10mmol.L-1(Juel & Halestrap 1999),
suggesting that high intensity training needs to be at an intensity to elicit a lactate
concentration of over 10mmol·L-1. In addition, it has been reported that the expression and
concentration of MCT1 in both rat and human skeletal muscle is increased following intense
training, but not following less intense training (Bonen et al.,2000; Pilegaard et al., 1999a;
Pilegaard et al., 1999b; Wilson et al., 1998; Baker et al., 1998; Bonen et al., 1998; McCullagh et
al., 1996).
Buffering capacity has been reported to be increased more following high intensity than
moderate intensity training in moderately trained individuals (Edge et al., 2006). Indeed, high
intensity training has been reported to increase the buffering capacity in well-trained
endurance athletes (Stepto et al., 2001; Weston et al., 1997). During high intensity interval
training, as each subsequent exercise bout is performed at a progressively lower pH, the
mechanism controlling pH is placed under large stress (Costill et al., 1984). The lower pH is
due to an accumulation of H+, due to the intensity being above the LT (Chwalbinska-Moneta et
al., 1989). This leads to a greater buffering capacity to help maintain the pH, and therefore an
enhanced LT (Costill et al., 1984).
The lactate exchange ability could be improved from an increased capillary density, due to an
increased exchange area and a decreased distance between the site of lactate production and
the capillary wall (Messonnier et al., 2002). Exercise intensity seems to provide a larger

58
stimulus for capillary growth than exercise duration (Iaia et al., 2009). Changes in angiogenesis
have been suggested to be related to the increase in blood flow and thereby shear stress
(Hellsten et al., 2008; Milkiewicz et al., 2001), and to the mechanical stretch associated with
muscle contractions (Hellsten et al., 2008; Rivilis et al., 2002). Indeed, high intensity training at
150% VO2max has been reported to increase muscle capillarization (Jensen et al., 2004).
2.3.2.3 Exercise Economy
An increase in exercise economy is associated with a change in the expression of fast twitch
skeletal muscle fibres towards a more slow twitch phenotype (Dubouchaud et al., 2000).
There is evidence to suggest that a change in the ratio of type IIa to type IIb fibres occurs with
endurance training (Saltin 1977). However, the effect of exercise intensity on the conversion
of muscle fibre types is unknown. However, it is possible that training at too high an intensity
can be detrimental to exercise economy in runners (Franch et al., 1998). Interval training took
place at 94%, 106% and 132% VO2max, and while the running economy was significantly
improved in the 94% and 106% groups, it was not improved in the 132% group.
2.3.2.4 Mitochondrial Biogenesis
Endurance training of different intensities can lead to different molecular signals that induce
mitochondrial biogenesis (Laursen 2010). Prolonged endurance exercise and high volume
endurance training have been reported to increase intramuscular calcium, which can activate
calcium calmodulin kinases and lead to mitochondrial biogenesis (Rose et al., 2007). In
contrast, it has been reported that a single bout of HIT (>100% VO2max) generates a 20-50%
transient decrease in Ca2+ uptake and release (Matsunaga et al., 2002). As previously
mentioned, the increased AMP:ATP ratio due to endurance exercise has been shown to
activate AMPK (Hardie & Sakamoto 2006), which has been reported to be involved in the
initiation of mitochondrial biogenesis (Ojuka 2004; Puigserver & Spiegelman 2003). The
AMP:ATP ratio is increased most rapidly during HIT (Coffey & Hawley 2007). Indeed, 4*30s

59
‘all-out’ sprint efforts on a cycle ergometer have been reported to increase AMPK immediately
(Gibala et al., 2009). Three hours later, there was a 2-fold increase in PGC-1α mRNA and no
increase in calcium calmodulin kinases. An increase in AMPK has also been reported following
HIT (~90%VO2max) in a group of highly trained cyclists (Clark et al., 2004). A similar increase in
PGC-1α has been reported in rats following either 6hr∙d-1 of swimming carrying 2% body
weight and 14*20s with a weight equal to 14% body weight (Terada et al., 2005). However,
the activation of AMPK was almost twice as high in the HIT group. These findings suggest that
different molecular pathways are activated based on exercise-intensity. It is therefore
possible that by maximising these signalling pathways with the most effective training
programme could maximise mitochondrial biogenesis and therefore endurance performance.
An increase in enzyme activity may be exercise intensity dependent, as enzymatic processes
re-synthesise ATP during exercise. The higher the exercise intensity, the greater the ATP
turnover rate, and therefore, the activity of the enzymatic machinery may be increased in
skeletal muscle to maintain homeostasis (Evertsen et al., 1999). The intensity of exercise
needed for an increase in cytochrome c concentration in different fibre types is shown in
Table. 2.16. The authors (Dudley et al., 1982) attribute these finding to muscle recruitment at
increasing exercise intensities. Type I muscles are recruited up to ~95% VO2max, beyond which
less type I fibres are recruited. Type IIa muscle fibres are recruited up to ~85% VO2max, beyond
which there is no further recruitment in these muscle fibres. Finally, type IIb muscle fibres are
only recruited at exercise intensities over 73% VO2max. In addition, the study found that for the
same response of cytochrome c, the duration of exercise necessary to bring about the change
becomes less as the intensity is increased. It has also been suggested that high intensity
training could improve the aerobic potential of type IIa muscle fibres by making them more
fatigue resistant (Billat et al., 2003). Indeed, the recruitment of more fast-twitch fibres at
increasing exercise intensities has also been reported in humans (Gollnick 1985). Importantly,

60
it has been reported that increases in mitochondrial density and oxidative enzyme activities
are greatest in those muscles that are directly activated in training, with little or no adaptation
in the untrained limbs (Gollnick & Ianuzzo 1972). This is consistent with the idea that the
stimulus for mitochondrial biogenesis originates within the contractile muscle, independent of
humoral influences (Hood 2001). This idea is supported by findings that have shown high
intensity training causes increases in oxidative capacities in those specifically recruited skeletal
muscle fibres in well trained rats (Laursen et al., 2007). This was demonstrated with an
increase in the activity of citrate synthase in the white vastus muscle in the group that trained
at a high intensity, but not those that trained at a moderate intensity. Indeed, high intensity
training has been reported to increase the volume of muscle mass recruited in well-trained
cyclists (Creer et al., 2004; Lucia et al., 2000a).
Table. 2.16 Data from Dudley et al (1982). The response of cytochrome c concentration in
different muscle fibre types to exercise of different intensities. Rats trained 5d·wk-1 for 8wk at
different intensities.
Muscle type Response of cytomchrome c oxidase activity to different exercise intensities
Type I ↑up to 95% VO2max, ↓>95% VO2max Type IIa ↑up to 85% VO2max, nsd >85% VO2max Type IIb ↑ >73% VO2max
VO2max: Maximal oxygen consumption, nsd: No significant difference.
Including high intensity training into the training programme of already well-trained
endurance athletes leads to a positive improvement in performance, as previously shown
(Table. 2.8). However, it seems unlikely that this increase in performance is due to the
increase in the activity of oxidative enzymes (Table. 2.17). This could be because the aerobic
demands of the high intensity training were already sufficiently met by the pre training
oxidative capacity. Two studies (Hulston et al., 2010; Yeo et al., 2008) have shown an increase
in mitochondrial oxidative enzyme activity or total protein content in well-trained cyclists
following high intensity training, but only after training with reduced muscle glycogen, induced
by prior exercise. The performance improvement however, was not different between the

61
high and low glycogen training groups, and therefore there seems to be no advantage to the
adaptations to the enzymes reported in these studies.
In contrast, high intensity training has a large effect on oxidative enzyme activity in moderately
trained individuals (Table. 2.18). These three studies all used the same HIT training session,
which included 10 intervals of 4 minutes duration at ~90% VO2peak with a 2 minute rest
between each interval. It has also been reported that fewer intervals of shorter duration, but
higher intensity also induce a large improvement in both endurance performance and
oxidative enzyme activity (Table. 2.19). However, the increase in mitochondrial oxidative
enzyme activities does not seem to be dependent upon exercise intensity. With the total work
matched between groups, the maximal activities of citrate synthase and β-Hydroxyacyl-
Coenzyme A Dehydrogenase were increased, but not different in two groups training at
different intensities (Keith et al., 1992); Table. 2.14). In contrast, lower intensity exercise has
been shown to cause a greater increase in citrate synthase activity than high intensity
exercise, with the total work matched between the groups (Gorostiaga et al., 1991); (Table.
2.13).
The impact of training with very different exercise intensities and with very different total
work performed during the training period has been assessed (Burgomaster et al., 2008;
Gibala et al., 2006); Table. 2.20). These studies compared a group training with very high
intensity and low total work (high-intensity, low-volume) with a group training with low
intensity and high total work (low-intensity, high-volume). Following the training, both high-
intensity, low-volume and low-intensity, high-volume groups gained large improvements in
endurance performance and markers of enhanced exercise metabolism (Table. 2.20). The
authors demonstrated that an increase in exercise intensity can compensate for a lower
training volume in previously untrained individuals.

62
Table. 2.17 The influence of HIT on enzyme activities in well-trained endurance athletes
VO2max: Maximal oxygen consumption, PPO: Peak Power Output, CS: Citrate Synthase, HAD: β-
Hydroxyacyl-Coenzyme A Dehydrogenase, SDH: Succinate Dehydrogenase, Bla: Blood lactate
concentration, Tmax: Time to exhaustion at VO2max.
Table. 2.18 The influence of aerobic HIT on enzyme activities in moderately trained individuals
VO2max: Maximal Oxygen Consumption, TTE: Time to Exhaustion, CS: Citrate Synthase, HAD: β-
Hydroxyacyl-Coenzyme A Dehydrogenase, COX IV: Cytochrome C Oxidase Subunit IV.
Study Duration/ No. of HIT sessions
HIT Result
Weston et al., 1997 4wks 6
6-8*5min@80%PPO Endurance performance: ↑ CS: nsd HAD: nsd
Evertsen et al., 1999
5mo
Training at 80-90% VO2max: 83% Training at 60-70% VO2max: 17%
Endurance performance: ↑ CS: nsd SDH: ↑
Sjodin et al., 1982 14wks 0, 0.4 and 6.1hrs.wk
-1 below, at
and above 4mmol.L-1
Bla VO2max: ↑ CS: ↑
Kohn et al., 2010 6wks 12
6*60Tmax@94% peak treadmill speed
Endurance performance:↑ CS: nsd HAD: nsd
Study Duration/ No. of HIT sessions
Result
Talanian et al., 2007 13d 7
VO2peak: ↑ CS: ↑ HAD: ↑
Perry et al., 2008 6wks 18
VO2peak: ↑ TTE at 90% VO2peak: ↑ CS: ↑ HAD: ↑
Gurd et al., 2010 6wks 18
VO2peak: ↑ CS: ↑ HAD: ↑ COX IV: ↑

63
Table. 2.19 The influence of short, very high intensity training on enzyme activities in
untrained or moderately trained individuals
PPO: Peak Power Output, CS: Citrate Synthase, HAD: β-Hydroxyacyl-Coenzyme A Dehydrogenase, COX
IV: Cytochrome C Oxidase Subunit IV, COX: Cytochrome C Oxidase, PDH: Pyruvate Dehydrogenase.
Table. 2.20 Studies to have assessed the impact of training at different intensities in untrained
individuals, but with very different total work.
Study Duration/ Frequency
High/Low Intensity Training Total Work (kJ.wk
-1)
Results
Gibala et al., 2006
2wks 3.wk
-1
HIT: 4-6*30s ‘all-out’ with 4min rec. LIT: 90-120min@65%VO2peak
HIT: 475 LIT: 3250
Endurance performance: ↑nsd COX Act: ↑nsd COX II PC: ↑nsd COX IV PC: ↑nsd BC: ↑nsd GC: ↑nsd
Burgomaster et al., 2008
6wks 3/5.wk
-1
HIT: 4-6*30s ‘all-out’ with 4.5min rec. (3d.wk
-1)
LIT: 40-60min@65%VO2peak
(5d.wk-1
)
HIT: 225 LIT: 2250
PDH PC: ↑nsd CS Act: ↑nsd HAD Act: ↑nsd PGC-1α PC: ↑nsd
HIT: High Intensity Training, LIT: Low Intensity Training, rec: Recovery, nsd: No Significant Difference
between HIT and LIT, ↑: Increased from pre-training, VO2peak: Maximal Oxygen Consumption, COX:
Cytochrome C Oxidase, Act: Activity, PC: Protein Content, BC: Buffering Capacity, GC: Glycogen Content,
PDH: Pyruvate Dehydrogenase, CS: Citrate Synthase, HAD: β-Hydroxyacyl-Coenzyme A Dehydrogenase,
PGC-1α: Peroxisome proliferator receptor-γ co-activator-1α.
2.3.3 Summary of the Training-Intensity Specific Adaptations Section
When the total workload of training is matched between two interventions with different
exercise intensities, it is often, but not always the intervention with the higher exercise
intensity that leads to greater increases in physiological adaptation and endurance
performance. VO2max has been reported to increase more following higher intensity training,
Study Duration (wks)/ No. of HIT sessions
HIT Result
Hood et al., 2011 2 6
10*1min @ 60% PPO CS (protein content): ↑ COX IV (protein content): ↑
Little et al., 2010 2
6 8-12*60s@~100% PPO Endurance performance: ↑
CS: ↑ COX: ↑
Burgomaster et al., 2008
6 18
4-6*30s Wingates HAD:↑ PDH: ↑
Burgomaster et al., 2005
2 6
4-7*30s Wingates Endurance performance: ↑ CS:↑

64
and this seems to be due to cardiovascular adaptations, including an increased SV and an
increased contractile capacity of cardiomyocytes. Research suggests that improvements in LT
are not exercise intensity-specific. However, it has been suggested that the activity of MCT1,
buffering capacity and capillarisation are increased more following higher intensity training,
which would lead to a greater increase in LT. It is possible that different molecular pathways
are activated when training at different exercise intensities, but the effect of training-intensity
on these pathways is unclear at present. Finally, as muscle fibre recruitment is different at
different exercise intensities, it is possible that specific adaptations only take place in those
muscle fibres that are recruited during training.
65
2.4 OVERTRAINING
2.4.1. The Overtraining Process
At certain times in the training season, endurance athletes will intensify training with the aim
to increase performance. Following a single intense training session, there may be a decrease
in performance and the athlete may experience acute feelings of fatigue. Following a series of
intense acute training sessions, the athlete may experience similar or greater symptoms of
fatigue and declined performance. This is due to an absence of appropriate recovery
(Lehmann et al., 1993) and the athlete is identified as overreached (Fig 2.1). Recovery from
overreaching is possible within two weeks, and therefore it has been previously suggested to
be a relatively normal and harmless stage of the training process (Jeukendrup et al., 1992;
Halson et al., 2002). In fact, following a period of overreaching, if the athlete carries out an
adequate period of recovery, then a ‘supercompensation’ effect could be achieved, resulting
in a higher level of performance following the recovery period than before the overreaching
period (Budgett 1998; Fig.2.1). If intensified training continues following overreaching, this
could result in overtraining (Urhausen & Kindermann 2002; Fig.2.1). The fatigue, performance
decline and mood disturbances have been suggested to be more severe in overtrained than in
overreached athletes, but scientific evidence is lacking to either prove or disprove this
suggestion. Whereas overreached athletes may be fully recovered within two weeks, full
recovery from overtraining may take months or possibly years (Budgett 1998).
2.4.2 Causes of Overtraining
Overtraining is caused by an excessive training load, together with inadequate recovery
(Hedelin et al., 2000). In well-trained rowers, although the success in Championships is
positively related to the training volume (Steinacker et al., 1993), the risk of overtraining also
increases with an increase in training volume, and in particular with monotonic training (Fry et
al., 1992; Bruin et al., 1994). Indeed, it is well established that the risk of overtraining can be

66
reduced by alternating hard and easy sessions (Steinacker et al., 1998). It would therefore
seem beneficial to endurance athletes to design a training programme involving alternating
high and low intensities.
A decrease in muscle glycogen stores has been suggested to be at least partly attributable to
the fatigue and underperformance associated with overtraining (Halson & Jeukendrup 2004).
Indeed, following 10d of overload training in 12 well-trained swimmers, 8 responded with
positive performance gains, while in 4 swimmers, there was no change in performance (Costill
et al., 1988). In the non-responders, there was a significant decrease in muscle glycogen,
caused by significantly less carbohydrate consumed than the responders. However, another
study has reported that decreased muscle glycogen content is not the cause of overtraining
(Snyder et al., 1995). A group of well-trained cyclists were classified as overreached following
overload training for 15d, despite maintained muscle glycogen levels. It therefore appears
that a mechanism other than a decrease in muscle glycogen is responsible for overtraining.
2.4.3 Types of Overtraining
Two types of overtraining have been distinguished; a sympathetic type and a parasympathetic
type (Israel 1976). Heart rate variability (HRV) can be used to detect these two types of
overtraining, as it has been shown to detect changes in the autonomic nervous system (ANS)
(Pichot et al., 2002). There are regular fluctuations in resting HR, which are primarily due to
the changing level of both parasympathetic and sympathetic neural control of the heart
(Yamamoto et al., 1991). HRV is measured by examining the intervals between successive R
waves from the QRS complex (Task Force of the European Society of Cardiology and the North
American Society of Pacing and Electrophysiology 1996). There is a high frequency and a low
frequency HRV, which reflect autonomic balance status (Portier et al., 2001). The high
frequency (0.15-0.45Hz) reflects parasympathetic (vagal) activity, and is mediated through

67
respiration, whilst the low frequency (0.04-0.15Hz) seems to reflect both parasympathetic and
sympathetic activity (Akselrod et al., 1985).
2.4.3.1 Sympathetic Type Overtraining
Overreaching has been associated with a decreased HRV, and therefore parasympathetic
inhibition and sympathetic activation (Kinnunen et al., 2006). The sympathetic type is
understood to be characterised by an increased resting heart rate and blood pressure (Portier
et al., 2001), and perhaps also involves increased sympathetic neuroendocrine activity in
response to repeated stress from endurance training (Fry et al., 1991). It has been suggested
to be caused by an overstimulation of the sympathetic nervous system, from high intensity
training and/or inadequate rest (Winsley et al., 2005). This type of overtraining has been
found in a group of elite rowers, 20d before the World Championships (Iellamo et al., 2002).
Three of the seven athletes won a medal at the World Championships, which is indicative that
the athletes achieved supercompensation following an overreaching training period. This
evidence suggests that the sympathetic type overtraining is a positive aspect of endurance
training, provided it is followed by an adequate period of reduced training and recovery.
2.4.3.2 Parasympathetic Type Overtraining
If the sympathetic type of overtraining is allowed to continue, a combination of inhibition,
desensitisation, and exhaustion of the neuroendocrine system leads to a parasympathetic
dominance and the parasympathetic type of overtraining (Fry et al., 1991; Lehmann et al.,
1998). In the parasympathetic type, the HRV increases, the sympathetic form is inhibited and
the result is a marked dominance of the parasympathetic system (Baumert et al., 2006). In
contrast to the sympathetic type overtraining, a decrease in both blood pressure and heart
rate has been suggested to be associated with this type of overtraining (Portier et al., 2001).
The parasympathetic type of overtraining is regarded as an ultimate negative feedback

68
response to sustained levels of arousal (Lehmann et al., 1998). The basal urinary
catecholamine excretion is normally reduced by 50-70% in an athlete suffering from the
parasympathetic type of overtraining (Lehmann et al., 1998). There is a negative feedback
mechanism to an increased concentration of circulating free catecholamines during prolonged
heavy training sessions that cause the decrease in sympathetic intrinsic activity (Lehmann et
al., 1998). This decrease in sympathetic activity could also be the cause of the decreased
HRmax during a maximal physical effort and a decreased HR if it is not accompanied by an
increase in performance capacity (Uusitalo et al., 2000).
Care needs to be taken however, as endurance training leading to enhanced endurance
performance has been shown to increase parasympathetic activity and decrease sympathetic
activity in the heart at rest, which can be detected by an increased HRV (Seals & Chase 1989;
Uusitalo et al., 1996). This is supported by the well-established finding that endurance
athletes have a lower resting HR compared with sedentary individuals (Ekblom et al., 1973)
and a more rapid HR recovery following exercise due to the enhanced parasympathetic
activity (Shin et al., 1995; Brenner et al., 1997). In fact, maximal ANS activity has been
reported to be positively related to both VO2max (Garet et al., 2004) and performance (Pichot et
al., 2002; Pichot et al., 2000). In addition, large increases in aerobic power following
endurance training have also shown to be related to increases in parasympathetic control of
HR (Shi et al., 1995; Smith et al., 1989). In concurrence, studies to have shown only a small
increase in aerobic power after training have reported that parasympathetic activity is
unchanged (Ekblom et al., 1973).

69
2.4.4 Measures of Overtraining
2.4.4.1 Performance Tests
The gold standard of diagnosis of overtraining is the assessment of a decrement of
performance (Urhausen & Kindermann 2002). An athlete cannot be diagnosed as overreached
if the performance remains unchanged following an increased training load (Halson &
Jeukendrup 2004). Care needs to be taken in interpreting performance results, as small
performance changes are within the normal variability (Bruin et al., 1994). It has been shown
previously that the normal variability in maximal work load on a cycle ergometer is 4%
(Kuipers et al., 1985), and in overtrained athletes maximal work load is declined by 5 to 10%
(Jeukendrup et al., 1992). Depending on the specific performance assessment, the magnitude
of the decline in performance may vary widely. It has been suggested that a sports specific
testing procedure that is continued until exhaustion is the most sensitive test to detect
overreaching/overtraining (Urhausen & Kindermann 2002). These authors have suggested
that the test needs to be a short term high intensive endurance exercise. A test which has
been used successfully in the diagnosis of overtraining in controlled prospective studies is the
‘stress test’. This is performed on a cycle ergometer, at an intensity 10% above the individual
anaerobic threshold. Exhaustion occurs after ~15 to 40min, with reductions between 14 to
27% due to overreaching/overtraining (Urhausen et al., 1998). Time trials can also be used to
indicate a state of overreaching/overtraining (Hooper et al., 1993). Overreached swimmers
have been reported to increase 100m and 400m performance times by 2.4%, whereas well-
trained swimmers decreased performance times by 1.1% (Hooper et al., 1993). Timing of the
performance testing of potentially overreached/overtrained athletes is a major consideration.
Following intensive training, there could be a degree of muscle glycogen depletion in the
athlete, which would reduce both maximal performance and lactate concentration
(Jeukendrup et al., 1992). Therefore, performance testing should be performed following a
minimum of 2 days of reduced training or rest (Urhausen & Kindermann 2002). For the

70
diagnosis of overtraining, the decrease in sports-specific performance is still decreased
following 2 weeks of regeneration (Budgett 1998).
2.4.4.2 Physiological Measures
The VO2max or the maximal performance of overtrained athletes in an incremental graded test
procedure tends to be impaired, but other studies have shown these values to be unchanged
(Urhausen & Kindermann 2002). Jeukendrup et al (1992) found that 14 days of intensified
training in a group of competitive cyclists led to an 8% decrease in VO2peak and a 3-4% decrease
in maximal power in an incremental test to exhaustion. Studies have revealed that HRmax is
slightly, but significantly reduced in overtrained athletes (Lehmann et al., 1992; Snyder et al.,
1995; Hedelin et al., 2000). An increased HR at rest has been suggested as a sign of
overtraining (Stone et al., 1991). However, some studies have found this to not be the case
(Fry et al., 1992; Lehmann et al., 1992; Snyder et al., 1995). It has been proposed that an
increased HR at rest or during submaximal exercise might be a sign of an infectious disease or
glycogen depletion (Urhausen & Kindermann 2002). Several studies have found lowered
submaximal and maximal blood lactate concentration following overreaching/overtraining (Fry
et al., 1992; Snyder et al., 1995; Urhausen et al., 1998). Indeed, Jeukendrup & Hesselink
(1994) have shown that overtraining can lead to a right shift in the blood lactate concentration
profile. This might be due to a decrease in muscle and liver glycogen stores, which causes a
decrease in blood lactate concentration (Halson & Jeukendrup 2004). This is supported by
studies showing a decrease in carbohydrate metabolism following overtraining, leading to an
decreased respiratory exchange ratio value during both submaximal and maximal exercise
(Urhausen et al., 1998; Snyder et al., 1995). Jeukendrup et al (1992) have suggested that an
increased rating of perceived exertion value in relation to the exercise intensity might be used
as a criterion for overtraining. Several studies have shown that overreached athletes show
clear signs of psychological distress (Fry et al., 1992; Urhausen et al., 1998; Halson et al.,

71
2002). It has been suggested that an impaired mood state and subjective complaints are
sensitive and early markers of overtraining (Snyder et al., 1993; Urhausen et al., 1998; Foster
1998). A reduced mood state occurs well in advance of the decline in performance and shows
a relationship with the increased training load (Morgan et al., 1988; Urhausen et al., 1998).
However, care needs to be taken, as other studies have reported increased training to lead to
increased ‘Profile of Mood States’ scores, but to not lead to overtraining (Morgan et al., 1988).
2.4.5. Summary of the Overtraining Section
It has been suggested that an effective training-intensity distribution might be able to protect
an endurance athlete from overtraining, although this is inconclusive. Research has suggested
that overtraining might result from an excessive training volume or load, and/or excessive high
intensity training. It has also been suggested that training programmes without adequate
variation in training intensity might increase the chances of becoming overtrained, and
training programmes with varied training intensities might offer a protective effect from
overtraining. It is important to consider different methods to assess overtraining in a research
study, but a test lasting approximately 15-40min to exhaustion, a time trial, and a mood scale
seem to be the most reliable.

72
2.5 SENESCENT T CELLS AND EXERCISE
2.5.1 Introduction to the Human Immune System
The world contains many pathogenic and non-pathogenic microbes and a large range of toxic
and allergenic substances. In order to protect the host from infection, the human immune
system consists of innate and adaptive systems (Chaplin 2010). The innate system is the first
line of defence against infectious pathogens and restricts the entry of microorganisms into the
body using physical/structural barriers, chemical barriers and cells that kill microorganisms
and/or eliminate host cells that become infected (Gleeson 2006). The adaptive system is
activated by infection following failure of the innate system, and responds with a proliferation
of cells that either attack the infectious agent directly, or produce antibodies, which help to
restrict the pathogen from attacking the host (Gleeson 2006). The adaptive immune system is
designed to prevent colonisation of pathogens and destroy invading micro-organisms (Walsh
et al., 2011). The main distinction between innate and adaptive immune responses is that the
adaptive responses strengthen upon repeated exposure (i.e. they possess a memory function)
(Walsh et al., 2011). Adaptive responses are based mainly on the antigen-specific receptors
expressed on the surfaces of B and T lymphocytes (Chaplin 2010).
2.5.2 T-cells
During development, T cells acquire a T cell receptor that fits the major histocompatibility
complex (MHC) unique to the individual before entering the periphery as a fully functional
naive T cell (Simpson 2011). T cell subsets can be identified using monoclonal antibodies,
which recognise cell surface markers, known as cluster of differentiation (CD). All T
lymphocytes express CD3, T helper cells express CD4 and most cytotoxic cells express CD8. In
the blood and secondary lymphoid organs, 60% to 70% of T-cells are CD4+CD8- (CD4+) and
30% to 40% are CD4-CD8+ (CD8+) (Bruunsgaard et al., 1999). When the MHC displays the
antigen on the cell surface of macrophages, T helper cells (CD4+) bind to the antigen and

73
stimulate the macrophage to release the cytokine, IL-1, which stimulates the T cells to grow
and divide. T helper cells (CD4+) and cytotoxic cells (CD8+) are stimulated to undergo further
proliferation and growth from the cytokine, IL-2, which is released from the activated T cells
(Gleeson 2006). Following an immune response, most of the excess clones of effector T cells
die by apoptosis, but some recirculate the tissues to protect the host against further attacks
from the same infectious agent (Simpson 2011).
2.5.3. B-Cells
B cells differentiate from hematopoietic stem cells in the bone marrow and constitute
approximately 15% of peripheral blood leukocytes. B cells express selectively CD19 and CD20.
When a B cell leaves the bone marrow, it expresses a unique antigen-binding receptor on its
membrane, called an antibody. When a naïve B cell first encounters the antigen that matches
its antibody, the binding of the antigen to the antibody causes the cell to divide rapidly, and its
progeny differentiate into memory B cells and effector B cells, called plasma cells (Fig. 2.10). A
single plasma cell can secrete over 2000 molecules of antibody per second, and as such,
antibodies are the major effector molecules of humoral immunity. Most antigens activate B
cells only when the B cells are stimulated by cytokines from T-helper cells (T-cell dependent
antigens), but some antigens are T-cell independent (Fig. 2.10).

74
Fig. 2.10 The role of T cells and B cells in the adaptive immune system (Taken from Parkin &
Cohen (2001))
2.5.4 Cellular Senescence
Cellular senescence is a state whereby cells are unable to further proliferate in response to
antigenic stimuli and can be caused by excess rounds of cell division in response to repeated
antigenic stimuli (Effros 2007). Under standard culture conditions, cellular proliferation ceases
after a more or less fixed number of cell divisions (the ‘Hayflick limit’), and is dependent upon
the particular cell (von Zglinicki, 2002). Cellular senescence is therefore unaffected directly by
chronological time, but is primarily affected by the replicative history of the cells (von Zglinicki,
2002). It has been reported that in human blood lymphocytes in vitro, CD4+ T-cells to have
around 33 cellular divisions in culture before cell-cycle arrest, whereas CD8+ T-cells have
around 23 (Pawelec et al., 1996; Perillo et al., 1993). Further evidence using human T cells
from young donors in a long-term cell culture model has reported that repeated stimulation
with antigens on nearly 100 independent cultures reach the end stage of replicative
senescence, after multiple rounds of cell division (Perillo et al., 1989).

75
2.5.5 Mechanisms Responsible for Cellular Senescence
2.5.5.1 Telomere Shortening
Telomeres are repeated DNA sequences at the termini of linear chromosomes (Effros 2007).
Due to the mechanism of DNA replication, telomeres shorten with each cell division and
therefore have been suggested as a marker of replicative senescence (Effros 2007; van Baarle
et al., 2005; Effros 2004). The loss of 50-100bp of telomere sequence with each cell division
ultimately leads to critically short telomeres (Effros 2007). The signal for the cell cycle arrest
following telomere shortening to critical lengths has been suggested to be either the
shortened telomeres themselves, or due to the cell detecting DNA damage, a reduced
abundance of certain telomere-binding proteins (Effros 2007). As critically short telomeres are
capable of fusing with each other, potentially leading to tumorigenesis, signalling mechanisms
for senescence are triggered, in order to prevent cell division (Simpson et al., 2008).
2.5.5.2 Oxidative Stress
Molecules that are capable of independent existence (free) and contain an unpaired electron
(radical) are known as free radicals (Vollaard et al., 2005). Free radicals that are capable of
inducing oxidative damage to biological structures are known as reactive oxygen species (ROS)
(Sen 2001). An oxidative stress state occurs when there is an imbalance between free radical
production and antioxidant defence (Sen 2001). In Harman’s free radical theory of cellular
aging, oxidative stress is thought to be responsible, at least in part, for cellular senescence
(Harman 2006). Other authors also suggest that excessive exposure to oxidative stress causes
immune cell senescence (Larbi et al., 2007; van Baarle et al., 2005). Indeed, increased
oxidative stress has been shown to down regulate CD28 expression (Ma et al., 2003). The lack
of expression of CD28 is indicative of cellular senescence (Effros 2004). Under conditions of
elevated oxidative stress, the rate of telomere erosion can be accelerated (Petersen et al.,

76
1998). By increasing or decreasing the amount of oxidative stress, the replicative lifespan of
cells can be considerably shortened or prolonged, respectively (Packer & Fuehr 1977; Balin et
al., 1977). Alternatively, elevated oxidative stress might lead to premature senescence by
causing single strand breaks in the chromosomal DNA, therefore independent of telomere
shortening (Chen et al., 2001; von Zglinicki et al., 2000; Petersen et al., 1998).
2.5.5.3 Latent Herpesviruses
Latent herpesviruses that are prevalent among humans include herpes simplex virus (HSV-1,
HSV-2), cytomegalovirus (CMV), Estein-Barr Virus (EBV) and Varicella Zoster Virus (VZV)
(Simpson 2011). Primary infection with these viruses causes evident symptoms, and
subsequent reactivations of the virus can occur under periods of stress. For example, a
primary infection with VZV will cause chickenpox, and reactivation later in life causes shingles.
Reactivation due to stress leads to T cell proliferation (Pawelec et al., 2009; Koch et al., 2007;
Koch et al., 2006). The reactivation of latent viral infections is associated with a greater
frequency of senescent T cells in the periphery (Koch et al., 2007). Due to persistent viral
reactivation, excess T cell clones do not undergo post infection apoptosis, as they are needed
for subsequent reactivations of the latent virus. Instead, the excess T cell clones become part
of the memory T cell pool, and therefore take up the ‘immune space’, in place of antigen-
virgin naive T cells, thus shrinking the naive T cell repertoire (Simpson 2011).
2.5.6 Markers of Senescence
CD57 is a cell surface glycoprotein that has been reported to be expressed on T-lymphocytes
with a senescent phenotype (Brenchley et al., 2003). In healthy controls, the CD57 antigen is
expressed normally only by a minority of peripheral blood CD8+ lymphocytes (Focosi et al,
2009). The transcriptional profiles of CD8+ CD57+ and CD8+ CD57- T lymphocytes differ
substantially. More specifically, CD8+ CD57+ T lymphocytes have a higher cytotoxic effector
potential including perforin, granzymes and granulysin, and express more adhesion molecules

77
and chemokine receptors (Focosi et al, 2009). In addition, CD8+ CD57+ T lymphocytes express
a lower level of genes involved in cell-cycle regulation, even in response to TCR, IL-2, IL-7 and
IL-15 stimulation (Focosi et al, 2009). Moreover, CD57 is expressed on T-lymphocytes with
short telomeres, a long history of proliferation, an inability to proliferate in response to
mitogenic stimuli (Brenchley et al., 2003) and lack cell surface expression of the co-stimulatory
molecule, CD28 on the cell surface (Bruunsgaard et al., 1999). CD28 is a cell surface
glycoprotein, and has been shown to be an important co-stimulatory receptor (Linsley &
Ledbetter, 1993). A co-stimulatory signal is transduced through CD28 when T cells encounter
an antigen presenting cell expressing either of the CD28 ligands, B7-1 or B7-2 (Boise et al,
1995). A proliferative response can occur with a lower concentration of anti-CD3 following co-
stimulation in vitro (Gimmi et al, 1991). Moreover, the production of cytokines by helper T
cells is enhanced by CD28 co-stimulation, through transcriptional and posttranscriptional
regulation of gene expression (Lindsten et al, 1989). CD28 co-stimulation can also activate the
cytolytic potential of cytotoxic T cells (Boise et al, 1995). Therefore, CD28 is clearly important
for the activation and proliferation of naive T-cells (Ouyang et al., 2003; Labalette et al., 1999;
Linsley & Ledbetter 1993). Cells lacking the expression of CD28 are known to have a lower
proliferative capacity (Nociari et al., 1999). In fact, the complete and irreversible loss of CD28
has been reported following T cell replicative senescence in cell culture (Effros 2004). T cells
lacking the expression of CD28 have also been shown to have shorter telomere lengths (Effros
et al.,1996). It has been reported that CD28 is required for optimal upregulation in the activity
of the telomere extending enzyme, telomerase (Valenzuela & Effros 2002; Weng et al., 1997).
The evidence clearly shows that the expression of CD57 and the lack of expression of CD28 is
indicative of a senescent phenotype. However, it has been suggested that for an even more
accurate marker of a true end stage senescent cell, multiple phenotypic markers are required
(Effros 2007). It has been reported that from proliferative assays and telomere analysis, the
surface expression of CD57+ and CD28- T cells define the ultimate end-stage cell in the

78
senescent pathway (Brenchley et al., 2003). Following an antigenic stimulus, CD8+ T-
lymphocytes proliferate more than CD4+ (Foulds et al., 2002). CD8+ T lymphocytes also have
shorter telomeres (Bruunsgaard et al., 1999) and lack the ability to upregulate the telomere
extending enzyme, telomerase (Effros 2007). For these reasons, it would therefore be
expected to see a greater frequency of senescent cells among the CD8+ T cell population
(Simpson et al., 2008).
2.5.7 The Impact of Cellular Senescence
Homeostatic mechanisms tightly control the proportion of naive and activated T cell
populations in the peripheral T cell pool (Freitas et al., 1996; Tanchot & Rocha 1995; Rocha et
al., 1989). Therefore, the proportion of T cells with a senescent phenotype in the peripheral T
cell pool may increase due to a lack of apoptosis (Spaulding et al., 1999). Apoptosis is linked to
proliferative status, and so the inability to enter cell cycle is a factor in the reduced apoptosis
in senescent cultures (Spaulding et al., 1999). However, it is also known that non-cycling early
passage cultures from the same donor undergo higher levels of apoptosis, thereby suggesting
that the resistance to apoptosis is at least partially independent of these senescent cells are
non-cycling. In addition, responses to several other stimuli, not linked to cycling have led to a
reduced ability to undergo apoptosis (Spaulding et al., 1999). It has therefore been suggested
that replicative senescence itself may involve a central block in apoptosis signalling pathways
(Spaulding et al., 1999). The naive T cells are gradually replaced with T cells with a senescent
phenotype, causing the naive T cell repertoire to shrink (Koch et al., 2006). As the naive T cells
are vital in immune responses to novel pathogen, this change in the immune space may leave
an individual at a greater risk of viral infection (Pawelec et al., 2009; Koch et al., 2007; Ouyang
et al., 2003). An accumulation of senescent T cells is believed to be the cause of increased risk
of infectious diseases and autoimmune disorders in the elderly (Effros 2004; Ouyang et al.,
2003). More specifically, the proportion of CD28- (senescent) T cells in the elderly correlate

79
with mortality risk (Wikby et al., 2002), disease status (Effros 2007), disease pathogenesis in
certain autoimmune disorders (Effros 2007) and a blunted response to influenza vaccines
(Goronzy et al., 2001).
2.5.8 Immunosuppression Following Strenuous Exercise
A ‘J shaped curve’ has been used to model the relationship between exercise and susceptibility
to infection (Nieman 1994). An enhanced immune function above sedentary levels might be
achieved with moderate activity. Compared to a sedentary lifestyle, regular moderate
exercise of about two hours per day has been reported to decrease the risk of picking up an
upper respiratory tract infection (URTI) by 29% (Matthews et al., 2002). In contrast, impaired
immune function might result from excessive amounts of prolonged, high-intensity exercise.
There is evidence to support the suppressed immune function following strenuous exercise.
The mitogen-stimulated lymphocyte proliferation has been reported to be significantly
lowered at rest following just 6 days of intensified endurance training in a group of trained
cyclists (Lancaster et al., 2004). These cyclists were completing ~10 hours of cycling per week
before the study and the training load increased on average by 73% for the 6 days of intensive
training. Following 2 weeks of reduced training (<4 hours cycling per week), the mitogen-
stimulated lymphocyte proliferation returned to pre-study values. Similarly, T lymphocyte
proliferation was decreased in a group of professional footballers during the season, and this
returned to baseline after the season (Bury et al., 1998). Three weeks of increased training
volume (35%) in a group of elite runners caused a decrease in immune function (Verde et al.,
1992). After the increased training volume, the mitogen-induced lymphocyte proliferation
was decreased following a 30 min run at 80% VO2max, whereas it was unchanged before the
increased training volume. Although speculative, it is possible that the decreased lymphocyte
proliferation following chronic exercise training in these studies may have been due to an
accumulation of senescent T cells in the periphery. As mentioned, the proportion of senescent

80
and naive T cells in the immune space is tightly controlled by homeostatic mechanisms (Freitas
et al., 1996). Senescent T cells are unable to undergo apoptosis (Spaulding et al., 1999), and so
it is possible that the decreased lymphocyte proliferation in these studies was due to an
increased proportion of senescent T lymphocytes in the immune space, as senescent T cells
are unable to proliferate (Effros 2007). Further evidence for this is the finding that regular,
high-intensity exercise has been shown to cause a decrease in the proportion of CD4+ naïve T-
cells expressing CD45RA (Hack et al., 1997). CD4+ and CD8+ T cells express a specific isotype
of the CD45 family when emigrating from the thymus, the CD45RA antigen (Spits et al., 1995),
which designates them as being immunologically naive T cells (Akbar et al., 1991). At rest,
CD4/CD8 ratio has been reported to be decreased following an increased training volume
(Verde et al., 1992). Likewise, the CD4/CD8 ratio was decreased at the end of the season in a
group of professional footballers compared to the pre-season value (Rebelo et al., 1998) and
following high intensity training for 8 weeks in previously untrained subjects (Hack et al.,
1997).
In support of a reduced immune function following a strenuous training period, the incidence
of URTIs has been shown to be increased following intensive exercise training. In one study
(Spence et al., 2007), the incident rate ratios in URTIs were assessed over five-months of
training and competition in individuals classified as; elite endurance athletes, recreationally
competitive endurance athletes, or sedentary subjects. Unsurprisingly, the incident rate ratios
were higher in the elite athletes and the sedentary subjects than in the recreationally
competitive athletes. Furthermore, the incidence of URTIs has been reported to be greater
than 40% in competitive swimmers during four weeks of intense training (MacKinnon &
Hooper 1996), elite hockey players during a ten day training camp (MacKinnon 2000), and elite
squash players during ten weeks of training (MacKinnon 2000). Indeed the training volume
appears to be related to the risk of picking up an URTI (Heath et al., 1991) as it was reported

81
that compared with athletes running <778km per year, running 778-1384 and >1384km per
year was associated with a 2 and a 3.5 times greater odds ratio of picking up an URTI,
respectively. An increased risk of infection is a huge concern for athletes, as even minor
infections can lead to an inability to sustain strenuous training regimes (Roberts 1986).
2.5.9 Mechanisms Responsible for a Decreased Immune Function Following Strenuous
Training
2.5.9.1 Multifactorial:
The reason for the increased incidence of infection in athletes is likely to be multifactorial: a
variety of stressors (physical, psychological, or environmental, nutritional) can suppress
immune function (Gleeson 2006). Along with an increased exposure to pathogens, these
effects can make the athlete more susceptible to infection (Gleeson 2007). However, likely
causes appear to be elevated circulating stress hormones, particularly cortisol, and alterations
in the pro/anti-inflammatory cytokine balance in response to exercise (Fig. 2.11).
Fig. 2.11 Potential mechanisms by which acute and chronic exercise affects adaptive immunity
(Taken from Walsh et al (2011)).

82
2.5.9.2 Senescent Cells Due to Oxidative Stress
As previously mentioned, an increase in oxidative stress may lead to cellular senescence
through telomere dependent or independent mechanisms. During exercise, the oxygen
uptake by the active muscle may increase over 100-fold over resting levels. This leads to an
increased electron flux through the rapidly respiring mitochondria, which can cause electron
leakage and consequent ROS production (Ashton et al., 1998). ROS is formed from the 2-5% of
the total electron flux that ‘leaks’ (Boveris & Chance 1973). Research conducted over the past
three decades has reported that exercise of sufficient volume, intensity and duration is
capable of increasing the ROS production (Fisher-Wellman & Bloomer 2009). There is a direct
relationship between ROS production and the use of aerobic metabolism (Lovlin et al., 1987).
In addition, it has been reported that during anaerobic glycolysis, the production of lactic acid
can transform an only slightly damaging free radical (superoxide radical) into a much more
damaging free radical (perhydroxide) (Groussard et al., 2003). This response is due to the
interaction of the free radical with the protons derived from the lactic acid. It seems that free
radicals can also be produced during exercise by the autoxidation of catecholamines (Ramel et
al., 2004) and by the release of inflammatory cytokines (McAnulty et al., 2003). An increase in
ROS may lead to the oxidation of several biological molecules (lipids, proteins, nucleic acids)
(Fisher-Wellman & Bloomer 2009). Following cycle exercise to exhaustion in moderately
trained individuals (mean VO2max: 49ml.kg.min-1), a 3-fold increase in free radical production
has been reported (Ashton et al., 1998). In the study by Ashton et al (1998), the cyclists that
achieved a higher VO2max during the test to exhaustion achieved a greater increase in free
radical concentration. This demonstrates a direct effect on free radical production by
oxidative flux, as previously reported (Lovlin et al., 1987). Therefore, it seems that the total
amount of oxygen taken up may be an important determinant of free radical production
during exercise.

83
Previous studies prove that oxidative stress can increase during exercise. Oxidative stress in a
group of long-distance runners was increased during an eight day training camp, with
increased training volume, but decreased to pre-training levels on the day after the camp was
concluded (Okamura et al., 1997). This study used 8-hydroxydeoxyguanosine (8-OhdG) as a
biomarker for oxidative stress. The excretion of 8-OhdG reflects the integrated rate of
oxidative DNA damage and the repair of DNA in the whole body (Morillas-Ruiz et al., 2005). A
study by Almar et al (2002) assessed the oxidative stress on a group of professional cyclists
competing in a 4d and a 3wk cycling race. Urinary 8-OhdG excretion increased significantly in
the first day and in the first week of the 4d and the 3wk race, respectively and did not show a
further increase after. Maximal 8-OhdG levels were reached in parallel to longer times spent
at high intensities of exercise. In a group of well trained cyclists (VO2max: 63ml.kg-1.min-1)
completing a 90 min exercise test at 70% VO2max, urinary excretion of 8-OhdG significantly
increased by 21% (Morillas-Ruiz et al., 2005). It seems that as exercise intensity increases, the
oxidative stress increases concomitantly (Alessio et al., 1988).
Adaptations in antioxidant defence and DNA repair gene expression seem to occur as a result
of chronic exercise (Sachdev & Davies 2008). Chronic exercise provides repeated exposure of
the system to free radicals, which leads to an upregulation of the body’s antioxidant defence
system (Fatouros et al., 2004; Elosua et al., 2003). A result of an enhanced antioxidant
defence system is a shift in redox balance to a more reducing environment, which causes
protection from free radicals during subsequent training sessions (Fisher-Wellman & Bloomer
2009). It is therefore possible that trained athletes could have an improved resistance to
oxidative stress. Indeed, total antioxidant capacity has been reported to be positively
correlated with VO2max in trained runners (Child et al., 1998). Indeed, it has been reported that
after an incremental test to exhaustion, untrained men experience a higher DNA strand-
breakage in white blood cells than trained men (Niess et al.,1996). However, an enhanced

84
antioxidant defence system only seems to occur if training is appropriately managed, as
hormesis seems to explain the protective effect of exercise to oxidative stress. Hormesis is a
dose-response phenomenon, whereby a low dose stimulates adaptation, but a high dose
inhibits adaptation (Mattson 2008). Endurance training in well-trained athletes causes ROS
formation, which can stimulate adaptive mechanisms, leading to reduced oxidative damage
(Gomez-Cabrera et al., 2008). However, it has been reported that overloaded training
compromises the antioxidant defences, leading to an increase in the exercise-induced
oxidative stress (Palazzetti et al., 2003). It is also possible that individuals that exercise
sporadically, and thus have not built up an antioxidant defence are at a higher risk of oxidative
stress. The exercise-induced increase in free radicals has been shown to be attenuated with
antioxidant supplementation. Independent or combined administration of vitamin C, vitamin
E and beta-carotene have been the most commonly utilised treatment options in regards to
non-eccentric aerobic exercise-induced oxidative stress (Fisher-Wellman & Bloomer 2009).
Therefore, in studies that have shown an increase in oxidative stress following exercise in
trained endurance athletes (Morillas-Ruiz et al., 2005; Almar et al., 2002; Okamura et al.,
1997), the intensity/volume and frequency must have been adequate to overcome the already
enhanced antioxidant defences.
The intensity of exercise has been reported to be an important factor in determining whether
exercise induces oxidative stress. In a group of trained male cyclists, malondialdehyde was
used as a marker of oxidative stress. An incremental test to exhaustion (mean duration of
16min, mean blood lactate at exhaustion: 9.8mmol.L-1) caused a significant increase in
malondialdehyde in plasma and erythrocytes (Munoz et al., 2010). However, in the same
group of cyclists, a submaximal test (30min at 75% VO2max, mean blood lactate following the
30min: 3.5mmol.L-1) failed to induce a change in malondialdehyde. The authors suggest that

85
during the submaximal exercise test, the cyclist’s antioxidant system was sufficient to defend
against oxidative stress, whereas this was not the case in the incremental test to exhaustion.
2.5.9.3 Viral Reactivation
As previously mentioned, subsequent reactivations of a latent virus (HSV-1, HSV-2, CMV, EBV,
VZV) can occur under periods of stress and this can lead to a greater frequency of senescent T
cells in the periphery (Koch et al., 2007). Indeed, acute psychological stress mobilises CMV
and EBV-specific T cells and effector T cells into the blood (Atanackovic et al.,2006) and it has
been suggested that physical stress elicits the same response (Simpson & Guy 2010). It has
been reported that in elite athletes, there is a significant relationship between EBV serology
and URTI incidence (Gleeson et al., 2002).
2.5.10 Effect of Strenuous Exercise on Senescent T Cells
To the author’s knowledge, only Cosgrove et al (2011) has investigated the effects of regular
endurance training on the frequency of senescent T cells in resting, fasted blood. This study
reported that 6-months of training in preparation for an ironman triathlon race led to no
changes in the frequency of senescent or naive T cells in ten trained triathletes. There was a
lack of physiological adaptation in the study during the training period, suggestive that the
training stress was not excessive. However, blood samples were drawn three weeks after the
race revealed an increased proportion of senescent T cells within the CD4+ T-cell subset,
alongside a reduction in naive cells within the CD4+ T-cell subset. This suggests that the
stimulus during the training period was not sufficient to induce an increase in the proportion
of senescent T cells or a decrease in the proportion of naive T cells, but the ironman triathlon
race itself did provide a sufficient stimulus to induce these changes in the immune space.
These changes post-race, but not during the training period could be due to the so-called
‘open window theory’, due to an increased pathogen exposure as a consequence of lowered
post-race immune surveillance or travel stress (Zurich to UK). It is therefore possible that if

86
the training stress were higher, there might have been an increase in the proportion of
senescent T cells during the training period. Although speculative, it is possible that with
regular high intensity training which is of sufficient intensity and duration to induce oxidative
stress, there could be an accumulation of senescent T cells through telomere shortening or
telomere independent senescence.
2.5.11 Summary of the Senescent T Cells and Exercise Section
T cell responses have been reported to be blunted following a period of endurance training
with increased volume/load or intensity. Although speculative, it is possible that the blunted T
cell responses could be due to an increased proportion of senescent T cells, alongside a
decreased proportion of naive T cells, and therefore a change in the immune space. The result
of this would be the individual being left at a higher risk of infection. If training is managed
appropriately, an athlete’s antioxidant defence is increased, and therefore, high intensity
training can be completed with less risk of oxidative stress. However, if training is not
managed appropriately, then antioxidant defences do not improve, and therefore, the athlete
is left at a greater risk of oxidative stress during high intensity training. A link has been made
between oxidative stress and the proportion of senescent T cells, and a link also exists
between the proportion of senescent T cells and risk of infection. Therefore, a training
programme needs to be appropriately managed to increase antioxidant defences, so that high
intensity exercise can be completed without a risk of oxidative stress. It is therefore possible
that training programmes with different intensity distributions could be more/less effective to
achieve this goal and therefore it could be possible to minimise the risk of infection by
manipulating the training-intensity distribution.

87
2.6 Conclusions to the Review of the Literature
Training intensity and its distribution is a variable in endurance training which has the
potential to have a large impact on physiological adaptation and subsequent endurance
performance. Descriptive studies assessing the training-intensity distribution in elite
endurance athletes have reported that these athletes train with a high volume relative to the
event, and spend >80% of training time at intensities lower than the lactate threshold and
therefore <20% of training time at intensities higher than the lactate threshold. Experimental
studies support the beneficial effects of a large proportion of training at intensities lower than
the lactate threshold. As a high training volume is strongly related to endurance performance,
it seems that by including a high proportion of training at a relatively low intensity (zone 1)
allows for this high training volume. Of the relatively small proportion of training above the
lactate threshold (zones 2 and 3), research would suggest that greater benefits in endurance
performance and physiological adaptation can be gained through training in zone 3. This has
been suggested to be due to greater benefits in cardiovascular adaptations and buffering
capacity, but also to the finding of no difference in the acute recovery time of the autonomic
nervous system to training in zone 2 and zone 3. It is possible that the manipulation of
training-intensity distribution could have effects on the magnitude of physiological adaptation
and endurance performance, and the risk of overtraining and picking up an infection.

88
CHAPTER THREE
REPRODUCIBILITY OF THE LACTATE THRESHOLDS TO DETERMINE TRAINING INTENSITY
ZONES AND ADAPTATION IN SWIMMING, CYCLING AND RUNNING

89
3.1 ABSTRACT
Purpose: The purpose of the present study was to assess the reproducibility of the blood
lactate threshold (LT) and lactate turnpoint (LTP) in swimming, cycling and running in trained
endurance athletes. In addition, the reproducibility of maximal performance measures was
assessed. Methods: Standardised incremental intensity tests took place twice for swimming
(n=9), cycling (n=10) and running (n=10), separated by a minimum of two and a maximum of
six complete days to assess the test-retest reproducibility. Test-retest reproducibility was
assessed using the typical error of measurement (TEM). Results: The TEM for the LTP in
swimming (2.5%), cycling (3.3%) and running (2.6%) were considered reproducible. The TEM
for the LT in swimming (2.9%), cycling (3.7%) and running (3.1%) were also considered
reproducible. Moreover, the TEM for the fastest 150m swim time in swimming (1.1%), 3-min
peak power output in cycling (1.6%), 1-min peak power output in cycling (2.3%), 2.5-min peak
running speed (0.9%) and 30-s peak running speed (1.1%) were all considered reproducible.
Conclusions: The LTP, alongside the LT are reliable measures to demarcate training-intensity
zones, assess endurance performance and monitor moderate to large adaptations to training.
Practitioners should take care when deciding on the duration between testing sessions in
order to test for adaptations from training. Adaptations need to be greater than these
detected test-retest variations (TEM) to be considered measurably different.
Key Words: Performance testing, exercise intensity, measurement, reliability, test-retest

90
3.2 INTRODUCTION
It has been suggested that two typical breakpoints are passed during incremental intensity
exercise (Skinner & McLellan 1980; Kindermann et al., 1979). The first breakpoint corresponds
to the blood lactate threshold (LT), and has been described as the final exercise intensity
before the blood lactate concentration is increased distinctly from its resting level (Aunola &
Rusko 1984; Skinner & McLellan 1980; Kindermann et al., 1979). The second breakpoint
corresponds to the blood lactate turnpoint (LTP) and has been described as the starting point
of an accelerated increase in the blood lactate concentration (Smith & Jones 2001 ;Jones &
Doust 1997; Aunola & Rusko 1984).
A recent review (Faude et al., 2009) confirms that there is a strong relationship between the
LT and endurance performance. Training studies have demonstrated that training-induced
increases in competitive performance significantly correlate with increases in the LT (Tanaka
1986; Tanaka & Matsuura 1984). The LT and the LTP can also be used to demarcate the
boundaries between moderate and heavy exercise, and between heavy and very heavy
exercise, respectively (Smith & Jones 2001). Therefore, these blood lactate thresholds can be
used not only to assess endurance performance, but to demarcate training-intensity zones for
exercise intensity prescription and to monitor adaptations to endurance training.
To the author’s knowledge, no study exists that has assessed the reproducibility of the LTP in
trained endurance athletes. Previous studies have however, assessed the reproducibility of
the exercise intensity corresponding to a blood lactate concentration of 4mmol∙L-1 in
endurance trained runners. These studies found high correlation coefficients (Grant et al.,
2002; Coen et al., 2001; Weltman et al., 1990), close limits of agreement (Grant et al., 2002),
high intra-class correlation coefficients and small coefficients of variation (Pfitzinger &
Freedson 1998). Previous studies have also assessed the test-retest reliability of the LT in

91
endurance trained runners, and have reported high correlation coefficients (Grant et al., 2002;
Weltman et al., 1990), high intra-class correlation coefficients (Pfitzinger & Freedson 1998),
close limits of agreement (LOA; Grant et al., 2002) and low coefficients of variation (Pfitzinger
& Freedson 1998). To the author’s knowledge, no literature exists that has assessed the
reproducibility of the LT in trained endurance athletes in cycling or swimming.
If the LTP and the LT are to be used to monitor endurance performance, prescribe training
intensities or track changes in training status, they must be reproducible. The researcher
needs to be sure that following an intervention, any changes in these measures are outside of
the day-to-day variability. The reliability of the LTP and LT is dependent on both biological and
technological variability (Pfitzinger & Freedson 1998) and it is known that sampling method
and site, diet and prior exercise impact upon the blood lactate concentration (Faude et al.,
2009).
There are several methods available to researchers to assess the test-retest reproducibility of
a particular measure. It has been suggested that the typical error of measurement (TEM;
Hopkins 2000), the LOA (Atkinson & Nevill 1998) and ordinary least products regression (OLPR;
Ludbrook 2010; Ludbrook 1997) should be used. The use of correlation coefficients has been
discouraged as a sole method of assessing the reproducibility of a measure, as it does not give
any information on systematic bias and the result can be greatly influenced by the range of
values in the sample (Atkinson & Nevill 1998). Therefore, as the majority of the previous
research assessing the test-retest reproducibility of blood lactate thresholds in trained
endurance athletes has used correlation coefficients, this area of research is limited by
inappropriate statistical analyses.

92
To the author’s knowledge, no studies have yet assessed the reproducibility of the LTP in any
mode of exercise in trained endurance athletes. In addition, no study has assessed the LT in
cycling or swimming in trained endurance athletes. Therefore, the purpose of the present
study was to assess the reproducibility of the LTP in swimming, cycling and running in trained
endurance athletes, using standardised incremental intensity tests to exhaustion. In addition,
the reproducibility of the LT and maximal performance measures were also assessed.

93
3.3 METHODS
3.3.1 Participants
Ten participants for the cycling and running tests and nine participants for the swimming test
volunteered and provided written, informed consent to take part in the study, which was
approved by the local Ethics Committee, in accordance to the Declaration of Helsinki.
Participants were healthy, trained swimmers, cyclists, runners and triathletes. The mean (±SD)
characteristics of the participants were: age 39 (±12) yrs, mass 77.3 (±15.6) kg, and stature 178
(±9) cm.
3.3.2 Experimental Approach to the Problem
For each discipline, the incremental test was carried out twice, with a minimum of two
complete days and a maximum of six complete days between tests. Each athlete completed a
training and food diary for the two days prior to the first testing session and replicated the
training and diet prior to the second testing session. Participants were instructed to exercise
for no more than 60 min at an easy intensity in each of the two days before the first testing
session. Testing was performed at the same time of day (±1 hr) to minimise the effect of
diurnal biological variation (Atkinson & Nevill 1998). For the cycling and the running tests, the
laboratory ambient temperature was controlled at 18-20◦C and relative humidity ranged
between 30 and 50%. For the swimming test pool water temperature was maintained at 27-
28°C. Participants drank water ad libitum throughout each test.
3.3.3 Swimming Test
The swimming test was a modified version of the protocol used by Pyne and colleagues (Pyne
et al., 2001) and took place in a 25m pool, with participants wearing their own wetsuit. An
incremental test took place with seven 150m stages, each 5 s quicker than the previous, with a
3-min rest period between each stage. The 4th stage had the same pace as the athletes 400m

94
time trial time, which was assessed within 4 weeks of the first test. The final stage was a
maximal ‘all out’ effort to assess the fastest 150m swim time.
3.3.4 Cycling Test
The protocol for the cycling test was modified from a test previously described by Farina and
colleagues (Farina et al., 2004). Participants brought their own pedals and shoes for the test.
Handlebar position and saddle height of the ergometer were individualised for each
participant and remained consistent for subsequent tests. A 5-min warm-up was completed at
70 W at a self-selected cadence on a Lode cycle ergometer (Excalibur Sport, Netherlands).
This was immediately followed by a ramp test to volitional exhaustion, starting at a power
output of 70 W and increasing by 35 W every 3-min (25 W for female) with the cadence
remaining self-selected. Immediately after this test, the participants rested for 10-min before
completing a shorter maximal exercise test to volitional exhaustion. The test consisted of 1-
min stages, starting at the intensity of the penultimate stage of the previous test, and
increased by 35 W each stage. The end time for both the 3-min and 1-min stages were used to
calculate the 3-min peak power output (PPO-3) and the 1-min peak power output (PPO-1),
respectively (Kuipers et al., 1985):
PPO-3 = Wfinal + ([t/180] * PI)
PPO-1 = Wfinal + ([t/60] * PI)
Where Wfinal = The power output of the final completed stage, t = the time achieved in the final
non-completed stage and PI = the power increment.
3.3.5 Running Test
All participants were familiar with treadmill running. Participants completed a standardised
warm-up for 5min at 8km∙hr-1 on a treadmill (Powerjog, Cranlea and Co), set at a 1% incline
throughout the test to simulate the energetic cost of outdoor running (Jones & Doust 1996).

95
This was followed by an incremental exercise test to volitional exhaustion, starting at a speed
of between 8 and 10 km∙hr-1 (depending on running ability) and increasing by 1 km∙hr-1 every
3min (Billat et al., 2003). Thirty seconds before the end of each stage, participants supported
their weight with their hands and moved their feet to the sides of the treadmill belt to allow
measurements to be taken. As in the cycling test, the participants rested for 10min before
completing a shorter maximal exercise test, as reported by Farina and colleagues (Farina et al.,
2004). The test consisted of 30s stages, starting at the intensity of the penultimate stage of
the previous test, and increasing by 0.5km∙hr-1 each stage until volitional exhaustion. The end
time in both the 3-min and the 30-s tests was used to calculate the 2.5-min peak running
speed (PRS-2.5) and the 30-s peak running speed (PRS-30), respectively (Kuipers et al., 1985):
PRS-2.5 = Speedfinal + (t/150)
PRS-30 = Speedfinal + ([t/30]*SI)
Where Speedfinal = The running speed of the final completed stage, t = the time achieved in the
final non-completed stage, SI = the speed increment.
The LTP was determined as the starting point of an accelerated blood lactate accumulation
(around 3 to 6mmol∙L-1), depending on the individual blood lactate profile (Aunola & Rusko
1984). The LT was determined as the final exercise intensity before the blood lactate
concentration increased distinctly from its resting concentration (Aunola & Rusko 1984). In
100% of tests, the lactate concentration did not deviate by more than 0.3mmol.L-1 in the first
three stages of the test. Therefore, a line of best fit was established from these initial stages
of the test. The distinct increase in lactate concentration was clear in 100% of tests, but was
of an individual magnitude for each test. For example, one participant had lactate
concentrations of 1.0. 1.1, 1.0, 1.0, 1.7, 2.6, 3.4, 6.6, 10.4mmol.L-1. In this test, the distinct
deviation was clear from 1.0 to 1.7mmol.L-1. By fixing a standard magnitude of increase to the
lactate concentration, such as 1.0mmol.L-1, this increase would have been missed. The lactate

96
turnpoint was also clear from 3.4 to 6.6mmol.L-1, due to the obvious deviation accelerated
blood lactate accumulation. This was a clear deviation from the second line of best fit in 100%
of the tests.
Immediately after each stage in the incremental tests, heart rate (Polar S625X, Polar Electro,
Kemplete, Finland) was recorded. In addition, a 5-µL capillary blood sample was obtained and
analysed for lactate concentration by micro-assay (LactatePro LT-1710, ArkRay Inc, Kyoto,
Japan). The reliability and validity of this device has been previously determined(Pyne et al.,
2000). The reliability was reported to have a correlation coefficient of 0.99 and a level of
agreement under 1mmol∙L-1.
3.3.6 Statistical Analyses
Systematic bias between the test and retest scores was assessed using paired sample t-tests.
Statistical significance was accepted at P<0.05. The assumption of homoscedasticity was
confirmed before undertaking the LOA analysis. Heteroscedasticity was assessed by
calculating Pearson’s correlation coefficient between the individual differences from test one
to test two and the individual mean value for test one and test two. Pearson’s correlation
coefficient was not significant (P>0.05) for all of the measures and the r value was ≤0.53. The
LOA (Bland & Altman 1986) and the TEM along with 95% confidence intervals (Hopkins 2000)
were calculated using the spreadsheet of Hopkins (Hopkins, 2000). OLPR analysis was
undertaken, using the equations suggested by Ludbrook (Ludbrook 2010; Ludbrook 1997).

97
3.4 RESULTS
3.4.1 Absolute and Percentage Test-Retest Differences
The absolute values for the swimming times, the cycling power outputs and the running
speeds associated with the LT, LTP and the maximal performance measures for test one and
test two are presented in Table 3.1, along with the absolute and percentage differences in
each variable from test one to test two. In addition, the absolute values for the HRs
associated with these variables are also presented, along with the absolute and percentage
differences from test one to test two. There were no test-retest differences for the intensity
corresponding to the LT in swimming, cycling and running, with percentage differences of 1.4,
4.3 and 0.6%, respectively. Likewise, there were no test-retest differences for the LTP in
swimming and cycling, with percentage differences of -0.1 and 2.5%, respectively. However,
the test-retest difference for the LTP in running was significantly higher in test two (14.7km∙hr-
1) than test one (14.1km∙hr-1; P<0.05). There were no test-retest differences for the maximal
performance measures in swimming or running, or the PPO-3 in cycling. There was however, a
significant test-retest difference for the PPO-1 in cycling, which was higher in test two (394W)
than test one (385W; P<0.05). In addition, there were no test-retest differences for the HR’s
corresponding to the LT, LTP or the maximal HR in swimming, cycling and running (Table. 3.1).
3.4.2. Limits of Agreement, Typical Error of Measurement and Pearson’s Correlation Coefficient
The absolute and percentage LOA and TEM between test one and test two are presented in
Table 3.2, along with the 95% confidence intervals for the TEM. The lowest LOA values for the
LT and the LTP were in swimming (8.0 and 6.9%, respectively), followed by running (8.6 and
7.2%, respectively) and cycling (10.1 and 9.2%, respectively). Similarly, the lowest TEM values
for the LT and the LTP were in swimming (2.9 and 2.5%, respectively), followed by running (3.1
and 2.6%, respectively) and cycling (3.7 and 3.3%, respectively). Pearson’s correlation
coefficient between test one and test two are presented in Table 3.2. Every measure had a

98
significant correlation coefficient, with a Pearson’s correlation coefficient of at least 0.89
(P<0.05; Table 3.2).
3.4.3 Ordinary Least Products Regression Analysis
The slope and the intercept between test one and test two using OLPR are presented in Table
3.3, along with 95% confidence intervals for both. PPO-1 had both proportional and fixed bias
(Table 3.3), whereas every other measure had neither proportional nor fixed bias.
3.4.4 Bland Altman Plots
Bland Altman plots are presented in Fig 3.1, and show that all individual test-retest differences
were within 1.96 standard deviations of the test-retest differences.
3.4.5 Relationship between the Magnitude of the Measure and Test-Retest Difference
The relationships between the individual differences from test one to test two and the
individual mean value for test one and test two are presented in Table 3.4. Pearson’s
correlation coefficient was not significant (P>0.05) for all of the measures and the r value was
≤0.53.

99
Table. 3.1 Mean (±SD) values for all measures for test one and test two and the values for the
difference between test one and test two.
LT: Lactate Threshold, LTP: Lactate Turnpoint, FST: Fastest 150m swim time, PPO-3: 3-min
peak power output, PPO-1: 1-min peak power output, PRS-2.5: 2.5-min peak running speed,
PRS-30: 30-s peak running speed. *different from test one (P<0.05).
Discipline
Measure
Test One
Test Two Difference Difference (%)
Swimming 150m Swim Time (s) LT 142 (±13) 144 (±13) 2 (±6) 1.4 (±4.3)
LTP 130 (±11) 130 (±11) 0 (±5) -0.1 (±3.6)
FST 123 (±13) 122 (±12) -1 (±2) -0.7 (±1.5)
Heart Rate (bpm) LT 127 (±11) 124 (±15) -4 (±5) -4.9 (±5.3)
LTP 155 (±19) 151 (±19) -3 (±5) -2.1 (±3.3)
MAX 170 (±16) 168 (±14) -2 (±4) -0.9 (±2.3)
Cycling Power Output (W) LT 181 (±39) 187 (±34) 6 (±10) 4.3 (±8.5)
LTP 251 (±47) 256 (±41) 5 (±12) 2.4 (±5.5)
PPO-3 332 (±47) 337 (±51) 5 (±7) 1.4 (±2.2)
PPO-1 385 (±67) 394 (±59)* 9 (±13) 3.0 (±4.3)
Heart Rate (bpm) LT 128 (±15) 128 (±11) 0 (±7) 0.3 (±5.4)
LTP 151 (±15) 151 (±14) 0 (±4) 0.1 (±3.0)
0.2 MAX 173 (±13) 175 (±13) 1 (±2) 0.7 (±1.3)
Running Speed (km∙hr-1
) LT 12.1 (±1.6) 12.1 (±1.8) 0.1 (±0.5) 0.6 (±4.6)
LTP 14.1 (±1.9) 14.7 (±1.8)* 0.5 (±0.5) 4.0 (±4.1)
PRS-2.5 16.6 (±2.1) 16.7 (±2.1) 0.2 (±0.2) 0.9 (±1.3)
PRS-30 17.4 (±2.3) 17.6 (±2.3) 0.2 (±0.3) 1.0 (±1.6)
Heart Rate (bpm) LT 157 (±9) 155 (±10) -2 (±4) -1.0 (±2.7)
LTP 171 (±11) 174 (±9) 3 (±5) 1.8 (±2.8)
MAX 183 (±9) 185 (±9) 1 (±4) 0.7 (±2.2)

100
Table. 3.2 Limits of agreement, typical error of the measurement with 95% confidence
intervals, and Pearson’s correlation coefficient for all measures.
LT: Lactate Threshold, LTP: Lactate Turnpoint, FST: Fastest 150m swim time, PPO-3: 3-min
peak power output, PPO-1: 1-min peak power output, PRS-2.5: 2.5-min peak running speed,
PRS-30: 30-s peak running speed. TEM: Typical error of the measurement, 95% CI: 95%
Confidence Intervals, LOA: Limits of agreement, r: Pearson’s correlation coefficient. *Pearson’s
correlation coefficient (P<0.05).
Discipline Measure LOA TEM (95% CI) r
Swimming 150m Swim Time (s) LT ± 12(8.0%)
((8.0%)
4 (2.9%) (3, 8) 0.89*
LTP ± 9 (6.9%) 3 (2.5%) (2, 6) 0.92*
FST ± 4 (2.9%) 1 (1.1%) (1, 2) 0.99*
Heart Rate (bpm) LT ± 11 (8.1%) 4 (2.9%) (2, 9) 0.96*
LTP ± 10 (6.7%) 4 (2.4%) (2, 7) 0.96*
MAX ± 8 (4.6%) 3 (1.6%) (2, 5) 0.98*
Cycling Power (W) LT ± 19 (10.1%) 7 (3.7%) (5, 12) 0.97*
LTP ± 23 (9.2%) 8 (3.3%) (6, 15) 0.97*
PPO-3 ± 15 (4.3%) 5 (1.6%) (4, 10) 0.99*
PPO-1 ± 25 (6.4%) 9 (2.3%) (6, 17) 0.99*
Heart Rate (bpm) LT ± 14 (10.7%) 5 (3.9%) (3, 9) 0.89*
LTP ± 8 (5.6%) 3 (2.0%) (2, 6) 0.96*
MAX ± 4 (2.4%) 2 (0.9%) (1, 3) 0.99*
Running Speed (km∙hr-1
) LT ± 1.0 (8.6%) 0.4 (3.1%) (0.3, 0.7) 0.96*
LTP ± 1.0 (7.2%) 0.4 (2.6%) (0.3, 0.7) 0.96*
PRS-2.5 ± 0.4 (2.6%) 0.2 (0.9%) (0.1, 0.3) 0.99*
PRS-30 ± 0.5 (2.9%) 0.2 (1.1%) (0.1, 0.4) 0.99*
Heart Rate (bpm) LT ± 8 (5.3%) 3 (1.9%) (2, 5) 0.90*
LTP ± 9 (5.2%) 3 (1.9%) (2, 6) 0.92*
MAX ± 8 (4.4%) 3 (1.6%) (2, 5) 0.89*

101
Table. 3.3 The slope and intercept for all measures using Ordinary Least Products Regression
along with 95% confidence intervals.
LT: Lactate Threshold, LTP: Lactate Turnpoint, FST: Fastest 150m swim time, PPO-3: 3-min
peak power output, PPO-1: 1-min peak power output, PRS-2.5: 2.5-min peak running speed,
PRS-30: 30-s peak running speed. # proportional bias, ^fixed bias.
Discipline Measure Slope (95% CI) Intercept (95% CI)
Swimming 150m Swim Time
(s)
LT 0.98 (0.67, 1.45) 4 (-63, 50)
LTP 1.04 (0.73, 1.47) -5 (-61, 34)
FST 0.96 (0.84, 1.08) 4 (-11, 18)
Heart Rate (bpm) LT 1.07 (0.70, 1.65) -15 (-90, 34)
LTP 0.98 (0.77, 1.25) 0 (-42, 32)
MAX 0.87 (0.72, 1.05) 21 (-10, 47)
Cycling Power (W) LT 0.89 (0.74, 1.07) 26 (-7, 53)
LTP 0.89 (0.73, 1.08) 33 (-15, 73)
PPO-3 1.08 (0.98, 1.20) -22 (-62, 13)
PPO-1 0.87 (0.77, 0.98)# 60 (17, 97)^
Heart Rate (bpm) LT 0.75 (0.52, 1.09) 32 (-12, 61)
LTP 0.91 (0.72, 1.14) 14 (-22, 42)
MAX 0.99 (0.87, 1.13) 3 (-22, 24)
Running Speed (km∙hr-1
) LT 1.16 (0.93, 1.45) -2 (-5, 1)
LTP 0.96 (0.77 1.20) 1 (-2, 4)
PRS-2.5 0.99 (0.91, 1.08) 0 (-1, 2)
PRS-30 1.01 (0.90, 1.12) 0 (-2, 2)
Heart Rate (bpm) LT 1.04 (0.74, 1.47) -8 (-75, 39)
LTP 0.84 (0.61, 1.15) 31 (-23, 70)
MAX 1.04 (0.72, 1.49) -6 (-89, 52)

102
110 120 130 140 150 160 170 180-30-25
-20
-15
-10
-5
0
5
10
15
20
25
30
+1.96SD
-1.96SD
Bias
A
Mean of Test 1 and Test 2 (s)
Dif
fere
nce
be
twe
en
Te
st 1
an
d T
est
2 (
s)
100 105 110 115 120 125 130 135 140 145 150-15
-10
-5
0
5
10
15
+1.96SD
-1.96SD
Bias
B
Mean of Test 1 and Test 2 (s)
Dif
fere
nce
be
twe
en
Te
st 1
an
d T
est
2 (
s)
150 175 200 225 250 275-40-35-30-25-20-15-10
-505
1015202530
+1.96SD
-1.96SD
Bias
C
Mean of Test 1 and Test 2 (W)
Dif
fere
nce
be
twe
en
Te
st 1
an
d T
est
2 (
W)
100 125 150 175 200 225 250 275 300 325 350-40-35-30-25-20-15-10
-505
1015202530
+1.96SD
-1.96SD
Bias
D
Mean of Test 1 and Test 2 (W)
Dif
fere
nce
be
twe
en
Te
st 1
an
d T
est
2 (
W)
8 9 10 11 12 13 14 15 16 17-2.0
-1.5
-1.0
-0.5
0.0
0.5
1.0
1.5
2.0
+1.96SD
-1.96SD
Bias
E
Mean of Test 1 and Test 2 (km.hr-1)
Dif
fere
nce
be
twe
en
Te
st 1
an
d T
est
2 (
km
.hr-1)
9 10 11 12 13 14 15 16 17 18 19 20-2.0
-1.5
-1.0
-0.5
0.0
0.5
1.0
1.5
2.0
+1.96SD
-1.96SD
Bias
F
Mean of Test 1 and Test 2 (km.hr-1)
Dif
fere
nce
be
twe
en
Te
st 1
an
d T
est
2 (
km
.hr-1)
Fig. 3.1 Bland Altman plots show the relationship between the individual test-retest
differences and the mean of test one and test two for the swimming LT and LTP (A and B,
respectively), the cycling LT and LTP (C and D, respectively) and the running LT and LTP (E and
F, respectively).

103
Table. 3.4 The relationship between the difference between test one and test two and the
mean value from test one and test two.
LT: Lactate Threshold, LTP: Lactate Turnpoint, FST: Fastest 150m swim time, PPO-3: 3-min
peak power output, PPO-1: 1-min peak power output, PRS-2.5: 2.5-min peak running speed,
PRS-30: 30-s peak running speed, r: Pearson’s correlation coefficient, P: Level of significance.
Discipline Measure r P
Swimming 150m Swim Time (s) LT 0.04 0.92
LTP -0.10 0.81
FST 0.30 0.43
Cycling Power (W) LT 0.46 0.19
LTP 0.45 0.20
PPO-3 -0.53 0.12
PPO-1 0.27 0.52
Running Speed (km∙hr-1
) LT -0.47 0.17
LTP 0.16 0.67
PRS-2.5 0.06 0.87
PRS-30 -0.04 0.91

104
3.5 DISCUSSION
The test-retest error from a reproducibility study must be assessed by the investigator to
evaluate whether the value is small enough for the test to be of practical use (Atkinson &
Nevill 1998). We believe that the results of the present study suggest that the LTP, along with
the LT and maximal performance measures for swimming, cycling and running using these
standardised incremental tests can be considered reproducible for some purposes in this
population of trained endurance athletes. Indeed, the results suggest that the LTP, along with
the LT, can be used by this population of trained endurance athletes not only to assess
endurance performance, but also to demarcate training intensity zones for exercise intensity
prescription and to monitor moderate to large adaptations to training. Exercise physiologists
should take care when deciding on the duration between testing sessions to test for
adaptations from training, as adaptations need to be greater than these detected test-retest
variations (TEM) to be considered significant. These results therefore give exercise
physiologists a value (TEM) for the day-to-day variation in these measures in a group of
trained endurance athletes. Any change outside of these TEM values should be considered to
be due to reasons other than day-to-day variation, such as training/detraining, nutrition,
hydration, and diurnal biological variations.
We believe that the TEM values in the present study may not be sensitive enough to detect
changes due to short-term training/detraining in this group of trained endurance athletes.
Indeed, longer intervals between testing sessions may be required to be outside of the day-to-
day variation. However, if training is drastically changed, and large adaptations are expected
over a short time period, these measures should be adequately reproducible to detect these
changes. In fact, peak power output has been detected to be increased by 4-5% in just 4
weeks in well-trained cyclists (Lindsay et al, 1996; Laursen et al, 2002). The TEM with
confidence intervals has been suggested as the most appropriate method of analysing the

105
reproducibility of a measure (Hopkins 2000). TEM represents approximately 68% of the error
actually present in the repeated measurement of an individual in the sample. If the TEM and
the size of the confidence intervals are small, then the upper value of the confidence intervals
can be used as an estimation of the lower limit for a meaningful change in a measurement
with repeat testing (Hopkins 2000). When analysing test-retest data in an athletic population,
LOA analysis has been suggested to be too stringent for a decision limit, and in fact, half of the
LOA appears to be a more reasonable threshold (Hopkins 2000). Indeed, in the present study,
the LOA for the swimming LTP (9s) and the swimming LT (12s) are large, and not sensitive
enough to detect changes which might occur due to short periods of training/detraining.
However, these values could be considered reproducible if halved. The Pearson’s correlation
coefficients in the present study are useful for comparison with previous reproducibility
studies. In addition, a high correlation coefficient reflects acceptable relative reliability of that
particular measurement in the population that has been investigated (Atkinson & Nevill 1998).
It should be mentioned however, that it has been well established that Pearson’s correlation
coefficient should not be used exclusively in a reproducibility study (Hopkins 2000; Atkinson &
Nevill 1998). As all of the measures in the present study had significant and high correlation
coefficients (r>0.89), this is further evidence of the reproducibility of the measures.
Only the cycling PPO-1 had any sort of bias (fixed and proportional) between test one and test
two. As previously mentioned, this is likely due to a general learning effect(Atkinson & Nevill
1998) or to motivational issues (Heitkamp et al., 1991). Every other measure taken in this
study had neither fixed nor proportional bias, which is further evidence for their
reproducibility. Although Pearson’s correlation coefficient is indicative of the scatter of the
values around the line of best fit, it is possible that the slope of the line differs from unity
(proportional bias) or its intercept might differ from zero (fixed bias), and Pearson’s
correlation coefficient is not sensitive enough to detect these possibilities (Ludbrook 1997).

106
OLPR is a sensitive technique for detecting and distinguishing fixed and proportional bias
between repeated measures (Ludbrook 2010; Ludbrook 1997). It was not possible to use the
traditional least squares regression in this study, as this method requires that x-values are
fixed by the design of the study and are not subject to error (Ludbrook 1997). However, as
both the test and the retest measures in the present study are attenuated by random error,
OLPR analysis was used, as suggested by Ludbrook (1997).The principle underlying the OLPR is
to minimise the sum of the products of the x and y deviations from the line of best fit
(Ludbrook 2010). A positive or negative fixed bias is suggestive that the measure shows an
increase or decrease, respectively from test one to test two by a constant amount (Ludbrook
2010; Ludbrook 1997). Positive and negative proportional bias is indicative that test two gives
values that are higher or lower, respectively than test one by an amount that is proportional to
the level of the measured value.
To our knowledge, no study has assessed the reproducibility of the LTP in trained endurance
athletes. However, a number of studies have assessed the reproducibility of the running
speed corresponding to a blood lactate concentration of 4mmol∙L-1 in trained runners and in
agreement with the present study, found high correlation coefficients (0.89 – 0.95) (Grant et
al., 2002; Weltman et al., 1990; Sjodin et al., 1982), and LOA of -0.9, 1.5km∙hr-1 (Grant et al.,
2002). Another study found an intra-class correlation of 0.99 and a coefficient of variation of
2.4% for this measure (Pfitzinger &Freedson 1998). The reproducibility of the individual
anaerobic threshold in trained cyclists, as assessed by the blood lactate curve being fitted with
a single exponential function has been shown to have a high correlation coefficient (r=0.98;
McLellan & Jacobs 1993). Similar results to the present study have also been found for the
reproducibility of the HR at the running speed corresponding to a blood lactate concentration
of 4mmol∙L-1 in trained runners , with significant correlation coefficients (r = 0.83 – 0.96)

107
(Grant et al., 2002; Heitkamp et al., 1991; Weltman et al., 1990) and LOA of -12, 11bpm (Grant
et al., 2002).
Previous studies that have assessed the reproducibility of the LT in trained endurance athletes
have reported similar values to the present study. Trained endurance runners have found high
correlation coefficients (r = 0.89-0.94) (Grant et al., 2002; Weltman et al., 1990) and LOA of -
0.5, 1.1km∙hr-1 (Grant et al., 2002). Another study found a high intra-class correlation (0.99)
and a low coefficient of variation (1.3%) for the reproducibility of the LT in trained runners
(Pfitzinger & Freedson 1998). In agreement with the present study, good reproducibility has
been found for the HR at the LT in trained runners, with high correlation coefficients (0.93-
0.98) (Grant et al., 2002; Weltman et al., 1990) and LOA of -12, 7bpm (Grant et al., 2002). Also
in line with the present study, the reproducibility of the maximal running speed and the
maximal HR in an incremental intensity running test in trained runners have been reported to
have high correlation coefficients(r = 0.96 and 0.96, respectively; Weltman et al., 1990). Care
needs to be taken when comparing the results of the previous studies to those which have
assessed the reproducibility of blood lactate thresholds. The pre-trial nutritional intake and
exercise was not standardised in some studies, and the statistical analysis was limited
(Weltman et al., 1990; Aunola & Rusko 1984). Other studies did standardise the pre-trial
nutritional intake and exercise, although there were still limitations with the statistical analysis
used (Pfitzinger & Freedson 1998; Heitkamp et al., 1991).
The significant increase in the cycling PPO-1 from test one to test two shows a systematic bias
in this measure. This was likely due to motivational issues (Heitkamp et al., 1991) with the
participants trying to better their performance from test one in test two. This could be
reduced by blinding the subjects to their results throughout the study period but this is not
normal practice in athlete support settings where feedback is required. There was also a

108
systematic bias for the running speed at the LTP. This could have been due to a general
learning effect of the test procedure and/or running on the treadmill, therefore resulting in a
greater running economy. Although all of the subjects were familiar with incremental exercise
testing, the general learning effect could be reduced by incorporating a familiarisation trial
within a week of test one. As there were no significant decreases in performance from test
one to test two, it can be concluded that the time between tests and the conditions in the two
days prior to a test were adequate to allow sufficient recovery from test one.
In a group of recreationally active males, it was reported that the running speed and the HR
corresponding to the LT and 4mmol∙L-1 blood lactate concentration are more reliable in
individuals with a higher LT at the beginning of the study (Grant et al., 2002). This was
demonstrated by tighter values for the LOA and higher correlation coefficients between test-
retest values in the individuals with a higher initial LT. Similarly, it has been reported that the
correlation coefficient between test-retest values of the speed and HR corresponding to the
4mmol∙L-1 blood lactate concentration and the maximal running speed were higher in
endurance trained women compared to untrained women (Heitkamp et al., 1991). In the
present study, there were no statistically significant correlation coefficients between the
individual differences from test one to test two and the individual mean value for test one and
test two for any of the measures taken. This is likely due to the subjects in the present study
being trained endurance athletes.
3.6 CONCLUSIONS
The LTP, along with the LT and maximal performance measures, assessed using the methods
outlined in this study, are reproducible in this population of trained endurance athletes. These
tests can therefore be used by trained endurance athletes as part of a physiological testing
programme to assess not only endurance performance, but also to demarcate training

109
intensity zones for exercise intensity prescription and monitor moderate to large adaptations
to training. Practitioners should take care when deciding on the duration between tests to
test for adaptations from training, as adaptations need to be greater than these detected test-
retest variations (TEM) to be considered physiologically meaningful.

110
CHAPTER FOUR
A 6-MONTH ANALYSIS OF TRAINING-INTENSITY DISTRIBUTION AND PHYSIOLOGICAL
ADAPTATION IN IRONMAN TRIATHLETES

111
4.1 ABSTRACT
The present study analysed the training-intensity distribution and physiological adaptations
over a 6-month period preceding an ironman triathlon race. Ten athletes; mean (±SD) age 43
(±3) yrs, mass 78.3 (±10.3) kg, and stature 179 (±5) cm, participated. The study consisted of
three training periods (A-C), each of approximately two months' duration and four testing
weeks. Testing consisted of incremental tests to exhaustion for swimming, cycling and
running and assessments for anthropometry plus cardiovascular and pulmonary measures.
The lactate threshold and the lactate turnpoint were used to demarcate three discipline-
specific, exercise-intensity zones. The mean (±SD) percentage of time spent in zones one, two
and three was 69 (±9), 25 (±8) and 6 (±2) % for periods A-C, combined. Only modest
physiological adaptation occurred throughout the 6-month period, with small to moderate
effect sizes at best (0.02 – 0.76). Relationships between the training volume/training load and
the training-intensity distribution with the changes in key measures of adaptation were weak
and probably reflect differences in initial training status. Our data suggest that the effects of
intensity distribution are small over short-term training periods and future experimental
research is needed to clarify potential impact of intensity distribution on physiological
adaptation.

112
4.2 INTRODUCTION
Zones of exercise-intensity can be established from blood lactate concentrations at increasing
exercise intensities (Kindermann et al., 1979). Intensities lower than the lactate threshold can
be categorised as zone one, between the lactate threshold and the lactate turnpoint as zone
two and greater than the lactate turnpoint as zone three (Skinner & McLellan 1980). Blood
lactate concentration remains at or close to resting concentrations in zone one, is raised but
production and removal rates re-establish equilibrium in zone two and production exceeds
maximum clearance rates in zone three (Seiler & Kjerland 2006). The reproducibility of the
lactate threshold, the lactate turnpoint and a maximal performance measure in swimming,
cycling and running were established in chapter 3. Therefore, these thresholds and the
maximal performance measure can now be used to demarcate training zones and monitor
adaptations to training. Chapter 3 reveals the day-to-day variation in these measures, and
therefore, only improvements greater than these day-to-day variations can be considered
physiologically meaningful. The heart rate associated with specific physiological thresholds
has been used by elite and sub-elite athletes to evaluate the exercise-intensity distribution
during training sessions (Seiler & Kjerland 2006; Esteve-Lanao et al., 2005; Schumacher &
Mueller 2002). However, training time in each of these three exercise-intensity zones for
optimal physiological adaptation and avoidance of excessive stress leading to overtraining is
yet to be established.
Few studies on elite-standard athletes have assessed the time spent in each exercise-intensity
zone in the build up to competition (Seiler & Kjerland 2006; Schumacher & Mueller 2002; Lucia
et al., 2000a; Lucia et al., 2000b). These studies have used ventilatory thresholds to
demarcate three intensity zones and used the total time-in-zone approach (Seiler & Kjerland
2006) to assess the time spent in each zone. These studies reported that training time spent

113
in zone one was >80%, in zone two was <15% and in zone three was ≤5% of the total training
time. In contrast, Esteve-Lanao and colleagues (Esteve-Lanao et al., 2005) reported that in a
group of well trained, sub-elite runners, less time was spent in zone one (71%) and more time
was spent in zones two (21%) and three (8%). These authors (Esteve-Lanao et al., 2005)
reported a negative correlation between time spent in zone one and performance time during
a cross country race (10.1 km). Thus, data to date suggest that more time spent training in
zone one is beneficial for physiological adaptation and subsequent exercise performance.
Studies with elite-standard athletes (Ingham et al., 2008) and sub-elite athletes (Esteve-Lanao
et al., 2007) that have examined training-intensity distribution agree that a greater percentage
of training time spent in zone one is beneficial to performance and/or physiological
adaptation. These studies found that with no difference in training load, a group focusing on
training in zone one (≥80%) had a greater improvement in performance(Esteve-Lanao et al.,
2007) and gained greater physiological adaptation (Ingham et al., 2008) than a group who
spent less training time in that zone (~70%), suggesting that more training in zones two and
three (~30%) is not necessarily beneficial.
Hence, there is evidence that both in elite-standard and sub-elite athletes, the greatest
performance and physiological gains are achieved when training in zone one accounts for in
excess of 80% of time and training in zones two and three combined accounts for less than
20%. No observations of training-intensity distribution have been made on multisport athletes
in preparation for competition. Therefore, the purpose of the present study was to analyse
training-intensity distribution in a group of sub-elite triathletes in three separate periods
during 6-months of training preceding an ironman triathlon and to quantify effects on
physiological adaptation in the three disciplines using standard incremental tests.

114
4.3 METHODS
4.3.1 Participants
Ten healthy participants (one female) volunteered and provided written, informed consent to
take part in the study, which was approved by the local Ethics Committee, in accordance to
the Declaration of Helsinki. All participants were members of the same triathlon club. The
mean (±SD) characteristics of the participants at the beginning of the testing period were: age
43 (±3) yrs, mass 78.3 (±10.3) kg and stature 179 (±5) cm. Seven of the athletes had previously
competed in an ironman triathlon event. All athletes had been involved in endurance training
for over five years.
4.3.2 Experimental Approach to the Problem
Incremental tests to volitional exhaustion in swimming, cycling and running were used to
establish three distinct, heart-rate-defined intensity zones associated with two simple
reproducible values reflecting the lactate threshold and the lactate turnpoint; zone one
(<lactate threshold), zone two (>lactate threshold, <lactate turnpoint) and zone three (>
lactate turnpoint). The participants carried out their own training and reported all training
involving swimming, cycling and running using the ‘total time-in-zone approach’ (Seiler &
Kjerland 2006), into an online training log (www.workoutlog.com). A modified approach to
the training impulse (TRIMP; (Foster et al., 2001a) was used to assess total training load. The
study consisted of three training periods, Jan-Feb (A), Mar-Apr (B) and May-June (C), with the
mean (±SD) duration of each period being 6.9 (±0.8), 7.6 (±0.8) and 6.7 (±0.6) weeks,
respectively. There were four testing weeks (baseline, 2-months, 4-months and 6-months; Fig.
4.1) in which swimming, cycling, and running incremental tests were conducted, at least two
days apart and at the same time of day. Lactate threshold and lactate turnpoint were re-
established in each testing week, and the heart rate values corresponding to the updated

115
lactate threshold and lactate turnpoint were used to track time spent in each training zone for
the forthcoming training period.
Fig. 4.1 Outline of the study period
4.3.3 Procedures
4.3.3.1 Habituation
Habituation trials took place for all testing procedures approximately two months before the
study period. Training was recorded in the training logs in the period between the habituation
trials and the study period to enable participants to understand the detail required in the
online training log.
4.3.3.2 Swimming Test
The swimming test was a modified version of the protocol used by Pyne and colleagues (Pyne
et al., 2001) and took place in a 25 m pool, with participants wearing their own wetsuit to
replicate the ironman triathlon swim. An incremental test took place with seven 150-m
stages, each 5 s quicker than the previous, with a 3-min rest period between each stage. The
4th stage had the same pace as the athletes' 400-m time trial time, which was assessed
approximately two weeks before the start of the study. The final stage was a maximal ‘all-out’
effort to assess the best 150-m swim time. Stroke counts were counted for the third and sixth
25 m of each stage and the difference between stroke counts in the seven stages was used as
the ‘deviation in stroke counts’.

116
4.3.3.3 Cycling Test
The protocol for the cycling test was modified from a test previously described by Farina and
colleagues (Farina et al., 2004). Participants brought their own pedals and shoes for the test.
Handlebar position and saddle height of the ergometer were individualised for each
participant and retained for subsequent tests. A 5-min warm-up was completed at an external
intensity of 70 W at a self-selected cadence on a Lode cycle ergometer (Excalibur Sport,
Netherlands). This was followed immediately by an incremental test to volitional exhaustion,
starting at an intensity of 70 W and increasing by 35 W every 3 min (25 W for female) with the
cadence remaining self-selected. Immediately after this test, the participants rested for 10
min before completing a shorter high-intensity exercise test. This test consisted of 1-min
stages, starting at the intensity of the penultimate stage of the previous test, and increased by
35 W each stage (25 W for female). The test continued until volitional exhaustion. The end
time was used to calculate peak power output (PPO) (Kuipers et al., 1985):
PPO = Wfinal + ([t/60] * PI)
Where Wfinal = The power output of the final completed stage, t = the time achieved in the final
non-completed stage and PI = the power increment.
The PPO was also normalised to body mass using allometric scaling (PPO/BMb), where BM is
body mass, and b is a power exponent (Nevill et al., 1992). Allometric scaling allows for
meaningful comparisons of PPO, as the effect of body mass is properly eliminated. The PPO
and body mass from the baseline tests were plotted on a log-log scale and the power
exponent was derived from the slope of the linear regression line (0.79).
4.3.3.4 Running Test
All participants were accustomed to treadmill running. Participants completed a standardised
warm-up for 5 min at 8 km·hr-1 on a motorised treadmill (Powerjog, Cranlea and Co), set at a

117
1% incline throughout the test to simulate the energetic cost of outdoor running (Jones&
Doust 1996). This was followed by an incremental exercise test to volitional exhaustion,
starting at a speed of 9 km·hr-1 and increasing by 1 km·hr-1 every 3 min (Billat et al., 2003).
Thirty seconds before the end of each stage, participants supported their weight with their
hands and moved their feet to the sides of the treadmill belt to allow blood sampling. As in
the cycling test, the participants rested for 10 min before completing a shorter high intensity
exercise test. The test consisted of 30 s stages, starting at the intensity of the penultimate
stage of the previous test, and increasing by 0.5 km·hr-1 each stage. The test continued until
volitional exhaustion. The end time was used to calculate the maximal running speed
(Speedmax) (Kuipers et al., 1985):
Speedmax = Speedfinal + (t/30)*0.5
Where Speedfinal = The running speed of the final completed stage, t = the time achieved in the
final non-completed stage.
During each stage in the incremental tests for the three disciplines, heart rate (Polar Sports
Tester, Polar Electro, Kemplete, Finland) was recorded. At the end of each stage, a 5-µL
capillary blood sample was obtained; from the fingertip in the cycling and the running tests
and; the earlobe in the swimming test. The sample was analysed for lactate concentration by
micro-assay (LactatePro LT-1710, ArkRay Inc, Kyoto, Japan). The reliability and validity of this
device has been previously determined (Pyne et al., 2000).
The lactate threshold was determined as the final point before the blood lactate concentration
increased distinctly from its resting concentration (Aunola & Rusko 1984). The lactate
turnpoint was determined as the starting point of accelerated lactate accumulation (around 3
to 6 mmol·L-1), depending on the individual blood lactate profile (Aunola & Rusko 1984).

118
4.3.4 Reproducibility of the Measures
The typical error of measurement for the measures recorded in this study have been assessed
in our laboratory (Chapter three) and are as follows: first, the swim speed corresponding to
the lactate threshold, lactate turnpoint and best 150 m swim time were 2.9, 2.5 and 1.1%,
respectively, second; the cycling power output corresponding to the lactate threshold, lactate
turnpoint and the PPO were 3.8, 3.3 and 2.3%, respectively, and third; the run speed
corresponding to the lactate threshold, lactate turnpoint and the Speedmax were 3.1, 2.6 and
1.1%, respectively.
4.3.5 Anthropometry, Cardiovascular and Pulmonary Measures
Anthropometry was undertaken before either the cycling or the running test, and this
remained consistent for subsequent tests. On arrival at the laboratories, participants’ body
mass (Balance beam scales, John White and Son, Scotland) and stature (The Leicester Height
Measure, Seca, UK) (baseline test only) were recorded. Participants were then instructed to
lie down and Bio-Impedance Analysis (Bodystat 1500, Bodystat Ltd, Isle of Man, UK) was
performed. Participants remained lying down and breathing was controlled with a
metronome (10 breaths.min-1) for the assessment of resting heart rate and heart rate
variability over a 10 minute period (Polar Electro, Kemplete, Finland), followed by a peak flow
test (Mini-Wright White (standard range), Clement Clarke International, Essex, UK). A morning
12 hour fasted blood sample was taken from an antecubital vein for the assessment of
haematocrit, using the micro haematocrit method and immune function markers (reported
elsewhere (Cosgrove et al., 2011).
Testing was performed at the same time of day (±2 hrs) to minimise the effect of diurnal
biological variation (Atkinson & Reilly 1996). The laboratory ambient temperature was
controlled at 20◦C and relative humidity ranged between 30 and 50%. Participants drank ad

119
libitum throughout each test. Each athlete completed a training and food diary in the two
days before the initial testing week and replicated the training and diet prior to subsequent
testing sessions. Participants were instructed to exercise for no more than 60 min in zone one
in each of the two days before the testing sessions.
4.3.6 Statistical Analyses
A fully repeated-measures ANOVA compared the training volume/training load in each
discipline/training zone across training periods. Main effects of training period (A, B, C),
training discipline (swim, bike, run) and training zone (zone one, zone two, zone three) and
any interaction between these with the training volume/load were reported. One-way
repeated-measures ANOVA compared physiological measures across training periods. Post
hoc analysis was undertaken where significance was obtained with Paired Student’s t-tests
using two-tailed values of P, with the Bonferroni method of adjustment to prevent type I error.
Pearson product-moment correlation coefficients were calculated to determine associations
between; training volume and time spent in each training zone, and the percentage change in
physiological adaptations, both overall and for each discipline and between the between the
magnitude of the key responses at baseline and the magnitude of the change in the response
from baseline to 6-months. Statistical significance was accepted at P<0.05. All data are
expressed as Mean (±SD). Effect sizes for the key responses to the incremental tests were
calculated from the mean difference (baseline to 6-months) over the standard deviation of the
baseline measure. These values were judged using the descriptors suggested by Cohen
(Cohen 1988). Effect sizes were included to highlight the size of the training adaptations, as
the P value alone does not necessarily provide this information.

120
4.4 RESULTS
4.4.1 Training Volume and Training-Intensity Distribution
The mean (±SD) volume of training for periods A, B and C, combined was 203 (±71), with a
range of 92-266 hrs. There were main effects of training period for the mean training volume
and the mean training load per week (P<0.05) with both greater in period B than in period A
(P<0.05; Fig. 4.2A and 4.3A). There was also an interaction (P<0.05) for both mean training
volume and mean training load per week by discipline, with changes over training period only
for cycling. The mean cycling volume per week and the mean cycling load per week were both
greater in period B than period A (P<0.05; Fig. 4.2B and Fig. 4.3B).
There was a main effect of training zone for the mean training volume per week (P<0.05), with
post hoc analysis revealing that the mean time spent in zone one was greater in period B than
in period A (P<0.05). There was an interaction (P<0.05) for mean training volume per week by
training zone, with changes in training period observed only for zone one (Fig. 4.4). Along with
the absolute training time spent in each zone, it is also important to consider the percentage
of time spent in each zone. Percentage time spent in zones one, two and three across all
training periods was 69 (±9), 25 (±8) and 6 (±2) %, respectively. The only difference in the
percentage of time spent training in each zone for the three disciplines combined was time
spent in zone two, which was greater in period A than period C (P<0.05; Table 4.1).

121
A B C
0
2
4
6
8
10
12
14
16
A
Training Period
Mea
n T
rain
ing
Vo
lum
e (H
rs.w
k-1
)
A B C
0
1
2
3
4
5
6
7
8
Swimming
Cycling
Running
B
Training Period
Mea
n T
rain
ing
Vo
lum
e (H
rs.w
k-1
)
Fig. 4.2 A. Mean (±SD) training volume per week. B. Mean (±SD) training volume for each
discipline per week. α = different from period A (P<0.05).

122
A B C
0
200
400
600
800
1000
1200
A
Training Period
Mea
n T
rain
ing
Lo
ad (
TR
IMP
s.w
k-1
)
A B C
0
100
200
300
400
500
600
700
Swimming
Cycling
Running
B
Training Period
Mea
n T
rain
ing
Lo
ad (
TR
IMP
S.w
k-1
)
Fig. 4.3 A. Mean (±SD) training load per week. B. Mean (±SD) training load for each discipline
per week. α = different from period A (P<0.05).

123
A B C
0
1
2
3
4
5
6
7
8
9
10
11 Zone 1
Zone 2
Zone 3
Training Period
Tra
inin
g V
olu
me
(Hrs
.wk
-1)
Fig. 4.4 Mean (±SD) time spent in each zone per week. α = different from period A (P<0.05).

124
Table 4.1 Mean (±SD) percentage of time spent in each zone during periods A-C.
α = different from period A (P<0.05)
Training Period Zone 1 Zone 2 Zone 3
Overall A 62 ± 13 31 ± 12 7 ± 3
B 71 ± 7 24 ± 8 5 ± 3
C 72 ± 9 21 ± 7 α 7 ±4
Swimming A 66 ± 24 26 ± 19 9 ± 11
B 64 ± 10 27 ± 9 9 ± 6
C 69 ± 20 24 ± 16 8 ± 11
Cycling A 58 ± 15 34 ± 14 8 ± 5
B 69 ± 13 26 ± 12 5 ± 4
C 71 ± 15 α 22 ± 10 α 8 ± 6
Running A 67 ± 22 28 ± 20 5 ± 4
B 80 ± 12 16 ± 9 4 ± 5
C 76 ± 14 17 ± 11 6 ± 6

125
4.4.2 Incremental Test Responses
There was a main effect of training period for the cycling PPO normalised to body mass using
allometric scaling (P<0.05). Post hoc analysis revealed that this increase occurred only
between the baseline and 6-month time points (P<0.05; Table. 4.3). There were main effects
of training period for both the running speed at lactate threshold and the running speed at
lactate turnpoint (P<0.05). The running speed at lactate threshold improved from baseline to
2 months and 6 months, and the running speed at the lactate turnpoint improved from
baseline to 6 months (P<0.05, Table. 4.4). In both swimming and cycling, there were main
effects of training period for the maximum heart rate (P<0.05). For both disciplines, the
maximum heart rate was lower in the 4-months test than the baseline and 2-months tests
(P<0.05), but was higher in the 6-months test than the 4-months test (P<0.05). The effect sizes
for the key changes in the swimming, cycling and running incremental tests to exhaustion from
baseline to 6 months were all trivial or small, except the running speed at lactate threshold,
which was moderate (Table 4.5).
4.4.3 Anthropometry, Cardiovascular and Pulmonary Measures
There was a main effect of training period for body mass (P<0.05), which was less at 6 months
(76.8 ± 10.0) than at baseline (78.3 ± 10.3) and 2 months (77.9 ± 9.7; P<0.05). The difference
in body fat percentage between baseline (20.1 ± 2.5) and 6 months (17.7 ± 3.5) was large, with
an effect size of 1.0, despite the lack of a main effect of training period. There was a main
effect of training period for peak flow, which was higher at 6 months (621 ± 98) than at 2
months (612 ± 105) and 4 months (598 ± 106; P<0.05). There were no main effects of training
period for resting heart rate (50 ± 6) to (50 ± 7) bpm, haematocrit (44.5 ± 2.0) to (44.6 ± 2.3) %
or heart rate variability: stda (174 ± 66) to (164 ± 78)ms, and stdb: (129 ± 53) to (96 ± 63)ms.

126
4.4.4 Relationships
All of the significant relationships between training variables and percentage change in
physiological adaptation were negative. The overall training volume (periods A-C, combined)
was negatively correlated to the percentage change in swimming lactate threshold and
maximum running speed (r = -0.63 and r = -0.69, respectively, P<0.05). Similarly, overall
training volume in zone three (periods A-C, combined) was negatively correlated to the
percentage change in maximum running speed (r = -0.88, P<0.05). The time spent swimming
in zone two was negatively correlated to the percentage change in swimming lactate threshold
(r = -0.66, P<0.05) and the time spent cycling in zone three was negatively correlated to the
percentage change in cycling lactate threshold (r = -0.79, P<0.05). The percentage change in
maximum running speed was negatively correlated to both the overall running volume
(periods A-C, combined) (r = -0.69, P<0.05) and the running time in zone one (r = -0.79,
P<0.05). Finally, the running time in zone three was negatively correlated to the percentage
change in running lactate turnpoint (r = -0.80, P<0.05).
The relationship between the magnitude of the key responses at baseline and the magnitude
of the change in the response from baseline to 6-months is shown in Table 4.6. There were
significant relationships for the lactate turnpoint in all of the disciplines and the fastest 150m
swim. The lactate threshold in swimming, the peak power output in cycling and the maximal
running speed were all close to significance.

127
Table 4.2 Mean (±SD) responses to the swimming incremental test to exhaustion. See Fig. 4.1
for details about the timing of the testing weeks for training periods A, B and C.
Baseline 2-months 4-months 6-months % ∆ Baseline to 6-months
150-m time at LT
(s)
142 ± 16 141 ± 14 142 ± 14 141 ± 16 0.7
150-m time at LTP
(s)
130 ± 18 130 ± 15 130 ± 15 127 ± 14 2.3
Best 150-m Time
(s)
125 ± 18 122 ± 14 120 ± 14 121 ± 13 3.2
Max HR
(bpm)
167 ± 8 164 ± 6 160 ± 8 *α 164 ± 9 β 1.8
Deviation in SC
(3rd 25m)
4 ± 2 3 ± 1 3 ± 2 2 ± 1 50.0
Deviation in SC
(6th 25m)
4 ± 3 3 ± 1 3 ± 2 3 ± 2 25.0
LT = Lactate Threshold, LTP = Lactate Turn Point, HR = Heart Rate, RPE = Rating of Perceived
Exertion, SC = Stroke Count. *different from baseline, α different from 2-months, β different
from 4-months (P<0.05).

128
Table 4.3 Mean (±SD) responses to the cycling incremental test to exhaustion. See Fig. 4.1 for
details about the timing of the testing weeks for training periods A, B and C.
Baseline 2-months 4-months 6-months % ∆
Baseline
to 6-
months
Power at LT (W) 209 ± 33 213 ± 35 212 ± 29 216 ± 32 3.3
Power at LTP (W) 263 ± 34 263 ± 35 267 ± 29 263 ± 33 0.0
PPO (W) 373 ± 54 369 ± 52 372 ± 43 376 ± 47 0.8
PPO/BM0.79 3.43 ± 0.25 3.42 ± 0.24 3.46 ± 0.21 3.52 ± 0.23* 2.6
Max HR (bpm) 175 ± 10 173 ± 10 169 ± 12 * 174 ± 11 β 0.6
LT = Lactate Threshold, LTP = Lactate Turn Point, HR = Heart Rate, RPE = Rating of Perceived
Exertion, PPO = Peak Power Output, BM = Body Mass, ln = Natural Logarithm. *different from
baseline, α different from 2-months, β different from 4-months (P<0.05).
Table 4.4 Mean (±SD) responses to the running incremental test to exhaustion. See Fig. 4.1 for
details about the timing of the testing weeks for training periods A, B and C.
Baseline 2-months 4-months 6-months % ∆ Baseline
to 6-months
Speed at LT
(km·hr-1)
12.9 ± 1.2 13.6 ± 1.6* 13.4 ± 1.5 13.9 ± 1.6* 7.8
Speed at LTP
(km·hr-1)
15.3 ± 1.4 15.3 ± 1.5 15.6 ± 1.2 15.9 ± 1.3* 3.9
Speedmax
(km·hr-1)
17.9 ± 1.7 18.0 ± 1.6 17.9 ± 1.5 18.2 ± 1.5 1.7
Max HR
(bpm)
179 ± 12 179 ± 8 177 ± 10 179 ± 9 0.0
LT = Lactate Threshold, LTP = Lactate Turn Point, HR = Heart Rate, RPE = Rating of Perceived
Exertion. *different from baseline, α different from 2-months, β different from 4-months
(P<0.05).

129
Table. 4.5 Effect sizes for the key responses to the swimming, cycling and running incremental
tests to exhaustion from baseline to 6 months.
LT = Lactate Threshold, LTP = Lactate Turn Point, PPO = Peak Power Output, BM = Body Mass,
ln = Natural Logarithm, * Cohen (1988)
Discipline Measure Effect Size Descriptor*
Swimming 150-m time at LT (s) 0.06 Trivial
150-m time at LTP (s) 0.21 Small
Best 150-m Time (s) 0.24 Small
Cycling Power at LT (W) 0.22 Trivial
Power at LTP (W) 0.02 Trivial
PPO (W) 0.06 Trivial
PPO/BM0.79 0.34 Small
Running Speed at LT (km·hr-1) 0.76 Moderate
Speed at LTP (km·hr-1) 0.42 Small
Maximal Speed (km·hr1) 0.13 Trivial

130
Table. 4.6 The relationship between the magnitude of the key responses at baseline and the
magnitude of the change in the response from baseline to 6-months.
LT = Lactate Threshold, LTP = Lactate Turn Point, PPO = Peak Power Output, BM = Body Mass,
ln = Natural Logarithm, r = Pearson’s correlation coefficient.
Discipline Measure R p-value
Swimming 150-m time at LT (s) -0.87 0.07
150-m time at LTP (s) -0.60 <0.05
Best 150-m Time (s) -0.77 <0.05
Cycling Power at LT (W) -0.60 0.38
Power at LTP (W) -0.31 <0.05
PPO (W) -0.80 0.06
PPO/BM0.79 -0.36 0.31
Running Speed at LT (km·hr-1) -0.59 0.90
Speed at LTP (km·hr-1) 0.04 <0.05
Maximal Speed (km·hr1) -0.78 0.07

131
4.5 DISCUSSION
Over three 2-month periods preceding an ironman triathlon, with a mean training volume in
periods A, B and C of 8.1, 11.0 and 9.9 hrs·wk-1, the percentage of training time spent in zones
one, two and three was 62, 31 and 7% in period A, 71, 24 and 5% in period B and 72, 21 and
7% in period C. However, only modest physiological adaptations occurred during the entire
training period, as shown by mostly trivial and small effect sizes. The statistically significant
relationships between the training variables and the changes in the physiological adaptations
were negative. This is probably because the participants completing the highest training
volumes were already more well trained, and thus had less room for improvement in the key
markers for adaptation (Wenger & Bell 1986).
Previous research has shown that it is beneficial both for elite and sub-elite endurance
athletes to spend ≥80% of training time in zone one. This has been shown from descriptive
studies of athletes in the lead up to competition (Seiler & Kjerland 2006; Schumacher &
Mueller 2002; Lucia et al., 2000a; Lucia et al., 2000b), and in studies that have assessed
differences arising from an emphasis of training in zone one rather than in zones two and
three (Ingham et al., 2008; Esteve-Lanao et al., 2007). For all of the disciplines combined in
the present study, mean percentage time in zone one was never ≥80%, with 62, 71 and 72% of
training in zone one in periods A, B and C, respectively. Similarly, for the individual disciplines,
the mean percentage of time spent in zone one ≥80% was only once for any of the three
periods (80%; running in training period B). It has been suggested that less experienced
athletes train too hard during low-intensity sessions and not hard enough during high-intensity
sessions (Foster et al., 2001b), thus leading to a high percentage of training time in zone two.
Therefore, the lack of time in zone one, and thus relatively more time in zone two, could
explain the modest adaptations in the incremental test responses.

132
Seiler and colleagues (Seiler et al., 2007) demonstrated a delayed recovery of the autonomic
nervous system immediately after training in zones two and three, compared with training in
zone one. The authors suggested that the first ventilatory threshold demarcates a clear
threshold for autonomic recovery. The authors further proposed that training in zone one
probably induces a targeted increase or maintained stimulus for adaptation without inducing a
meaningful systemic stress response. Training in zone two leads to delays in recovery, yet
provides less stimulus for adaptation than training in zone three (Seiler et al., 2007). Other
authors agree that zone two provides a suboptimal stimulus for eliciting further gains in
endurance (Londeree 1997). Esteve-Lanao and colleagues (Esteve-Lanao et al., 2007)
suggested that when training time in zone two exceeds a certain threshold (>20% of training
time) at the expense of zone one training time, endurance is impaired via a down regulation of
the sympathetic nervous system. In the present study, percentage time spent in zone two for
all of the disciplines combined was always above 20%, i.e. 31, 24 and 21% in training periods A,
B and C, respectively. Training time in zone two is comparable with the group in the study by
Esteve-Lanao and colleagues (Esteve-Lanao et al., 2007), whose performance improvement
was less than that of a group who spent less training time in zone two (12%).
The largest adaptations gained during the study period, determined by effect sizes were for
the running lactate threshold and the running lactate turnpoint. The positive effect of zone
one training has been reported (Ingham et al., 2008; Esteve-Lanao et al., 2007), and therefore
these adaptations could have occurred because there was a greater percentage of training
time spent in zone one for running (74%) than swimming (66%) and cycling (66%). Negative
effects of excess training in zone two have been demonstrated (Esteve-Lanao et al., 2007;
Londeree 1997). Adaptations in the running lactate threshold and lactate turnpoint could be
attributable to a lower percentage of training time spent in zone two for running (20%) than

133
swimming (25%) and cycling (27%), despite these relationships not being significant. The lack
of adaptation in swimming and cycling was possibly because of a small percentage of training
time in zone one and a large percentage of training time in zone two. Although the
relationships between the training variables and the change in the running lactate threshold
and lactate turnpoint were not significant in this small group of athletes, we feel this is still a
worthwhile observation.
After the increase in training volume and training load from period A to period B, the
maximum heart rate in swimming and cycling was lower in the 4-months test than the
baseline and 2-month tests but it increased in the 6-month test. The decreased rate in the 4-
months tests could be attributable to a down regulation of the sympathetic nervous system,
as previously suggested by Esteve-Lanao and colleagues (Esteve-Lanao et al., 2007).
Overreaching can cause a decrease in maximum heart rate without a change in heart rate
variability (Hedelin et al., 2000), as in the present study. However, formal identification of
overreaching also requires a decrease in performance (Halson & Jeukendrup 2004), which was
not assessed in the present study. However, it is a possibility that some of the athletes were
fatigued/overreaching during period B, before recovering during period C. This is normal for
endurance athletes, with performance being intentionally depressed during overreaching
phases to allow for a supercompensation effect prior to key competitions (Fiskerstrand &
Seiler 2004).
It is clear from the magnitude of the effect sizes that adaptations here in athletes preparing for
an ironman triathlon are small. It is possible that the incremental tests conducted were not
sensitive enough to detect adaptations that had occurred. In fact, these changes are in line
with those observed for the day-to-day variability in chapter three, which is further suggestion
for a lack of physiological adaptation in these athletes. Indeed, this has important implications

134
for monitoring training adaptation in athletes using these methods. Although speculative,
while the lactate threshold/lactate turnpoint did not improve markedly, the percentage of the
lactate threshold/lactate turnpoint at which the participants were able to race in the ironman
triathlon could have been increasing throughout the study. Therefore, it is possible that
performance measures such as longer time trials for each of the disciplines would have
detected greater improvements. It should be noted, that we acknowledge the potential effect
on the results of including mixed sex participants (Oosthuyse & Bosch, 2010). On analysis of
the results, including the data from the female participant did not alter the findings of this
study, and so these results were included.
4.6 CONCLUSIONS
To the best of the author’s knowledge, this is the first study to have assessed training-intensity
distribution in a group of multisport athletes training for an ironman triathlon. This follows on
from studies of cyclists, runners, rowers and cross country skiers. Given the number of
variables associated with assessing the training-intensity distribution in multisport athletes, it
is not easy to draw conclusions as to the effectiveness of the training in the different
disciplines on the key measures of adaptation in the different disciplines. The present study
highlights the need for future research to focus on experimental manipulation of training-
intensity distribution and thus improve our understanding of its impact on the training-
induced adaptations in endurance athletes.

135
CHAPTER FIVE
THE IMPACT OF MANIPULATING TRAINING-INTENSITY DISTRIBUTION IN TRAINED CYCLISTS

136
5.1 ABSTRACT
Purpose: To compare the impact of a polarised training model and a threshold training model
on performance and physiological adaptation in trained cyclists. Methods: Twelve male
trained cyclists; mean (±SD) age 37 (±6) yrs, mass 76.8 (±6.6) kg, and stature 178 (±6) cm, took
part in the study. The study consisted of two 6-week training interventions and used a cross-
over, within-subject study design. A polarised training model (P) consisting of 80 (±4) % of
training time in zone one (<lactate threshold (LT)) and 20 (±4) % in zone three (>lactate turn
point (LTP)) and a threshold training model (T) consisting of 57 (±10) % of training time in zone
one and 43 (±10) % in zone two (half-way between the LT and the LTP) were prescribed. A
training wash out period of 4-weeks was used between each training intervention, including
low intensity training of reduced volume. Performance was measured with a 40km time trial,
peak power output (PPO), and time to exhaustion at 95% pre-training PPO. Physiological
adaptation was measured using the LT, LTP, maximal activities of skeletal muscle oxidative
enzymes and heart rate responses to the performance tests. Results: T had a higher weekly
training volume (22%) and training load (23%) than P. The time to exhaustion at 95% of pre-
training PPO improved in both P (84.9 (±44.1) %; P<0.05) and T (37.4 (±47.3) %; P<0.05) with
the percentage change greater in P than T (P<0.05). The PPO was improved following P
(P<0.05) but not T and the percentage change in PPO was greater in P (7.7 (±5.1) %) than T (2.7
(±4.5) %; P<0.05). 40km time trial mean power improved in both P (8.1 (±7.7) %) and T (4.2
(±5.7) %, P<0.05) with no difference in the percentage improvement between the groups.
There was no difference in the maximal activity of citrate synthase from pre to post training in
either P (47 (±6) to 48 (±4)) mmol∙kgwet wt-1∙min-1 or T (47 (±5) to 49 (±3)) mmol∙kgwet wt-
1∙min-1. Likewise, there was no difference from pre to post training in the maximal activity of
beta-hydroxylacyl-CoA dehydrogenase from pre to post training in either P (15 (±2) to 15 (±2))
mmol∙kgwetwt-1∙min-1 or T (15 (±2) to 15 (±1)) mmol∙kgwetwt-1∙min-1. Conclusion: A polarised

137
training model is recommended for trained cyclists wishing to improve performance and
physiological adaptation over a short-term training period.
Key Words:
Endurance Training, Training Zones, Lactate Threshold, Oxidative Enzymes, Physiological
Adaptation, Endurance Performance

138
5.2 INTRODUCTION
In chapter four, it was concluded that an accurate assessment of the effectiveness of training-
intensity distribution in multisport athletes is difficult due to the number of variables involved.
It was also reported in chapter four that there were only small physiological adaptations in a
group of ironman triathletes over 6-months of training. It is possible, based on the findings of
previous research (Esteve-Lanao et al, 2005; Esteve-Lanao et al, 2007; Ingham et al, 2008) that
the small physiological adaptations were due to the athletes spending too much time in zone
two at the expense of training time in zone one. This suggestion is supported in chapter four,
with the finding that the largest adaptations were found in running, the discipline in which the
athletes spent the greatest proportion of time in zone one and the lowest proportion of time
in zone two. Therefore, in order to assess the effectiveness of training-intensity distribution
with more accuracy in this chapter, we used one discipline and fixed the proportion of time
spent in each training-intensity zone. Conclusions can then be made as to the effect of
spending different proportions of training time in each training-intensity zone. Moreover, the
reproducibility of the lactate threshold, lactate turnpoint and a maximal performance measure
have been established for cycling in chapter three, so these measures can be used in the
present study.
The purpose of training for an endurance athlete is to improve endurance performance and
develop the components of endurance performance, whilst avoiding overtraining (Fiskerstrand
& Seiler 2004). Training intensity is commonly demarcated into three distinct zones, based on
two blood lactate and/or ventilatory thresholds (Skinner & McLellan 1980). Blood lactate
concentration remains at or close to resting concentrations in zone one, is raised but
production and removal rates re-establish equilibrium in zone two, and production exceeds
maximum clearance rates in zone three (Seiler & Kjerland 2006). The percentage of time

139
spent training in each of these three zones is known as the training-intensity distribution. It
has been suggested that two distinct training-intensity distribution models are apparent in
training studies (Seiler & Kjerland 2006). A polarised training model (P) consists of a high
percentage of training time at low exercise intensities (zone one; ~80%) accompanied by
relatively small amounts of training time at higher exercise intensities (zones two and three,
combined; ~20%). In contrast, a threshold training model (T) consists of a large proportion of
training time spent in zone two.
A number of descriptive studies have assessed training-intensity distribution in elite
endurance athletes from different sports, including; cross-country skiing (Sandbakk et al.,
2010; Seiler & Kjerland 2006); rowing (Guellich et al., 2009); road cycling (Lucia et al., 2000a;
Lucia et al., 2000b) and track cycling (Schumacher & Mueller 2002). These studies
demonstrate that elite endurance athletes adopt a high training volume relative to their event,
with ~80% of training time in zone one and ~20% of training time in zones two and three,
combined. These studies give an indication of a successful, but not necessarily an optimal
training-intensity distribution. Indeed, the positive effect of a high training volume has been
reported, with a greater overall training volume being associated with better performance
(Sandbakk et al., 2010; Billat et al., 2001). In addition, the positive effect of a high volume of
training in zone one has been demonstrated by Esteve-Lanao and colleagues (Esteve-Lanao et
al., 2005). They showed a significant relationship between performance in both long and short
distance cross-country running races with time spent training in zone one, but not with time
spent in zones two and three. Previous research therefore demonstrates the importance of a
high total training volume, a high volume in zone one and careful management of higher
intensity training (zones two and three).

140
Experimental studies that have manipulated the training-intensity distribution have shown
that a high percentage of training time in zone one is beneficial (Ingham et al., 2008; Esteve-
Lanao et al.,2007), thus supporting the descriptive data. These studies show that a high
percentage of training time in zone one (≥80%) improves performance (Esteve-Lanao et al.,
2007) and physiological adaptation (Ingham et al., 2008) to a greater extent than a lower
percentage of time in zone one (~70%). A group of studies from South Africa (Westgarth-
Taylor et al., 1997; Weston et al., 1997; Lindsay et al., 1996) found that a transition to a more
polarised training approach improved performance in a group of well-trained cyclists. These
athletes were training with a high training volume (~300km) and replaced ~15% of the training
volume with high intensity interval training. In addition, previous studies have reported that
higher performing elite runners train with more time at high intensities (zone 3) than their
lower performing counterparts, with no difference in overall training volume (Billat et al.,
2001) or with a lower overall training volume (Billat et al., 2003).
However, in contrast to the previously described results, some training-intensity distribution
models with less time in zone one and more time in zones two and three have been reported
to be more effective than training-intensity distribution models with more time in zone one
(Gaskill et al., 1999; Evertsen et al., 1999). In addition, following a period of training
incorporating two sessions per week at the maximal lactate steady state (MLSS) intensity (top-
end of zone two), the VO2max, running speed at MLSS and the duration and distance
maintained at MLSS were significantly improved in well-trained runners (Billat et al., 2004).
Previous studies have also reported that in moderately trained individuals, there is no
difference in physiological adaptation or performance following training continuously at, or
intermittently above and below the maximal lactate steady state (Philp et al., 2008), or the
anaerobic threshold (Keith et al., 1992). Therefore, our understanding of an optimal

141
manipulation of training-intensity distribution in endurance athletes for maximal performance
gains and physiological adaptation is far from complete.
Both P and T training models have been reported to be effective in trained endurance
athletes, but no study has directly compared these two training models. The purpose of the
present study was therefore to compare the impact of P with T, on endurance performance
and physiological adaptation in trained male cyclists.

142
5.3. METHODS
5.3.1 Subject Information
Twelve well-trained, male cyclists were recruited from local cycling clubs and provided written,
informed consent to take part in the study, which was approved by the University of Stirling,
School of Sport Ethics Committee, in accordance to the Declaration of Helsinki. The mean
(±SD) characteristics of the participants at the beginning of the testing period were: age 37
(±6) years, body mass 76.8 (±6.6) kg, stature 178 (±6) cm, PPO in an incremental intensity test
to exhaustion with 3 min stages 359 (± 31) W.
5.3.2 Study Design
A cross-over, within-subject study design was employed. All subjects completed at least two
40km time trial (40km TT) habituation trials (CompuTrainer, RacerMate, Seattle, WA) prior to
the start of the study period. Only riders who completed the 40km TT with a mean power
output greater than 240W were included in the study. Subjects were pair-matched into two
experimental groups (n=6), based on the mean power output of the 40km TT habituation
trials.
5.3.3 Wash-Out Period
In the 4-weeks preceding each training period, subjects were instructed to not include any
threshold/tempo rides, interval sessions or races, and ride only at a low intensity, whilst
maintaining their normal training volume. This was to ensure that no adaptations from
training above the lactate threshold (LT) were gained in the 4-weeks prior to the study period.
This 4-week period was followed by one week of laboratory testing.
5.3.4 Training
For 6-weeks following the laboratory testing, subjects came into the laboratory 3d∙wk-1 (Mon,
Wed and Fri) for training-model specific, controlled training sessions. Training intensity was

143
prescribed in relation to the LT and the LTP and used the session goal approach (Seiler &
Kjerland 2006). When individuals exercise at an intensity relative to LT’s, metabolic and
cardiac stresses are similar, but can vary significantly when training at a percentage of VO2peak
(Baldwin et al., 2000). The aim for P was to achieve 80% of training time in zone one (284min)
and 20% of training time in zone three (72min), a total of 356min∙wk-1, with no time in zone
two. The aim for T was to achieve 60% of training time in zone one (270min) and 40% of
training time in zone two (180min), a total of 450min∙wk-1, with no zone three time. The
different total training volume results from an attempt to match the absolute time spent
training in zone 1. All laboratory training was completed on a CompuTrainer, calibrated to
3.5lb following a 10-min warm up.
5.3.4.1 Polarised Training Group
P sessions consisted of 6 intervals of 4min duration with 2min rest periods. The power output
of the 6 intervals was 5-10% greater than the LTP (zone 3). The average peak HR reached from
each of the 6 intervals was greater than the HR corresponding to the LTP in the incremental
test in all cases. Therefore, both power output and HR for the 6 intervals were in zone three,
according to the session goal approach (Seiler & Kjerland 2006). During the rest periods,
subjects either stopped pedalling or pedalled backwards, and this remained consistent for
every training session. The minimum HR reached during the 2min recovery period was
recorded. A 10-point rating of perceived exertion (RPE) developed by Foster and colleagues
(Foster et al., 1996; Foster 1998) was taken within 15min of finishing each training session. If
the RPE, along with the mean peak HR and the mean minimum HR were decreasing over two
consecutive training sessions, the power output for the intervals was increased by 5-10W.
5.3.4.2 Threshold Training Group
T sessions included 60min at a power output set half-way between the LT and the LTP (zone
two). The average HR for the 60min training session was recorded and the RPE was taken

144
within 15min of finishing each training session. If the RPE and the average HR were decreasing
over two consecutive training sessions, the power output was increased by 5-10W.
5.3.4.3 Zone One Training
The zone one training for both groups was made up of the warm-up and cool-down for the
laboratory training sessions (15-20min∙session-1) and low intensity cycling on the days
between the interval sessions. The intensity of the zone one training was controlled with HR,
and the average HR for a zone one session did not exceed the value associated with the LT, as
assessed in the incremental test to exhaustion, as suggested by Seiler &Kjerland (Seiler
&Kjerland 2006) when using the session goal approach. Subjects were requested to maintain
a HR 5bpm below the HR corresponding to the LT at all times during a zone one training
session.
5.3.5 Laboratory Testing
Before and after each training intervention, subjects reported to the laboratory between 7:00
and 9:00 in a rested, fasted state. A microbiopsy (Bard Magnum Biopsy System, Bard
Peripheral Vascular Inc, AZ, USA) of the vastus lateralis muscle was performed, as described by
Hayot and colleagues (Hayot et al., 2005), under local anaesthetic (Lidocaine, hydrochloride
injection, Antigen Pharmaceuticals Ltd, Tipperary, Ireland; 2ml per subject). Approximately
10-20mg of tissue was collected from 1-3 samples. The tissue was immediately quenched in
liquid nitrogen and stored until later analysis. Briefly, a small piece of frozen wet muscle (5-
8mg) was removed from the pre- and post-training resting biopsy for the determination of two
key mitochondrial oxidative enzymes; citrate synthase (CS) and beta-hydroxylacyl-CoA
dehydrogenase (β-HAD) using spectrophotometric methods (ILAB Aries, Instrumention
Laboratory, Italy), as described elsewhere (Bergmeyer 1974;Srere 1969). Briefly, the muscle
sample was fully homogenised in 100µL of homogenising solution per mg of muscle, and put

145
immediately into liquid nitrogen. The homogenising solution was then put through two sets of
freeze-thaw cycles before analysis.
Subjects reported to the laboratory for a second time between 15:00 and 20:00 for an
incremental cycle test to exhaustion. Body mass (beam balance scales) was assessed wearing
minimal clothing and stature taken (The Leicester Height Measure, Seca, UK). For the
incremental test, a CompuTrainer was used in ergometer mode, fitted with the subjects own
bike. Following a 10-min warm up, the CompuTrainer was calibrated to 3.5lbs, as instructed
by the manufacturers for accuracy up to 500W. The test started at 100W and increased by
40W every 3-min, until volitional exhaustion, with the cadence remaining self-selected, but
the speed being held above 14mph, for accurate measurements of power output. 30-s before
the end of each 3-min stage, HR (S625X, Polar Electro, Kemplete, Finland) was recorded and a
5-µL capillary blood sample was obtained and analysed for lactate concentration by micro-
assay (LactatePro LT-1710, ArkRay Inc., Kyoto, Japan). The reliability and validity of this device
has been previously determined (Pyne et al., 2000). The LT was determined as the final point
before the blood lactate concentration increased distinctly from its resting concentration
(Aunola & Rusko 1984). The lactate turnpoint (LTP) was determined as the starting point of
accelerated lactate accumulation (around 3 to 6mmol∙L-1), depending on the individual blood
lactate profile (Aunola & Rusko 1984).
5.3.5.1 Peak Power Output Determination
The measure for Peak Power Output (PPO) was assessed using the following equation (Kuipers
et al., 1985):
PPO = Wfinal + ([t/180] ∙ 40)

146
Where, Wfinal= the power output of the final completed stage (W), t = the time spent in the
final uncompleted stage (s), 180 = the duration of each stage (s) and 40 = the increase in
power output of each stage (W).
5.3.5.2 Time to Exhaustion at 95% Peak Power Output
Immediately following the incremental test to exhaustion, the power was decreased to 100W
and the subject was asked to pedal at a self-selected cadence for 10 min. At 5-min, the
CompuTrainer was re-calibrated to 3.5lbs. At 10-min, the power output was increased to 95%
of PPO, and the subject was requested to maintain a speed above 14mph until volitional
exhaustion. The time achieved was recorded to the nearest second, along with the peak HR
achieved during the test.
5.3.5.3 40km Time Trial
On a separate day, but within three days of the incremental test to exhaustion, a 40kmTT was
performed. Subjects brought their own bike into the laboratory and set it up on a
CompuTrainer Multirider System (RacerMate, Seattle, WA). Following a 10-min warm up, the
CompuTrainers were calibrated to 3.5lbs. Subjects were instructed to complete the TT as fast
as possible. The only data the subjects could see was distance completed for themselves and
the other riders in the group. Up to 8-riders completed this test at any one time, with the
same riders for pre and post P and T. HR (Polar Team System, Polar Electro, Kemplete,
Finland) was taken throughout the TT and was blind to the subject.
5.3.6 Reproducibility of the Measures
The typical error of measurement for the LT, LTP and PPO have been assessed in our
laboratory, and were found to be 3.7, 3.3, 2.3% (Chapter three). In addition, the typical error
of measurement for the 40km TT mean power output for the participants in the present study,
in our laboratory has been found to be 2.0%. Data for the reproducibility of the 40km TT
mean power are presented in a Bland Altman plot (Fig. 5.1).

147
Fig. 5.1 Bland Altman plot to show the relationship between the individual test-retest
differences and the mean of test one and test two for the 40km TT mean power output.
5.3.7 Mood Questionnaire
The Brunel Mood Scale (BRUMS) questionnaire (Terry et al., 2003) was collected in the
laboratory every Friday during each of the 6-week training blocks. This questionnaire contains
24 simple mood descriptors with 6 subscales; anger, confusion, depression, fatigue, tension
and vigour. It took 1-2 min to complete and was answered using the response time frame
‘How have you felt in the past week including today’.
5.3.8 Statistical Analyses
Statistical analysis was performed using SPSS version 18 (Chicago, Il, USA). A fully repeated-
measures ANOVA (2x2) compared the performance/physiological adaptation measures
between training-intensity distribution models (P and T) and over time (pre to post). Main
effects between training-intensity distribution models, over time and any interaction between
these and the performance/physiological adaptation measures were reported. Post hoc
analysis was undertaken where significance was obtained with Paired Student’s t-tests using
two-tailed values of P, with the Bonferroni method of adjustment to prevent type I error.
Paired Student’s t-tests using two-tailed values of P were used to compare training variables
between P and T. Statistical significance was accepted at P<0.05. All data are expressed as
Mean (±SD). Effect sizes for the key performance/physiological adaptation measures were

148
calculated from the mean difference (pre to post) over the standard deviation of the baseline
measure. These values were judged using the descriptors suggested by Cohen (Cohen 1988).
Effect sizes were included to highlight the size of the performance/physiological adaptation
changes, as the P value alone does not necessarily provide this information.

149
5.4 RESULTS
One subject dropped out of the study, due to injury. Training adherence for the 11 remaining
subjects was 96 and 97% for P and T, respectively.
5.4.1 Training
The training volume (22% higher) and the training load (23% higher) were significantly
different in T than P (P<0.05) due to the nature of the study design. The percentage of time
spent in each training intensity zone was as intended (Table. 5.1).
Table. 5.1 Mean (±SD) Details of the training for the polarised and the threshold training models.
P T
Training Volume (min∙wk-1) 381 (±85) 458 (±120)*
Training Load (TRIMPS∙wk-1) 517 (±90) 633 (±119)*
Zone 1 (%) 80 (±4) 57 (±9)*
Zone 2 (%) 0 (±0) 43 (±9)*
Zone 3 (%) 20 (±4) 0 (±0)*
P: Polarised Training Model; T: Threshold Training Model; TRIMP: Training Impulse.
*Difference between P and T (P<0.05).
5.4.1.1 Polarised Training Model
There was a main effect over time for the power output sustained during each of the 4min
intervals (P<0.05), due to an increase from week one (319 ± 33 W) to week six (340 ±34 W;
P<0.05), an increase of 6.8 (±4.2) %. There were no differences over time for the mean peak
HR reached for the 6-intervals (169 ±10 to 169 ±9bpm), the mean minimum HR during the
recovery (111 ±14 to 108 ±14bpm), the RPE (7 ± 1 to 8 ±1) or the peak HR reached during the
session (173 ± 10 to 171 ± 9 bpm).

150
5.4.1.2 Threshold Training Model
There was a main effect over time for the power output sustained during the 60min threshold
sessions (P<0.05), due to an increase from week one (266 ± 31 W) to week six (290 ±32 W;
P<0.05), an increase of 9.2 (±5.0) %. There were no differences over time for the mean HR
during the 60min ride (158 ±12 to 159 ±9bpm), or the RPE (5 ± 1 to 6 ± 1). At the beginning of
T, the power output of the training sessions corresponded to 114 (±4) % of the LT power
output and 91 (±3) % of the LTP power output.
5.4.2 Endurance Performance and Physiological Adaptation
5.4.2.1 40km Time Trial
There was a main effect over time for the 40km TT mean power output and also for the mean
HR (P<0.05; Fig. 5.2). The 40km TT mean power output was higher and the mean heart rate
was lower from pre to post training in both P and T (Fig. 5.2). The percentage change in the
mean power output from pre to post training was not significantly different between P and T
(8 ± 8 and 4 ± 6 %, respectively; P<0.05). Likewise, the percentage change in the mean HR
during the 40km TT was not different between P and T (-1.6 ± 1.4 and -1.3 ± 1.3 %,
respectively).
5.4.2.2 Responses from the Incremental Intensity Test to Exhaustion
There was a main effect over time for the LTP and for the PPO (P<0.05; Fig. 5.3). There was an
interaction (P<0.05) for the PPO by training-intensity distribution model, due to an increase
from pre to post training in P (P<0.05) but not T. The percentage change in PPO from pre to
post training was higher in P (8 (±5) %) than in T (3 (±4) %). There was a main effect over time
for the maximum HR reached in the incremental test to exhaustion (P<0.05), due to a decrease
from pre to post training in both P and T (P<0.05). There was no difference in the percentage
change in the maximal HR between P and T (-1.5 ± 1.9 and -1.8 ± 2.3 %, respectively).

151
5.4.2.3 Time to Exhaustion at 95% Pre-Training Peak Power Output
There was a main effect over time for the TTE at 95% of the pre-training PPO (P<0.05; Fig. 5.4),
with increases from pre to post training for both P and T (P<0.05). There was an interaction
(P<0.05) for the TTE by training-intensity distribution model, due to a greater percentage
increase from pre to post training in P (85 (±44) %; P<0.05) than in T (37 (±47) %; P<0.05).
There was a main effect over time for the peak HR reached during the TTE (P<0.05; Fig. 5.4),
due to a decrease from pre to post training in both P and T (P<0.05). There was no difference
in the percentage change in the peak HR reached during the TTE between P and T (-2.0 ± 2.2
and -2.2 ±2.1 %, respectively).
5.4.2.4 Skeletal Muscle Oxidative Enzymes
There were no main effects over time or of training-intensity distribution model in the
maximal activities of the skeletal muscle oxidative enzymes, CS or β-HAD. The maximal
activity of CS from pre to post training in P and T was 47 (±6) to 48 (±4) mmol∙kgwet wt-1∙min-1
and 47 (±5) to 49 (±3) mmol∙kgwet wt-1∙min-1, respectively. The maximal activity of β-HAD
from pre to post training in P and T was 15 (±2) to 15 (±2) mmol∙kgwetwt-1∙min-1 and 15 (±2) to
15 (±1) mmol∙kgwetwt-1∙min-1, respectively.
5.4.2.5 Brunel Mood Scale
There were no differences between P and T for anger, confusion, depression, fatigue, tension
or vigour in the BRUMS questionnaire (Table. 5.3).
5.4.2.6 Body Mass
Body mass did not change from pre to post training in either P (76.5 ± 6.3 to 76.6 ± 6.2 kg) or T
(77.3 ± 6.7 to 76.5 ± 6.0 kg).

152
Fig 5.2 Mean (±SD) 40km time trial mean power output and mean heart rate. P: Polarised Training Model; T: Threshold Training Model. * Different from pre (P<0.05).
Fig. 5.3 Mean (±SD) power output corresponding to the LT, LTP and PPO.LT: Lactate Threshold;
LTP: Lactate Turn Point; PPO: Peak Power Output; P: Polarised Training Model; T: Threshold
Training Model. * Different from pre (P<0.05).

153
Fig. 5.4 Mean (±SD) TTE at 95% pre PPO. TTE: Time to Exhaustion; PPO: Peak Power Output.
P: Polarised Training Model; T: Threshold Training Model. * Different from pre (P<0.05).
Table. 5.2 Effect sizes for the key performance measures.
Training Model Measure Effect Size Descriptor*
P 40km TT MPO (W) 0.57 Moderate
LT (W) 0.59 Moderate
LTP (W) 0.40 Small
PPO (W) 0.77 Moderate
TTE (s) 2.44 Large
T 40km TT MPO (W) 0.35 Small
LT (W) 0.11 Trivial
LTP (W) 0.34 Small
PPO(W) 0.26 Small
TTE (s) 0.99 Large
P: Polarised Training Model; T: Threshold Training Model, MPO = Mean Power Output, TT =
Time Trial; LT = Lactate Threshold; LTP = Lactate Turnpoint; PPO = Peak Power Output, TTE =
Time To Exhaustion, * Cohen (1988).

154
Table. 5.3 Mean (±SD) responses from the BRUMS questionnaire. Data are the mean from the weekly responses.
P T
Anger 1.7 (±1.6) 1.0 (±1.0)
Confusion 0.8 (±1.0) 0.5 (±0.9)
Depression 0.8 (±0.9) 0.6 (±0.7)
Fatigue 3.6 (±1.7) 3.3 (±1.9)
Tension 1.2 (±1.2) 1.0 (±1.4)
Vigour 7.1 (±2.9) 8.0 (±2.9)

155
5.5 DISCUSSION
Despite a greater training volume and training load in T, there were greater improvements
following P compared with T for the TTE at 95% pre-training PPO and the PPO. Although there
was no statistically significant difference between P and T for the improvement in 40km TT
from pre to post training, the effect size was much larger for P. In fact, the effect sizes for all
of the key performance and physiological adaptation markers were larger for P compared with
T. Elite endurance athletes have been shown to train with a high training volume and a high
training load relative to their discipline, with ~80% of training at low intensities (zone one) and
~20% of training at higher intensities (zones two and three, combined) (Sandbakk et al., 2010;
Guellich et al., 2009; Seiler & Kjerland 2006; Schumacher & Mueller 2002; Lucia et al., 2000a;
Lucia et al., 2000b). The present study demonstrates that with a similar training-intensity
distribution to the elite endurance athletes in previous studies (80% in zone one, 20% in zone
three), greater improvements can be achieved compared with a different training-intensity
distribution (57% in zone one, 43% in zone two). It is noteworthy that this difference exists
despite a greater training volume and training load in T compared with P. This study therefore
confirms the effectiveness of a polarised training model in well-trained endurance athletes
even when absolute training time spent in zone one is matched.
Previous experimental studies in this area have revealed that training programmes
incorporating a greater percentage of time in zone one in place of time in zone two leads to
greater improvements in endurance performance (Esteve-Lanao et al., 2007) and physiological
adaptation (Ingham et al., 2008). The present study is in agreement with these previous
studies, as there was a significantly higher percentage of training in zone one in P compared
with T. It is has been reported that zone one training is sufficient to maximise the increase in
mitochondria in type I muscle fibres (Dudley et al, 1987), and this could be the explanation for
its effectiveness in well-trained endurance athletes.

156
It has been suggested that endurance athletes might not achieve optimal gains in performance
and/or physiological adaptation by spending too much time in zone two (Esteve-Lanao et al.,
2007; Londeree 1997). The mechanisms responsible for these findings are not well
understood, but Esteve-Lanao and colleagues (Esteve-Lanao et al., 2007) suggest that it could
be due to a down-regulation of the sympathetic nervous system. Indeed, in agreement with
the present study, a group of elite runners that spent more time at an intensity corresponding
to the LT (zone two) had a lower performance level than a group of elite runners that spent
less time in zone two and more time in zone three, despite a higher training volume (Billat et
al., 2003). In addition, the recovery from the training sessions might explain the effectiveness
of P compared with T. It has been reported that the acute recovery from a training session in
zone one is faster than following a training session in zone two, yet the recovery following a
training session in zone three is no different than following a session in zone two (Seiler et al,
2007). It has been reported that training at a higher intensity leads to larger physiological
adaptation (Edge et al, 2006; Helgerud et al, 2007; Daussin et al, 2007; Driller et al, 2009).
Therefore, with no difference in the recovery from the training sessions of different intensities
(Seiler et al, 2007), it is possible that the training in zone three is more effective at inducing
positive responses in endurance athletes than training in zone two. Moreover, as the recovery
is enhanced more in zone one than zone two, it has been recommended to supplement zone
three training with training in zone one (Seiler et al, 2007). In the present study,
improvements in the 40km TT and the TTE for both P and T suggest that overreaching did not
take place during either training intervention, and that while P appears to provide a stronger
stimulus for improvement in 40km TT performance, both training models result in large gains
in high-intensity exercise capacity. In addition, no differences between P and T in the mood
questionnaire suggests no difference in the training stress.

157
The effectiveness of a training-intensity distribution containing ~80% of total training time in
zone one and ~20% in zone three, as used for P in the present study have been suggested to
be due to the intensity-specific adaptations and the enhanced recovery (Seiler & Kjerland,
2006). In fact, cardiovascular adaptations (Helgerud et al, 2007) and buffering capacity (Edge
et al, 2006) have been reported to be enhanced more following a training period including
higher intensity exercise. In the present study however, although there were decreases in the
mean HR during the 40km TT, the peak HR during the TTE and the maximal HR for both P and
T, there were no differences in the percentage change between P and T. This suggests that
cardiovascular adaptations were not responsible for the differences in response between P
and T in the present study. Although not statistically significant, the improvement in the LT
and the LTP from pre to post in P were greater than in T, as shown by higher effect sizes. This
may have been due to a greater decrease in lactate production (Favier et al., 1986) or a
greater increase in lactate clearance (Donovan & Brooks 1983) in P compared to T. A greater
decrease in lactate production would have been due to; a more improved oxygen supply and
thus less need for anaerobic ATP production (Evertsen et al., 2001) or a greater increase in the
capacity for pyruvate oxidation (Holloszy & Coyle 1984). Monocarboxylate transporter 1
(MCT1) is in oxidative slow twitch muscle fibres and transports lactate from blood to muscle to
be oxidised (Evertsen et al., 2001). It has been reported that the expression and concentration
of MCT1 is increased more at higher exercise intensities (Pilegaard et al., 1999a), and could
therefore be a contributing factor in the greater increase in the LT and the LTP following P
compared with T. Other contributing factors could include greater increases in buffering
capacity and capillarity, which have both been reported to be increased more at higher
exercise intensities (Iaia et al., 2009; Edge et al., 2006). The increase in buffering capacity is
intensity-specific because the muscle tries to maintain homeostasis and therefore attempts to
maintain the pH in the muscle. As the pH in the muscle is changed more during higher
intensity exercise, the effects on buffering capacity are higher.

158
Previous studies have found comparable improvements in endurance performance in well-
trained endurance athletes following a similar period of interval training as used for P in the
present study (Westgarth-Taylor et al., 1997; Weston et al., 1997; Lindsay et al., 1996).
Improvements in performance have been associated with reduced substrate phosphorylation
and an increased fat oxidation at high intensities (Clark et al., 2004; Stepto et al., 1999;
Westgarth-Taylor et al., 1997; Weston et al., 1997). In a study assessing optimal high intensity
interval training programmes, the programme chosen for the present study has been reported
to be very effective in already well-trained cyclists (Stepto et al., 1999). Therefore, the
improvements in endurance performance and physiological adaptation reported in the
present study following P are perhaps not surprising. However, no study to date has
attempted to compare a purely polarised training model (no training in zone two) with a
purely threshold training model (no training time in zone three) in well-trained endurance
athletes. Therefore, this study confirms the effectiveness of a polarised training model in well-
trained endurance athletes.
It is possible that the greater training intensity in P compared with T caused a greater increase
in the activation of adenosine monophosphate activated protein kinase (AMPK), as has been
reported in previous studies (Wojaszewski et al, 2000; Chen et al, 2003). Indeed, in a group of
well-trained cyclists, a high intensity training session involving 8 x 5min at 85% VO2peak caused
an increase in the AMPK activity and phosphorylation (Clark et al, 2004). It is therefore likely
that the well-trained cyclists in the present study would have experienced a similar increase in
AMPK activity and phosphorylation following the training sessions in P. AMPK-signalling
mechanisms are involved in the initiation of mitochondrial biogenesis, through the regulation
of peroxisome proliferator receptor-γ co-activator-1α (PGC-1α) expression and activity
(Puigserver & Spiegelman 2003). In the present study however, it seems unlikely that the

159
differences in endurance performance and physiological adaptation between P and T were
due to differences in mitochondrial biogenesis, as there were no differences in the maximal
activity of CS or β-HAD. It has been suggested that mitochondrial content can be estimated
from the maximal activities of ‘marker enzymes’ such as citrate synthase, because the
mitochondrial volumes estimated morphometrically parallel the changes in maximal enzyme
activity (Hood et al, 2001). It is likely that the skeletal muscle of the cyclists had a high
mitochondrial density and oxidative capacity at the start of the training, as demonstrated by
the magnitude of the performance measures. An increase in the oxidative potential in already
well-trained skeletal muscle is relatively small and may be too small to detect following a
short-term training intervention (Kohn et al., 2010). Indeed, following high volume training
with high intensity training included in well-trained athletes, there was no difference in the
maximal activity of CS (Evertsen et al., 1999; Weston et al., 1997) and β-HAD (Weston et al.,
1997), despite improvements in endurance performance. In contrast, studies using
moderately trained individuals and a similar interval training programme to P in the present
study, have found large increases in the maximal activities of CS and β-HAD of 20-30% (Gurd et
al., 2010; Perry et al., 2008; Talanian et al., 2007). In addition, it has been documented that an
increase in mitochondrial content of 50-100% is possible within six weeks, in previously
untrained muscle (Fitts et al, 1975).
As exercise intensity increases, there is a greater recruitment of muscle fibres and more
specifically, a greater recruitment of fast-twitch muscle fibres (Dudley et al., 1982).
Adaptations in muscle are greatest in those muscle fibres that are directly activated during
training (Dudley et al., 1982). As more muscle fibres would have been recruited during
training in P compared with T, the specific adaptations to induce more oxidative muscle fibres
would have occurred in more muscle fibres in P compared with T. It addition, it has been
suggested that fast-twitch muscle fibres become more fatigue resistant following high-

160
intensity training, and this is likely due to more fast-twitch muscle fibres being recruited at
higher exercise intensities. This could explain the greater improvements in the TTE at 95%
pre-training PPO and PPO in P compared with T.
5.6 CONCLUSIONS
A polarised training model is recommended for trained cyclists wishing to maximally improve
performance and physiological adaptation over a short-term training period. There is
however, much still to be understood regarding the impact of endurance training periods
containing different training-intensity distributions in trained endurance athletes and the
mechanisms responsible for these effects. For example, the differences in endurance
performance maybe due to the exercise intensity, an enhanced recovery, or due to a
combination of both of these factors. Therefore, this is a fruitful area for future research, and
would contribute to the optimisation of endurance training.

161
CHAPTER SIX – PART ONE
THE IMPACT OF TWO DIFFERENT ENDURANCE TRAINING PROGRAMMES ON THE
PROPORTION OF SENESCENT BLOOD T CELLS IN TRAINED CYCLISTS

162
6.1 ABSTRACT
The proportion of senescent and highly differentiated T-cells may increase following intensive
periods of endurance training, predisposing an individual to a greater risk of infection from
new pathogens due to a shrunken naïve T-cell repertoire. Purpose: To implement two training
interventions to induce adaptations and determine if the adaptations are at the expense of an
increased proportion of senescent T cells. Methods: Twelve well-trained male cyclists (age
37.5 6.2 yrs) provided a fasted resting blood sample in the morning before and after two 6-
week training periods in a cross-over study design, with each training period preceded by a 4-
week de-training period. The two training periods differed in the intensity distribution; a
polarised training model consisted of 80 4% of time below the lactate threshold (LT) and 20
4% above the lactate turnpoint (LTP) and a threshold training model consisted of 57 10%
of time below the LT and 43 10% of time between the LT and the LTP. Isolated blood
lymphocytes were labelled with monoclonal antibodies to assess cell surface co-expression of
CD57 and CD28 to identify the proportions of low differentiated (CD28+/CD57-), high
differentiated (CD28+/CD57+) and senescent (CD28-/CD57+) cells within both CD4+ and CD8+
T-cell subsets using four-colour flow cytometry. Data were analysed using a linear mixed
model. Results: Both training interventions elicited adaptation, as demonstrated by
significant increases in 40km time trial mean power output and time to exhaustion at 95% of
peak power output. However, no changes were found in the proportion of low or high
differentiated or senescent T-cells within the CD8+ or CD4+ T-cell subsets. Conclusion: Both
training protocols provided a sufficient stimulus to improve cycling performance without
leaving the athlete at a potentially greater risk of infection due to a shrunken naïve T-cell
repertoire.

163
6.2 INTRODUCTION
Previous research has reported that elite endurance athletes from a number of different
sports train with a high training volume, and follow a polarised training model in; cross-
country skiing (Sandbakk et al., 2010; Seiler & Kjerland 2006); rowing (Guellich et al., 2009);
road cycling (Lucia et al., 2000a; Lucia et al., 2000b) and track cycling (Schumacher & Mueller
2002). Indeed, experimental studies support the effectiveness of a polarised training model
compared with a threshold training model (Chapter 5) or other training models (Esteve-Lanaeo
et al, 2007; Ingham et al, 2008). The effectiveness of the polarised training model has been
suggested to be due to the effectiveness of a high training volume in zone one, the
effectiveness of training in zone three in comparison to training in zone two, and an enhanced
recovery. The results of chapter four can also be interpreted to support the positive effect of
training in zone one and the potentially detrimental effects of excessive training time spent in
zone two. Over the long term, athletes need to stay healthy in order to train consistently. If
an athlete regularly picks up infections, this could have a negative effect on training, and
subsequent physiological adaptation and performance. Although speculative, it is possible
that the effectiveness of the polarised training model may at least in part be due to an
enhanced resistance to picking up an infection. Although not reported in chapter five, it is
possible that the athletes were picking up infections during the training and continuing to train
with a minor infection. Indeed, a very small percentage of training was missed due to upper
respiratory tract infections, although this was not reported formally.
A ‘J shaped curve’ has been used to model the relationship between exercise and susceptibility
to infection (Nieman 1994). An enhanced immune function above sedentary levels might be
achieved with moderate activity, but an impaired immune function might result from
excessive amounts of prolonged, high-intensity exercise (Nieman 1994). When comparing a

164
group of athletes, it has been reported that the athletes with higher training volumes and
training loads are at an increased risk of infection (Heath et al., 1991). Individual athletes
probably have individual training thresholds, over which the risk of infection increases (Foster
1998). An increased risk of infection is a huge concern for athletes, as even minor infections
can lead to an inability to sustain strenuous training regimes, which may subsequently lead to
a decreased exercise performance (Roberts 1986). The precise mechanisms underlying the
suppressed immune function with strenuous exercise are yet to be established.
A lowered cell-mediated response at rest can occur following a period of intensified training in
already well-trained athletes, and is likely to be due to the cumulative effects of repeated
bouts of intense exercise (Baj et al., 1994). The study by Baj and colleagues (Baj et al., 1994)
found a diminished IL-2 production following 6-months of intensive training and racing in
competitive cyclists. In addition, the proliferative capacity of T-cells has been reported to be
decreased following a period of intensive training (Lancaster et al., 2004; Bury et al., 1998;
Verde et al., 1992). A depressed cell-mediated response leads to an increased incidence of
viral infections (Fabbri et al., 2003). It is therefore possible that the increased susceptibility to
infection in endurance athletes following a period of intensive training may be due to
decreases in T-cell function (Gleeson & Bishop 2005).
Cellular senescence is a state whereby cells are unable to further proliferate in response to
antigenic stimuli and can be caused by excess rounds of cell division in response to repeated
antigenic stimuli (Effros 2007). The co-expression of CD57+ and CD28- has been used as a
marker of senescence. CD57 is a cell surface glycoprotein that has been reported to be
expressed on T-lymphocytes with a senescent phenotype (Brenchley et al., 2003). More
specifically, CD57 is expressed on T-lymphocytes with short telomeres, a long history of
proliferation, an inability to proliferate in response to mitogenic stimuli (Brenchley et al., 2003)

165
and lack cell surface expression of the co-stimulatory molecule, CD28 on the cell surface
(Bruunsgaard et al., 1999). Indeed, cells lacking the expression of CD28 are also known to
have a lower proliferative capacity (Nociari et al., 1999). In fact, the complete and irreversible
loss of CD28 has been reported following T cell replicative senescence in cell culture (Effros
2004). T cells lacking the expression of CD28 have also been shown to have shorter telomere
lengths (Effros et al., 1996). It has been reported that CD28 is required for optimal
upregulation in the activity of the telomere extending enzyme, telomerase (Valenzuela &
Effros 2002; Weng et al., 1997). Further evidence for CD28 as a marker of senescent T cells is
the finding that CD28 is important for the activation and proliferation of naive T-cells (Ouyang
et al., 2003; Labalette et al., 1999; Linsley & Ledbetter 1993). The evidence clearly shows that
the expression of CD57 and the lack of expression of CD28 is indicative of a senescent
phenotype. However, it has been suggested that for an even more accurate marker of a true
end stage senescent cell, multiple phenotypic markers are required (Effros 2007). It has been
reported that from proliferative assays and telomere analysis, the surface expression of CD57
and CD28- T cells define the ultimate end-stage cell in the senescent pathway (Brenchley et al.,
2003).
Homeostatic mechanisms tightly control the proportion of naive and activated T cell
populations in the peripheral T cell pool (Freitas et al., 1996; Tanchot & Rocha 1995; Rocha et
al., 1989). Therefore, the proportion of T cells with a senescent phenotype in the peripheral T
cell pool may increase due to a lack of apoptosis (Spaulding et al., 1999). The naive T cells are
gradually replaced with T cells with a senescent phenotype, causing the naive T cell repertoire
to shrink (Koch et al., 2006). As the naive T cells are vital in immune responses to novel
pathogen, this change in the immune space may leave an individual at a greater risk of
infection (Pawelec et al., 2009; Koch et al., 2007; Ouyang et al., 2003). Although speculative,
the lowered T cell response at rest following an intensive period of training could be due to an

166
increased proportion of senescent T cells, along with a decreased proportion of naïve T cells.
Indeed, regular high intensity exercise has been shown to decrease the naive T cell repertoire
(Cosgrove et al., 2011; Hack et al., 1997).
To the author’s knowledge, only Cosgrove and colleagues (Cosgrove et al., 2011) has
investigated the effects of regular endurance training on the proportion of senescent T cells in
resting, fasted blood. This study (Cosgrove et al., 2011) reported that 6-months of training in
preparation for an ironman triathlon race lead to no changes in the proportion of senescent or
naive T cells in ten trained triathletes. However, only small physiological adaptations were
achieved over the 6-month training period. Blood samples were also taken three weeks after
the race revealed an increased proportion of senescent T cells within the CD4+ T-cell subset,
alongside a reduction in naïve cells within the CD4+ T-cell subset. This suggests that the
stimulus during the training period was not sufficient to induce an increase in the proportion
of senescent T cells or a decrease in the proportion of naive T cells, but the ironman triathlon
race did provide a sufficient stimulus to induce these changes in the immune space. Although
speculative, it is possible that with regular high intensity training of sufficient intensity and
duration, there could be an increase in the proportion of senescent T cells and a decrease in
the proportion of naïve T cells. This mechanism could contribute to the lowered cell mediated
response seen in endurance athletes following hard training periods.
Improvements in endurance performance and physiological adaptation have been reported to
be different following training periods with different intensity distributions (Ingham et al.,
2008; Esteve-Lanao et al., 2007). The cause of the differences in response following training
periods of different training-intensity distribution are unclear, but are likely due to intensity-
dependent adaptations and different rates of recovery following exercise of different intensity
(Seiler et al., 2007). The aim of the present study was to induce large physiological

167
adaptations though intensive training and determine if the adaptations gained are at the
expense of an increased proportion of senescent T cells. This was achieved with the use of
two different training intervention periods, differing in their intensity distribution, as used in
chapter 5.
6.3 METHODS
6.3.1 Subject Information
Twelve well-trained cyclists were recruited from local cycling clubs and provided written,
informed consent to take part in the study, which was approved by the University Ethics
Committee, in accordance to the Declaration of Helsinki. The mean (±SD) characteristics of
the participants at the beginning of the testing period were: age 37 (±6) years, body mass 76.8
(±6.6) kg and stature 178 (±6) cm.
6.3.2 Study Design
Fasted and rested venous blood samples were drawn into K2 EDTA Vacutainer blood collection
tubes (BD Biosciences, Oxford, UK) with 21 Guage ¾” BD Vacutainer Safety-Lok™ blood
collection sets (BD Biosciences, Oxford, UK) between 7am and 9am in the week before and the
week after two six week training periods. During the same week as the blood collection,
subjects underwent a cycling 40km time-trial and an incremental cycle test to exhaustion (See
chapter five for details). This was to quantify that the training had caused a sufficient stimulus
for adaptation.
6.3.3 Endurance Training Programmes
The two training periods differed in their intensity distribution; one followed a polarised
model (P) (80 4% of time below the lactate threshold (LT) and 20 4% above the lactate
turnpoint (LTP)) and the other followed a threshold model (T) (57 10% of time below the LT

168
and 43 10% of time between the LT and the LTP), with no training above the LTP (See
chapter four for details).
6.3.4 Isolation and Preservation of PBMCs
Peripheral Blood Mononuclear Cells (PBMCs) were isolated from whole blood using density
gradient centrifugation (Lymphoprep; Axis-Shield, Oslo, Norway). Whole blood was diluted
with an equal volume of 0.9% NaCl (Baxter™, Deerfield, IL USA), and 6 mL of the diluted blood
was layered over 3 ml of Lymphoprep. Samples were centrifuged for 30 minutes at 800g.
Following centrifugation, the distinct band formed by the PBMCs was carefully removed using
a Pasteur pipette and washed twice in 0.9% NaCl for 10 minutes at 250g, then again in cell
culture medium RPMI 1640 (Sigma-Aldrich, Irvine, Scotland) for 10 minutes at 250g.
The isolated PBMCs were re-suspended in 700 µL foetal bovine serum (Sigma-Aldrich, Irvine,
Scotland) and 200 µL RPMI 1640, before 100 µL dimethyl sulfoxide (DMSO) (Sigma-Aldrich,
Irvine, Scotland) was added slowly to the cell mix on ice. This was immediately frozen in liquid
nitrogen until later analysis. DMSO makes the cell membrane less likely to be punctured, by
partially solubilising the membrane.
6.3.5 Labelling of Cell Surface Antigens
PBMCs were labelled with appropriate monoclonal antibodies (mAbs) and incubated for 1-h at
room temperature. Each sample was labelled with anti-CD3 APC (Immunotools, Germany) and
one of anti-CD4 (Immunotools, Germany) or anti-CD8 PECy-5 (Immunotools, Germany) mAbs
to identify T lymphocyte subsets, before the addition of anti-CD57 (BD PharMingen, CA, USA)
or anti- CD28 PE (BD PharMingen, CA, USA) mAbs, to identify senescent T lymphocytes. All
mAbs were pre-titrated to determine optimal conditions for flow cytometric analysis.

169
6.3.6 Flow Cytometry
Flow cytometry was performed using a FACSCalibur flow cytometer (BD Biosciences, San Jose,
CA, USA) equipped with a 15 mW argon ion laser emitting light at a fixed wavelength of 488
nm and a 10 mW photodiode laser emitting light at 635 nm. Cell Quest Pro software (BD
Biosciences, San Jose, CA, USA) was used for the cellular analysis. The forward and side light-
scatter mode was used to identify and electronically gate the lymphocytes. The CD3+ T
lymphocyte population was identified using the forward scatter against APC fluorescence and
was gated electronically. The expression of CD4 and CD8 was used to identify T cell subsets
within the CD3+ gate. Where appropriate, a further electronic gate was placed around the
CD3+/CD4+ or the CD3+/CD8+ population. The expression of CD57, CD28, and the co-
expression of CD57/CD28 on CD3+/CD4+ or CD3+/CD8+ cells were determined using single
parameter histograms and two parameter dot plots. Proportions of low differentiated
(CD28+/CD57-), high differentiated (CD28+/CD57+) and senescent (CD28-/CD57+) cells within
both CD4+ and CD8+ T-cell subsets were identified. For each sample, 40,000 events were
collected in the CD3+ gate for analysis. The fluorescent amplifiers of the FL1-FL4 detector
filters were adjusted to ensure that the negative cell population (as defined by the
lymphocytes labelled using the appropriate isotype control) appeared in the first logarithmic
decade. An electronic marker was placed at the limit of the negative controls to quantify the
percentage of lymphocytes and lymphocyte subsets that were positive and negative for each
cell surface antigen. Electronic compensation was used to resolve any overlapping emission
spectra using single-labelled tubes with each mAb.
6.3.7 Statistical Analysis
Statistical analysis was performed using SPSS version 18 (Chicago, Il, USA).A fully repeated-
measures ANOVA compared the performance/physiological adaptation measures between
trials (P and T) and over time (pre to post). Main effects between trials, over time and any
interaction between these and the performance/physiological adaptation measures were

170
reported. Similarly, a fully repeated-measures ANOVA compared the percentage of T
lymphocyte subsets between trials (P and T) and over time (pre to post). Main effects
between trials, over time and any interaction between these and the percentage of T
lymphocyte subsets were reported. Post hoc analysis was undertaken where significance was
obtained with Paired Students t-tests, using two-tailed values of P. Percentage change of the
performance/physiological adaptation measures over time (pre to post) were compared using
Paired Students t-tests, using two-tailed values of P. Data on the proportion of senescent,
high differentiated and low differentiated T-cells was analysed for changes over time (pre to
post) and between trials (P and T) using separate restricted maximum likelihood linear mixed
model (LMM). Subject ID was used as the within subject identifier variable, with time and trial
as repeated variables. The LMM method was used to fit a covariance matrix for the residuals
to account for dependency of the repeated measures, allowing different variances for each
time point and different covariance’s between time points. Statistical significance was
accepted at P< 0.05.

171
6.4 RESULTS
As reported in Chapter 5 there was a main effect of time for the 40km TT mean power output,
the 40km TT mean HR, the TTE and the peak HR achieved during the TTE (P<0.05: Table. 6.1).
Post hoc analysis revealed that all of these variables improved from pre to post in both trials
(P<0.05). The percentage improvement in the 40km TT was (8.1 7.7%) in P and (4.2 5.7%)
in T, with no difference in the percentage improvement between the training periods (P>0.05).
The percentage improvement in the TTE was higher in P (85 43%) than T (37 47%) (P<0.05).
There were no main effects of time for the percentage of CD4+ and CD8+ cells among total T-
cells (CD3+), or the percentage of all T-cells expressing CD57 and CD28 within the CD8+ or
CD4+ T-cell subsets (P>0.05; Table. 6.2). There were no main effects of time in the proportion
of low or high differentiated or senescent T-cells within the CD8+ or CD4+ T-cell subsets
(P>0.05; Fig. 6.1).
Table. 6.1 Performance and heart rate responses before and after the two training interventions
Training
Intervention
Time Point 40km TT
MPO (W)
40km TT
mean HR
(bpm)
TTE at 95%
PPO (s)
Peak HR
during the
TTE at 95%
PPO
P Pre 285 (±40) 168 (±11) 290 (±61) 176 (±9)
P Post 307 (±37)* 166 (±11) * 523 (±130) * 173 (±8) *
T Pre 298 (±34) 169 (±11) 293 (±49) 178 (±11)
T Post 310 (±38) * 167 (±11) * 410 (±187) * 174 (±10) *
P: Polarised Training Model, T: Threshold Training Model, TT: Time Trial, MPO: Mean Power
Output, HR: Heart Rate, TTE: Time To Exhaustion, PPO: Peak Power Output. *different from
pre (P<0.05).

172
Fig. 6.1 The proportion of senescent (A, B), highly differentiated (C, D) and low differentiated
(E, F) T-cells within the CD4+ (A, C, E) and CD8+ (B, D, F) T-cell subsets.

173
Table. 6.2 The proportions of CD4+ and CD8+ cells among total T-lymphocytes (CD3+) along
with the CD4/CD8 ratio. Values are mean ± SD.
% of T-lymphocytes (CD3+)
Pre P Post P Pre T Post T
CD4+ 37.9 (±7.2) 38.7 (±7.6) 38.6 (±5.7) 36.9 (±6.5)
CD8+ 22.3 (±5.4) 22.3 (±7.3) 24.0 (±8.1) 22.1 (±7.0)
CD4+/CD8+ 1.8 (±0.6) 1.9 (±0.8) 1.8 (±0.7) 1.8 (±0.7)

174
6.5 DISCUSSION
Following two different 6-week endurance training programmes, there were no differences in
the proportion of senescent, highly differentiated or low differentiated T cells on CD4+ or
CD8+ in rested fasting blood in trained cyclists, but endurance performance and physiological
adaptation significantly improved following both training programmes.
Previous research in trained triathletes reported a significant increase in the proportion of
senescent T cells and a significant decrease in the proportion of naive T cells, at rest, three
weeks after an ironman triathlon race compared with three weeks before the race (Cosgrove
et al., 2011). Similarly, another study reported a decrease in the proportion of CD4+ naïve T-
cells expressing CD45RA following regular, high intensity exercise (Hack et al., 1997).
Expression of the cell surface marker, CD45RA is indicative of a naïve T cell (Akbar et al., 1988).
These studies are suggestive of a change in the immune space, which is likely to leave the
athlete at a greater risk of infection, due to a shrunken naive T cell repertoire. The study by
Cosgrove and colleagues (Cosgrove et al., 2011) demonstrates that changes in the proportion
of senescent T cells can be significantly changed in resting blood, in trained endurance
athletes, in just six weeks. However, during the 6-month build-up to the race, there was no
change in the proportion of senescent T-cells, along with only modest physiological adaptation
(Chapter 4). Therefore, it was hypothesised that by inducing a greater stress during training,
which was likely to lead to greater physiological adaptation, would lead to an increase in the
proportion of senescent T cells. It is possible that the subjects in the present study already
had a higher percentage of senescent T lymphocytes (CD3+/CD4+) in resting blood than those
in the study by Cosgrove and colleagues (Cosgrove et al., 2011). In the present study ~7% of
CD4+ T lymphocytes were senescent (CD28-/CD57+), whereas in the 6-months training period
in the study by Cosgrove and colleagues (Cosgrove et al., 2011), ~3% of CD4+ T cells were

175
senescent (KLRG1+/CD57+), significantly increasing to ~6% after the ironman triathlon race.
The proportion of T lymphocytes with a senescent phenotype on CD8+ cells throughout the
present study was comparable with those in the study by Cosgrove et al (2011) at ~30%. The
largest difference between the present study and Cosgrove et al (2011) was the proportions of
CD4+ and CD8+ T cells of the total T lymphocytes (CD3+). In the present study, CD4+ and CD8+
cells made up approximately 38 and 23%, respectively of the total T lymphocytes in
comparison to 50-60% and 36%, respectively in the study by Cosgrove and colleagues
(Cosgrove et al., 2011). In the present study, the cells were preserved with DMSO before
being frozen until later analysis, whereas the cells were analysed from fresh in the study by
Cosgrove and colleagues (Cosgrove et al., 2011). A strength of preserving the cells with DMSO
is that all of the analysis from a single subject, at all four time points can be completed in a
single day, as opposed to analysing each time point on a different day, and thus the present
study had the advantage of a large intra subject reliability. However, it is possible that this
preservation procedure affected the proportion of CD4+ and CD8+ T cells.
A decreased mitogen-stimulated lymphocyte proliferation and/or a decrease in the CD4/CD8
ratio are indicative of a reduced cell mediated immune response, and are sensitive to
increases in training load in already well-trained athletes. A decreased mitogen-stimulated
lymphocyte proliferation at rest has been reported following just six days of intensified
training (73% increase in training load) in trained cyclists (Lancaster et al., 2004). The cyclists
in the study by Lancaster and colleagues (Lancaster et al., 2004) also showed a significant
decrease in time to exhaustion at ~74% VO2max following the intensified training. A decreased
CD4/CD8 has been reported following an increase in training volume of 35% for three weeks in
a group of elite male distance runners (Verde et al., 1992). These studies demonstrate that
cell-mediated immune response can be compromised following a period of intensified
training. In the present study, there were no differences detected in the CD4/CD8 ratio. As

176
the subjects in the study by Lancaster and colleagues (Lancaster et al., 2004) decreased
endurance performance following the intensified training period, they can be classified as
being overreached. In the present study however, there were increases in endurance
performance, and thus the subjects were not overreached, and this is a probable reason for a
lack of change in the CD4/CD8 ratio and the proportion of T cells with a senescent phenotype.
Decreases in cell mediated immunity have also been reported in vivo, 48hr after prolonged,
high intensity exercise in trained triathletes compared with non-exercising triathletes and non-
exercising, moderately trained men (Bruunsgaard et al., 1999). In this study, several antigens
were injected into the skin on the forearm following a half ironman race. Similarly, mitogen-
stimulated T cell proliferation was decreased following both a 2.5hr run and a 2.5hr cycle at
75% VO2max in a group of trained triathletes (Henson et al., 1999) and following an incremental
test to exhaustion in trained male subjects (Fry et al., 1992). It is possible that repeated bouts
of exercise that induce an acute reduction in T cell function eventually lead to a chronic
decrease in cell mediated immune function. It has also been reported that the acute decrease
in T cell proliferation is intensity-dependent, as shown by a 50% decrease following a 45min
run at 80% VO2max and just a 25% decrease following a 45min run at 50% VO2max, 1hr following
the exercise on both occasions. It is probable that there were acute decreases in T cell
function following both training interventions in the present study, but this lead to no effect
on the proportion of T cells with a senescent or highly differentiated phenotype.
As previously mentioned, it is possible that the decreased cell mediated immune response
following intensified training could be due to an increased proportion of senescent T cells. It is
also possible that an increase in senescent T cells in this situation could be largely due to
oxidative stress in the athletes, as oxidative stress has been reported to lead to immune cell
senescence (Larbi et al., 2007; van Baarle et al., 2005). In fact, oxidative stress has been

177
shown to down-regulate CD28 (Ma et al., 2003), which is indicative of cellular senescence
(Effros 2004). As the proportion of CD28 was unchanged on CD4+ and CD8+ T cell subsets in
the present study, it is unlikely that the two training programmes induced oxidative stress. In
fact, it seems that to induce oxidative stress in well-trained athletes, the exercise needs to
elicit overreaching (Almar et al., 2002; Okamura et al., 1997), which did not occur in the
present study.
Another mechanism which could possibly cause an increased proportion of senescent and
highly differentiated T cells following a period of intensive training is the reactivation of latent
herpesviruses. This has been reported in elite athletes following a period of intensive training
and was also reported to be related to the incidence of upper respiratory symptoms (Gleeson
et al., 2002). Reactivation of latent herpesviruses causes T cell proliferation (Pawelec et al.,
2009), and is associated with a greater frequency of senescent T cells in the periphery (Koch et
al., 2007). Following persistent viral reactivation, excess T cell clones do not undergo post
infection apoptosis, as they are needed for subsequent reactivations of the latent virus.
Instead, they become part of the memory T cell pool, and therefore take up the so-called
immune space in place of naïve T cells (Simpson 2011). This is however, theoretical and
untested and therefore a pathway for future research.
Measurement of the proportion of naive T cells (CD45RA+/CD45RO-, KLRG1-/CD28+ would
have strengthened this study and given more insight into the changes of the immune space.
Measurement of telomere length by quantitative PCR would have also given more information
about the changes in the T cells. A measure of oxidative stress would have provided
information on whether there is a link between oxidative stress and senescent T cells in vivo
and a measure of mitogen-stimulated lymphocyte proliferation would have given an insight
into the function of the T lymphocytes. A measure of viral reactivation would have given

178
insight into the relationship between this measure and the proportion of low, high and
senescent T cells. If future research assessing the effect of chronic endurance training on the
proportion of senescent T cells in resting blood could incorporate these measures, our
understanding would become much clearer.
6.6 CONCLUSION
Two endurance training programmes with similar volume but different distribution were
sufficient to induce improvements in performance and physiological adaptation in well-trained
cyclists. However, despite likely differences in recovery, both training programmes had no
effect on the proportion of low or high differentiated or senescent CD8+ or CD4+ T-cells in
blood. Therefore, training adaptation was achieved at no cost to this particular aspect of
immune function. It is possible that a greater training stimulus (greater training load), could
have an effect on the immune space and this is therefore an avenue for future research. From
these results and evidence from previous studies, it seems likely that athletes need to be
overreached to induce any change in immune function following a period of intensified
training.

179
CHAPTER SIX – PART TWO
THE IMPACT OF AN IRONMAN TRIATHLON RACE ON EPSTEIN - BARR VIRUS AND VARICELLA -
ZOSTER VIRUS ANTIBODY TITRES AND THE FREQUENCY OF HIGHLY DIFFERENTIATED AND
SENESCENT BLOOD T-CELLS

180
6.7 ABSTRACT
Epstein - Barr Virus (EBV) and Varicella - Zoster Virus (VZV) are persistent herpesviruses that
are maintained in a latent state after primary infection, but may reactivate in response to
acute or chronic stress. The reactivation of latent viruses is indicative of a compromised
immune system, which may also increase the frequency of highly differentiated and senescent
T-cells. Such changes in response to a prolonged endurance race could have important
implications for athlete infection risk. Purpose: To examine the impact of an ironman
triathlon race on EBV and VZV antibody titres and the frequency of low and high differentiated
and senescent blood T-cells in trained endurance athletes. Methods: Eight trained male
triathletes (age 44 5 yrs) provided a fasted resting blood sample in the morning 3-wks before
an ironman triathlon race and 1, 2, 4 and 6-wks after the race. EBV and VZV IgG antibody
titres were measured in plasma by ELISA. Isolated blood lymphocytes were labelled with
monoclonal antibodies to assess cell surface co-expression of CD57 and CD28 to identify the
proportions of low differentiated (CD28+/CD57-), high differentiated (CD28+/CD57+) and
senescent (CD28-/CD57+) cells within both CD4+ and CD8+ T-cell subsets using four-colour
flow cytometry. Results: 75% of triathletes were seropositive for EBV and 75% were
seropositive for VZV. A main effect for the EBV-specific IgG titres over time (P<0.05) revealed
higher titres 3-wks pre-race than 2, 4 and 6-wks post race and higher titres 1-wk post race
than 6-wks post race. VZV-specific IgG titres did not change (P>0.05). Similarly, the
proportion of low or high differentiated or senescent T-cells within CD8+ or CD4+ T-cells did
not change. Conclusion: The triathlon race did not appear to elicit EBV or VZV reactivation or
alter the frequency of low or highly differentiated or senescent T-cells in blood.The decrease
in EBV-specific IgG titres indicates enhanced viral clearance during recovery from the race,
which may have been facilitated by a substantially reduced training load.
Keywords: Latent herpesvirus, athlete health, cell surface markers, immune function

181
6.8 INTRODUCTION
In part one, it was reported that two endurace training programmes, with different training-
intensity distributions but similar training volume volume resulted in no change in the
proportion of low differentiated, high differentiated or senescent CD4+ or CD8+ T cells. The
training stress induced by these training interventions was however, large enough to induce
significant improvements in physiological adaptation and endurance performance. In another
study (Cosgrove et al, 2011), we found that 3wks after an ironman triathlon race, there was a
significant increase in the proportion of senescent T cells in resting, fasted blood, compared
with 3wks before the race (Cosgrove et al, 2011). In addition, there was a significant decrease
in the proportion of naive T cells 3wks after the ironman triathlon race, suggesting that there
were changes taking place in the immune space, as suggested by Simpson (2011). During 6-
months training for the ironman triathlon race, there were no changes in the proportions of
senescent or naive T cell subsets. The physiological stress during the training however, was
likely to have been minimal, as shown with a lack of physiological adaptation (chapter four). It
therefore seems that the ironman triathlon race induced sufficient stress to cause changes in
the ‘immune space’, whereas training for the event did not. We do not know however, the
mechanisms responsible for these changes in the immune space 3wks after an ironman
triathlon race. In addition, we do not know the time course of these changes, as in our
previous study (Cosgrove et al, 2011), we only compared immune function changes from 3wks
before the ironman traithlon race to 3wks following the race. It would therefore be useful to
know exactly when these changes in the immune function markers took place following the
race.

182
Epstein - Barr Virus (EBV) and Varicella - Zoster Virus (VZV) are persistent herpesviruses that
are maintained in a latent state after primary infection, but may reactivate in response to
acute or chronic stress. Reactivation due to stress has been reported to lead to T cell
proliferation (Koch et al, 2006). Due to persistent viral reactivation, excess T cell clones do not
undergo post infection apoptosis, as they are needed for subsequent reactivations of the
latent virus. Instead, the excess T cell clones become part of the memory T cell pool, and
therefore take up the ‘immune space’, in place of antigen-virgin naive T cells, thus shrinking
the naive T cell repertoire (Simpson, 2011).
Reactivation of persistent herpesviruses is associated with a greater frequency of senescent T
cells in the periphery (Koch et al, 2007). In response to excess rounds of cell division, cells can
lose the ability to proliferate, and become senescent (Effros, 2007). The proportion of naive
and activated T cell populations making up the immune space is tightly regulated by
homeostatic mechanisms (Freitas et al, 1996). Senescent T cells have been shown to be
resistant to apoptosis (Spaulding et al, 1999), which may cause an accumulation of cells with a
senescent phenotype in the immune space and a decrease in the naive T cell repertoire. Naive
T cells are vital in immune responses to novel pathogen and therefore a decrease in the naive
T cell repertoire could leave an individual at a greater risk of infection (Koch et al, 2007).
The purpose of the present study was therefore to examine the impact of an ironman triathlon
race on EBV and VZV antibody titres and the proportion of senescent, highly differentiated and
low differentiated blood T-cells in trained endurance athletes.

183
6.9 METHODS
Eight trained male triathletes (age 44 5 yrs) provided a fasted resting blood sample in the
morning 3-wks before an ironman triathlon race and 1, 2, 4 and 6-wks after the race (Fig. 6.2).
EBV and VZV IgG antibody titres were measured in plasma by ELISA.
Fig. 6.2 Timeline of the study
Isolated blood lymphocytes were labelled with monoclonal antibodies to assess cell surface
co-expression of CD57 and CD28 to identify the proportions of low differentiated
(CD28+/CD57-), high differentiated (CD28+/CD57+) and senescent (CD28-/CD57+) cells within
both CD4+ and CD8+ T-cell subsets using four-colour flow cytometry.
6.9.1 Statistical Analysis
Statistical analysis was performed using SPSS version 18 (Chicago, Il, USA). Data were analyzed
for changes over time and between trials using separate maximum likelihood linear mixed
model (LMM). The LMM method was used to fit a covariance matrix for the residuals to
account for dependency of the repeated measures, allowing different variances for each time
point and different covariances between time points. Three subjects had missing data points
for the cell surface marker analysis, and therefore only five subjects were included in this
analysis. Statistical significance was accepted at p<0.05.

184
6.10 RESULTS
75% of triathletes were seropositive for EBV and 75% were seropositive for VZV. A main effect
for the EBV-specific IgG titres over time (P<0.05) revealed higher titres 3-wks pre-race than 2,
4 and 6-wks post race and higher titres 1-wk post race than 6-wks post race (Fig.6.3). VZV-
specific IgG titres did not change over time (P>0.05; Fig. 6.4). The proportion of senescent,
high or low differentiated T-cells within CD4+ or CD8+ T-cells did not change over time
(Figs.6.5- 6.10). The training volume in the 3wk lead up to the race and in the 6wks after the
race are shown in Fig. 6.11.
Fig. 6.3 Mean (±SD) EBV antibody concentrations at each time point (left) and the individual EBV antibody concentrations for each subject at each time point (right). * different from pre (P<0.05), α different from 1wk (P<0.05).
Fig. 6.4 Mean (±SD) VZV antibody concentrations at each time point (left) and the individual VZV antibody concentrations for each subject at each time point (right).

185
Fig. 6.5 Mean (±SD) proportion of CD28-/CD57+ on CD4+ at each time point (left) and the individual values for the proprtion of CD28-/CVD57+ on CD4+ for each subject at each time point (right)
Fig. 6.6 Mean (±SD) proportion of CD28-/CVD57+ on CD8+ at each time point (left) and the individual values for the proportion of CD28-/CVD57+ on CD8+ for each subject at each time point (right)
Fig. 6.7 Mean (±SD) proportion of CD28+/CVD57+ on CD4+ at each time point (left) and the individual values for the proportion of CD28+/CVD57+ on CD4+ for each subject at each time point (right)

186
Fig. 6.8 Mean (±SD) proportion of CD28+/CVD57+ on CD8+ at each time point (left) and the individual values for the proportion of CD28+/CVD57+ on CD8+ for each subject at each time point (right)
Fig. 6.9 Mean (±SD) proportion of CD28+/CVD57- on CD4+ at each time point (left) and the individual values for the proportion of CD28+/CVD57- on CD4+ for each subject at each time point (right)
Fig. 6.10 Mean (±SD) proportion of CD28+/CVD57- on CD8+ at each time point (left) and the individual values for the proportion of CD28+/CVD57- on CD8+ for each subject at each time point (right)

187
Fig. 6.11 Mean (±SD) training volume in each of the three weeks leading up to the race, and in each of the six weeks after the race.

188
6.11 DISCUSSION
The ironman triathlon race did not appear to elicit EBV or VZV reactivation or alter the
frequency of senescent, highly differentiated or low differentiated T-cells in blood. The
decrease in EBV-specific IgG titres indicates enhanced viral clearance during recovery from the
race, which may have been facilitated by a reduced training load than before the study period.
These results do not agree with our earlier work, showing an increase in the proportion of
senescent T cells following an ironman triathlon race (Cosgrove et al, 2011).
Reactivation of latent herpesviruses has been reported to lead to T cell proliferation (Koch et
al, 2006). This T cell proliferation may cause an increase in the proportion of senescent T cells
in the periphery (Koch et al, 2007). As there was no change in the EBV or VZV-specific
antibody concentrations over time in the present study, this would suggest that if the
reactivation of latent herpesviruses is one of the factors causing an increase in the proportion
of senescent T cells, then this is the reason for no change in the proportion of senescent T cells
in the present study. We therefore, cannot discount a reactivation of latent herpesviruses as a
potential mechanism for the increased proportion of senescent T cells in the study by
Cosgrove et al (2011).
Of note in the present study, is the variability of the measures between subjects. The VZV and
EBV-specific antibody concentrations range from approximately 3-900 U.ml-1 and 0.4 – 5.4
U.ml-1 for VZV and EBV, respectively. In addition, the proportions of senescent and low and
highly differentiated T cells also showed large variation between subjects. Due to these
variations, analysis will take place for individual subjects in the study:

189
6.11.1 Subject 7
Subject 7 was diagnosed with shingles 2wks after the ironman triathlon race. A reactivation of
VZV causes singles, and accordingly, the antibody concentration for VZV was very high in this
particular subject. In fact, the subject had a high VZV-specific antibody concentration 3wks
before the race and 1wk after the race, and was not tested 2wks after the race due to the
virus. By 6wks after the race, the VZV-specific antibody concentration had decreased to a
similar magnitude to subjects 1 and 6, that did not have shingles. Unfortunately, there was a
problem with the pre-race blood sample for the cell surface markers for subject 7, and so this
data is unavailable. Subject 7 had a low EBV-specific antibody concentration in relation to the
other subjects. The present study suggests that there is no relationship between EBV and
VZV-specific antibody concentrations.
6.11.2 Subject 1
Subject 1 had high EBV and VZV-specific antibody concentrations in comparison with the other
subjects, yet a low proportion of senescent T cells in comparison with the other subjects. This
subject did have, however, a large increase in the proportion of highly differientiated T cells on
both CD4+ and CD8+ from 2wks to 4wks, and a decrease in low differientiated T cells from 1wk
post race to 2wks post race, that increased back to the 1wk post race value at 4wks post race.
The subject had flu like symptoms for 10d in the 4th and 5th wk after the race, which caused
this subject to stop training. At the time when these flu like symptoms were most severe (wk
4 after the race), the subject had the highest proportion of highly differentiated T cells, which
increased by more than 2-fold from the 2wk sample for both CD4+ and CD8+. The proportion
of low differientiated CD4+ T cells decreased from approximately 93% pre race to 82% 2wks
after the race, and this increased back up to approximately 90% 4wks after the race. These
results are suggestive that the proportion of highly differientiated CD4+ and CD8+ T cells was
directly related to the subjects symptoms. It is possible that the subject was at more risk of

190
infection than the other subjects, as both the EBV and VZV antibody titres were high
throughout the study period. The proportion of senescent T cells however, were unaffected
by the infection.
6.11.3 Subject 3
Subject 3 had a high proportion of senescent CD4+ and CD8+ T cells and a low proportion of
low differientiated CD8+ T cells in comparison to the other subjects. However, both VZV and
EBV-specific antibody concentrations were low in comparison to the other subjects.
Therefore, another mechanism other than the antibody concentration of EBV and VZV may be
involved in this subject having a high proportion of senescent CD4+ and CD8+ T cells and a low
proportion of low differientiated CD8+ T cells.
The subjects with the highest antibody titres 3wks before the race for EBV (subject 1) and VZV
(subject 7) got infections following the race. Therefore, although speculative, it is possible
that antibody titre analysis 3wks before a competition such as an ironman triathlon might
have the potential to identify individuals who are at most risk of infection post race, despite
being otherwise healthy. It might be that these athletes should not subject themselves to the
stress of a race such as an ironman triathlon. It is possible that antibody titre analysis could
have the potential to help protect endurance athletes during training, as a large training
stress, or a series of large training stresses might also cause an infection. This is highly
speculative, but is an exciting and worthwhile area for future research.

191
6.12 CONCLUSION
The mean results of the present study suggest that there is no relationship between EBV and
VZV-specific antibody concentrations and the proportion of senescent, low and highly
differientiated T cells. However, on analysis of individual subject data, it seems possible that
subjedcts with a high antibody titre for EBV or VZV 3 wks before a competition might be more
at risk of infection post race. A greater subject number would be needed in order to make a
more conclusive statement about this relationship. As such a large proportion of the
population have both EBV and VZV, perhaps reactivation of these specific herpesviruses has
less of an impact on the proportion of senescent T cells than a herpesvirus that affects a lower
proportion of the population, such as cytomegalovirus.

192
CHAPTER SEVEN
SUMMARY AND CONCLUSIONS

193
7.1 SUMMARY AND CONCLUSIONS
Elite endurance athletes have been reported to train with a large training volume relative to
their event, and of the overall volume, a large proportion has been reported to be spent at a
relatively low intensity (~80% of total training volume), with the remaining training volume at
a relatively high intensity. However, research is lacking as to whether this represents an
optimal training-intensity distribution in already well-trained endurance athletes. In fact, it
has been reported that in some well-trained endurance athletes, alternative distributions in
training intensity lead to larger improvements in physiological adaptation and endurance
performance. Our understanding of the mechanisms responsible for these findings is thus
limited. The novel data in this thesis may hopefully enhance our understanding of the
responses of well-trained endurance athletes to different distributions in training intensity.
The first study assessed the reproducibility of the LT, the LTP and a maximal performance
measures in swimming, cycling and running in already well-trained endurance athletes.
Reliable measurement of the LT and the LTP are vital in the study of training-intensity
distribution, as they demarcate three training-intensity zones. This study found that the LT,
the LTP and maximal performance measures in swimming, cycling and running were all
reproducible in already well-trained endurance athletes. These measures could therefore be
used for the remainder of the studies in this thesis.
The second study assessed the training-intensity distribution in a group of well-trained
triathletes in the 6-month build up to an ironman triathlon. Training intensity for each
discipline was demarcated into three zones with the LT and the LTP and a maximal
performance measure was assessed, using the methods from the first study. The HR
corresponding to the LT and the LTP was used to determine the training-intensity distribution,
using the TIZA. The athletes recorded every training minute into an online training log and the

194
amount of time spent in each of the three training intensity zones was recorded. The athletes
were tested four times in the 6-month build up to the event, approximately every 2-months.
This was the first study to assess the training-intensity distribution in multisport athletes.
Overall, for all of the disciplines combined, the athletes spent 69, 25 and 6% of training time in
zones 1, 2 and 3, respectively and only achieved modest improvements in physiological
adaptation. The largest adaptations occurred in running, in which the athletes spent more
time in zone one and less time in zone two than swimming and cycling. Relationships between
the time spent in each zone and the magnitude of adaptations were unclear, as the initial
training status of the athletes was significantly related to the magnitude of adaptation. It was
clear from the second study that in order to assess the effect of training-intensity distribution
on endurance performance and physiological adaptation, the training variables would need to
be tightly controlled in an experimental setting.
The third study assessed the impact of manipulating the training-intensity distribution in a
group of trained cyclists, using a cross-over, within subject study design. A polarised training
model with a high proportion of training at a low intensity and the remaining training at a high
intensity was compared with a threshold training model, with a high proportion of training at a
moderately-high intensity and the remaining training time at a low intensity. Athletes in the
polarised model had a significantly lower overall training volume and training load compared
with the threshold training model. Although both training interventions significantly improved
40km time-trial performance, there were larger improvements in the peak power output and
the time to exhaustion at 95% peak power output following the polarised training model
compared with the threshold training model. In fact, all of the measures for endurance
performance and physiological adaptation had higher effect sizes following the polarised
model compared with the threshold model. This suggests that over a short-term training
period (6 weeks), it is advisable to adopt a polarised training approach. If training time is

195
limited, the high intensity intervals in the polarised training model appear to compensate for
the smaller overall training volume, and so a polarised approach including high intensity
intervals is effective in this situation.
The fourth study assessed the impact of two different training-intensity distribution models on
the proportion of low and high differentiated and senescent T cells in trained cyclists. Both
training interventions caused large improvements in endurance performance, along with no
effect on the proportion of low or high differentiated or senescent T cells. Therefore, the
improved endurance performance did not come with an increased proportion of senescent T
cells, which would probably lead to an increased susceptibility to picking up a viral infection.
The fifth study assessed the effect of an ironman triathlon race on EBV and VZV antibody titres
and the proportions of low and high differentiated and senescent blood T cells. We have
previously reported that an ironman triathlon race causes an increase in the proportion of
senescent CD4+ T cells, alongside a decrease in the proportion of naive CD4+ T cells. In the
fifth study, in comparison to 3 wks before the race, there was no difference in the proportion
of low or high differentiated or senescent CD4+ or CD8+ T cells, 1, 2, 4 and 6wks after the race,
in contrast to our previous work. There was no difference throughout the study period for the
VZV antibody titre, but the EBV antibody titre decreased over time after the race, which could
have been due to a lower training load than before the race. On analysis of the individual
data, this study revealed that it might be possible to use pre race antibody titres to identify
individuals that might be at higher risk of an infection post race. This is however highly
speculative, although is an exciting area for future research.

196
The results of the studies in this thesis contribute to the understanding of the broad area of
maximising endurance performance, with a focus on the variable of training-intensity
distribution. Further studies are clearly needed in order to enhance our understanding of this
broad area, and in particular, a greater variety of manipulation of the training-intensity
distribution is needed before clearer conclusions can be made as to the effectiveness of this
variable. So far, only Esteve-Lanao et al (2007), Ingham et al (2008) and chapter 5 of this
thesis have tightly controlled the training-intensity distribution in well trained endurance
athletes. Chapter 5 in the present thesis has been the most controlled study to date, with
power output, HR and RPE being controlled for every training session above the LT. In
addition, every training session above the LT took place in the laboratory. A cross-over study
design was used, with the subjects acting as their own controls. This approach proved
successful, with a 4-week de-training period between the 6-week intervention periods, as
shown by all of the measures returning to baseline magnitudes. Chapter 5 was also the first
training study with a focus of training-intensity distribution to use the LT and the LTP to
demarcate three exercise intensity training zones. These zones are relatively easy and
inexpensive to measure, and therefore, this method of demarcating exercise intensity training
zones could be widely used by researchers and coaches in the area of endurance training. Due
to the lack of controlled experimental studies exploring the effect of isolating the variable of
training-intensity distribution, it is suggested that more studies are needed in manipulating
this variable.
The effectiveness of training in zone one has been referred to on many occasions in this thesis.
Although several studies (Fiskerstand & Seiler, 2004; Esteve-Lanao et al, 2005; Esteve-Lanao et
al, 2007, Ingham et al, 2008; chapter 4 of this thesis) have found a positive outcome of more
training in zone one, none of these studies focussed on this primarily. It was found in chapter
5 of this thesis that with the absolute amount of time spent in zone one matched between two

197
groups with different training-intensity distributions, it was the group with the higher
percentage of time spent in zone one that had the greatest benefits to endurance
performance and physiological adaptation. However, just as in the other published literature,
this is not necessarily cause-and-effect, as there were other variables contributing to the
results, with the amount of time spent in either zone two or zone three likely contributing
heavily to the outcomes. Further research is therefore needed in order to isolate the variable
of absolute or percentage of time spent in zone one, so that this variable can be considered
important in affecting physiological adaptation and endurance performance. One such study
would be to assess the training volume in zone one that causes an increase in endurance
performance and physiological adaptation, as it has been suggested that training in zone one
is sufficient to maximise the increase in mitochondria in type I muscle fibres (Dudley et al,
1987). Therefore, with a homogenous group of athletes, the number of minutes spent training
only in zone one could be increased at regular intervals, and testing could take place at regular
intervals to assess the effect of the increased training volume (Fig. 7.1). With this study
design, the athletes would only increase their training volume if endurance performance had
increased above the day-to-day variation. Using this approach, the training is individualised,
and therefore, the effect of an increased training volume can be assessed for each individual
athlete. This study would follow on from the study by Ingham et al (2008), in which zone one
training in elite rowers was found to be very effective at inducing physiological adaptations,
especially related to the lactate threshold.

198
Fig. 7.1 A study design to assess the effectiveness of an increased volume of training in zone one on already well-trained endurance athletes
In this thesis, both group mean data and individual data were presented, and both of these
options have advantages and disadvantages. By presenting group mean data, the overall
effectiveness of an intervention can be clearly seen, yet individual responses are disregarded.
By presenting individual data, the overall effectiveness of the intervention may be
overshadowed by certain individual responses. In the area of training-intensity distribution, it
is important to consider both of these ways of presenting the data. If training-intensity
distribution and training load are fixed (as in chapter 5), then individual athletes will respond
differently. It has been suggested that there are responders and non-responders (Vollaard et
al, 2009) to exercise, and indeed, it can be seen from chapter 5 of this thesis that individuals
respond differently to the same exercise stimulus. This is why it has been suggested that
where possible, to individualise the training of the individuals for the intervention, especially
the training load. Take the example of two cyclists, with mean training volumes for the 12
months prior to the study of 30 and 15 hours per week. By setting a training volume of 20
hours per week, it is possible that the cyclist entering the study with the higher training
volume could decrease endurance performance, due to insufficient training volume and load.
In contrast, it is also possible that the cyclist with the lower weekly training volume could
decrease endurance performance due to overreaching or overtraining. Group mean data
would merely show a decrease in endurance performance using the training intervention, but
this can be avoided. One way of avoiding this scenario is to closely analyse the athletes

199
training diary for the 6 months previous to the study, and attempt to set a training load that is
slightly lower than that which the athlete is accustomed to. During the study, increases in
training load can be made, based on the athlete’s responses to the training. If a cross-over
study design is used, the training load would need to be matched for both training
interventions. Another approach could be to pair-match individuals with similar training loads
in the previous 6 months and match the training for these individuals.
One important issue when assessing the effectiveness of training in zone one is the intensity of
exercise. In well trained endurance athletes, there is a wide range of exercise intensities
corresponding to zone one. It can be assumed that there will be a relative exercise intensity at
the lower end of zone one in which training becomes ineffective, but at present, this relative
exercise intensity is not known. It could also be possible that training at the highest intensity
in zone one (i.e. the highest exercise intensity before the blood lactate increases distinctly
above resting levels (Aunola & Rusko, 1984)) is the most effective training intensity for zone
one, and this is a potential study for future research. As a polarised training-intensity
distribution, and more specifically, a training programme including 80, 0, 20% of training in
zones one, two and three has been proposed as optimal, a potential study assessing the
intensity of zone one training could use this distribution (Table 7.1). The study could have two
groups, with fixed overall training load, training volume, and the intensity of zone three
training. In line with chapter 5, the 72min of zone 3 training could consist of three sessions
per week of 6*4min intervals, with 2min recovery. Therefore, the only difference in the two
training programmes would be the intensity of zone one. It could be suggested that the two
groups could include zone one intensities of 100 and 50% of LT, respectively. Therefore, if
there is a difference in adaptation over a 6-week training programme, it is likely that the zone
one intensity was a factor. Indeed, this study approach could also be used to assess the
effectiveness of the exercise intensity used for zone two and zone three, with a fixed training-

200
intensity distribution. However, as zone two is relatively narrow in well-trained athletes and
the range of exercise intensities in zone three that can be used for 4-min intervals also has a
narrow range, these issues are likely to be less important. However, if an athlete does have a
wide range of exercise intensities corresponding to zone two, there could be an effect of
training at the lower and upper ends of this scale. In addition, it is possible that the zone 3
intensity used is very sensitive to overall performance gains, and so is an area worth exploring.
Table 7.1 A proposed study to assess the effectiveness of the training intensity in zone one
Group Training-intensity
distribution (% of time in zones
1, 2 and 3)
Training volume (min.wk-1)
Training load (TRIMPs.wk-1)
Training intensity
Zone 1 Zone 3 Zone 1 Zone 3
1 80, 0, 20 294 72 500 50% of LT
10% > LTP
2 80, 0, 20 294 72 500 100% of LT
10% > LTP
TRIMP: Training Impulse, LT: Lactate Threshold, LTP: Lactate Turnpoint
The results of chapters 4 and 5 suggest that an excess of training in zone two might have a
detrimental effect on training, in concurrence with previous studies (Londeree, 1997; Esteve
Lanao et al, 2007). However, in order to assess the effectiveness of training in zone two,
studies focussed upon this factor need to be carefully designed. These studies could contain
two groups, with the overall training volume load (in TRIMPs) fixed for the two groups, along
with the intensity of training in the three zones. A manipulation of the percentage of time
spent in zone two could be attempted. It would be useful if 0, 100, 0% of training time in
zones 1, 2 and 3, respectively was compared with 50, 50, 0%. Moreover, including zone 3 in
the training would be useful to observe, and so comparing 80, 0, 20% of time in zones 1, 2 and
3, respectively with 0, 80, 20% would give a clearer idea as to the overall effect of training in
zone 2. It is also possible that there is an overall training load which acts as a threshold,

201
beyond which the effects of excess training in zone 2 become detrimental. This possibility is
due to the suggestions that an excess amount of training in zone 2 causes a down regulation of
the sympathetic nervous system (Esteve-Lanao et al, 2007), and a delayed recovery (Seiler et
al, 2007). However, if the training load was such that recovery was possible, then the effects
of zone 2 training might not be detrimental. Nevertheless, chapter 5 in this thesis, and other
studies (Esteve-Lanao et al, 2005; Esteve-Lanao et a;, 2007; Londeree, 1997) still provide
evidence that a polarised training model including approximately 80% of training in zone 1 and
20% of training in zone 3 is more beneficial than a threshold training model, with a large
proportion of training in zone 2.
In chapter 5, it is suggested that training in zone 3 is more beneficial to improvements in
endurance performance than training in zone 2. However, as chapter 5 only investigated the
effectiveness of training with 20% of time in zone 3, the effectiveness on endurance
performance of other manipulations of the proportion of training in zone 3 are largely
unknown. Research in the area of optimising interval training suggests that 4-min intervals
(Stepto et al, 1999; Seiler & Sjursen, 2004) and a two minute recovery period (Seiler &
Hetlelid, 2005) are effective in well-trained endurance athletes. Esteve-Lanao et al (2007)
attempted to include 15% of training in zone 3 using the total time in zone approach, and HR
monitoring in a group of well trained endurance runners. It should be noted that the total
time in zone approach significantly underestimates the time spent at higher exercise
intensities due to the delay in HR at the start of each exercise interval. Therefore, the 15% of
time attempted by the athletes in the study by Esteve-Lanao et al (2007) would certainly be
much higher if the session goal method was adopted. Therefore, further manipulation of the
percentage of time spent in zone three is required, using two groups, with the overall training
load matched between the groups. A useful comparison would be that of 80, 0, 20% of time in
zones 1, 2 and 3, respectively with 60, 0, 40%, using the session goal approach. Moreover,

202
introducing some training in zone 2 into the comparison would also be a worthwhile
comparison, with 60, 20, 20% of training time in zones 1, 2 and 3, respectively, compared with
80, 0, 20%. As chapter 5 has reported a training-intensity distribution of 80, 0, 20% of training
time in zones 1, 2 and 3, respectively to be effective at improving endurance performance in
well trained cyclists, it would be useful to use this distribution as a comparison for other
manipulations of the training-intensity distribution.
Once a greater understanding of the effectiveness of different training-intensity distributions
has been established, then the overall training load (in TRIMPs) and training volume (in
minutes) can be manipulated. In order to do this, the training-intensity distribution needs to
be fixed, as does the intensity chosen within each training zone. Therefore, in two groups,
with the same training-intensity distribution, a difference in the overall training load in one
group, but not the other would be likely to demonstrate the effectiveness of training with a
greater training load. One group could increase training load by 50 TRIMPs every two weeks,
whilst keeping the same training-intensity distribution while the other group maintains the
same training load throughout. Alternatively, a group of athletes could all start training at a
relatively low TRIMP, which is individualised based on analysis of training diaries. Testing
could take place every two weeks, and if the athlete has improved by a greater amount than
the day-to-day variation in each measure of endurance performance, then the training load
can be increased by 5%. The advantage with the latter approach is that individual
responsiveness is taken into account, and the aim of the study, ‘to assess whether a higher
training load leads to a greater improvement in endurance performance with a fixed training-
intensity distribution’, is investigated, but on an individual athlete basis. In all of these studies,
however homogenous a group of athletes are, there will still be differences in ability and rate
of improvement. Therefore, where possible, it is advisable to individualise the training load to
suit the individual. Therefore, chapter 5 could have been improved by individualising the

203
training load for each athlete, whilst keeping the training-intensity distribution fixed in each
group.
More descriptive studies assessing the training-intensity distribution of truly world class
endurance athletes, along with the closely controlled manipulations of training-intensity
distribution previously mentioned on well trained endurance athletes would greatly improve
our understanding of how to optimise endurance performance by manipulating the variable of
training-intensity distribution. During the controlled experimental studies proposed
previously, it is clearly important to test for the correct measures at the correct times in each
study. Assessments of physiological adaptation, endurance performance,
overreaching/overtraining, recovery, and athlete health need to be appropriate, and some
ideas are presented below:
Physiological adaptation:
The lactate threshold/lactate turnpoint
Ventilatory thresholds 1 and 2
sEMG thresholds 1 and 2
Catecholamine thresholds 1 and 2
Oxygen uptake throughout an incremental exercise test (exercise economy)
Maximal oxygen uptake
VO2 kinetics
Substrate metabolism (carbohydrate and fat)
Skeletal muscle glycogen content
Mitochondrial biogenesis (PGC1-α, AMPK, CaMK, NRF-1, Tfam)
Oxidative and glycolytic enzymes
Skeletal muscle fibre type
MCT1, MCT4
Buffering capacity
Cardiovascular measures (heart rate, stroke volume and cardiac output)
a-VO2diff
Capillary density
Lung function

204
Endurance performance:
A time trial (fixed distance)
A time to exhaustion test
A fixed time test, and assess mean intensity sustained Measures of overreaching/overtraining:
A time trial or a time to exhaustion test, such as the ‘stress test’ (Urhausen et al., 1998)
Heart Rate Variability
Psychological questionnaires
Hormones (catecholamines, cortisol, prolactin, adrenocorticotrophic hormone)
Salivary IgA
IL-6
CD4+/CD8+ ratio
Mitogen-induced IgG/IgM synthesis
Lymphocyte proliferation
Blood leukocyte count
Neutrophil function (oxidative burst in response to bacterial stimulant in vitro)
Plasma glutamine
Creatine kinase Measures of recovery:
HRV
Muscle soreness
Inflammatory markers
Performance in one of the endurance tests described above
Measures of overreaching/overtraining have returned to baseline
Measures of athlete health:
Self-report of any episodes of illness
Humoral immunity (IgA, IgG, IgM)
Cellular immunity (T cell activation, T cell cytokine release, T cell proliferation)
Latent viral reactivation (EBV, VZV, CMV) In addition, the assessments of training intensity zones and training intensity during training need to be carefully thought about, and some ideas are presented below:
A heart rate monitor
A power meter for a cyclist (SRM or power tap)
Lap/split times
Global Positioning System (GPS)
RPE
Blood lactate

205
Chapters 6a and 6b assessed the effect of two different six week training interventions, and an
ironman triathlon race, respectively on the proportion of low and high differentiated and
senescent T cells in blood. Future studies should consider the limitations of the methodology
chosen for these studies. The leukocytes in the blood were assessed for the cell surface
markers that were of interest in these studies. The leukocytes in the blood are the only readily
accessible leukocytes when conducting research in humans (Gleeson, 2006). This only tells us
about the blood leukocytes, and not the leukocytes at other sites in the body (in the skin,
lymph nodes and mucosa of the respiratory tract and gut). Moreover, at any one time, the
majority of lymphocytes are not circulating in the blood and so any observed changes in
peripheral blood lymphocytes may not be representative of changes that may occur in
lymphocytes in other bodily tissues (Gleeson, 2006). However, many lymphocytes are in
constant movement via the circulatory and lymphatic systems, and so lymphocytes in the
blood are a functionally important group of cells to measure (Gleeson, 2006). Therefore, it is
likely that assessing the lymphocytes in the peripheral blood is a useful measure, but a close
consideration of the above theory should be used.
Immune function can be assessed in vivo or in vitro, with advantages and disadvantages of
both approaches. Using the in vitro approach, the experimental conditions are highly
controlled, and so detailed dose-response studies can be performed. However, in vitro
systems are often highly unphysiological, using cells in isolation from other components with
which they would normally react, in vivo. Therefore, care should be taken when extrapolating
from in vitro studies to the whole body context. In chapter 6, it was assumed that senescent T
cells were unable to undergo apoptosis, based on results of previous research in vitro
(Spaulding et al, 1999; Wang, 1995). If this is indeed true in vivo, then the finding of an
increased proportion of senescent cells in the blood would be irreversible. It would be useful
for the area of immune function in endurance athletes if more studies were conducted like

206
that of Bruunsgaard et al (1997), assessing the whole body response to exercise, in vivo. This
was achieved by injecting several antigens into the skin on the forearms of trained triathletes
following a half ironman event. This should result in a raised red swelling, due to the
stimulation of an immune response to each of the antigens. The sum of the diameters of the
swelling gives an indication of the immune response. If this approach was adopted using
training studies, a clearer idea of the whole body immune response at different stages of the
training could be assessed.
In chapters 6a and 6b, the timing of the blood samples could have been a factor in the results
collected. Indeed, a time course study was not conducted for these measures, and therefore,
there is some doubt as to whether the timing of the blood samples might have been an issue.
Indeed, there does not seem to be a time course study for the measures of low and high
differentiated and senescent blood t cells in the literature. Our aim was to achieve a rested,
fasted blood sample, with the participants not exercising or eating for 12 hours prior to the
blood samples. Moreover, the blood samples were taken at the same time of day to minimise
the effects of diurnal biological variation (Atkinson & Reilly, 1996). However, it is possible that
taking the blood sample between 7:00 and 9:00 was not appropriate, and therefore, future
research should aim at conducting a time course study for these measures before any further
assessment following an intervention. Another aspect of chapters 6a and 6b that should be
considered for future research is that of participant diaries to record any symptoms of illness.
Although in chapter 6b, there was some evidence of illness from the participants, this was not
planned formally. Therefore, future research should be sure to inform athletes to record any
signs of illness, along with exact time, details of the symptoms and severity.
207
Chapters 6a and 6b would have been improved if the following measures would have been
taken:
The proportion of naive T cells (CD45RA+/CD45RO-, CD57-/CD28+),
The telomere length (quantitative PCR)
Oxidative stress (malondialdehyde, 8-hydroxydeoxyguanosine)
Mitogen stimulated T cell proliferation
T cell activation (CD69, CD25, CD45RO)
T cell cytokine release (IL-2, IL-4, IL-5, IL-6, IL-13, IFN-γ)
Serum immunoglobulins (IgA, IgG, IgM)
Mucosal immunoglobulins (IgA) These markers would give us a greater understanding of the effect of the training
interventions on the proportion of T cell subsets. In future research wishing to analyse the
effect of a training intervention on the immune space, as well as assessing the proportion of
naive ad senescent T cells, it would also be useful to use another marker that has been shown
to lead to cells becoming senescent, such as; telomere length and oxidative stress.
It was found that the LT and the LTP are reproducible in swimming, cycling and running
(chapter 3). Therefore, future studies can use these markers to demarcate zones of exercise
intensity when using these disciplines. Where possible, the session goal approach should be
used (Seiler & Kjerland, 2006), as opposed to the total time in zone approach, as the latter has
been shown to significantly underestimate the time spent at higher exercise intensities. In
studies assessing the effect of the training intensity distribution, to under- and over estimate
the amount of time spent in each zone of exercise intensity will clearly affect the responses to
the training. When the aim of the research study is to assess the effectiveness of different
training intensity distributions as a variable, one exercise discipline should be used. Moreover,
due to the high controllability, it is recommended that cycling is used. Power taps and SRM
meters can be used to continually monitor power output when riders are outside of the
laboratory, along with HR monitoring. However, it is recommended that riders only complete
sub-LT outside of the laboratory, due to the importance of standardising all exercise of greater

208
intensity than the LT. The advantage of using a power meter to measure the power output is
that it is an absolute measure of exercise intensity, and is not influenced by conditions
(gradient, wind, road surface), whereas speed (from a GPS) is affected by these factors.
However, power output from an SRM or power tap are not influenced by temperature or
humidity, and it is an advantage of a heart rate monitor that heart rate is affected by these
factors. Therefore, along with HR, the power output can be used to prescribe training
intensity outside of the laboratory. In addition, it has been demonstrated in this thesis that a
within subject study design is possible for a training study in a group of trained endurance
athletes, with a 4-week training wash-out period to diminish the adaptations gained from the
previous intervention (chapter 5).

209
CHAPTER EIGHT
REFERENCES

210
8.1 REFERENCES
1. Achten, J. and Jeukendrup, A. E. (2003). The effect of pre-exercise carbohydrate feedings on the intensity that elicits maximal fat oxidation J.Sports Sci., 21, 1017-1024.
2. Adhihetty, P. J., Irrcher, I., Joseph, A. M., Ljubicic, V., and Hood, D. A. (2003). Plasticity of skeletal muscle mitochondria in response to contractile activity Exp.Physiol, 88, 99-107.
3. Akbar, A. N., Terry, L., Timms, A., Beverley, P. C., and Janossy, G. (1988). Loss of CD45R and gain of UCHL1 reactivity is a feature of primed T cells J.Immunol., 140, 2171-2178.
4. Akbar, A. N., Salmon, M. & Janossy, G. (1991) The synergy between naive and memory T cells during activation. Immunol Today 12:184-192.
5. Akselrod, S., Gordon, D., Madwed, J. B., Snidman, N. C., Shannon, D. C., and Cohen, R. J. (1985). Hemodynamic regulation: investigation by spectral analysis Am.J.Physiol, 249, H867-H875.
6. Alessio, H. M., Goldfarb, A. H., and Cutler, R. G. (1988). MDA content increases in fast- and slow-twitch skeletal muscle with intensity of exercise in a rat Am.J.Physiol, 255, C874-C877.
7. Almar, M., Villa, J. G., Cuevas, M. J., Rodriguez-Marroyo, J. A., Avila, C., and Gonzalez-Gallego, J. (2002). Urinary levels of 8-hydroxydeoxyguanosine as a marker of oxidative damage in road cycling Free Radic.Res., 36, 247-253.
8. Almarwaey, O.A., Jones, M.A. & Tolfrey, K. (2004). Maximal lactate steady state in trained adolescent runners J Sport Sci, 22, 215-225.
9. Andersen, P. and Henriksson, J. (1977). Training induced changes in the subgroups of human type II skeletal muscle fibres Acta Physiol Scand., 99, 123-125.
10. Arany, Z., He, H., Lin, J., Hoyer, K., Handschin, C., Toka, O., Ahmad, F., Matsui, T., Chin, S., Wu, P. H., Rybkin, I. I., Shelton, J. M., Manieri, M., Cinti, S., Schoen, F. J., Bassel-Duby, R., Rosenzweig, A., Ingwall, J. S., and Spiegelman, B. M. (2005). Transcriptional coactivator PGC-1 alpha controls the energy state and contractile function of cardiac muscle Cell Metab, 1, 259-271.
11. Ashton, T., Rowlands, C. C., Jones, E., Young, I. S., Jackson, S. K., Davies, B., and Peters, J. R. (1998). Electron spin resonance spectroscopic detection of oxygen-centred radicals in human serum following exhaustive exercise Eur.J.Appl.Physiol Occup.Physiol, 77, 498-502.
12. Atanackovic, D., Schnee, B., Schuch, G., Faltz, C., Schulze, J., Weber, C. S., Schafhausen, P., Bartels, K., Bokemeyer, C., Brunner-Weinzierl, M. C., and Deter, H. C. (2006). Acute psychological stress alerts the adaptive immune response: stress-induced mobilization of effector T cells J.Neuroimmunol., 176, 141-152.
13. Atkinson, G. and Nevill, A. M. (1998). Statistical methods for assessing measurement error (reliability) in variables relevant to sports medicine Sports Med., 26, 217-238.

211
14. Atkinson, G. and Reilly, T. (1996). Circadian variation in sports performance Sports Med., 21, 292-312.
15. Aunola, S. and Rusko, H. (1984). Reproducibility of aerobic and anaerobic thresholds in 20-50 year old men Eur.J.Appl.Physiol Occup.Physiol, 53, 260-266.
16. Baar, K. (2004). Involvement of PPAR gamma co-activator-1, nuclear respiratory factors 1 and 2, and PPAR alpha in the adaptive response to endurance exercise Proc.Nutr.Soc., 63, 269-273.
17. Baar, K. (2006). Training for endurance and strength: lessons from cell signaling Med.Sci.Sports Exerc., 38, 1939-1944.
18. Baj, Z., Kantorski, J., Majewska, E., Zeman, K., Pokoca, L., Fornalczyk, E., Tchorzewski, H., Sulowska, Z., and Lewicki, R. (1994). Immunological status of competitive cyclists before and after the training season Int.J.Sports Med., 15, 319-324.
19. Baker, S. K., McCullagh, K. J., and Bonen, A. (1998). Training intensity-dependent and tissue-specific increases in lactate uptake and MCT-1 in heart and muscle J.Appl.Physiol, 84, 987-994.
20. Baldwin, J., Snow, R. J., and Febbraio, M. A. (2000). Effect of training status and relative exercise intensity on physiological responses in men Med.Sci.Sports Exerc., 32, 1648-1654.
21. Balin, A. K., Goodman, D. B., Rasmussen, H., and Cristofalo, V. J. (1977). The effect of oxygen and vitamin E on the lifespan of human diploid cells in vitro J.Cell Biol., 74, 58-67.
22. Baumert, M., Brechtel, L., Lock, J., Hermsdorf, M., Wolff, R., Baier, V., and Voss, A. (2006). Heart rate variability, blood pressure variability, and baroreflex sensitivity in overtrained athletes Clin.J.Sport Med., 16, 412-417.
23. Berger, N. J., Tolfrey, K., Williams, A. G., and Jones, A. M. (2006). Influence of continuous and interval training on oxygen uptake on-kinetics Med.Sci.Sports Exerc., 38, 504-512.
24. Bergmeyer, H. U. (1974). Methods in Enzymatic Analyses
25. Billat, V., Lepretre, P. M., Heugas, A. M., Laurence, M. H., Salim, D., and Koralsztein, J. P. (2003). Training and bioenergetic characteristics in elite male and female Kenyan runners Med.Sci.Sports Exerc., 35, 297-304.
26. Billat, V., Sirvent, P., Lepretre, P. M., and Koralsztein, J. P. (2004). Training effect on performance, substrate balance and blood lactate concentration at maximal lactate steady state in master endurance-runners Pflugers Arch., 447, 875-883.
27. Billat, V. L., Demarle, A., Slawinski, J., Paiva, M., and Koralsztein, J. P. (2001). Physical and training characteristics of top-class marathon runners Med.Sci.Sports Exerc., 33, 2089-2097.
28. Billat, V. L., Slawinski, J., Bocquet, V., Demarle, A., Lafitte, L., Chassaing, P., and Koralsztein, J. P. (2000). Intermittent runs at the velocity associated with maximal oxygen uptake enables subjects to remain at maximal oxygen uptake for a longer time than intense but submaximal runs Eur.J.Appl.Physiol, 81, 188-196.

212
29. Bland, J. M. and Altman, D. G. (1986). Statistical methods for assessing agreement between two methods of clinical measurement Lancet, 1, 307-310.
30. Boise, L. H., Minn, A. J., Noel, P. J., June, C. H., Accavitti, M. A., Lindsten, T. and Thompson, C. B. (1995). CD28 costimulation can promote T cell survival by enhancing the expression of Bcl-xL Immunity, 3, 87-98.
31. Bonen, A., McCullagh, K. J., Putman, C. T., Hultman, E., Jones, N. L., and Heigenhauser, G. J. (1998). Short-term training increases human muscle MCT1 and femoral venous lactate in relation to muscle lactate Am.J.Physiol, 274, E102-E107.
32. Bonen, A., Tonouchi, M., Miskovic, D., Heddle, C., Heikkila, J. J., and Halestrap, A. P. (2000). Isoform-specific regulation of the lactate transporters MCT1 and MCT4 by contractile activity Am.J.Physiol Endocrinol.Metab, 279, E1131-E1138.
33. Boveris, A. and Chance, B. (1973). The mitochondrial generation of hydrogen peroxide. General properties and effect of hyperbaric oxygen Biochem.J., 134, 707-716.
34. Brenchley, J. M., Karandikar, N. J., Betts, M. R., Ambrozak, D. R., Hill, B. J., Crotty, L. E., Casazza, J. P., Kuruppu, J., Migueles, S. A., Connors, M., Roederer, M., Douek, D. C., and Koup, R. A. (2003). Expression of CD57 defines replicative senescence and antigen-induced apoptotic death of CD8+ T cells Blood, 101, 2711-2720.
35. Brenner, I. K., Thomas, S., and Shephard, R. J. (1997). Spectral analysis of heart rate variability during heat exposure and repeated exercise Eur.J.Appl.Physiol Occup.Physiol, 76, 145-156.
36. Bruin, G., Kuipers, H., Keizer, H. A., and Vander Vusse, G. J. (1994). Adaptation and overtraining in horses subjected to increasing training loads J.Appl.Physiol, 76, 1908-1913.
37. Bruunsgaard, H., Jensen, M. S., Schjerling, P., Halkjaer-Kristensen, J., Ogawa, K., Skinhoj, P., and Pedersen, B. K. (1999). Exercise induces recruitment of lymphocytes with an activated phenotype and short telomeres in young and elderly humans Life Sci., 65, 2623-2633.
38. Budgett, R. (1998). Fatigue and underperformance in athletes: the overtraining syndrome Br.J.Sports Med., 32, 107-110.
39. Burgomaster, K. A., Howarth, K. R., Phillips, S. M., Rakobowchuk, M., MacDonald, M. J., McGee, S. L., and Gibala, M. J. (2008). Similar metabolic adaptations during exercise after low volume sprint interval and traditional endurance training in humans J.Physiol, 586, 151-160.
40. Burgomaster, K. A., Hughes, S. C., Heigenhauser, G. J., Bradwell, S. N., and Gibala, M. J. (2005). Six sessions of sprint interval training increases muscle oxidative potential and cycle endurance capacity in humans J.Appl.Physiol, 98, 1985-1990.
41. Bury, T., Marechal, R., Mahieu, P., and Pirnay, F. (1998). Immunological status of competitive football players during the training season Int.J.Sports Med., 19, 364-368.
42. Chaplin, D. D. (2010). Overview of the immune response J.Allergy Clin.Immunol., 125, S3-23.

213
43. Chen, Q. M., Prowse, K. R., Tu, V. C., Purdom, S., and Linskens, M. H. (2001). Uncoupling the senescent phenotype from telomere shortening in hydrogen peroxide-treated fibroblasts Exp.Cell Res., 265, 294-303.
44. Chen, Z. P., Stephens, T. J., Murthy, S., Canny, B. J., Hargreaves, M., Witters, L. A., Kemp, B. E. and McConell, G. K. (2003). Effect of exercise intensity on skeletal muscle AMPK signaling in humans. Diabetes, 52, 2205–2212
45. Child, R. B., Wilkinson, D. M., Fallowfield, J. L., and Donnelly, A. E. (1998). Elevated serum antioxidant capacity and plasma malondialdehyde concentration in response to a simulated half-marathon run Med.Sci.Sports Exerc., 30, 1603-1607.
46. Chwalbinska-Moneta, J., Kaciuba-Uscilko, H., Krysztofiak, H., Ziemba, A., Krzeminski, K., Kruk, B., and Nazar, K. (1998). Relationship between EMG blood lactate, and plasma catecholamine thresholds during graded exercise in men J.Physiol Pharmacol., 49, 433-441.
47. Chwalbinska-Moneta, J., Robergs, R. A., Costill, D. L., and Fink, W. J. (1989). Threshold for muscle lactate accumulation during progressive exercise J.Appl.Physiol, 66, 2710-2716.
48. Clark, S. A., Chen, Z. P., Murphy, K. T., Aughey, R. J., McKenna, M. J., Kemp, B. E., and Hawley, J. A. (2004). Intensified exercise training does not alter AMPK signaling in human skeletal muscle Am.J.Physiol Endocrinol.Metab, 286, E737-E743.
49. Coen, B., Urhausen, A., and Kindermann, W. (2001). Individual anaerobic threshold: methodological aspects of its assessment in running Int.J.Sports Med., 22, 8-16.
50. Coffey, V. G. and Hawley, J. A. (2007). The molecular bases of training adaptation Sports Med., 37, 737-763.
51. Coggan, A. R., Raguso, C. A., Williams, B. D., Sidossis, L. S., and Gastaldelli, A. (1995). Glucose kinetics during high-intensity exercise in endurance-trained and untrained humans J.Appl.Physiol, 78, 1203-1207.
52. Cohen, J. (1988). Statistical power and analysis for the behavioural sciences (2nd Ed.)
53. Cosgrove, C., Galloway, S. D.R., Neal, C., Hunter, A. M., McFarlin, B. K., and Simpson, R. J. (2011). The impact of six months training preparation for an Ironman triathlon on the proportions of naïve, memory, effector-memory and senescent T-cells in resting blood Eur.J.Appl.Physiol, 112, 2989-2998.
54. Costill, D. L., Daniels, J., Evans, W., Fink, W., Krahenbuhl, G., and Saltin, B. (1976). Skeletal muscle enzymes and fiber composition in male and female track athletes J.Appl.Physiol, 40, 149-154.
55. Costill, D. L., Flynn, M. G., Kirwan, J. P., Houmard, J. A., Mitchell, J. B., Thomas, R., and Park, S. H. (1988). Effects of repeated days of intensified training on muscle glycogen and swimming performance Med.Sci.Sports Exerc., 20, 249-254.
56. Costill, D. L., Verstappen, F., Kuipers, H., Janssen, E., and Fink, W. (1984). Acid-base balance during repeated bouts of exercise: influence of HCO3 Int.J.Sports Med., 5, 228-231.

214
57. Creer, A. R., Ricard, M. D., Conlee, R. K., Hoyt, G. L., and Parcell, A. C. (2004). Neural, metabolic, and performance adaptations to four weeks of high intensity sprint-interval training in trained cyclists Int.J.Sports Med., 25, 92-98.
58. Crow, M. T. and Kushmerick, M. J. (1982). Myosin light chain phosphorylation is associated with a decrease in the energy cost for contraction in fast twitch mouse muscle J.Biol.Chem., 257, 2121-2124.
59. Cunningham, D. A., McCrimmon, D., and Vlach, L. F. (1979). Cardiovascular response to interval and continuous training in women Eur.J.Appl.Physiol Occup.Physiol, 41, 187-197.
60. Daussin, F. N., Ponsot, E., Dufour, S. P., Lonsdorfer-Wolf, E., Doutreleau, S., Geny, B., Piquard, F., and Richard, R. (2007). Improvement of VO2max by cardiac output and oxygen extraction adaptation during intermittent versus continuous endurance training Eur.J.Appl.Physiol, 101, 377-383.
61. Daussin, F. N., Zoll, J., Dufour, S. P., Ponsot, E., Lonsdorfer-Wolf, E., Doutreleau, S., Mettauer, B., Piquard, F., Geny, B., and Richard, R. (2008). Effect of interval versus continuous training on cardiorespiratory and mitochondrial functions: relationship to aerobic performance improvements in sedentary subjects Am.J.Physiol Regul.Integr.Comp Physiol, 295, R264-R272.
62. Davis, J. A. (1985). Anaerobic threshold: review of the concept and directions for future research Med.Sci.Sports Exerc., 17, 6-21.
63. Denis, C., Dormois, D., and Lacour, J. R. (1984). Endurance training, VO2 max, and OBLA: a longitudinal study of two different age groups Int.J.Sports Med., 5, 167-173.
64. Donovan, C. M. and Brooks, G. A. (1983). Endurance training affects lactate clearance, not lactate production Am.J.Physiol, 244, E83-E92.
65. Driller, M. W., Fell, J. W., Gregory, J. R., Shing, C. M., and Williams, A. D. (2009). The effects of high-intensity interval training in well-trained rowers Int.J.Sports Physiol Perform., 4, 110-121.
66. Dubouchaud, H., Butterfield, G. E., Wolfel, E. E., Bergman, B. C., and Brooks, G. A. (2000). Endurance training, expression, and physiology of LDH, MCT1, and MCT4 in human skeletal muscle Am.J.Physiol Endocrinol.Metab, 278, E571-E579.
67. Dudley, G. A., Abraham, W. M., and Terjung, R. L. (1982). Influence of exercise intensity and duration on biochemical adaptations in skeletal muscle J.Appl.Physiol, 53, 844-850.
68. Dudley, G. A., Tullson, P. C., and Terjung, R. L. (5-7-1987). Influence of mitochondrial content on the sensitivity of respiratory control J.Biol.Chem., 262, 9109-9114.
69. Duffield, R., Dawson, B., and Goodman, C. (2004) Energy system contribution to 100-m and 200-m track running events. J Sci Med Sport, 7: 302–313.
70. Duffield, R., Dawson, B., and Goodman, C. (2005a) Energy system contribution to
400-metre and 800-metre track running. J Sports Sci, 23: 299–307. 71. Duffield, R., Dawson, B., and Goodman, C. (2005b) Energy system contribution to
1500- and 3000-metre track running. J Sports Sci, 23: 993–1002.

215
72. Eddy, D. O., Sparks, K. L., and Adelizi, D. A. (1977). The effects of continuous and
interval training in women and men Eur.J.Appl.Physiol Occup.Physiol, 37, 83-92.
73. Edge, J., Bishop, D., and Goodman, C. (2006). The effects of training intensity on muscle buffer capacity in females Eur.J.Appl.Physiol, 96, 97-105.
74. Edge, J., Bishop, D., Goodman, C., and Dawson, B. (2005). Effects of high- and moderate-intensity training on metabolism and repeated sprints Med.Sci.Sports Exerc., 37, 1975-1982.
75. Effros, R. B. (2004). Impact of the Hayflick Limit on T cell responses to infection: lessons from aging and HIV disease Mech.Ageing Dev., 125, 103-106.
76. Effros, R. B. (2007). Role of T lymphocyte replicative senescence in vaccine efficacy Vaccine, 25, 599-604.
77. Effros, R. B., Allsopp, R., Chiu, C. P., Hausner, M. A., Hirji, K., Wang, L., Harley, C. B., Villeponteau, B., West, M. D., and Giorgi, J. V. (1996). Shortened telomeres in the expanded CD28-CD8+ cell subset in HIV disease implicate replicative senescence in HIV pathogenesis AIDS, 10, F17-F22.
78. Ekblom, B., Kilbom, A., and Soltysiak, J. (1973). Physical training, bradycardia, and autonomic nervous system Scand.J.Clin.Lab Invest, 32, 251-256.
79. Elosua, R., Molina, L., Fito, M., Arquer, A., Sanchez-Quesada, J. L., Covas, M. I., Ordonez-Llanos, J., and Marrugat, J. (2003). Response of oxidative stress biomarkers to a 16-week aerobic physical activity program, and to acute physical activity, in healthy young men and women Atherosclerosis, 167, 327-334.
80. Esteve-Lanao, J., Foster, C., Seiler, S., and Lucia, A. (2007). Impact of training intensity distribution on performance in endurance athletes J.Strength.Cond.Res., 21, 943-949.
81. Esteve-Lanao, J., San Juan, A. F., Earnest, C. P., Foster, C., and Lucia, A. (2005). How do endurance runners actually train? Relationship with competition performance Med.Sci.Sports Exerc., 37, 496-504.
82. Evertsen, F., Medbo, J. I., and Bonen, A. (2001). Effect of training intensity on muscle lactate transporters and lactate threshold of cross-country skiers Acta Physiol Scand., 173, 195-205.
83. Evertsen, F., Medbo, J. I., Jebens, E., and Gjovaag, T. F. (1999). Effect of training on the activity of five muscle enzymes studied on elite cross-country skiers Acta Physiol Scand., 167, 247-257.
84. Fabbri, M., Smart, C., and Pardi, R. (2003). T lymphocytes Int.J.Biochem.Cell Biol., 35, 1004-1008.
85. Farina, D., Macaluso, A., Ferguson, R. A., and De Vito, G. (2004). Effect of power, pedal rate, and force on average muscle fiber conduction velocity during cycling J.Appl.Physiol, 97, 2035-2041.

216
86. Fatouros, I. G., Jamurtas, A. Z., Villiotou, V., Pouliopoulou, S., Fotinakis, P., Taxildaris, K., and Deliconstantinos, G. (2004). Oxidative stress responses in older men during endurance training and detraining Med.Sci.Sports Exerc., 36, 2065-2072.
87. Faude, O., Kindermann, W., and Meyer, T. (2009). Lactate threshold concepts: how valid are they? Sports Med., 39, 469-490.
88. Favier, R. J., Constable, S. H., Chen, M., and Holloszy, J. O. (1986). Endurance exercise training reduces lactate production J.Appl.Physiol, 61, 885-889.
89. Fisher-Wellman, K. and Bloomer, R. J. (2009). Acute exercise and oxidative stress: a 30 year history Dyn.Med., 8, 1-
90. Fiskerstrand, A. and Seiler, K. S. (2004). Training and performance characteristics among Norwegian international rowers 1970-2001 Scand.J.Med.Sci.Sports, 14, 303-310.
91. Fitts, R. H., Booth, F. W., Winder, W. W. and Holloszy, J. O. (1975). Skeletal muscle respiratory capacity, endurance, and glycogen utilization. Am J Physiol 228, 1029–1033.
92. Foster, C. (1998). Monitoring training in athletes with reference to overtraining
syndrome Med.Sci.Sports Exerc., 30, 1164-1168.
93. Foster, C., Daines, E., Hector, L., Snyder, A. C., and Welsh, R. (1996). Athletic performance in relation to training load Wis.Med.J., 95, 370-374.
94. Foster, C., deKoning, J. J., Hettinga, F., Lampen, J., Dodge, C., Bobbert, M., and Porcari, J. P. (2004). Effect of competitive distance on energy expenditure during simulated competition Int.J.Sports Med., 25, 198-204.
95. Foster, C., Florhaug, J. A., Franklin, J., Gottschall, L., Hrovatin, L. A., Parker, S., Doleshal, P., and Dodge, C. (2001a). A new approach to monitoring exercise training J.Strength.Cond.Res., 15, 109-115.
96. Foster, C., Heimann, K. M., Esten, P. L., Brice, G., and Porcari, J. P. (2001b). Differences in perceptions of training by coaches and athletes S Afr J Med, 8, 3-7.
97. Foster, C., Hoyos, J., Earnest, C., and Lucia, A. (2005). Regulation of energy expenditure during prolonged athletic competition Med.Sci.Sports Exerc., 37, 670-675.
98. Foulds, K. E., Zenewicz, L. A., Shedlock, D. J., Jiang, J., Troy, A. E., and Shen, H. (2002). Cutting edge: CD4 and CD8 T cells are intrinsically different in their proliferative responses J.Immunol., 168, 1528-1532.
99. Franch, J., Madsen, K., Djurhuus, M. S., and Pedersen, P. K. (1998). Improved running economy following intensified training correlates with reduced ventilatory demands Med.Sci.Sports Exerc., 30, 1250-1256.
100. Freitas, A. A., Agenes, F., and Coutinho, G. C. (1996). Cellular competition modulates survival and selection of CD8+ T cells Eur.J.Immunol., 26, 2640-2649.
101. Fry, R. W., Morton, A. R., and Keast, D. (1991). Overtraining in athletes. An update Sports Med., 12, 32-65.

217
102. Fry, R. W., Morton, A. R., and Keast, D. (1992). Periodisation and the prevention of overtraining Can.J.Sport Sci., 17, 241-248.
103. Garet, M., Tournaire, N., Roche, F., Laurent, R., Lacour, J. R., Barthelemy, J. C., and Pichot, V. (2004). Individual Interdependence between nocturnal ANS activity and performance in swimmers Med.Sci.Sports Exerc., 36, 2112-2118.
104. Gaskill, S. E., Serfass, R. C., Bacharach, D. W., and Kelly, J. M. (1999). Responses to training in cross-country skiers Med.Sci.Sports Exerc., 31, 1211-1217.
105. Gaskill, S. E., Walker, A. J., Serfass, R. A., Bouchard, C., Gagnon, J., Rao, D. C., Skinner, J. S., Wilmore, J. H., and Leon, A. S. (2001). Changes in ventilatory threshold with exercise training in a sedentary population: the HERITAGE Family Study Int.J.Sports Med., 22, 586-592.
106. Gibala, M. J., Little, J. P., van, Essen M., Wilkin, G. P., Burgomaster, K. A., Safdar, A., Raha, S., and Tarnopolsky, M. A. (2006). Short-term sprint interval versus traditional endurance training: similar initial adaptations in human skeletal muscle and exercise performance J.Physiol, 575, 901-911.
107. Gibala, M. J., McGee, S. L., Garnham, A. P., Howlett, K. F., Snow, R. J., and Hargreaves, M. (2009). Brief intense interval exercise activates AMPK and p38 MAPK signaling and increases the expression of PGC-1alpha in human skeletal muscle J.Appl.Physiol, 106, 929-934.
108. Gilman, M. B. (1996). The use of heart rate to monitor the intensity of endurance training Sports Med., 21, 73-79.
109. Gimmi, C. D., Freeman, G. J., Gribben, J. G., Sugita, K., Freedman, A. S., Morimoto, C., and Nadler, L. M. (1991). B-cell surface antigen B7 provides a costimulatory signal that induces T cells to proliferate and secrete interleukin 2. Proc Natl Acad Sci USA 88, 8575-8579.
110. Gleeson, M (2006). Immune Function in Sport and Exercise
111. Gleeson, M. (2007). Immune function in sport and exercise J.Appl.Physiol, 103, 693-699.
112. Gleeson, M. and Bishop, N. C. (2005). The T cell and NK cell immune response to exercise Ann.Transplant., 10, 43-48.
113. Gleeson, M., Pyne, D. B., Austin, J. P., Lynn, Francis J., Clancy, R. L., McDonald, W. A., and Fricker, P. A. (2002). Epstein-Barr virus reactivation and upper-respiratory illness in elite swimmers Med.Sci.Sports Exerc., 34, 411-417.
114. Gollnick, P. D. (1985). Metabolism of substrates: energy substrate metabolism during exercise and as modified by training Fed.Proc., 44, 353-357.
115. Gollnick, P. D. and Ianuzzo, C. D. (1972). Hormonal deficiencies and the metabolic adaptations of rats to training Am.J.Physiol, 223, 278-282.
116. Gomez-Cabrera, M. C., Domenech, E., and Vina, J. (2008). Moderate exercise is an antioxidant: upregulation of antioxidant genes by training Free Radic.Biol.Med., 44, 126-131.

218
117. Goronzy, J. J., Fulbright, J. W., Crowson, C. S., Poland, G. A., O'Fallon, W. M., and Weyand, C. M. (2001). Value of immunological markers in predicting responsiveness to influenza vaccination in elderly individuals J.Virol., 75, 12182-12187.
118. Gorostiaga, E. M., Walter, C. B., Foster, C., and Hickson, R. C. (1991). Uniqueness of interval and continuous training at the same maintained exercise intensity Eur.J.Appl.Physiol Occup.Physiol, 63, 101-107.
119. Grant, S., McMillan, K., Newell, J., Wood, L., Keatley, S., Simpson, D., Leslie, K., and Fairlie-Clark, S. (2002). Reproducibility of the blood lactate threshold, 4 mmol.l-1 marker, heart rate and ratings of perceived exertion during incremental treadmill exercise in humans Eur.J.Appl.Physiol, 87, 159-166.
120. Groussard, C., Rannou-Bekono, F., Machefer, G., Chevanne, M., Vincent, S., Sergent, O., Cillard, J., and Gratas-Delamarche, A. (2003). Changes in blood lipid peroxidation markers and antioxidants after a single sprint anaerobic exercise Eur.J.Appl.Physiol, 89, 14-20.
121. Guellich, A., Seiler, S., and Emrich, E. (2009). Training methods and intensity distribution of young world-class rowers Int.J.Sports Physiol Perform., 4, 448-460.
122. Gurd, B. J., Perry, C. G., Heigenhauser, G. J., Spriet, L. L., and Bonen, A. (2010). High-intensity interval training increases SIRT1 activity in human skeletal muscle Appl.Physiol Nutr.Metab, 35, 350-357.
123. Hack, V., Weiss, C., Friedmann, B., Suttner, S., Schykowski, M., Erbe, N., Benner, A., Bartsch, P., and Droge, W. (1997). Decreased plasma glutamine level and CD4+ T cell number in response to 8 wk of anaerobic training Am.J.Physiol, 272, E788-E795.
124. Halson, S. L., Bridge, M. W., Meeusen, R., Busschaert, B., Gleeson, M., Jones, D. A., and Jeukendrup, A. E. (2002). Time course of performance changes and fatigue markers during intensified training in trained cyclists J.Appl.Physiol, 93, 947-956.
125. Halson, S. L. and Jeukendrup, A. E. (2004). Does overtraining exist? An analysis of overreaching and overtraining research Sports Med., 34, 967-981.
126. Handschin, C., Chin, S., Li, P., Liu, F., Maratos-Flier, E., Lebrasseur, N. K., Yan, Z., and Spiegelman, B. M. (2007). Skeletal muscle fiber-type switching, exercise intolerance, and myopathy in PGC-1alpha muscle-specific knock-out animals J.Biol.Chem., 282, 30014-30021.
127. Hardie, D. G. and Sakamoto, K. (2006). AMPK: a key sensor of fuel and energy status in skeletal muscle Physiology.(Bethesda.), 21, 48-60.
128. Harman, D. (2006). Free radical theory of aging: an update: increasing the functional life span Ann.N.Y.Acad.Sci., 1067, 10-21.
129. Harms, S. J. and Hickson, R. C. (1983). Skeletal muscle mitochondria and myoglobin, endurance, and intensity of training J.Appl.Physiol, 54, 798-802.
130. Hawley, J. A. and Stepto, N. K. (2001). Adaptations to training in endurance cyclists: implications for performance Sports Med., 31, 511-520.

219
131. Hayot, M., Michaud, A., Koechlin, C., Caron, M. A., Leblanc, P., Prefaut, C., and Maltais, F. (2005). Skeletal muscle microbiopsy: a validation study of a minimally invasive technique Eur.Respir.J., 25, 431-440.
132. Heath, G. W., Ford, E. S., Craven, T. E., Macera, C. A., Jackson, K. L., and Pate, R. R. (1991). Exercise and the incidence of upper respiratory tract infections Med.Sci.Sports Exerc., 23, 152-157.
133. Hedelin, R., Kentta, G., Wiklund, U., Bjerle, P., and Henriksson-Larsen, K. (2000). Short-term overtraining: effects on performance, circulatory responses, and heart rate variability Med.Sci.Sports Exerc., 32, 1480-1484.
134. Heitkamp, H. C., Holdt, M., and Scheib, K. (1991). The reproducibility of the 4 mmol/l lactate threshold in trained and untrained women Int.J.Sports Med., 12, 363-368.
135. Helgerud, J., Hoydal, K., Wang, E., Karlsen, T., Berg, P., Bjerkaas, M., Simonsen, T., Helgesen, C., Hjorth, N., Bach, R., and Hoff, J. (2007). Aerobic high-intensity intervals improve VO2max more than moderate training Med.Sci.Sports Exerc., 39, 665-671.
136. Hellsten, Y., Rufener, N., Nielsen, J. J., Hoier, B., Krustrup, P., and Bangsbo, J. (2008). Passive leg movement enhances interstitial VEGF protein, endothelial cell proliferation, and eNOS mRNA content in human skeletal muscle Am.J.Physiol Regul.Integr.Comp Physiol, 294, R975-R982.
137. Henson, D. A., Nieman, D. C., Blodgett, A. D., Butterworth, D. E., Utter, A., Davis, J. M., Sonnenfeld, G., Morton, D. S., Fagoaga, O. R., and Nehlsen-Cannarella, S. L. (1999). Influence of exercise mode and carbohydrate on the immune response to prolonged exercise Int.J.Sport Nutr., 9, 213-228.
138. Hermansen, L., Hultman, E., and Saltin, B. (1967). Muscle glycogen during prolonged severe exercise Acta Physiol Scand., 71, 129-139.
139. Holloszy, J. O. and Coyle, E. F. (1984). Adaptations of skeletal muscle to endurance exercise and their metabolic consequences J.Appl.Physiol, 56, 831-838.
140. Holloszy, J. O., Rennie, M. J., Hickson, R. C., Conlee, R. K., and Hagberg, J. M. (1977). Physiological consequences of the biochemical adaptations to endurance exercise Ann.N.Y.Acad.Sci., 301, 440-450.
141. Hood, D. A. (2001). Invited Review: contractile activity-induced mitochondrial biogenesis in skeletal muscle J.Appl.Physiol, 90, 1137-1157.
142. Hood, D. A., Takahashi, M., Connor, M. K., and Freyssenet, D. (2000b). Assembly of the cellular powerhouse: current issues in muscle mitochondrial biogenesis Exerc.Sport Sci.Rev., 28, 68-73.
143. Hood, M. S., Little, J. P., Tarnopolsky, M. A., Myslik, F., and Gibala, M. J. (2011). Low-Volume Interval Training Improves Muscle Oxidative Capacity in Sedentary Adults Med.Sci.Sports Exerc.,
144. Hooper, S. L., MacKinnon, L. T., Gordon, R. D., and Bachmann, A. W. (1993). Hormonal responses of elite swimmers to overtraining Med.Sci.Sports Exerc., 25, 741-747.

220
145. Hopkins, W. G. (2000). Measures of reliability in sports medicine and science Sports Med., 30, 1-15.
146. Hoppeler, H., Howald, H., Conley, K., Lindstedt, S. L., Claassen, H., Vock, P., and Weibel, E. R. (1985). Endurance training in humans: aerobic capacity and structure of skeletal muscle J.Appl.Physiol, 59, 320-327.
147. Hoppeler, H., Luthi, P., Claassen, H., Weibel, E. R., and Howald, H. (1973). [Ultrastructure of normal human skeletal muscle; a morphometric analysis in controls and men trained in long-distance running] Hoppe Seylers.Z.Physiol Chem., 354, 229-230.
148. Hulston, C. J., Venables, M. C., Mann, C. H., Martin, C., Philp, A., Baar, K., and Jeukendrup, A. E. (2010). Training with low muscle glycogen enhances fat metabolism in well-trained cyclists Med.Sci.Sports Exerc., 42, 2046-2055.
149. Iaia, F. M., Hellsten, Y., Nielsen, J. J., Fernstrom, M., Sahlin, K., and Bangsbo, J. (2009). Four weeks of speed endurance training reduces energy expenditure during exercise and maintains muscle oxidative capacity despite a reduction in training volume J.Appl.Physiol, 106, 73-80.
150. Iellamo, F., Legramante, J. M., Pigozzi, F., Spataro, A., Norbiato, G., Lucini, D., and Pagani, M. (2002). Conversion from vagal to sympathetic predominance with strenuous training in high-performance world class athletes Circulation, 105, 2719-2724.
151. Ingham, S. A., Carter, H., Whyte, G. P., and Doust, J. H. (2008). Physiological and performance effects of low- versus mixed-intensity rowing training Med.Sci.Sports Exerc., 40, 579-584.
152. Irrcher, I., Adhihetty, P. J., Joseph, A. M., Ljubicic, V., and Hood, D. A. (2003). Regulation of mitochondrial biogenesis in muscle by endurance exercise Sports Med., 33, 783-793.
153. Israel. S. (1976). The problems of overtraining in a medical and sports physiological point of view Medizin und Sport, 16, 1-12.
154. Jensen, K., Nielsen, T. S., Fiskestrand, A., Lund, J. O., Christensen, N. J., and Secher, N. H (1993). High-altitude training does not increase maximal oxygen uptake or work capacity at sea level in rowers Scand.J.Med.Sci.Sports, 3, 262-
155. Jensen, L., Bangsbo, J., and Hellsten, Y. (2004). Effect of high intensity training on capillarization and presence of angiogenic factors in human skeletal muscle J.Physiol, 557, 571-582.
156. Jeukendrup, A. E. and Hesselink, M. K. (1994). Overtraining--what do lactate curves tell us? Br.J.Sports Med., 28, 239-240.
157. Jeukendrup, A. E., Hesselink, M. K., Snyder, A. C., Kuipers, H., and Keizer, H. A. (1992). Physiological changes in male competitive cyclists after two weeks of intensified training Int.J.Sports Med., 13, 534-541.
158. Jones, A. M. and Carter, H. (2000). The effect of endurance training on parameters of aerobic fitness Sports Med., 29, 373-386.

221
159. Jones, A. M. and Doust, J. H. (1996). A 1% treadmill grade most accurately reflects the energetic cost of outdoor running J.Sports Sci., 14, 321-327.
160. Jones, A. M. and Doust, J. H. (1997). The Conconi test in not valid for estimation of the lactate turnpoint in runners J.Sports Sci., 15, 385-394.
161. Juel, C. (2001). Current aspects of lactate exchange: lactate/H+ transport in human skeletal muscle Eur.J.Appl.Physiol, 86, 12-16.
162. Juel, C. and Halestrap, A. P. (1999). Lactate transport in skeletal muscle - role and regulation of the monocarboxylate transporter J.Physiol, 517 ( Pt 3), 633-642.
163. Keith, S. P., Jacobs, I., and McLellan, T. M. (1992). Adaptations to training at the individual anaerobic threshold Eur.J.Appl.Physiol Occup.Physiol, 65, 316-323.
164. Kemi, O. J., Haram, P. M., Loennechen, J. P., Osnes, J. B., Skomedal, T., Wisloff, U., and Ellingsen, O. (2005). Moderate vs. high exercise intensity: differential effects on aerobic fitness, cardiomyocyte contractility, and endothelial function Cardiovasc.Res., 67, 161-172.
165. Kindermann, W., Simon, G., and Keul, J. (1979). The significance of the aerobic-anaerobic transition for the determination of work load intensities during endurance training Eur.J.Appl.Physiol Occup.Physiol, 42, 25-34.
166. Kinnunen, S., Laukkanen, R., Haldi, J., Hanninen, O., and Atalay, M. (2006). Heart rate variability in trotters during different training periods Equine Vet.J.Suppl, 214-217.
167. Kjaer, M. (1998). Adrenal medulla and exercise training Eur.J.Appl.Physiol Occup.Physiol, 77, 195-199.
168. Koch, S., Larbi, A., Ozcelik, D., Solana, R., Gouttefangeas, C., Attig, S., Wikby, A., Strindhall, J., Franceschi, C., and Pawelec, G. (2007). Cytomegalovirus infection: a driving force in human T cell immunosenescence Ann.N.Y.Acad.Sci., 1114, 23-35.
169. Koch, S., Solana, R., Dela, Rosa O., and Pawelec, G. (2006). Human cytomegalovirus infection and T cell immunosenescence: a mini review Mech.Ageing Dev., 127, 538-543.
170. Kohn, T. A., Essen-Gustavsson, B., and Myburgh, K. H. (2010). Specific muscle adaptations in type II fibers after high-intensity interval training of well-trained runners Scand.J.Med.Sci.Sports,
171. Kuipers, H., Verstappen, F. T., Keizer, H. A., Geurten, P., and van, Kranenburg G. (1985). Variability of aerobic performance in the laboratory and its physiologic correlates Int.J.Sports Med., 6, 197-201.
172. Labalette, M., Leteurtre, E., Thumerelle, C., Grutzmacher, C., Tourvieille, B., and Dessaint, J. P. (1999). Peripheral human CD8(+)CD28(+)T lymphocytes give rise to CD28(-)progeny, but IL-4 prevents loss of CD28 expression Int.Immunol., 11, 1327-1336.
173. Lancaster, G. I., Halson, S. L., Khan, Q., Drysdale, P., Wallace, F., Jeukendrup, A. E., Drayson, M. T., and Gleeson, M. (2004). Effects of acute exhaustive exercise and chronic exercise training on type 1 and type 2 T lymphocytes Exerc.Immunol.Rev., 10, 91-106.

222
174. Larbi, A., Kempf, J., and Pawelec, G. (2007). Oxidative stress modulation and T cell activation Exp.Gerontol., 42, 852-858.
175. Laursen, P. B. (2010). Training for intense exercise performance: high-intensity or high-volume training? Scand.J.Med.Sci.Sports, 20 Suppl 2, 1-10.
176. Laursen, P. B., Blanchard, M. A., and Jenkins, D. G. (2002a). Acute high-intensity interval training improves Tvent and peak power output in highly trained males Can.J.Appl.Physiol, 27, 336-348.
177. Laursen, P. B. and Jenkins, D. G. (2002b). The scientific basis for high-intensity interval training: optimising training programmes and maximising performance in highly trained endurance athletes Sports Med., 32, 53-73.
178. Laursen, P. B., Marsh, S. A., Jenkins, D. G., and Coombes, J. S. (2007). Manipulating training intensity and volume in already well-trained rats: effect on skeletal muscle oxidative and glycolytic enzymes and buffering capacity Appl.Physiol Nutr.Metab, 32, 434-442.
179. Laursen, P. B., Shing, C. M., Peake, J. M., Coombes, J. S., and Jenkins, D. G. (2002b). Interval training program optimization in highly trained endurance cyclists Med.Sci.Sports Exerc., 34, 1801-1807.
180. Lehmann, M., Baumgartl, P., Wiesenack, C., Seidel, A., Baumann, H., Fischer, S., Spori, U., Gendrisch, G., Kaminski, R., and Keul, J. (1992). Training-overtraining: influence of a defined increase in training volume vs training intensity on performance, catecholamines and some metabolic parameters in experienced middle- and long-distance runners Eur.J.Appl.Physiol Occup.Physiol, 64, 169-177.
181. Lehmann, M., Foster, C., Dickhuth, H. H., and Gastmann, U. (1998). Autonomic imbalance hypothesis and overtraining syndrome Med.Sci.Sports Exerc., 30, 1140-1145.
182. Lehmann, M., Foster, C., and Keul, J. (1993). Overtraining in endurance athletes: a brief review Med.Sci.Sports Exerc., 25, 854-862.
183. Leick, L., Wojtaszewski, J. F., Johansen, S. T., Kiilerich, K., Comes, G., Hellsten, Y., Hidalgo, J., and Pilegaard, H. (2008). PGC-1alpha is not mandatory for exercise- and training-induced adaptive gene responses in mouse skeletal muscle Am.J.Physiol Endocrinol.Metab, 294, E463-E474.
184. Lindsay, F. H., Hawley, J. A., Myburgh, K. H., Schomer, H. H., Noakes, T. D., and Dennis, S. C. (1996). Improved athletic performance in highly trained cyclists after interval training Med.Sci.Sports Exerc., 28, 1427-1434.
185. Lindsten, T., June, C. H., Ledbetter, J. A., Stella, G., and Thompson, C. B. (1989). Regulation of lymphokine messenger RNA stability by a surface-mediated T cell activation pathway. Science, 244.339-343.
186. Linsley, P. S. and Ledbetter, J. A. (1993). The role of the CD28 receptor during T cell responses to antigen Annu.Rev.Immunol., 11, 191-212.
187. Little, J. P., Safdar, A., Wilkin, G. P., Tarnopolsky, M. A., and Gibala, M. J. (2010). A practical model of low-volume high-intensity interval training induces mitochondrial

223
biogenesis in human skeletal muscle: potential mechanisms J.Physiol, 588, 1011-1022.
188. Londeree, B. R. (1997). Effect of training on lactate/ventilatory thresholds: a meta-analysis Med Sci.Sports Exerc., 29, 837-843.
189. Lovlin, R., Cottle, W., Pyke, I., Kavanagh, M., and Belcastro, A. N. (1987). Are indices of free radical damage related to exercise intensity Eur.J.Appl.Physiol Occup.Physiol, 56, 313-316.
190. Lucia, A., Carvajal, A., Calderon, F. J., Alfonso, A., and Chicharro, J. L. (1999a). Breathing pattern in highly competitive cyclists during incremental exercise Eur.J.Appl.Physiol Occup.Physiol, 79, 512-521.
191. Lucia, A., Diaz, B., Hoyos, J., Fernandez, C., Villa, G., Bandres, F., and Chicharro, J. L. (2001). Hormone levels of world class cyclists during the Tour of Spain stage race Br.J.Sports Med., 35, 424-430.
192. Lucia, A., Hoyos, J., Carvajal, A., and Chicharro, J. L. (1999b). Heart rate response to professional road cycling: the Tour de France Int.J.Sports Med., 20, 167-172.
193. Lucia, A., Hoyos, J., Pardo, J., and Chicharro, J. L. (2000a). Metabolic and neuromuscular adaptations to endurance training in professional cyclists: a longitudinal study Jpn.J.Physiol, 50, 381-388.
194. Lucia, A., Hoyos, J., Perez, M., and Chicharro, J. L. (2000b). Heart rate and performance parameters in elite cyclists: a longitudinal study Med.Sci.Sports Exerc., 32, 1777-1782.
195. Lucia, A., Hoyos, J., Santalla, A., Earnest, C., and Chicharro, J. L. (2003). Tour de France versus Vuelta a Espana: which is harder? Med.Sci.Sports Exerc., 35, 872-878.
196. Lucia, A., Pardo, J., Durantez, A., Hoyos, J., and Chicharro, J. L. (1998). Physiological differences between professional and elite road cyclists Int.J.Sports Med., 19, 342-348.
197. Ludbrook, J. (1997). Comparing methods of measurements Clin.Exp.Pharmacol.Physiol, 24, 193-203.
198. Ludbrook, J. (2010). Linear regression analysis for comparing two measurers or methods of measurement: but which regression? Clin.Exp.Pharmacol.Physiol, 37, 692-699.
199. Ma, S., Ochi, H., Cui, L., Zhang, J., and He, W. (2003). Hydrogen peroxide induced down-regulation of CD28 expression of Jurkat cells is associated with a change of site alpha-specific nuclear factor binding activity and the activation of caspase-3 Exp.Gerontol., 38, 1109-1118.
200. MacDougall, D. and Sale, D. (1981). Continuous vs. interval training: a review for the athlete and the coach Can.J.Appl.Sport Sci., 6, 93-97.
201. MacDougall, J. D., Ward, G. R., and Sutton, J. R. (1977). Muscle glycogen repletion after high-intensity intermittent exercise J.Appl.Physiol, 42, 129-132.

224
202. MacKinnon, L. T. (2000). Chronic exercise training effects on immune function Med.Sci.Sports Exerc., 32, S369-S376.
203. MacKinnon, L. T. and Hooper, S. L. (1996). Plasma glutamine and upper respiratory tract infection during intensified training in swimmers Med.Sci.Sports Exerc., 28, 285-290.
204. MacRae, H. S., Dennis, S. C., Bosch, A. N., and Noakes, T. D. (1992). Effects of training on lactate production and removal during progressive exercise in humans J.Appl.Physiol, 72, 1649-1656.
205. Magel, J. R., Foglia, G. F., McArdle, W. D., Gutin, B., Pechar, G. S., and Katch, F. I. (1975). Specificity of swim training on maximum oxygen uptake J.Appl.Physiol, 38, 151-155.
206. Matsunaga, S., Inashima, S., Tsuchimochi, H., Yamada, T., Hazama, T., and Wada, M. (2002). Altered sarcoplasmic reticulum function in rat diaphragm after high-intensity exercise Acta Physiol Scand., 176, 227-232.
207. Matthews, C. E., Ockene, I. S., Freedson, P. S., Rosal, M. C., Merriam, P. A., and Hebert, J. R. (2002). Moderate to vigorous physical activity and risk of upper-respiratory tract infection Med.Sci.Sports Exerc., 34, 1242-1248.
208. Mattson, M. P. (2008). Hormesis defined Ageing Res.Rev., 7, 1-7.
209. McAnulty, S. R., McAnulty, L. S., Nieman, D. C., Morrow, J. D., Utter, A. C., Henson, D. A., Dumke, C. L., and Vinci, D. M. (2003). Influence of carbohydrate ingestion on oxidative stress and plasma antioxidant potential following a 3 h run Free Radic.Res., 37, 835-840.
210. McCullagh, K. J., Poole, R. C., Halestrap, A. P., O'Brien, M., and Bonen, A. (1996). Role of the lactate transporter (MCT1) in skeletal muscles Am.J.Physiol, 271, E143-E150.
211. McLellan, T. M. and Jacobs, I. (1993). Reliability, reproducibility and validity of the individual anaerobic threshold Eur.J.Appl.Physiol Occup.Physiol, 67, 125-131.
212. Messonnier, L., Freund, H., Denis, C., Dormois, D., Dufour, A. B., and Lacour, J. R. (2002). Time to exhaustion at VO(2)max is related to the lactate exchange and removal abilities Int.J.Sports Med., 23, 433-438.
213. Midgley, A. W. and Mc Naughton, L. R. (2006). Time at or near VO2max during continuous and intermittent running. A review with special reference to considerations for the optimisation of training protocols to elicit the longest time at or near VO2max J.Sports Med.Phys.Fitness, 46, 1-14.
214. Midgley, A. W., McNaughton, L. R., and Jones, A. M. (2007). Training to enhance the physiological determinants of long-distance running performance: can valid recommendations be given to runners and coaches based on current scientific knowledge? Sports Med., 37, 857-880.
215. Milkiewicz, M., Brown, M. D., Egginton, S., and Hudlicka, O. (2001). Association between shear stress, angiogenesis, and VEGF in skeletal muscles in vivo Microcirculation., 8, 229-241.

225
216. Morgan, G., Peter, J. B., and Newbould, B. B. (1971). Experimental allergic myositis in rats Arthritis Rheum., 14, 599-609.
217. Morgan, W. P., Costill, D. L., Flynn, M. G., Raglin, J. S., and O'Connor, P. J. (1988). Mood disturbance following increased training in swimmers Med.Sci.Sports Exerc., 20, 408-414.
218. Morillas-Ruiz, J., Zafrilla, P., Almar, M., Cuevas, M. J., Lopez, F. J., Abellan, P., Villegas, J. A., and Gonzalez-Gallego, J. (2005). The effects of an antioxidant-supplemented beverage on exercise-induced oxidative stress: results from a placebo-controlled double-blind study in cyclists Eur.J.Appl.Physiol, 95, 543-549.
219. Morton, R. H. (1997). Modeling training and overtraining J.Sports Sci., 15, 335-340.
220. Moynihan, J. A., Callahan, T. A., Kelley, S. P., and Campbell, L. M. (1998). Adrenal hormone modulation of type 1 and type 2 cytokine production by spleen cells: dexamethasone and dehydroepiandrosterone suppress interleukin-2, interleukin-4, and interferon-gamma production in vitro Cell Immunol., 184, 58-64.
221. Mujika, I., Chatard, J. C., Busso, T., Geyssant, A., Barale, F., and Lacoste, L. (1995). Effects of training on performance in competitive swimming Can.J.Appl.Physiol, 20, 395-406.
222. Munoz, Marin D., Olcina, G., Timon, R., Robles, M. C., Caballero, M. J., and Maynar, M. (2010). Effect of different exercise intensities on oxidative stress markers and antioxidant response in trained cyclists J.Sports Med.Phys.Fitness, 50, 93-98.
223. Nevill, A. M., Ramsbottom, R., and Williams, C. (1992). Scaling physiological measurements for individuals of different body size Eur.J.Appl.Physiol Occup.Physiol, 65, 110-117.
224. Nieman, D. C. (1994). Exercise, upper respiratory tract infection, and the immune system Med.Sci.Sports Exerc., 26, 128-139.
225. Nieman, D. C., Nehlsen-Cannarella, S. L., Fagoaga, O. R., Henson, D. A., Shannon, M., Davis, J. M., Austin, M. D., Hisey, C. L., Holbeck, J. C., Hjertman, J. M., Bolton, M. R., and Schilling, B. K. (1999). Immune response to two hours of rowing in elite female rowers Int.J.Sports Med., 20, 476-481.
226. Niess, A. M., Hartmann, A., Grunert-Fuchs, M., Poch, B., and Speit, G. (1996). DNA damage after exhaustive treadmill running in trained and untrained men Int.J.Sports Med., 17, 397-403.
227. Nociari, M. M., Telford, W., and Russo, C. (1999). Postthymic development of CD28-CD8+ T cell subset: age-associated expansion and shift from memory to naive phenotype J.Immunol., 162, 3327-3335.
228. Ojuka, E. O. (2004). Role of calcium and AMP kinase in the regulation of mitochondrial biogenesis and GLUT4 levels in muscle Proc.Nutr.Soc., 63, 275-278.
229. Okamura, K., Doi, T., Hamada, K., Sakurai, M., Yoshioka, Y., Mitsuzono, R., Migita, T., Sumida, S., and Sugawa-Katayama, Y. (1997). Effect of repeated exercise on urinary 8-hydroxy-deoxyguanosine excretion in humans Free Radic.Res., 26, 507-514.

226
230. Oosthuyse, T, and Bosch, A. N. (2010). The effect of the menstrual cycle on exercise metabolism: implications for exercise performance in eumenorrhoeic women Sports Med, 40, 207-227
231. Ouyang, Q., Wagner, W. M., Voehringer, D., Wikby, A., Klatt, T., Walter, S., Muller, C. A., Pircher, H., and Pawelec, G. (2003). Age-associated accumulation of CMV-specific CD8+ T cells expressing the inhibitory killer cell lectin-like receptor G1 (KLRG1) Exp.Gerontol., 38, 911-920.
232. Overend, T. J., Paterson, D. H., and Cunningham, D. A. (1992). The effect of interval and continuous training on the aerobic parameters Can.J.Sport Sci., 17, 129-134.
233. Packer, L. and Fuehr, K. (1977). Low oxygen concentration extends the lifespan of cultured human diploid cells Nature, 267, 423-425.
234. Palazzetti, S., Richard, M. J., Favier, A., and Margaritis, I. (2003). Overloaded training increases exercise-induced oxidative stress and damage Can.J.Appl.Physiol, 28, 588-604.
235. Parkin, J. and Cohen, B. (2001). An overview of the immune system Lancet, 357, 1777-1789.
236. Pawelec, G., Derhovanessian, E., Larbi, A., Strindhall, J., and Wikby, A. (2009). Cytomegalovirus and human immunosenescence Rev.Med.Virol., 19, 47-56.
237. Pawelec, G., Sansom, D., Rehbein, A., Adibzadeh, M., and Beckman, I. (1996). Decreased proliferative capacity and increased susceptibility to activation-induced cell death in late-passage human CD4+ TCR2+ cultured T cell clones Exp.Gerontol., 31, 655-668.
238. Perillo, N. L., Naeim, F., Walford, R. L., and Effros, R. B. (1993). The in vitro senescence of human T lymphocytes: failure to divide is not associated with a loss of cytolytic activity or memory T cell phenotype Mech.Ageing Dev., 67, 173-185.
239. Perillo, N. L., Walford, R. L., Newman, M. A., and Effros, R. B. (1989). Human T lymphocytes possess a limited in vitro life span Exp.Gerontol., 24, 177-187.
240. Perry, C. G., Heigenhauser, G. J., Bonen, A., and Spriet, L. L. (2008). High-intensity aerobic interval training increases fat and carbohydrate metabolic capacities in human skeletal muscle Appl.Physiol Nutr.Metab, 33, 1112-1123.
241. Petersen, S., Saretzki, G., and von, Zglinicki T. (1998). Preferential accumulation of single-stranded regions in telomeres of human fibroblasts Exp.Cell Res., 239, 152-160.
242. Pfitzinger, P. and Freedson, P. S. (1998). The reliability of lactate measurements during exercise Int.J.Sports Med., 19, 349-357.
243. Phillips, S. M., Green, H. J., Tarnopolsky, M. A., and Grant, S. M. (1995). Increased clearance of lactate after short-term training in men J.Appl.Physiol, 79, 1862-1869.
244. Philp, A., Macdonald, A. L., Carter, H., Watt, P. W., and Pringle, J. S. (2008). Maximal lactate steady state as a training stimulus Int.J.Sports Med., 29, 475-479.

227
245. Pichot, V., Busso, T., Roche, F., Garet, M., Costes, F., Duverney, D., Lacour, J. R., and Barthelemy, J. C. (2002). Autonomic adaptations to intensive and overload training periods: a laboratory study Med.Sci.Sports Exerc., 34, 1660-1666.
246. Pichot, V., Roche, F., Gaspoz, J. M., Enjolras, F., Antoniadis, A., Minini, P., Costes, F., Busso, T., Lacour, J. R., and Barthelemy, J. C. (2000). Relation between heart rate variability and training load in middle-distance runners Med.Sci.Sports Exerc., 32, 1729-1736.
247. Pilegaard, H., Domino, K., Noland, T., Juel, C., Hellsten, Y., Halestrap, A. P., and Bangsbo, J. (1999a). Effect of high-intensity exercise training on lactate/H+ transport capacity in human skeletal muscle Am.J.Physiol, 276, E255-E261.
248. Pilegaard, H., Terzis, G., Halestrap, A., and Juel, C. (1999b). Distribution of the lactate/H+ transporter isoforms MCT1 and MCT4 in human skeletal muscle Am.J.Physiol, 276, E843-E848.
249. Poole, D. C. and Gaesser, G. A. (1985). Response of ventilatory and lactate thresholds to continuous and interval training J.Appl.Physiol, 58, 1115-1121.
250. Portier, H., Louisy, F., Laude, D., Berthelot, M., and Guezennec, C. Y. (2001). Intense endurance training on heart rate and blood pressure variability in runners Med.Sci.Sports Exerc., 33, 1120-1125.
251. Puigserver, P. and Spiegelman, B. M. (2003). Peroxisome proliferator-activated receptor-gamma coactivator 1 alpha (PGC-1 alpha): transcriptional coactivator and metabolic regulator Endocr.Rev., 24, 78-90.
252. Pyne, D. B., Boston, T., Martin, D. T., and Logan, A. (2000). Evaluation of the Lactate Pro blood lactate analyser Eur.J.Appl.Physiol, 82, 112-116.
253. Pyne, D. B., Lee, H., and Swanwick, K. M. (2001). Monitoring the lactate threshold in world-ranked swimmers Med.Sci.Sports Exerc., 33, 291-297.
254. Ramel, A., Wagner, K. H., and Elmadfa, I. (2004). Plasma antioxidants and lipid oxidation after submaximal resistance exercise in men Eur.J.Nutr., 43, 2-6.
255. Rebelo, A. N., Candeias, J. R., Fraga, M. M., Duarte, J. A., Soares, J. M., Magalhaes, C., and Torrinha, J. A. (1998). The impact of soccer training on the immune system J.Sports Med.Phys.Fitness, 38, 258-261.
256. Rivilis, I., Milkiewicz, M., Boyd, P., Goldstein, J., Brown, M. D., Egginton, S., Hansen, F. M., Hudlicka, O., and Haas, T. L. (2002). Differential involvement of MMP-2 and VEGF during muscle stretch- versus shear stress-induced angiogenesis Am.J.Physiol Heart Circ.Physiol, 283, H1430-H1438.
257. Roberts, J. A. (1986). Viral illnesses and sports performance Sports Med., 3, 298-303.
258. Rocha, B., Dautigny, N., and Pereira, P. (1989). Peripheral T lymphocytes: expansion potential and homeostatic regulation of pool sizes and CD4/CD8 ratios in vivo Eur.J.Immunol., 19, 905-911.
259. Rose, A. J., Frosig, C., Kiens, B., Wojtaszewski, J. F., and Richter, E. A. (2007). Effect of endurance exercise training on Ca2+ calmodulin-dependent protein kinase II expression and signalling in skeletal muscle of humans J.Physiol, 583, 785-795.

228
260. Rusko, H. and Bosco, C. C. (1987). Metabolic response of endurance athletes to training with added load Eur.J.Appl.Physiol Occup.Physiol, 56, 412-418.
261. Sachdev, S. and Davies, K. J. (2008). Production, detection, and adaptive responses to free radicals in exercise Free Radic.Biol.Med., 44, 215-223.
262. Sale, D. G., MacDougall, J. D., Jacobs, I., and Garner, S. (1990). Interaction between concurrent strength and endurance training J.Appl.Physiol, 68, 260-270.
263. Saltin, B. (1977). The interplay between peripheral and central factors in the adaptive response to exercise and training Ann.N.Y.Acad.Sci., 301, 224-231.
264. Sandbakk, O., Holmberg, H. C., Leirdal, S., and Ettema, G. (2010). The physiology of world-class sprint skiers Scand.J.Med.Sci.Sports,
265. Schumacher, Y. O. and Mueller, P. (2002). The 4000-m team pursuit cycling world record: theoretical and practical aspects Med.Sci.Sports Exerc., 34, 1029-1036.
266. Seals, D. R. and Chase, P. B. (1989). Influence of physical training on heart rate variability and baroreflex circulatory control J.Appl.Physiol, 66, 1886-1895.
267. Seiler, K. S. and Kjerland, G. O. (2006). Quantifying training intensity distribution in elite endurance athletes: is there evidence for an "optimal" distribution? Scand.J.Med.Sci.Sports, 16, 49-56.
268. Seiler, S and Tonnessen, E (2009). Intervals, Thresholds, and Long Slow Distance: the Role of Intensity and Duration in Endurance Training Sportscience, 13, 32-53.
269. Seiler, S., Haugen, O., and Kuffel, E. (2007). Autonomic recovery after exercise in trained athletes: intensity and duration effects Med.Sci.Sports Exerc., 39, 1366-1373.
270. Seiler, S. and Hetlelid, K. J. (2005). The impact of rest duration on work intensity and RPE during interval training Med.Sci.Sports Exerc., 37, 1601-1607.
271. Seiler, S. and Sjursen, J. E. (2004). Effect of work duration on physiological and rating scale of perceived exertion responses during self-paced interval training Scand.J.Med.Sci.Sports, 14, 318-325.
272. Sen, C. K. (2001). Antioxidant and redox regulation of cellular signaling: introduction Med.Sci.Sports Exerc., 33, 368-370.
273. Shephard, RJ (1992). Exercise physiology and performance of sport Sports Science Reviews, 1, 1-12.
274. Shi, X., Stevens, G. H., Foresman, B. H., Stern, S. A., and Raven, P. B. (1995). Autonomic nervous system control of the heart: endurance exercise training Med.Sci.Sports Exerc., 27, 1406-1413.
275. Shin, K., Minamitani, H., Onishi, S., Yamazaki, H., and Lee, M. (1995). The power spectral analysis of heart rate variability in athletes during dynamic exercise--Part I Clin.Cardiol., 18, 583-586.
276. Simoneau, J. A., Lortie, G., Boulay, M. R., Marcotte, M., Thibault, M. C., and Bouchard, C. (1985). Human skeletal muscle fiber type alteration with high-intensity intermittent training Eur.J.Appl.Physiol Occup.Physiol, 54, 250-253.

229
277. Simpson, R. J. (2011). Aging, persistent viral infections, and immunosenescence: can exercise "make space"? Exerc.Sport Sci.Rev., 39, 23-33.
278. Simpson, R. J., Cosgrove, C., Ingram, L. A., Florida-James, G. D., Whyte, G. P., Pircher, H., and Guy, K. (2008). Senescent T-lymphocytes are mobilised into the peripheral blood compartment in young and older humans after exhaustive exercise Brain Behav.Immun., 22, 544-551.
279. Simpson, R. J. and Guy, K. (2010). Coupling aging immunity with a sedentary lifestyle: has the damage already been done?--a mini-review Gerontology, 56, 449-458.
280. Sjodin, B., Jacobs, I., and Svedenhag, J. (1982). Changes in onset of blood lactate accumulation (OBLA) and muscle enzymes after training at OBLA Eur.J.Appl.Physiol Occup.Physiol, 49, 45-57.
281. Sjodin, B. and Svedenhag, J. (1985). Applied physiology of marathon running Sports Med., 2, 83-99.
282. Skinner, J. S. and McLellan, T. H. (1980). The transition from aerobic to anaerobic metabolism Res.Q.Exerc.Sport, 51, 234-248.
283. Smith, C. G. and Jones, A. M. (2001). The relationship between critical velocity, maximal lactate steady-state velocity and lactate turnpoint velocity in runners Eur.J.Appl.Physiol, 85, 19-26.
284. Smith, M. L., Hudson, D. L., Graitzer, H. M., and Raven, P. B. (1989). Exercise training bradycardia: the role of autonomic balance Med.Sci.Sports Exerc., 21, 40-44.
285. Smith, T. P., Coombes, J. S., and Geraghty, D. P. (2003). Optimising high-intensity treadmill training using the running speed at maximal O(2) uptake and the time for which this can be maintained Eur.J.Appl.Physiol, 89, 337-343.
286. Snyder, A. C., Jeukendrup, A. E., Hesselink, M. K., Kuipers, H., and Foster, C. (1993). A physiological/psychological indicator of over-reaching during intensive training Int.J.Sports Med., 14, 29-32.
287. Snyder, A. C., Kuipers, H., Cheng, B., Servais, R., and Fransen, E. (1995). Overtraining following intensified training with normal muscle glycogen Med.Sci.Sports Exerc., 27, 1063-1070.
288. Spaulding, C., Guo, W., and Effros, R. B. (1999). Resistance to apoptosis in human CD8+ T cells that reach replicative senescence after multiple rounds of antigen-specific proliferation Exp.Gerontol., 34, 633-644.
289. Spence, L., Brown, W. J., Pyne, D. B., Nissen, M. D., Sloots, T. P., McCormack, J. G., Locke, A. S., and Fricker, P. A. (2007). Incidence, etiology, and symptomatology of upper respiratory illness in elite athletes Med.Sci.Sports Exerc., 39, 577-586.
290. Spina, R. J., Chi, M. M., Hopkins, M. G., Nemeth, P. M., Lowry, O. H., and Holloszy, J. O. (1996). Mitochondrial enzymes increase in muscle in response to 7-10 days of cycle exercise J.Appl.Physiol, 80, 2250-2254.
291. Spits, H., Lanier, L.L, and Phillips, J.H. (1995). Development of human T and natural killer cells. Blood 85, 2654 – 2665.

230
292. Srere, P. (1969). Citrate Synthase 3-11.
293. St Clair, Gibson A., Schabort, E. J., and Noakes, T. D. (2001). Reduced neuromuscular activity and force generation during prolonged cycling Am.J.Physiol Regul.Integr.Comp Physiol, 281, R187-R196.
294. Steinacker, J. M. (1993). Physiological aspects of training in rowing Int.J.Sports Med., 14 Suppl 1, S3-10.
295. Steinacker, J. M., Laske, R., Hetzel, W. D., Lormes, W., Liu, Y., and Stauch, M. (1993). Metabolic and hormonal reactions during training in junior oarsmen Int.J.Sports Med., 14 Suppl 1, S24-S28.
296. Steinacker, J. M., Lormes, W., Lehmann, M., and Altenburg, D. (1998). Training of rowers before world championships Med.Sci.Sports Exerc., 30, 1158-1163.
297. Stepto, N. K., Hawley, J. A., Dennis, S. C., and Hopkins, W. G. (1999). Effects of different interval-training programs on cycling time-trial performance Med.Sci.Sports Exerc., 31, 736-741.
298. Stepto, N. K., Martin, D. T., Fallon, K. E., and Hawley, J. A. (2001). Metabolic demands of intense aerobic interval training in competitive cyclists Med.Sci.Sports Exerc., 33, 303-310.
299. Stone, M. H., Fleck, S. J., Triplett, N. T., and Kraemer, W. J. (1991). Health- and performance-related potential of resistance training Sports Med., 11, 210-231.
300. Tabata, I., Nishimura, K., Kouzaki, M., Hirai, Y., Ogita, F., Miyachi, M., and Yamamoto, K. (1996). Effects of moderate-intensity endurance and high-intensity intermittent training on anaerobic capacity and VO2max Med.Sci.Sports Exerc., 28, 1327-1330.
301. Takeshima, N., Tanaka, K., Kobayashi, F., Watanabe, T., and Kato, T. (1993). Effects of aerobic exercise conditioning at intensities corresponding to lactate threshold in the elderly Eur.J.Appl.Physiol Occup.Physiol, 67, 138-143.
302. Talanian, J. L., Galloway, S. D., Heigenhauser, G. J., Bonen, A., and Spriet, L. L. (2007). Two weeks of high-intensity aerobic interval training increases the capacity for fat oxidation during exercise in women J.Appl.Physiol, 102, 1439-1447.
303. Tanaka, H. (1986). Predicting running velocity at blood lactate threshold from running performance tests in adolescent boys Eur.J.Appl.Physiol Occup.Physiol, 55, 344-348.
304. Tanaka, K. and Matsuura, Y. (1984). Marathon performance, anaerobic threshold, and onset of blood lactate accumulation J.Appl.Physiol, 57, 640-643.
305. Tanchot, C. and Rocha, B. (1995). The peripheral T cell repertoire: independent homeostatic regulation of virgin and activated CD8+ T cell pools Eur.J.Immunol., 25, 2127-2136.
306. Task Force of the European Society of Cardiology and the NorthAmerican Society of Pacing and Electrophysiology (1996). Heart rate variability: standards of measurement, physiological interpretation and clinical use. Circulation, 93, 1043-1065.

231
307. Taylor, E. B., Lamb, J. D., Hurst, R. W., Chesser, D. G., Ellingson, W. J., Greenwood, L. J., Porter, B. B., Herway, S. T., and Winder, W. W. (2005). Endurance training increases skeletal muscle LKB1 and PGC-1alpha protein abundance: effects of time and intensity Am.J.Physiol Endocrinol.Metab, 289, E960-E968.
308. Terada, S., Kawanaka, K., Goto, M., Shimokawa, T., and Tabata, I. (2005). Effects of high-intensity intermittent swimming on PGC-1alpha protein expression in rat skeletal muscle Acta Physiol Scand., 184, 59-65.
309. Terry PC, Lane AM, and Fogarty GJ (2003). Construct validity of the POMS-A for use with adults Psychology of Sport and Exercise, 4, 125-139.
310. Thomas, S. G., Cunningham, D. A., Rechnitzer, P. A., Donner, A. P., and Howard, J. H. (1985). Determinants of the training response in elderly men Med.Sci.Sports Exerc., 17, 667-672.
311. Thomas, T. R., Adeniran, S. B., and Etheridge, G. L. (1984). Effects of different running programs on VO2 max, percent fat, and plasma lipids Can.J.Appl.Sport Sci., 9, 55-62.
312. Tjelta, L. I. and Enoksen, E (2010). Training Characteristics of Male Junior Cross Country and Track Runners on European Top Level International Journal of Sports Science & Coaching, 5, 193-203.
313. Ulmer, H. V. (1996). Concept of an extracellular regulation of muscular metabolic rate during heavy exercise in humans by psychophysiological feedback Experientia, 52, 416-420.
314. Urhausen, A., Gabriel, H. H., Weiler, B., and Kindermann, W. (1998). Ergometric and psychological findings during overtraining: a long-term follow-up study in endurance athletes Int.J.Sports Med., 19, 114-120.
315. Urhausen, A. and Kindermann, W. (2002). Diagnosis of overtraining: what tools do we have? Sports Med., 32, 95-102.
316. Uusitalo, A. L., Tahvanainen, K. U., Uusitalo, A. J., and Rusko, H. K. (1996). Non-invasive evaluation of sympathovagal balance in athletes by time and frequency domain analyses of heart rate and blood pressure variability Clin.Physiol, 16, 575-588.
317. Uusitalo, A. L., Uusitalo, A. J., and Rusko, H. K. (2000). Heart rate and blood pressure variability during heavy training and overtraining in the female athlete Int.J.Sports Med., 21, 45-53.
318. Valenzuela, H. F. and Effros, R. B. (2002). Divergent telomerase and CD28 expression patterns in human CD4 and CD8 T cells following repeated encounters with the same antigenic stimulus Clin.Immunol., 105, 117-125.
319. van, Baarle D., Tsegaye, A., Miedema, F., and Akbar, A. (2005). Significance of senescence for virus-specific memory T cell responses: rapid ageing during chronic stimulation of the immune system Immunol.Lett., 97, 19-29.
320. Verde, T. J., Thomas, S. G., Moore, R. W., Shek, P., and Shephard, R. J. (1992). Immune responses and increased training of the elite athlete J.Appl.Physiol, 73, 1494-1499.

232
321. Vollaard, N. B., Constantin-Teodosiu, D., Fredriksson, K., Rooyackers, O., Jansson, E., Greenhaff, P. L., Timmons, J. A., and Sundberg, C. J. (2009). Systematic analysis of adaptations in aerobic capacity and submaximal energy metabolism provides a unique insight into determinants of human aerobic performance J.Appl.Physiol, 106, 1479-1486.
322. Vollaard, N. B., Shearman, J. P., and Cooper, C. E. (2005). Exercise-induced oxidative stress: myths, realities and physiological relevance Sports Med., 35, 1045-1062.
323. Von, Zglinicki T. (2002). Oxidative stress shortens telomeres Trends Biochem.Sci., 27, 339-344.
324. von, Zglinicki T., Pilger, R., and Sitte, N. (2000). Accumulation of single-strand breaks is the major cause of telomere shortening in human fibroblasts Free Radic.Biol.Med., 28, 64-74.
325. Walsh, N. P., Gleeson, M., Shephard, R. J., Gleeson, M., Woods, J. A., Bishop, N. C., Fleshner, M., Green, C., Pedersen, B. K., Hoffman-Goetz, L., Rogers, C. J., Northoff, H., Abbasi, A., and Simon, P. (2011). Position statement. Part one: Immune function and exercise Exerc.Immunol.Rev., 17, 6-63.
326. Wang, E (1995). Senescent human fibroblasts resist programmed cell death, and failure to suppress bcl2 Is involved. Cancer Res, 55, 2284-2297.
327. Weltman, A., Snead, D., Stein, P., Seip, R., Schurrer, R., Rutt, R., and Weltman, J. (1990). Reliability and validity of a continuous incremental treadmill protocol for the determination of lactate threshold, fixed blood lactate concentrations, and VO2max Int.J.Sports Med., 11, 26-32.
328. Weng, N. P., Palmer, L. D., Levine, B. L., Lane, H. C., June, C. H., and Hodes, R. J. (1997). Tales of tails: regulation of telomere length and telomerase activity during lymphocyte development, differentiation, activation, and aging Immunol.Rev., 160, 43-54.
329. Wenger, H. A. and Bell, G. J. (1986). The interactions of intensity, frequency and duration of exercise training in altering cardiorespiratory fitness Sports Med., 3, 346-356.
330. Wenger, H. A. and Macnab, R. B. (1975). Endurance training: the effects of intensity, total work, duration and initial fitness J.Sports Med.Phys.Fitness, 15, 199-211.
331. Westgarth-Taylor, C., Hawley, J. A., Rickard, S., Myburgh, K. H., Noakes, T. D., and Dennis, S. C. (1997). Metabolic and performance adaptations to interval training in endurance-trained cyclists Eur.J.Appl.Physiol Occup.Physiol, 75, 298-304.
332. Weston, A. R., Myburgh, K. H., Lindsay, F. H., Dennis, S. C., Noakes, T. D., and Hawley, J. A. (1997). Skeletal muscle buffering capacity and endurance performance after high-intensity interval training by well-trained cyclists Eur.J.Appl.Physiol Occup.Physiol, 75, 7-13.
333. Wikby, A., Johansson, B., Olsson, J., Lofgren, S., Nilsson, B. O., and Ferguson, F. (2002). Expansions of peripheral blood CD8 T-lymphocyte subpopulations and an association with cytomegalovirus seropositivity in the elderly: the Swedish NONA immune study Exp.Gerontol., 37, 445-453.

233
334. Wilson, M. C., Jackson, V. N., Heddle, C., Price, N. T., Pilegaard, H., Juel, C., Bonen, A., Montgomery, I., Hutter, O. F., and Halestrap, A. P. (1998). Lactic acid efflux from white skeletal muscle is catalyzed by the monocarboxylate transporter isoform MCT3 J.Biol.Chem., 273, 15920-15926.
335. Winsley, R. J., Battersby, G. L., and Cockle, H. C. (2005). Heart rate variability assessment of overreaching in active and sedentary females Int.J.Sports Med., 26, 768-773.
336. Wisloff, U., Ellingsen, O., and Kemi, O. J. (2009). High-intensity interval training to maximize cardiac benefits of exercise training? Exerc.Sport Sci.Rev., 37, 139-146.
337. Wisloff, U., Loennechen, J. P., Falck, G., Beisvag, V., Currie, S., Smith, G., and Ellingsen, O. (2001). Increased contractility and calcium sensitivity in cardiac myocytes isolated from endurance trained rats Cardiovasc.Res., 50, 495-508.
338. Wojaszewski, J. F. P., Hansen, B. F., Gade, J., Kiens, B., Markuns, J. F., Goodyear, L.J., and Richter, E. A. (2000). Insulin signaling and insulin sensitivity after exercise in human skeletal muscle. Diabetes 49, 325–331.
339. Xu, F. and Rhodes, E. C. (1999). Oxygen uptake kinetics during exercise Sports Med., 27, 313-327.
340. Yamamoto, Y., Hughson, R. L., and Peterson, J. C. (1991). Autonomic control of heart rate during exercise studied by heart rate variability spectral analysis J.Appl.Physiol, 71, 1136-1142.
341. Yeo, W. K., Paton, C. D., Garnham, A. P., Burke, L. M., Carey, A. L., and Hawley, J. A. (2008). Skeletal muscle adaptation and performance responses to once a day versus twice every second day endurance training regimens J.Appl.Physiol, 105, 1462-1470.
342. Yoshida, T., Suda, Y., and Takeuchi, N. (1982). Endurance training regimen based upon arterial blood lactate: effects on anaerobic threshold Eur.J.Appl.Physiol Occup.Physiol, 49, 223-230.
343. Zapico, A. G., Calderon, F. J., Benito, P. J., Gonzalez, C. B., Parisi, A., Pigozzi, F., and Di, Salvo, V (2007). Evolution of physiological and haematological parameters with training load in elite male road cyclists: a longitudinal study J.Sports Med.Phys.Fitness, 47, 191-196.