training supporting mentoring - cuc mentoring training supporting ... island is grand cayman with an...
TRANSCRIPT

Sharing
Mentoring
Training Supporting

Caribbean Utilities Company, Ltd.
2016 Third Quarter Report l September 30, 2016 2
General Data About the Company Caribbean Utilities Company, Ltd., known locally as “CUC”, commenced operations as the only electric utility in Grand Cayman on May 10, 1966. The Company currently has an installed generating capacity of 161 megawatts (“MW”). The record peak load of 103.4 MW was experienced on July 8, 2016. CUC is committed to providing a safe and reliable supply of electricity to over 28,000 customers. The Company has been through many challenging and exciting periods but has kept pace with Grand Cayman’s development for the past 50 years. About the Cayman Islands The Cayman Islands, a United Kingdom Overseas Territory with a population of approximately 54,000, are comprised of three islands: Grand Cayman, Cayman Brac and Little Cayman. Located approximately 150 miles south of Cuba, 460 miles south of Miami and 167 miles northwest of Jamaica, the largest island is Grand Cayman with an area of 76 square miles. A Governor, presently Her Excellency Mrs. Helen Kilpatrick, is appointed by her Majesty the Queen. A democratic society, the Cayman Islands have a Legislative Assembly comprised of representatives elected from each of Grand Cayman’s five districts as well as representatives from the Sister Islands of Cayman Brac and Little Cayman. All dollar amounts in this Quarterly Report are stated in United States dollars unless otherwise indicated. Readers should review the note in the Management Discussion and Analysis section, concerning the use of forward-looking statements, which applies to the entirety of this Quarterly Report.

Caribbean Utilities Company, Ltd.
2016 Third Quarter Report l September 30, 2016 3
Table of Contents: Letter to our Fellow Shareholders 4 Interim Management’s Discussion and Analysis 7 Interim Consolidated Financial Statements: Consolidated Balance Sheets 38 Consolidated Statements of Earnings 39 Consolidated Statements of Comprehensive Income 40 Consolidated Statements of Shareholders’ Equity 41 Consolidated Statements of Cash Flows 42 Notes to Interim Consolidated Financial Statements 43 Shareholder Information 59

Caribbean Utilities Company, Ltd.
2016 Third Quarter Report l September 30, 2016 4
Fellow Shareholders, For the three months ended September 30, 2016, Caribbean Utilities Company, Ltd. (“CUC” or “the Company”) continued its focus on providing a safe and reliable electricity service to its customers, improving efficiencies and controlling costs across the organization. Net earnings for the three months ended September 30, 2016 (“Third Quarter 2016”) totalled $7.4 million, a decrease of $0.5 million when compared to net earnings of $7.9 million for the three months ended September 30, 2015 (“Third Quarter 2015”). This decrease was due mainly to higher depreciation and finance charges. The higher depreciation and finance charges are as anticipated by the Company and are driven by the completion of the 39.7 megawatts (“MW”) Generation Project in June 2016. These items were partially offset by higher electricity sales revenues. After the adjustment for dividends on the preference shares of the Company, earnings on Class A Ordinary Shares for the Third Quarter 2016 were $7.3 million, or $0.22 per Class A Ordinary Share, compared to earnings on Class A Ordinary Shares of $7.8 million or $0.25 per Class A Ordinary Share for the Third Quarter 2015. Net earnings for the nine months ended September 30, 2016 totaled $19.8 million, an increase of $3.1 million when compared to net earnings of $16.7 million for the nine months ended September 30, 2015. This increase was due mainly to higher electricity sales and lower finance charges. These items were partially offset by higher depreciation costs. After the adjustment for dividends on the preference shares of the Company, earnings on Class A Ordinary Shares for the nine months ended September 30, 2016 were $19.5 million, or $0.60 per Class A Ordinary Share, compared to earnings on Class A Ordinary Shares of $16.4 million or $0.53 per Class A Ordinary Share for the nine months ended September 30, 2015. Sales for the Third Quarter 2016 totalled 165.4 million kilowatt-hours (“kWh”), an increase of 5.0 million kWh in comparison to 160.4 million kWh for the Third Quarter 2015 driven primarily by higher overall customer numbers. Sales for the nine months ended September 30, 2016 totaled 457.2 million kWh, an increase of 21.8 million kWh in comparison to 435.4 million kWh for the nine months ended September 30, 2015. Sales for the nine months ended September 30, 2016 were positively impacted by large commercial development and higher overall customer numbers when compared to the same period last year. The total number of customers as at September 30, 2016 were 28,498, an increase of 463 customers, or 2%, compared to 28,035 customers as at September 30, 2015. The Company’s average price per Imperial Gallon (“IG”) of fuel for the Third Quarter 2016 decreased 21% to $2.31, compared to $2.93 for the Third Quarter 2015. The Company’s average price per IG of lubricating oil for the nine months ended September 30, 2016 decreased to $10.69 when compared to $11.21 for the nine months ended September 30, 2015. Net generation was 177.3 million kWh for the Third Quarter 2016, a 3% increase when compared to 171.9 million kWh for the Third Quarter 2015. Net fuel efficiency for the Third

Caribbean Utilities Company, Ltd.
2016 Third Quarter Report l September 30, 2016 5
Quarter 2016 of 19.51 kWh per IG increased when compared to net fuel efficiency for the Third Quarter 2015 of 18.53 kWh per IG. Net generation was 490.0 million kWh for the nine months ended September 30, 2016 compared to 466.7 million kWh for the nine months ended September 30, 2015. Net fuel efficiency for the nine months ended September 30, 2016 of 18.83 kWh per IG increased when compared to net fuel efficiency for the nine months ended September 30, 2015 of 18.19 kWh per IG. This increase in net fuel efficiency is due primarily to the new generating units in 2016 and the discontinuation of use of temporary mobile generation. During the Third Quarter 2016, the Company completed and successfully integrated the 40 MW plant, in time to serve a record system demand of 103.4 MW experienced in July. Work continues on the 5 MW Solar Project at Bodden Town. CUC has substantially completed the interconnection facilities for the project including a new 13 Kilovolts (kV) line. However, the developer, Entropy Cayman Solar Limited has advised that they are behind schedule. The new timeframe for the completion of this project has been set for the Second Quarter 2017. During the Third Quarter 2016 the Company launched the Integrated Resource Plan (IRP) study. The study analyses all energy resources that are viable and considers their cost, reliability, environmental impact and other aspects and provides a recommended portfolio of energy resources for the market. The Company’s goal is to ensure that all energy options are explored before decisions are made on what the grid can accommodate in a safe, reliable and efficient manner. This study is being performed by strategy planning consulting company Pace Global and is expected to be completed by First Quarter 2017. The IRP will give shape to the energy generation plans for Grand Cayman over the next 30 years. The Advanced Metering Infrastructure (“AMI”) project is now 95% completed. The full roll-out of this project should be completed by the end of 2016. The Smart Meters provide real-time consumption information and brings efficiencies to meter reading as well as other services. The AMI project will offer a pay-as-you- go payment option which will help customers to monitor and control their electricity consumption. The Cayman Islands Government recently passed legislation to facilitate the reform of the regulatory arrangements in the utilities sector. The objective is to establish a multi- sector regulator to be known as the Utility Regulation and Competition Office by merging the operations of the Information and Communications Authority (“ICTA”) and the Electricity Regulatory Authority (“ERA”), and expanding the role to regulate the provision of water and waste water services and to have responsibility for the fuels markets. These changes in legislation are not expected to materially affect CUC’s Licences or business. According to the Cayman Islands Government’s Economics and Statistics Office (“ESO”), economic activity in the Cayman Islands as measured by the Gross Domestic Product (“GDP”) is estimated to have grown by 2.4% in the first quarter of 2016. The domestic economy continued to strengthen as GDP growth accelerated from the 1.4% recorded in the first quarter of 2015. It stated that, overall, the recent performance means that the economy is on track to achieve the 2.1% forecast GDP growth for the year.

Caribbean Utilities Company, Ltd.
2016 Third Quarter Report l September 30, 2016 6
The tourist arrival statistics for the Third Quarter 2016 indicate that air arrivals increased by 5% and cruise arrivals increased by 2% when compared to the same period last year. For the nine months ended September 30, 2016 air arrivals and cruise arrivals increased by 0.3% and 6% respectively when compared to the same period last year. The tourism industry is expected to be positively impacted by the expansion of the Owen Roberts International Airport in Grand Cayman. This project is scheduled to be completed by 2018. The new design expands the current facility and will feature a larger terminal which will accommodate the projected growth in air arrivals. Work on the 265-room Kimpton Seafire Resort & Spa, is expected to be completed in November 2016. As a result of these two large commercial development projects, additional employment opportunities and an increase in stay-over tourism are expected to occur. The Company remains ready to participate in the development of Grand Cayman as the economy strengthens and will continue to deliver a cost-effective, safe and reliable service to its customers while managing costs and improving efficiencies.
J.F. Richard Hew President & Chief Executive Officer November 4, 2016

Caribbean Utilities Company, Ltd.
2016 Third Quarter Report l September 30, 2016 7
Interim Management’s Discussion and Analysis The following management’s discussion and analysis (“MD&A”) should be read in conjunction with the Caribbean Utilities Company, Ltd. (“CUC” or “the Company”) consolidated financial statements for the twelve months ended December 31, 2015 (“Fiscal 2015”). The material has been prepared in accordance with National Instrument 51-102 - Continuous Disclosure Obligations (“NI 51-102”) relating to Management’s Discussion and Analysis. Additional information in this MD&A has been prepared in accordance with accounting principles generally accepted in the United States (“US GAAP”), including certain accounting practices unique to rate-regulated entities. These accounting practices, which are disclosed in the notes to the Company’s 2015 annual financial statements, result in regulatory assets and liabilities which would not occur in the absence of rate regulation. In the absence of rate regulation, the amount and timing of recovery or refund by the Company of costs of providing services, including a fair return on rate base assets, from customers through appropriate billing rates would not be subject to regulatory approval. Certain statements in this MD&A, other than statements of historical fact, are forward-looking statements concerning anticipated future events, results, circumstances, performance or expectations with respect to the Company and its operations, including its strategy and financial performance and condition. Forward looking statements include statements that are predictive in nature, depend upon future events or conditions, or include words such as “expects”, “anticipates”, “plan”, “believes”, “estimates”, “intends”, “targets”, “projects”, “forecasts”, “schedule”, or negative versions thereof and other similar expressions, or future or conditional verbs such as “may”, “will”, “should”, “would” and “could”. Forward-looking statements are based on underlying assumptions and management’s beliefs, estimates and opinions, and are subject to inherent risks and uncertainties surrounding future expectations generally that may cause actual results to vary from plans, targets and estimates. Some of the important risks and uncertainties that could affect forward looking statements are described in the MD&A in the sections labelled “Business Risks”, “Capital Resources” and “Corporate and Regulatory Overview” and include but are not limited to operational, general economic, market and business conditions, regulatory developments and weather. CUC cautions readers that actual results may vary significantly from those expected should certain risks or uncertainties materialize, or should underlying assumptions prove incorrect. Forward-looking statements are provided for the purpose of providing information about management’s current expectations and plans relating to the future. Readers are cautioned that such information may not be appropriate for other purposes. The Company disclaims any intention or obligation to update or revise any forward-looking statements, whether as a result of new information, future events or otherwise except as required by law. Financial information is presented in United States dollars unless otherwise specified. The consolidated financial statements and MD&A in this interim report were approved by the Audit Committee. November 4, 2016

Caribbean Utilities Company, Ltd.
2016 Third Quarter Report l September 30, 2016 8
Financial and Operational Highlights
($ thousands, except basic earnings per ordinary share, dividends paid per ordinary share and where otherwise indicated)
Three Months
Ended September
30, 2016
Three Months
Ended September
30, 2015
Nine Months
Ended September
30, 2016
Nine Months
Ended September
30, 2015
Nine Months Change
Nine Months
% Change
Electricity Sales Revenues 21,778 21,131 60,387 57,357 3,030 5% Fuel Factor Revenues 21,095 29,111 60,134 85,641 (25,507) -30% Operating Revenues 42,873 50,242 120,521 142,998 (22,477) -16% Fuel and Lube Costs 21,095 29,111 60,134 85,641 (25,507) -30% Other Operating Expenses 13,393 12,732 39,682 38,079 1,603 4% Total Operating Expenses 34,478 41,843 99,819 123,720 (23,901) -19% Earnings for the Period 7,371 7,893 19,846 16,689 3,157 19% Cash Flow from Operating Activities 18,322 19,468 48,131
43,633 4,498 10% Per Class A Ordinary Share: Basic Earnings 0.22 0.25 0.60 0.53 0.07 13% Dividends Paid 0.170 0.165 0.505 0.495 0.010 2% Total Customers 28,498 28,035 28,498 28,035 463 2% Total Employees* 206 204 206 204 2 1% Customer per Employee (#) 138 137 138 137 1 1% System Availability (%) 99.96 99.97 99.92 99.93 (0.01) 0% Peak Load Gross (MW) 103.4 100.7 103.4 100.7 2.7 3% Millions of kWh: Net Generation 177.3 171.9 490.0 466.7 23.3 5% Kilowatt-Hour Sales 165.4 160.4 457.2 435.4 21.8 5% Sales per employee 0.80 0.79 2.22 2.13 0.09 4% *Total full time employees
Corporate and Regulatory Overview The principal activity of the Company is to generate, transmit and distribute electricity in its licence area of Grand Cayman, Cayman Islands pursuant to a 20-year exclusive Transmission & Distribution (“T&D”) Licence and a 25 year non-exclusive Generation Licence (“the Licences”) granted by the Cayman Islands Government (“Government”), which expire in April 2028 and November 2039, respectively. The Licences contain the provision for a rate cap and adjustment mechanism (“RCAM”) based on published consumer price indices. CUC’s return on rate base (“RORB”) for 2015 was 7.4% (2014: 7.4%). CUC’s RORB for 2016 is targeted in the 6.75% to 8.75% range (2015: 7.25% to 9.25%). CUC’s base rates are designed to recover all non-fuel and non-regulatory costs and include per kilowatt-hour (“kWh”) electricity charges and fixed facilities charges. Fuel cost charges and regulatory fees are billed as separate line items. Base rates are subject to an annual review and adjustment each June through the RCAM. In June 2016, following review and

Caribbean Utilities Company, Ltd.
2016 Third Quarter Report l September 30, 2016 9
approval by the Electricity Regulatory Authority (“ERA”), the Company increased its base rates by 0.1%. This increase is a result of the 2015 RORB and the increase in the applicable United States (“US”) and Cayman Islands consumer price indices, adjusted to exclude food and fuel, for calendar year 2015. The change in the base rates as a percentage of the US and Cayman Islands consumer price indices was 80% based on the range of the RORB values. The required rate adjustment of 0.1% can be calculated by applying 80% to the total price level index (60% of the Cayman Islands CPI and 40% of the US CPI) of 0.12%. All fuel and lubricating oil costs are passed through to customers without mark-up as a per kWh charge. Rate base is the value of capital upon which the Company is permitted an opportunity to earn a return. The value of this capital is the average of the beginning and ending values for the applicable financial year of: fixed assets less accumulated depreciation, plus the allowance for working capital, plus regulatory assets less regulatory liabilities. The ERA has the overall responsibility for regulating the electricity industry in the Cayman Islands in accordance with the ERA Law. The ERA oversees all licencees, establishes and enforces licence standards, enforces applicable environmental and performance standards, reviews the proposed RCAM, and sets the rate adjustment factors as appropriate. In December 2015 the ERA approved CUC’s 2016-2020 Capital Investment Plan in the amount of $204 million. Costs related to the competitive bid award to install 39.7 megawatts (“MW”) of generation capacity are included in the approved CIP in the amount of CUC’s competitive bid. As a result of CUC’s successful bid, the Company entered into a design-build contract agreement for the generation project with the consortium of Burmeister & Wain Scandinavian Contractor A/S (“BWSC”) of Denmark and MAN Diesel & Turbo SE (“MAN”) of Germany. The agreement covers the purchase and turnkey installation of a new 39.7 MW power plant which is comprised of two 18.5 MW V48/60 medium-speed diesel generating units, one 2.7 MW waste heat recovery steam turbine, and associated auxiliary equipment. This contract with variation orders is now valued at approximately $56.1 million, previously $55.4 million. On this contract a total of $11.1 million was spent in 2014, an additional $38.8 million was spent during the year ended December 31, 2015, an additional $5.5 million was spent during the nine months ended September 30, 2016 and the remaining amount of $0.7 million is expected to be spent during the last three months of 2016. The total project cost was estimated at $85 million and the actual overall cost is expected to amount to $79.0 million. A total of $11.6 million was spent in 2014, an additional $47.9 million was spent on the project during the year ended December 31, 2015 and $18.5 million was spent during the nine months ended September 30, 2016 and the remaining amount of $1.0 million is expected to be spent during 2016. This positive variance in actual cost compared to the bid is due primarily to a favourable exchange rate on the EURO portion of the MAN/BWSC contract and a shortened construction period resulting in lower financing costs. The project was completed in eighteen months, compared to an original estimated construction period of twenty-four months. The generating units are housed in a new purpose built power house at the Company’s North Sound Road Power Plant. The units were commissioned in May and June 2016.

Caribbean Utilities Company, Ltd.
2016 Third Quarter Report l September 30, 2016 10
As of June 2015, CUC secured the supply of 10 MW of temporary mobile generation capacity following the retirement of 17.5 MW of generation in early 2014 in accordance with the Generation Licence. This retirement relates to units 14 and 16 which exhausted their useful lives in accordance with the Company’s Generation Licence. This temporary generation had ensured the continuity of supply until the installation of the firm capacity. CUC understands that reliability of service is critical to Grand Cayman’s continued growth and development. The Company continues to focus on maintaining and improving the level of service we offer to our customers. The temporary generating units were returned in June 2016. A licence fee of 1%, payable to the Government, is charged on gross revenues, then prorated and applied only to customer billings with consumption over 1,000 kilowatt-hours (“kWh”) per month as a pass-through charge. In addition to the licence fee, a regulatory fee of ½ of 1% is charged on gross revenues, then prorated and applied only to customer billings with consumption over 1,000 kWh per month. In the event of a natural disaster as defined in the T&D Licence, the actual increase in base rates will be capped for the year at 60% of the change in the Price Level Index and the difference between the calculated rate increase and the actual increase expressed as a percentage, shall be carried over and applied in addition to the normal RCAM adjustment in either of the two following years if the Company’s RORB is below the target range. In the event of a disaster the Company would also write-off destroyed assets over the remaining life of the asset that existed at time of destruction. Z Factor rate changes will be required for insurance deductibles and other extraordinary expenses. The Z Factor is the amount, expressed in cents per kWh, approved by the ERA to recover the costs of items deemed to be outside of the constraints of the RCAM. Performance standards provide a balanced framework of potential penalties or rewards compared to historical performance in the areas of planning, reliability, operating and overall performance. Standards include “zones of acceptability” where no penalties or rewards would apply. CUC’s wholly owned subsidiary, DataLink, Ltd. (“DataLink”), was granted a licence in 2012 from the Information and Communications Technology Authority (“ICTA”) permitting DataLink to provide fibre optic infrastructure and other information and communication technology (“ICT”) services to the ICT industry. The term of the licence is 15 years and expires on March 27, 2027. CUC and DataLink have entered into three agreements: 1. The Management and Maintenance agreement; 2. The Pole Attachment agreement; and 3. The Fibre Optic agreement All three agreements have been approved by the ERA. The Cayman Islands Government recently passed legislation to facilitate the reform of the regulatory arrangements in the utilities sector. The objective is to establish a multi- sector regulator to be known as the Utility Regulation and Competition Office by merging the operations of the Information and Communications Authority (“ICTA”) and the Electricity Regulatory Authority (“ERA”), and expanding the role to regulate the provision of water and

Caribbean Utilities Company, Ltd.
2016 Third Quarter Report l September 30, 2016 11
waste water services and to have responsibility for the fuels markets. These changes in legislation are not expected to materially affect CUC’s or Datalink’s Licences. Consolidation Accounting Policy The consolidated financial statements include the accounts of the Company and its wholly owned subsidiary DataLink. All significant intercompany balances and transactions have been eliminated on consolidation. Sales Sales for the Third Quarter 2016 totalled 165.4 million kilowatt-hours (“kWh’), an increase of 5 million kWh in comparison to 160.4 million kWh for the Third Quarter 2015 driven primarily by higher overall customer numbers. Sales for the nine months ended September 30, 2016 totalled 457.2 million kWh, an increase of 21.8 million kWh in comparison to 435.4 million kWh for the nine months ended September 30, 2015. Sales for the nine months ended September 30, 2016 were positively impacted by large commercial development and an increase in the number of customers when compared to the same period last year. The average monthly temperature for the first nine months of 2016 was 83.4 degrees Fahrenheit as compared to an average monthly temperature of 82.9 degrees for the first nine months of 2015. Warmer temperatures increase air conditioning load and can positively impact the Company’s sales. Total customers as at September 30, 2016 were 28,498, an increase of 463 customers, or 2%, compared to 28,035 customers as at September 30, 2015.
Customers (#) September 30, 2016 September 30, 2015 Change % Residential 24,241 23,874 1%Commercial 4,257 4,161 2%Total Customers 28,498 28,035 2% Sales (thousands kWh)
Three Months
Ended September
30, 2016
Three Months
Ended September
30, 2015
NineMonths
Ended September
30, 2016
NineMonths
Ended September
30, 2015
Change % Change
Residential 84,674 79,200 224,947 205,949 18,998 9% Commercial 79,032 79,534 227,096 224,424 2,672 1% Other (street lighting, etc.) 1,696 1,693 5,106 5,058 48 1%
Total Sales 165,402 160,427 457,149 435,431 21,718 5% Average Consumption per Customer
Three Months
Ended September
30, 2016
Three Months
Ended September
30, 2015
NineMonths
Ended September
30, 2016
NineMonths
Ended September
30, 2015
Change % Change
Residential 1,166 1,107 1,035 962 73 8% Commercial 61,790 60,770 59,330 58,014 1,316 2%

Caribbean Utilities Company, Ltd.
2016 Third Quarter Report l September 30, 2016 12
Earnings Net earnings for the three months ended September 30, 2016 (“Third Quarter 2016”) totalled $7.4 million, a decrease of $0.5 million when compared to net earnings of $7.9 million for the three months ended September 30, 2015 (“Third Quarter 2015”). This decrease was due mainly to higher depreciation and finance charges. The higher depreciation and finance charges are as anticipated by the Company and driven by the 39.7 megawatts (“MW”) Generation Project completed in June 2016. These items were partially offset by higher electricity sales revenues and other income. After the adjustment for dividends on the preference shares of the Company, earnings on Class A Ordinary Shares for the Third Quarter 2016 were $7.3 million, or $0.22 per Class A Ordinary Share, compared to earnings on Class A Ordinary Shares of $7.8 million or $0.25 per Class A Ordinary Share for the Third Quarter 2015. Net earnings for the nine months ended September 30, 2016 totalled $19.8 million, an increase of $3.1 million when compared to net earnings of $16.7 million for the nine months ended September 30, 2015. This increase was due mainly to higher electricity sales and lower finance charges. These items were partially offset by higher depreciation costs. After the adjustment for dividends on the preference shares of the Company, earnings on Class A Ordinary Shares for the nine months ended September 30, 2016 were $19.5 million, or $0.60 per Class A Ordinary Share, compared to earnings on Class A Ordinary Shares of $16.4 million or $0.53 per Class A Ordinary Share for the nine months ended September 30, 2015. Operating Revenues Total operating revenues were as follows:
Revenues ($ thousands)
Three Months
Ended September
30, 2016
Three Months
Ended September
30, 2015
Nine Months
Ended September 30, 2016
Nine Months
Ended September
30, 2015
Change % Change
Residential 10,969 10,252 29,239 26,711 2,528 9% Commercial 10,637 10,676 30,659 30,080 579 2% Other (street lighting, etc.) 172 203 489 566 (77) -14% Electricity Sales Revenues 21,778 21,131 60,387 57,357 3,030 5% Fuel Factor Revenues 21,095 29,111 60,134 85,641 (25,507) -30% Total Operating Revenues 42,873 50,242 120,521 142,998 (22,477) -16%

Caribbean Utilities Company, Ltd.
2016 Third Quarter Report l September 30, 2016 13
Operating revenues for the Third Quarter 2016 were $42.9 million, a decrease of $7.3 million from $50.2 million for the Third Quarter 2015. Operating revenues for the nine months ended September 30, 2016 were $120.5 million, a decrease of $22.5 million from $143.0 million for the nine months ended September 30, 2015. The decrease in operating revenues for the three and nine months ended September 30, 2016 was due to lower fuel factor revenues partially offset by higher electricity sales revenues. Other revenues (street lighting, etc.) for the Third Quarter 2016 totalled $0.2 million, comparable to Third Quarter 2015 of $0.2 million. Other revenues for the nine months ended September 30, 2016 totalled $0.5 million, a decrease of $0.1 million from $0.6 million for the nine months ended September 30, 2015. Lighting rates are not subject to the RCAM, but the Company can apply to the ERA for adjustment to the lighting rates on an as-needed basis by submitting appropriate cost justifications. Lighting rates were last adjusted in January 2015. Electricity sales revenues were $21.8 million for the Third Quarter 2016, an increase of $0.7 million from $21.1 million for the Third Quarter 2015. Electricity sales revenues for the Third Quarter 2016 increased when compared to electricity sales revenue for the Third Quarter 2015 due to a 3% increase in kWh sales and a 0.1% base rate increase effective June 1, 2016. Electricity sales revenues were $60.4 million for the nine months ended September 30, 2016, an increase of $3.0 million from $57.4 million for the nine months ended September 30, 2015. Electricity sales revenues for the nine months ended September 30, 2016 increased when compared to the same period last year due to a 5% increase in kWh sales, a 0.1% base rate increase effective June 1, 2016 and a 0.9% base rate increase effective June 1, 2015. Fuel factor revenues for the Third Quarter 2016 totalled $21.1 million, a decrease of $8.0 million, compared to fuel factor revenues of $29.1 million for the Third Quarter 2015. Fuel factor revenues for the Third Quarter 2016 decreased when compared to the Third Quarter 2015 due to a reduction in global oil prices and a reduction in custom duties levied on diesel fuel imports by the Government. The average Fuel Cost Charge rate billed to consumers for the Third Quarter 2016 was $0.13 per kWh, compared to the average Fuel Cost Charge rate of $0.19 per kWh for the Third Quarter 2015. CUC passes through all fuel costs to consumers on a two-month lag basis with no mark-up. Fuel factor revenues for the nine months ended September 30, 2016 totalled $60.1 million, a decrease of $25.5 million compared to fuel factor revenues of $85.6 million for the nine months ended September 30, 2015. Fuel factor revenues for the nine months ended September 30, 2016 decreased when compared to the nine month period ended September 30, 2015 due to a reduction in global oil prices and a reduction in custom duties levied on diesel fuel imports by the Government. The average Fuel Cost Charge rate billed to consumers for the nine months ended September 30, 2016 was $0.14 per kWh, compared to the average Fuel Cost Charge rate of $0.20 per kWh for the nine months ended September 30, 2015.

Caribbean Utilities Company, Ltd.
2016 Third Quarter Report l September 30, 2016 14
Operating Expenses Operating expenses were as follows:
Operating Expenses ($ thousands)
Three Months
Ended September
30, 2016
Three Months
Ended September
30, 2015
Nine Months
Ended September
30, 2016
Nine Months
Ended September
30, 2015
Change % Change
Power Generation Expenses 21,955 30,165 63,042 88,679 (25,637) -29% General and Administration 2,095 2,164 6,555 6,674 (119) -2% Consumer Service 487 606 1,839 2,007 (168) -8% Transmission and Distribution 912 698 2,533 2,130 403 19% Depreciation 7,319 6,480 20,917 19,368 1,549 8% Maintenance 1,559 1,609 4,480 4,495 (15) 0% Amortization of Intangible Assets 151 121 453 367 86 23% Total Operating Expenses 34,478 41,843 99,819 123,720 (23,901) -19% Operating expenses for the Third Quarter 2016 totalled $34.5 million, a $7.3 million decrease from $41.8 million for the Third Quarter 2015. This decrease was due primarily to lower power generation, maintenance and general and administration costs, partially offset by higher depreciation and transmission and distribution expenses for the Third Quarter 2016 when compared to the Third Quarter 2015. Operating expenses for the nine months ended September 30, 2016 totalled $99.8 million, a $23.9 million decrease from $123.7 million for the nine months ended September 30, 2015. This decrease was due primarily to lower power generation and general and administration costs, partially offset by higher depreciation and transmission and distribution expenses.
Power Generation Power generation costs for the Third Quarter 2016 decreased $8.2 million to $30.2 million for the Third Quarter 2016. This decrease is as a result of lower fuel costs. Power generation costs for the nine months ended September 30, 2016 decreased $25.7 million to $63.0 million when compared to $88.7 million for the nine months ended September 30, 2015. This decrease is as a result of lower fuel costs. Power generation expenses were as follows:
Power Generation ($ thousands)
Three Months
Ended September
30, 2016
Three Months
Ended September
30, 2015
Nine Months
Ended September
30, 2016
Nine Months
Ended September
30, 2015
Change % Change
Fuel costs (net of deferred fuel charges) 20,627 28,594 58,501
83,995 (25,494) -30% Lubricating Oil costs (net of deferred lubricating oil charges) 468 517 1,636
1,646 (10) -1% Temporary generation costs 2 241 364
550 (186) -34% Other generation expenses 858 813 2,541 2,488 53 2% Total power generation expenses 21,955
30,165 63,042 88,679 (25,637) -29%

Caribbean Utilities Company, Ltd.
2016 Third Quarter Report l September 30, 2016 15
The Company’s average price per IG of fuel for the Third Quarter 2016 decreased 21% to $2.31, compared to $2.93 for the Third Quarter 2015. Net generation was 177.3 million kWh for the Third Quarter 2016, a 3% increase when compared to 171.9 million kWh for the Third Quarter 2015. Net fuel efficiency for the Third Quarter 2016 of 19.51 kWh per IG increased when compared to net fuel efficiency for the Third Quarter 2015 of 18.53 kWh per IG. Net generation was 490.0 million kWh for the nine months ended September 30, 2016 compared to 466.7 million kWh for the nine months ended September 30, 2015. Net fuel efficiency for the nine months ended September 30, 2016 of 18.83 kWh per IG increased when compared to net fuel efficiency for the nine months ended September 30, 2015 of 18.19 kWh per IG. This increase in net fuel efficiency is due primarily to the new generating units installed in 2016 and the discontinuation of use of temporary mobile generation. The Company’s average price per IG of lubricating oil for the Third Quarter 2016 increased to $9.98 when compared to $8.99 for the Third Quarter 2015. The Company’s average price per IG of lubricating oil for the nine months ended September 30, 2016 decreased to $10.69 when compared to $11.21 for the nine months ended September 30, 2015. The Fuel Tracker Account (see Note 5 of the consolidated financial statements) is comprised of total diesel fuel and lubricating oil costs to be recovered from consumers. In March 2011 the ERA approved the Fuel Price Volatility Management Program. The objective of the program is to reduce the impact of volatility in the Fuel Cost Charge paid by the Company’s customers for the fuel that the Company must purchase in order to provide electric service. Contracts initiated in 2015 utilize call options and call spreads to promote transparency in pricing. The monthly hedging costs and returns are also included within the Fuel Tracker Account. CUC secured the supply of 10 MW of temporary mobile generation following the retirement of 17.5 MW of generation in early 2014 in accordance with the Generation Licence. Temporary generation expenses for the Third Quarter 2016 totalled $0.002 million when compared with temporary generation expenses for the Third Quarter 2015 of $0.2 million. Temporary generation expenses for the nine months ended September 30, 2016 totalled $0.4 million, a $0.2 million decrease when compared to $0.6 million for the nine months ended September 30, 2015. All temporary generating units had been returned to the supplier in June 2016. Other generation expenses for the Third Quarter 2016 totalled $0.9 million, a $0.1 million increase when compared to other generation expenses of $0.8 million for the Third Quarter 2015. Other generation expenses for the nine months ended September 30, 2016 totalled $2.5 million, comparable to other generation expenses of $2.5 million for the nine months ended September 30, 2015.

Caribbean Utilities Company, Ltd.
2016 Third Quarter Report l September 30, 2016 16
General and Administration (“G&A”) G&A expenses for the Third Quarter 2016 totalled $2.1 million, a decrease of $0.1 million when compared to the Third Quarter 2015 G&A expenses of $2.2 million. General Expenses Capitalised (“GEC”) totalled $1.1 million for the Third Quarter 2016, an increase of $0.1 million when compared to $1.0 million for the Third Quarter 2015. G&A expenses for the nine months ended September 30, 2016 totalled $6.6 million, a decrease of $0.1 million when compared to G&A expenses for the nine months ended September 30, 2015 of $6.7 million. This decrease is due mainly to the increase in GEC and property insurance partially offset by higher public relations expenses. GEC totalled $3.2 million for the nine months ended September 30, 2016, an increase of $0.1 million when compared to $3.1 million for the nine months ended September 30, 2015. Consumer Services (“CS”) CS expenses for the Third Quarter 2016 totalled $0.5 million, a $0.1 million decrease compared to $0.6 million for the Third Quarter 2015. CS expenses for the nine months ended September 30, 2016 totalled $1.8 million, a $0.2 million decrease compared to $2.0 million for the nine months ended September 30, 2015. In accordance with its AFDA policy, the Company maintains an accumulated provision for uncollectible customer accounts receivable that is estimated based on known accounts, historical experience and other currently available information, including the economic environment.
Trade and other accounts receivable ($ thousands) As at September
30, 2016 As at December
31, 2015 Current 7,796 8,414 Past due 31-60 days 267 1,018 Past due 61-90 days 476 240 Past due over 90 days 4,697 4,313 Total Accounts Receivable 13,236 13,985 Less: Allowance for doubtful accounts (2,212) (2,218) Less: Consumer Deposits (7,344) (6,823) Trade Receivables less allowance for doubtful accounts and consumer deposits 3,680 4,944 Trade receivables less allowance for doubtful accounts and consumer deposits as at September 30, 2016 totalled $3.7 million, a decrease of $1.2 million, or 24% when compared to $4.9 million as at December 31, 2015. This decrease was primarily related to a decrease in customer receivables and an increase in consumer deposits. Customer receivables decreased by $0.8 million due to the reduction in the fuel factor billed to consumers and improved efficiencies in the disconnection process resulting from the newly installed Advanced Metering Infrastructure (“AMI”) meters. At the end of September 2016, 95% of AMI installations were completed. Customers who have had the AMI meters installed are benefiting from the ability to monitor their consumption and manage their usage.

Caribbean Utilities Company, Ltd.
2016 Third Quarter Report l September 30, 2016 17
Transmission and Distribution (“T&D”) T&D expenses for the Third Quarter 2016 totalled $0.9 million, an increase of $0.2 million compared to T&D expenses for the Third Quarter 2015 of $0.7 million. T&D expenses for the Third Quarter 2016 increased in comparison to Third Quarter 2015 due to higher street light maintenance and general tree trimming projects. T&D expenses for the nine months ended September 30, 2016 totalled $2.5 million, an increase of $0.4 million compared to T&D expenses for the nine months ended September 30, 2015 of $2.1 million. T&D expenses for the nine months ended September 30, 2016 were impacted by higher street light maintenance, general tree trimming projects and training costs when compared to the nine months ended September 30, 2015. Depreciation of Property, Plant and Equipment (“PP&E”) Depreciation expenses for the Third Quarter 2016 totalled $7.3 million, an increase of $0.8 million, from $6.5 million for the Third Quarter 2015. Depreciation expenses for the nine months ended September 30, 2016 totalled $20.9 million, an increase of $1.5 million, from $19.4 million for the nine months ended September 30, 2015. The increase in depreciation expenses is due to capital projects completed in prior periods including the new generating units which came online in May and June 2016. Maintenance Maintenance expenses for the Third Quarter 2016 totalled $1.6 million, comparable to Third Quarter 2015 maintenance expenses of $1.6 million. Maintenance expenses for the nine months ended September 30, 2016 totalled $4.5 million, comparable to $4.5 million for the nine months ended September 30, 2015. Amortization Amortization of intangible assets for the Third Quarter 2016 totalled $0.2 million, an increase of $0.1 million when compared to Third Quarter 2015. Amortization of intangible assets for the nine months ended September 30, 2016 totalled $0.45 million, a 23% increase when compared to $0.37 million for the nine months ended September 30, 2015. The increase in amortization is attributable to software purchases made in prior periods. Amortization represents the monthly recognition of the expense associated with software purchases as well as other intangible assets such as the costs associated with the licence negotiations. The negotiations for the Company’s electricity licence concluded in 2008 and the costs associated with the negotiations are being amortized over 20 years on a straight-line basis. The negotiations associated with DataLink's ICT licence ceased in 2012 and these costs are being amortized over 15 years on a straight-line basis.

Caribbean Utilities Company, Ltd.
2016 Third Quarter Report l September 30, 2016 18
Other Income and Expenses Net Other Expenses for the Third Quarter 2016 totalled $1.0 million, an increase of $0.5 million from $0.5 million for the Third Quarter 2015. Net Other Expenses for the nine months ended September 30, 2016 totalled $0.9 million, a decrease of $1.7 million from $2.6 million for the nine months ended September 30, 2015. Other Income & Expenses ($ thousands)
Three Months Ended
September 30, 2016
Three Months Ended
September 30, 2015
Nine Months
Ended September
30, 2016
Nine Months
Ended September
30, 2015
Change % Change
Total interest costs (3,030)
(3,092) (9,137)
(9,536) 399 -4% AFUDC 831 1,448 4,477 3,388 1,089 32% Total finance charges (2,199) (1,644) (4,660) (6,148) 1,488 -24% Foreign exchange gain 293 401 840 1,043 (203) -19% Other income 882 737 2,964 2,516 448 18% Total Net Other Expense (1,024) (506) (856) (2,589) 1,733 -67% Finance charges for the Third Quarter 2016 totalled $2.2 million, a $0.6 million increase from $1.6 million for the Third Quarter 2015. This increase is as a result of lower Allowance for Funds Used During Construction (“AFUDC”) and lower interest on long-term debt, partially offset by higher interest costs on short term debt for the three month period ended September 30, 2016. Finance charges for the nine months ended September 30, 2016 totalled $4.7 million, a $1.4 million decrease from $6.1 million for the nine months ended September 30, 2015. This decrease is as a result of higher Allowance for Funds Used During Construction (“AFUDC”) and lower interest on long-term debt, partially offset by higher interest costs on short term debt for the nine month period ended September 30, 2016. Under the T&D Licence there is a provision for an AFUDC. This capitalisation of the Financing Cost is calculated by multiplying the Company’s Cost of Capital rate by the average work in progress for each month. The cost of capital rate for 2016 is 7.75% (2015:8.25%) as agreed with the ERA, in accordance with the T&D Licence, and will be reviewed annually. The AFUDC amount for the Third Quarter 2016 totalled $0.8 million, a decrease of $0.6 million from $1.4 million for the Third Quarter 2015. This decrease is due to the decrease in the work in progress assets driven primarily by the generation expansion project completed in June 2016. The AFUDC amount for the nine months ended September 30, 2016 totalled $4.5 million, an increase of $1.1 million from $3.4 million for the nine months ended September 30, 2015. This increase is due mainly to an increased work in progress value for nine months ended September 30, 2016 when compared to the nine months ended September 30, 2015, driven primarily by the generation expansion project.

Caribbean Utilities Company, Ltd.
2016 Third Quarter Report l September 30, 2016 19
Foreign exchange gains for the Third Quarter 2016 totalled $0.3 million, a $0.1 million decrease when compared to $0.4 million in the Third Quarter 2015. Foreign exchange gains for the nine months ended September 30, 2016 totalled $0.8 million, a $0.2 million decrease when compared to $1.0 million for the nine months ended September 30, 2015. Foreign exchange gains and losses are the result of monetary assets and liabilities denominated in foreign currencies that are translated into United States dollars at the exchange rate prevailing on the Balance Sheet date. Revenue and expense items denominated in foreign currencies are translated into United States dollars at the exchange rate prevailing on the transaction date. Other income is comprised of income from the third party customers of DataLink, income from pipeline operations, sale of meter sockets, sale of recyclable materials, performance rewards as part of the T&D Licence and other miscellaneous income. Performance standards as prescribed by the T&D Licence provide a balanced framework of potential penalties or rewards compared to historical performance in the areas of planning, reliability, operating and overall performance. Standards include “zones of acceptability” where no penalties or rewards would apply Other income totalled $0.9 million for the Third Quarter 2016, an increase of $0.2 million from $0.7 million for the Third Quarter 2015. Other income totalled $3.0 million for the nine months ended September 30, 2016, a $0.5 million increase when compared to other income of $2.5 million for the nine months ended September 30, 2015. This increase is due mainly to an increase in customer service fees. The Company’s new Customer Service Code (“CSC”) became effective on January 1, 2015. The CSC sets out the terms and conditions of the supply of electricity to the Company’s customers, as well as the standards for the level of service which CUC is required to provide to its customers. The new CSC also provides for an increase in various customer service fees such as reconnection fees and the introduction of late fees on outstanding customer receivables. Revenues from DataLink for the Third Quarter 2016 are recorded in Other Income in the amount of $0.3 million comparable to $0.2 million for the Third Quarter 2015. The Economy In August 2016, the Cayman Islands Government released the second quarter 2016 Consumer Price Index (“CPI”) Report. The average CPI for June 2016 decreased 0.8% from the average CPI in June 2015. In comparison to the quarter ending March 2016, CPI declined by 1.0%. Of the 12 divisions monitored in the CPI calculation, five divisions saw price declines in the second quarter of 2016 compared to the quarter ending March 2016: Restaurant & Hotels, Miscellaneous Good & Services, Food & Non-alcoholic Beverages and Housing & Utilities. The divisions with the largest increases were: Recreation and culture, Household Equipment and Clothing and Footwear. According to the First Quarter Economic Report from the Cayman Islands Economics and Statistics office (“ESO”) that was released in July 2016, overall economic activity in the Cayman Islands grew by an estimated 2.4% for the first three months of 2016. According to the report, transport, storage and communication led the growth, and growth rates were indicated for a number of other sectors including construction, real estate, renting and

Caribbean Utilities Company, Ltd.
2016 Third Quarter Report l September 30, 2016 20
business services comprised mainly of legal and accounting services, and utilities. The ESO is forecasting Annual GDP growth of 2.1% for 2016. The Company’s annual sales growth and resource requirements, including number of employees, have historically been heavily influenced by changes in the level of economic activity in the country as illustrated by the GDP. Financial services is one of the two main industries of the Cayman Islands. The table below itemises trends in some of the key financial areas: As at
September 30, 2016
As at December
2015
As at December
2014
As at December
2013
As at December
2012 Bank Licences 175 184 198 213 222 Mutual Funds 10,830 10,940 11,010 11,379 10,841 Mutual Fund Administrators 106 108 115 121 124 Registered Companies 102,369 98,838 99,459 95,530 93,612 Captive insurance companies 740 739 788 788 768 The tourism sector is the second main pillar of the Cayman Islands economy. The Cayman Islands tourism demographic is largely comprised of visitors from the United States of America (“US”). For 2015 76% of air arrivals to the country were citizens of the US. As such the US economy has a large impact on the economy of the Cayman Islands. Third Quarter 2016 air arrivals increased by 5% when compared to 2015 and cruise arrivals saw an increase of 2% when compared to the same period in 2015. Air arrivals have a direct impact on the Company’s sales growth as these visitors are stay-over visitors who occupy local accommodation services. Cruise arrivals have an indirect impact as they affect the opening hours of the establishments operating for that market. The tourism industry is expected to be positively impacted by the expansion of the Owen Roberts International Airport in Grand Cayman. The expansion is expected to be completed in 2018 and will accommodate the anticipated growth in air arrivals. The expanded airport will provide a vastly improved airlift service for Grand Cayman’s tourists. The new design expands the current facility and will feature a larger terminal which will accommodate the projected growth in air arrivals. In addition to the airport expansion, the tourism sector is expected to receive a boost by the completion of the Kimpton Seafire Resort and Spa. The luxury resort hotel will be completed in November 2016, and will host five restaurants and six beach front bungalows in addition to the 10 storey, 265 room ocean front complex. Both projects are expected to create additional employment opportunities and increase stay over tourism.

Caribbean Utilities Company, Ltd.
2016 Third Quarter Report l September 30, 2016 21
The following table presents statistics for tourist arrivals in the Cayman Islands for the three months ending September 30: Arrivals
2016 2015 2014 2013 2012 By Air 85,957 81,974 83,161 69,175 64,529 By Sea 306,931 302,116 313,598 193,421 256,299 Total 392,888 384,090 396,759 262,596 320,828
All data is sourced from the Cayman Islands Government, Cayman Islands Economics & Statistics Office, Cayman Islands Monetary Authority, Cayman Financial Review, Cayman Islands Department of Tourism and Health City websites; www.gov.ky www.ESO.ky www.cimoney.com.ky www.caymanfinancialreview.com www.caymanislands.ky www.healthcitycaymanislands.com. Liquidity The following table outlines the summary of the Company’s cash flows:
Cash Flows ($ thousands)
Three Months
Ended September
30, 2016
Three Months
Ended September
30, 2015
Nine Months
Ended September
30, 2016
Nine Months
Ended September
30, 2015
Change % Change
Beginning cash 9,345 35,128 1,365 21,815 (20,450) -94% Cash provided by/(used in): Operating activities 18,322 19,468 48,131 43,633 4,498 10% Investing activities (8,470) (32,104) (36,956) (53,388) 16,432 -31% Financing activities (4,321) (5,003) 2,336 5,429 (3,093) -57% Ending cash 14,876 17,489 14,876 17,489 (2,613) -15%
Operating Activities: Cash flow provided by operations, after working capital adjustments, for the Third Quarter 2016, was $18.3 million, a $1.2 million decrease when compared to $19.5 million for the Third Quarter 2015. This decrease is primarily attributable to the movement in regulatory deferrals in the Third Quarter 2016 when compared to the same period last year. Cash flow provided by operations, after working capital adjustments, for the nine months ended September 30, 2016 was $48.1 million, a $4.5 million increase when compared to $43.6 million for the nine months ended September 30, 2015. This increase is primarily attributable to higher earnings for the period partially offset by the movement in Regulatory deferrals for the nine month period ending September 30, 2016 when compared to the same period last year. Investing Activities: Cash used in investing activities for the Third Quarter 2016 totalled $8.5 million, a decrease of $23.6 million from $32.1 million for the Third Quarter 2015. This decrease is due mainly to lower expenditures related to property, plant and equipment for the Third Quarter 2016 when compared to the Third Quarter 2015.

Caribbean Utilities Company, Ltd.
2016 Third Quarter Report l September 30, 2016 22
Cash used in investing activities for the nine months ended September 30, 2016 totalled $37.0 million, a decrease of $16.4 million from $53.4 million for the Third Quarter 2015. This decrease is due mainly to lower expenditures related to property, plant and equipment. Financing Activities: Cash used in financing activities for the Third Quarter 2016 totalled $4.3 million, a decrease of $0.7 million compared to cash used in financing activities of $5.0 million for the Third Quarter 2015. This decrease in cash used in financing activities is primarily attributable to net proceeds from shares issued partially offset by increase in dividends paid to shareholders. Cash provided by financing activities for the nine months ended September 30, 2016 totalled $2.3 million, a decrease of $3.1 million compared to cash provided by financing activities of $5.4 million for the nine months ended September 30, 2015. This decrease in cash provided by financing activities is attributable to the issuance of Class A Ordinary Shares under the 2015 Rights Offering, partially offset by 2016 proceeds from short term borrowings of $30 million. Cash Flow Requirements: The Company expects that operating expenses and interest costs will generally be paid from the Company’s operating cash flows, with residual cash flows available for capital expenditures and dividend payments. Borrowings under credit facilities may be required from time to time to support seasonal working capital requirements. Cash flows required to complete planned capital expenditures are expected to be financed from a combination of proceeds from operating cash, debt and equity transactions. The Company expects to be able to source the cash required to fund its 2016 capital expenditure programme (see the “Business Risks” section of this MD&A for Liquidity Risk details). Transactions with Related Parties Miscellaneous receivables from Newfoundland Power, a subsidiary of Fortis Inc., totaling $10,526 were outstanding at September 30, 2016 (nil as at December 31, 2015). Miscellaneous payables to Fortis Turks & Caicos, a subsidiary of Fortis Inc., were nil at September 30, 2016 ($11,017 as at December 31, 2015 for travel expenses). Miscellaneous receivables from Fortis Ins. was $5,952 at September 30, 2016 (nil as at December 31, 2015) as a donation. Miscellaneous payables to Fortis Inc., the Company’s majority shareholder, was $173,981 at September 30, 2016 ($3,300 as at December 31, 2015) for travel expenses, hurricane preparedness, membership fees and insurance premiums. The Company rents office facilities from a related party, Adare Investments Ltd., on a 5 year lease agreement ending June 30, 2019; rent expenses totaled $61,049 for the nine months ended September 30, 2016.

Caribbean Utilities Company, Ltd.
2016 Third Quarter Report l September 30, 2016 23
Contractual Obligations The contractual obligations of the Company over the next five years and periods thereafter, as at September 30, 2016, are outlined in the following table: ($ millions) Total < 1 year 1 to 3
years 4 to 5 years
> 5 years Total debt 227.0 11.0 29.4 32.0 154.6 Long-term debt interest 93.9 11.3 20.3 16.7 45.6 MAN/BWSC Generation Expansion Contract 0.7 0.7 - - - Defined benefit pension 0.1 0.1 - - -
Total 321.7 23.1 49.7 48.7 200.2 1. Relates to principal payments on long-term debt only. 2. In December 2014, the Company entered into design-build contracts with BWSC and MAN. The contract is now valued at approximately $56.1 million, previously $55.4 million. A down payment of $11.1 million was made in 2014, an additional $38.8 million was spent during the year ended December 31, 2015 and additional $5.5 million was spent during the nine months ended September 30, 2016. 3. The defined benefit pension funding contribution is based on an estimate provided under the latest completed actuarial valuation. Power Purchase Obligation During 2015, the Company entered into a Power Purchase Agreement (“PPA”) with Entropy Cayman Solar Limited to purchase up to 2.1 MW per year of associated energy for a 25-year term. This 5 MW solar project is scheduled for completion by Second Quarter 2017 and will significantly reduce emissions into the atmosphere through the avoidance of diesel fuel consumption. The PPA will also provide renewable energy at a competitive initial price of $0.17 cents per kWh. The PPA was approved by the ERA during the Fourth Quarter 2015. The PPA qualifies for the Normal Purchase Normal Sale exemption under ASC 815 and does not qualify as a derivative. Fuel Purchase Obligation The Company has a primary fuel supply contract with RUBiS Cayman Islands Limited (“RUBiS”). Under the agreement the Company is committed to purchase approximately 60% of its diesel fuel requirements for its generating plant from RUBiS. The Company also has a secondary fuel supply contract with Sol Petroleum Cayman Limited (“Sol”) and is committed to purchase approximately 40% of the Company’s fuel requirements for its generating plant from Sol. Contracts with RUBiS and Sol were executed in September 2012. Both contracts expired on July 31, 2014 with the option to renew for two additional 18 month terms. The Company executed 18 month fuel supply contracts in September 2014 upon the expiration of its previous fuel supply contract with both RUBiS and Sol. The Company renewed its contract with RUBiS on September 1, 2016 for the final term which expires on August 31, 2017. The approximate remaining quantities per the fuel contract on an annual basis are, by fiscal year in millions of IGs: 2016 – 5.0 and 2017 – 13.4. The contract with Sol was renewed for the final term on March 1, 2016 which expires on August 31, 2017. The approximate remaining quantities per the fuel contract on an annual basis are, by fiscal year in millions of IGs: 2016 – 3.3 and 2017 – 8.9. Both contracts qualify for the Normal Purchase Normal Sale exemption under ASC 815 and do not qualify as derivatives. Financial Position The following table is a summary of significant changes to the Company’s balance sheet from December 31, 2015 to September 30, 2016:

Caribbean Utilities Company, Ltd.
2016 Third Quarter Report l September 30, 2016 24
Significant changes in Balance Sheets between December 31, 2015 and September 30, 2016
Increase (Decrease)
Explanation
($ millions) Cash and Cash Equivalents 13.5 Increase due to cash provided by operating activities of $48.1million and cash provided by financing activities of $2.3 million, partially offset by cash used in investing activities of $36.9 million. Positive cash flow from financing activities have been driven by short term borrowing of $30 million. Accounts Receivable (0.7) Lower billings due to decreased fuel costs and increased collection on 30-60 days accounts. Regulatory Assets (0.9) Decrease attributable to a reduction in fuel costs. Property, Plant and Equipment 16.0 Net increase is comprised of capital expenditures of (1) $36.7million (2) depreciation expense of $20.9 million (3) $1.2 million in accrued capital expenditure Accounts Payable and Accrued Expenses 4.9 Increase mainly attributable to increase in expenditure accruals, partially offset by decreased payables due to lower fuel costs. Long-Term Debt (7.9) Decrease due to principal payments made on the Company's Senior Unsecured Notes in the Second Quarter 2016 Share Premium 2.3 The Company issued 208,898 shares through its share purchase plans. Retained Earnings 3.1 Increase due to net earnings for the period of $19.8 million, partially offset by Class A dividends of $16.4 million and Class B dividends of $0.3 million. Capital Resources The Company’s principal activity of generation, transmission and distribution of electricity in Grand Cayman, requires CUC to have ongoing access to capital to build and maintain the electrical system for the community it serves. To help ensure access to capital, the Company targets a long-term capital structure of approximately 45% equity, including preference shares, and 55% debt. The Company’s objective is to maintain investment-grade credit ratings. The Company sets the amount of capital in proportion to risk. The debt to equity ratio is managed through various methods such as the recent rights offering and the Company’s Share Purchase Plans. Certain of the Company’s long-term debt obligations have covenants restricting the issuance of additional debt such that consolidated debt cannot exceed 60% of the Company’s consolidated capital structure, as defined by short-term and long-term debt agreements. As at September 30, 2016, the Company was in compliance with all debt covenants. The Company’s capital structure is presented in the following table:
Capital Structure September 30, 2016
($ millions)
% December 31, 2015
($ millions)
%
Total debt 255.7 54 238.0 53 Shareholder’s equity 220.1 46 214.4 47 Total 475.8 100 452.4 100

Caribbean Utilities Company, Ltd.
2016 Third Quarter Report l September 30, 2016 25
The change in the Company’s capital structure between December 31, 2015 and September 30, 2016 was driven by an increase in equity resulting from the issuance of Class A Ordinary Shares under its share purchase plans and an increase in Short-Term Debt. The Company’s credit ratings under Standard & Poors (“S&P”) and the Dominion Bond Rating System (“DBRS”) are as follows: S&P A-/Stable DBRS A (low) The S&P rating is in relation to long-term corporate credit and unsecured debt while the DBRS rating relates to senior unsecured debt. On October 14, 2016 announcement from Fortis Inc. of the closing of the $11.3 billion acquisition of ITC Holdings Corporation, a Michigan based Company that operates electricity transmission facilities in the United States, S&P affirmed the Company’s A- rating and revised its outlook on the Company from negative to stable. The stable outlook on CUC reflects the closing of the transaction consistent with S&P’s expectations including selling up to 19.9% of ITC to an infrastructure-focused minority investor. The A- rating reflects S&P’s positive view of the Company’s current position as the sole provider of generation services, and the Company’s licenced position as the sole provider of T&D services. The rating also reflects S&P’s positive view of regulatory support and stable cash flows offset by the economic uncertainty and the limited history of the regulator. In March 2016, DBRS affirmed the Company’s “A” credit rating while maintaining the categorisation of low with a Stable trend. Considerations for the rating were a supportive regulatory regime, solid credit metrics and a stable island economy and the demand for electricity. Impacting the rating were such factors as hurricane event risk and the small size of the Company’s customer base. Credit Facilities The Company currently has $50.0 million of unsecured credit financing facilities with the Scotiabank & Trust (Cayman) Limited (“Scotia”) and Royal Bank of Canada (“RBC”). The financing facilities are comprised of:
Credit Facilities ($ millions)Provided by Scotia: Letters of Credit $1.0Operating, Revolving Line of Credit $10.0 Catastrophe Standby Loan $7.5 Demand Loan Facility- Interim Funding of Capital Expenditures $31.0 Total $49.5 Provided by RBC: Corporate Credit Card Line $0.5Total $0.5 Of the total above, $19.0 million was available at September 30, 2016.

Caribbean Utilities Company, Ltd.
2016 Third Quarter Report l September 30, 2016 26
Capital Expenditures Capital expenditures for the three months ended September 30, 2016 were $8.4 million, a $23.5 million, or 74% decrease from $31.9 million in capital expenditures for the three months ended September 30, 2015. Capital expenditures for the nine months ended September 30, 2016 were $36.7 million, a $16.3 million, or 31% decrease from $53.0 million in capital expenditures for the nine months ended September 30, 2015. The capital expenditures for the nine months ended September 30, 2016 primarily relate to: Distribution system extension and upgrades - $6.4 million. 39.7 MW Generation Project - $18.5 million Generation Replacement Cost – $6.7 million. Facility Asset Replacement & Upgrades Structural & Mechanical- $1.1 million AFUDC of $4.5 million was capitalized in the nine months ended September 30, 2016
Capital expenditures
Three Months Ended September
30, 2016
Three Months Ended September
30, 2015
Nine months Ended September
30, 2016
Nine months Ended September
30, 2015 ($ Millions) Transmission 0.2 0.4 1.0 0.6 Distribution 2.0 1.9 10.2 7.8 Generation 5.5 29.1 23.8 43.2 Other 0.7 0.5 1.7 1.4 Total 8.4 31.9 36.7 53.0
Off Balance-Sheet Arrangements Disclosure is required of all off-balance sheet arrangements such as transactions, agreements or contractual arrangements with unconsolidated entities, structured finance entities, special purpose entities or variable interest entities that are reasonably likely to materially affect liquidity of or the availability of, or requirements for, capital resources. The Company has no such off-balance sheet arrangements as at September 30, 2016. Business Risks The following is a summary of the Company’s significant business risks:

Caribbean Utilities Company, Ltd.
2016 Third Quarter Report l September 30, 2016 27
Operational Risks Operational risks are those risks normally inherent in the operation of generating, transmission and distribution facilities. The Company’s facilities are subject to the risk of equipment failure due to deterioration of the asset from use or age, latent defects and design or operator error, among other things. These risks could lead to longer-than-forecast equipment downtimes for maintenance and repair, disruptions of power generation, customer service interruptions, and could result in injury to employees and the public. Accordingly, to ensure the continued performance of the physical assets, the Company determines expenditures that must be made to maintain and replace the assets. The Company continually develops capital expenditure, safety management and risk controls programmes and assesses current and future operating and maintenance expenses that will be incurred in the ongoing operation of its systems. The Company also has an insurance programme that provides coverage for business interruption, liability and property damage, although the coverage offered by this programme is limited (see the “Insurance” section for discussion of insurance terms and coverage). In the event of a large uninsurable loss, the Company would apply to the ERA for recovery of these costs through higher rates. However, there is no assurance that the ERA will approve any such application (see the “Regulation” section for discussion of regulatory risk). Economic Conditions The general economic condition of CUC’s service area, Grand Cayman, influences electricity sales as with most utility companies. Changes in consumer income, employment and housing are all factors in the amount of sales generated. As the Company supplies electricity to all hotels and large properties, its sales are therefore partially based on tourism and related industry fluctuations. Regulation The Company operates within a regulated environment. As such, the operations of the Company are subject to the normal uncertainties faced by regulated companies. Such uncertainties include approval by the ERA of billing rates that allow a reasonable opportunity to recover on a timely basis the estimated costs of providing services, including a fair return on rate base assets. The Company’s capital expenditure plan requires regulatory approval. There is no assurance that capital projects perceived as required by the management of the Company will be approved by the ERA. Weather CUC’s facilities are subject to the effects of severe weather conditions principally during the hurricane season months of June through November. Despite preparations for disasters such as hurricanes, adverse conditions will always remain a risk. In order to mitigate some of this risk, the Company maintains insurance coverage which Management believes is appropriate and consistent with insurance policies obtained by similar companies.

Caribbean Utilities Company, Ltd.
2016 Third Quarter Report l September 30, 2016 28
Environmental Matters CUC’s operations are subject to local environmental protection laws concerning emissions to the air, discharges to surface and subsurface waters, noise, land use activities, and the handling, storage, processing, use, and disposal of materials and waste products. CUC’s Environmental Management System (“EMS”) is registered to the ISO 14001 Environmental Standard. The Company was initially registered in 2004, pursuant to an audit by a third party of the Company’s EMS to ensure that the Company was meeting requirements put in place by the Government as well as self-imposed requirements. Under the ISO 14001 standard companies are required to establish, document, implement, maintain and continually improve their environmental performance with an aim of prevention of pollution. In order to maintain the Company’s registration to this standard an external surveillance audit is conducted annually, and an external audit is conducted every three years for re-certification. Internal audits of the system must also be conducted on an annual basis. CUC has most recently conducted, and passed its re-certification audit in March 2016. In May 2002, the United Kingdom (“UK”) ratified the Kyoto Protocol, which sets targets and timetables for the reduction of greenhouse gas (GHG) emissions, which was later extended to the Cayman Islands in March 2007. Under the Kyoto Protocol, the UK is legally bound to reduce its GHG emissions, but Cayman has no emissions reduction target. As an overseas territory, the Cayman Islands are required to give available national statistics on an annual basis to the UK which will be added to its inventory and reported to the United Nations Framework Convention on Climate Change (UNFCCC) Secretariat. Under the Convention governments are obligated to gather and report information on GHG emissions through the preparation of a national greenhouse gas inventory. The inventory primarily requires the Cayman Islands to quantify as best as possible the country’s fuel consumption across a variety of sectors, production processes and distribution means. CUC continues to supply the Department of Environment with data for Cayman’s GHG inventory. Through the EMS, CUC has determined that its exposure to environmental risks is not significant and does not have an impact on CUC’s financial reporting including the recording of any Asset Retirement Obligations (“ARO’s”). Insurance - Terms and Coverage The Company renewed its insurance policy as at July 1, 2016 for one year under similar terms and coverage as in prior years. Insurance terms and coverage include $100.0 million in property and machinery breakdown insurance and business interruption insurance per annum with a 24-month indemnity period and a waiting period on Non-Named Wind, Quake and Flood of 60-days. Any named Wind, Quake and Flood deductible has a 45-day waiting period. All T&D assets outside of 1,000 feet from the boundaries of the main power plant and substations are excluded, as the cost of such coverage is not considered economical. There is a single event cap of $100 million. Each “loss occurrence” is subject to a deductible of $1.0 million, except for windstorm (including hurricane) and earth movement for which the deductible is 2% of the value of each location that suffers loss, but subject to a minimum deductible of $1.0 million and maximum deductible of $4.0 million for all interests combined. In accordance with the T&D Licence, when an asset is impaired or disposed of within its original estimated useful life, the cost of the asset is reduced and the net book value is charged

Caribbean Utilities Company, Ltd.
2016 Third Quarter Report l September 30, 2016 29
to accumulated depreciation. This treatment is in accordance with rate regulated accounting and differs from the GAAP treatment of a loss being recognised on the statement of earnings. The amount charged to accumulated depreciation is net of any proceeds received in conjunction with the disposal of the asset. Insurance proceeds are included within the criteria. In addition to the coverage discussed above, the Company has also purchased an excess layer of an additional $100.0 million limit on property and business interruption (excluding windstorm, earth movement and flood). The Company’s insurance policy includes business interruption which covers losses resulting from the necessary interruption of business caused by direct physical loss or damage to CUC’s covered property and loss of revenues resulting from damage to customers’ property. Defined Benefit Pension Plan The Company maintains a defined benefit pension plan, which provides a specified monthly benefit on retirement irrespective of individual investment returns. The assumed long-term rate of return on pension plan assets for the purposes of estimating pension expense for 2016 is 5%. This compares to assumed long-term rates of return of 5% used during 2015. There is no assurance that the pension plan assets will be able to earn the assumed rate of returns. The pension plan assets decreased during 2016 by 0.1% (2015: gain of 2%). Market driven changes impacting the performance of the pension plan assets may result in material variations in actual return on pension plan assets from the assumed return on the assets causing material changes in consolidated pension expense and funding requirements. Net pension expense is impacted by, among other things, the amortization of experience and actuarial gains or losses and expected return on plan assets. Market driven changes impacting other pension assumptions, including the assumed discount rate, may also result in future consolidated contributions to pension plans that differ significantly from current estimates as well as causing material changes in consolidated pension expense. The discount rate assumed for 2016 is 4.5% compared to the discount rate assumed during 2015 of 4.0%. There is also measurement uncertainty associated with pension expense, future funding requirements, the accrued benefit asset, accrued benefit liability and benefit obligation due to measurement uncertainty inherent in the actuarial valuation process. A discussion of the critical accounting estimates associated with pensions is provided in the “Critical Accounting Estimates” section of this MD&A. Financial Instruments The Company is primarily exposed to credit risk, liquidity risk and interest rate risk as a result of holding financial instruments in the normal course of business. Financial instruments of the Company consist mainly of cash and cash equivalents, accounts receivable, accounts payable and accrued expenses, consumers’ deposits and advances for construction and long-term debt.

Caribbean Utilities Company, Ltd.
2016 Third Quarter Report l September 30, 2016 30
Credit Risk The Company is exposed to credit risk in the event of non-performance by counterparties to derivative financial instruments which include fuel option contracts. If a counterparty fails to perform on its contractual obligation to deliver payment when the market price of fuel is greater than the strike price, the Company may find it necessary to purchase diesel at the market price, which will be higher than the contract price. The Company manages this credit risk associated with counterparties by conducting business with high credit-quality institutions. The Company does not expect any counterparties to fail to meet their obligations. There is risk that the Company may not be able to collect all of its accounts receivable and other assets. This does not represent a significant concentration of risk. The requirements for security deposits for certain customers, which are advance cash collections from customers to guarantee payment of electricity billings, reduces the exposure to credit risk. The Company manages credit risk primarily by executing its credit collection policy, including the requirement for security deposits, through the resources of its customer service department. Liquidity Risk The Company’s financial position could be adversely affected if it failed to arrange sufficient and cost-effective financing to fund, among other things, capital expenditures and the repayment of maturing debt. The ability to arrange such financing is subject to numerous factors, including the results of operations and financial position of the Company, conditions in the capital and bank credit markets, ratings assigned by ratings agencies and general economic conditions. These factors are mitigated by the legal requirement under the Licences which requires rates be set to enable the Company to achieve and maintain a sound credit rating in the financial markets of the world. The Company has also secured committed credit facilities to support short-term financing of capital expenditures and seasonal working capital requirements. The cost of renewed and extended credit facilities could increase in the future; however, any increase in interest expense and fees is not expected to materially impact the Company’s consolidated financial results in 2016. Interest Rate Risk Long-term debt is issued at fixed interest rates, thereby minimizing cash flow and interest rate exposure. The Company is primarily exposed to risks associated with fluctuating interest rates on its short-term borrowings and other variable interest credit facilities. The current amount of short-term borrowings is $30 million (nil as at December 31, 2015). FUTURE ACCOUNTING POLICIES Revenue from Contracts with Customers ASU No. 2014-09 was issued in May 2014 and the amendments in this update create ASC Topic 606, Revenue from Contracts with Customers, and supersede the revenue recognition requirements in ASC Topic 605, Revenue Recognition, including most industry specific revenue recognition guidance throughout the codification. This standard completes a joint effort by FASB and the International Accounting Standards Board to improve financial

Caribbean Utilities Company, Ltd.
2016 Third Quarter Report l September 30, 2016 31
reporting by creating common revenue recognition guidance for US GAAP and International Financial Reporting Standards that clarifies the principles for recognizing revenue and that can be applied consistently across various transactions, industries and capital markets. This standard was originally effective for annual and interim periods beginning after December 15, 2016 and is to be applied on a full retrospective or modified retrospective basis. ASU No. 2015-14 was issued in August 2015 and the amendments in this update defer the effective date of ASU No. 2014-09 by one year to annual and interim periods beginning after December 15, 2017. Early adoption is permitted as of the original effective date. The majority of the Company’s revenue is generated from energy sales to customers based on published tariff rates, as approved by the respective regulators, and is considered to be in the scope of ASU No. 2014-09. The Company and its subsidiary, Datalink Ltd., are assessing the impact that the adoption of this standard will have on the consolidated financial statements and plans to have this assessment complete in 2016. Recognition and Measurement of Financial Assets and Financial Liabilities ASU No. 2016-01, Recognition and Measurement of Financial Assets and Financial Liabilities, was issued in January 2016 and the amendments in this update address certain aspects of recognition, measurement, presentation and disclosure of financial instruments. Most notably, the amendments require the following: (i) equity investments in unconsolidated entities (other than those accounted for using the equity method of accounting) to be measured at fair value through earnings; however, entities will be able to elect to record equity investments without readily determinable fair values at cost, less impairment, and plus or minus subsequent adjustments for observable price changes; and (ii) financial assets and financial liabilities to be presented separately in the notes to the consolidated financial statements, grouped by measurement category and form of financial asset. This update is effective for annual and interim periods beginning after December 15, 2017. Leases ASU No. 2016-02 was issued in February 2016 and the amendments in this update create ASC Topic 842, Leases, and supersede lease requirements in ASC Topic 840, Leases. The main provision of Topic 842 is the recognition of lease assets and lease liabilities on the balance sheet by lessees for those leases that were previously classified as operating leases. For operating leases, a lessee is required to do the following: (i) recognize a right-of-use asset and a lease liability, initially measured at the present value of the lease payments, on the balance sheet; (ii) recognize a single lease cost, calculated so that the cost of the lease is allocated over the lease term on a generally straight-line basis; and (iii) classify all cash payments within operating activities in the statement of cash flows. These amendments also require qualitative disclosures along with specific quantitative disclosures. This update is effective for annual and interim periods beginning after December 15, 2018 and is to be applied using a modified retrospective approach with practical expedients options. Early adoption is permitted. The Company is assessing the impact that the adoption of this update will have on its consolidated financial statements and related disclosures. Improvements to Employee Share-Based Payment Accounting ASU No. 2016-09, Improvements to Employee Share-Based Payment Accounting, was issued in March 2016 as part of FASB’s simplification initiative. The areas for simplification in this update involve several aspects of accounting for share-based payment transactions, including income tax consequences, classification of awards as either equity or liabilities, and

Caribbean Utilities Company, Ltd.
2016 Third Quarter Report l September 30, 2016 32
classification on the statement of cash flows. This update is effective for annual and interim periods beginning after December 15, 2016. Early adoption is permitted, however, an entity that elects early adoption must adopt all the amendments in the same period. The Company is assessing the impact that the adoption of this update will have on its consolidated financial statements. Changes in Accounting Policies Accounting for Share-Based Payments When the Terms of an Award Provide That a Performance Target Could Be Achieved After the Requisite Service Period Effective January 1, 2015, the Company early adopted ASU No. 2014-12 that resolves diversity in practice for employee share-based payments with performance targets that can entitle an employee to benefit from an award regardless of if they are rendering services at the date the performance target is achieved. The adoption of this update did not have an impact on the Company’s consolidated financial statements. Simplifying the Presentation of Debt Issuance Costs Effective December 1, 2015, the Company early adopted ASU No. 2015-03 that requires debt issuance costs to be presented on the consolidated balance sheet as a direct deduction from the carrying amount of debt liability, consistent with debt discounts or premiums. The Company early adopted ASU No. 2015-15 that clarifies the presentation and subsequent measurement of debt issuance costs associated with line-of-credit arrangements. The update permits an entity to defer and present debt issuance costs as an asset and subsequently amortize the deferred debt issuance costs ratably over the term of the line-of-credit arrangement, regardless of whether there are any outstanding borrowings on the line-of-credit arrangement. The adoption of this update was applied retrospectively and did not have a material impact on the Company’s consolidated financial statements. Critical Accounting Estimates The preparation of the Company’s financial statements in accordance with US GAAP requires management to make estimates and assumptions that affect the reported amounts of assets and liabilities and the disclosure of contingent assets and liabilities at the date of the financial statements and the reported amounts of revenues and expenses during the period. Estimates are based on historical experience, current conditions and various other assumptions believed to be reasonable under the circumstances. Due to changes in facts and circumstances and the inherent uncertainty involved in making estimates, actual results may differ significantly from the current estimates. Estimates are reviewed periodically and, as adjustments become necessary, are reported in earnings in the period in which they become known. The Company’s critical accounting estimates relate to: Revenue Recognition Revenue derived from the sale of electricity is taken to income on a bills-rendered basis, adjusted for unbilled revenues. Customer bills are issued throughout the month based on meter readings that establish electricity consumption since the last meter reading. The unbilled revenue accrual for the period is based on estimated electricity sales to customers since the last meter reading. The estimation process for accrued unbilled electricity

Caribbean Utilities Company, Ltd.
2016 Third Quarter Report l September 30, 2016 33
consumption will result in adjustments of electricity revenue in the periods they become known when actual results differ from the estimates. As at September 30, 2016, the amount of unbilled revenue recorded in Electricity Sales was $2.7 million (September 30, 2015: $2.9 million). Kilowatt Hour (“kWh”) Sales KWh sales throughout the month are based on meter readings that establish electricity consumption since the last meter reading. The kWh accrual for the period is based on estimated electricity sales to customers since the last meter reading. The estimation process for electricity consumption will result in adjustments of kWh sales statistics in the periods they become known when actual results differ from the estimates. As at September 30, 2016, the amount of estimated kWh sales was 20.4 million kWh (September 30, 2015: 22.6 million kWh). Employee Future Benefits The Company’s defined benefit pension plan is subject to judgments utilised in the actuarial determination of the expense and related obligation. There are currently two participants in the Company’s defined benefit pension plan. The main assumptions utilized by Management in determining pension expense and obligations were the discount rate for the accrued benefit obligation, pension commencement date, inflation and the expected rate of return on plan assets. As at September 30, 2016, the Company has a long term liability of $1.1 million (December 31, 2015: $1.2 million). Property, Plant and Equipment Depreciation Depreciation is an estimate based primarily on the estimated useful life of the asset. Estimated useful lives are based on current facts and historical information and take into consideration the anticipated physical life of the assets. As at September 30, 2016, the net book value of the Company’s PP&E was $464.0 million compared to $447.7 million as at December 31, 2015, increasing as a result of the Company’s generation and T&D capital expenditures. Depreciation expense for the nine months ended September 30, 2016 was $20.9 million ($19.4 million for the nine months ended September 30, 2015). Due to the value of the Company’s property, plant and equipment, changes in depreciation rates can have a significant impact on the Company’s depreciation expense. Quarterly Results The table “Quarterly Results” summarises unaudited quarterly information for each of the eight quarters ended December 31, 2014 through September 30, 2016. This information has been obtained from CUC’s unaudited interim Financial Statements which, in the opinion of Management, have been prepared in accordance with US GAAP. These operating results are not necessarily indicative of results for any future period and should not be relied upon to predict future performance.

Caribbean Utilities Company, Ltd.
2016 Third Quarter Report l September 30, 2016 34
Quarterly results ($ thousands, except basic and diluted earnings per ordinary share)
OperatingRevenue
Net earnings
Income applicable to ordinary
shares
Earnings per ordinary
share
Diluted earnings
per ordinary share September 30, 2016 42,873 7,371 7,258 0.22 0.22June 30, 2016 37,915 7,544 7,431 0.23 0.23March 31, 2016 39,732 4,975 4,862 0.15 0.15December 31, 2015 45,882 6,151 5,560 0.18 0.18September 30, 2015 50,242 7,893 7,780 0.25 0.25June 30, 2015 44,048 5,514 5,401 0.17 0.17March 31, 2015 December 31, 2014 48,70958,192 3,2845,397 3,1714,806 0.11 0.16 0.110.16
September 2016/September 2015 Net earnings for the three months ended September 30, 2016 (“Third Quarter 2016”) totalled $7.4 million, a decrease of $0.5 million when compared to net earnings of $7.9 million for the three months ended September 30, 2015 (“Third Quarter 2015”). This decrease was due mainly to higher depreciation and finance charges. The higher depreciation and finance charges are as anticipated by the Company and are driven by the completion of the 39.7 megawatts (“MW”) Generation Project in June 2016. These items were partially offset by higher electricity sales revenues. After the adjustment for dividends on the preference shares of the Company, earnings on Class A Ordinary Shares for the Third Quarter 2016 were $7.3 million, or $0.22 per Class A Ordinary Share, compared to earnings on Class A Ordinary Shares of $7.8 million or $0.25 per Class A Ordinary Share for the Third Quarter 2015. June 2016/June 2015 Operating income for Second Quarter 2016 totalled $7.2 million, an increase of $0.8 million when compared to operating income of $6.4 million for Second Quarter 2015. The increase is primarily attributable to the 7% increase in kWh sales partially offset by higher depreciation and general and administration costs. In addition to the factors positively impacting operating income, net earnings increased as a result of higher capitalization of interest expenses through the Allowance for Funds Used During Construction (“AFUDC”) of $1.7 million in Second Quarter 2016 when compared to $1.0 million in Second Quarter 2015. The increase in AFUDC, and resulting reduction in Finance Charges, is due primarily to the Company’s 39.7 MW Generation Project which was completed in June 2016. AFUDC is the capitalisation of Financing Cost which is calculated by multiplying the Company’s Cost of Capital rate by the average construction work in progress for each month. The Company anticipates a reduction in AFUDC and an increase in depreciation costs commencing with the completion of the Generation Project. Net earnings for the three months ended June 30, 2016 totalled $7.5 million, an increase of $2.0 million when compared to net earnings of $5.5 million for the three months ended June 30, 2015 (“Second Quarter 2015”).

Caribbean Utilities Company, Ltd.
2016 Third Quarter Report l September 30, 2016 35
After the adjustment for dividends on the preference shares of the Company, earnings on Class A Ordinary Shares for the Second Quarter 2016 were $7.4 million, or $0.23 per Class A Ordinary Share, compared to earnings on Class A Ordinary Shares of $5.4 million or $0.17 per Class A Ordinary Share for Second Quarter 2015. March 2016/March 2015 Operating income for First Quarter 2016 totalled $5.1 million, an increase of $0.6 million when compared to operating income of $4.5 million for First Quarter 2015. The increase is attributable to the 5% increase in kWh sales and lower general and administration costs. These items were partially offset by higher depreciation, maintenance and amortization costs. In addition to the factors positively impacting operating income, net earnings increased as a result of higher capitalization of interest expenses through the Allowance for Funds Used During Construction (“AFUDC”) of $1.9 million in First Quarter 2016 when compared to $0.9 million in First Quarter 2015. The increase in AFUDC, and resulting reduction in Finance Charges, is due primarily to the Company’s ongoing 39.7 MW Generation Project. AFUDC is the capitalisation of Financing Cost which is calculated by multiplying the Company’s Cost of Capital rate by the average work in progress for each month. Net Earnings for the First Quarter 2016 totalled $5.0 million, an increase of $1.7 million when compared to net earnings of $3.3 million for the First Quarter 2015. After the adjustment for dividends on the preference shares of the Company, earnings on Class A Ordinary Shares for the First Quarter 2016 were $4.9 million, or $0.15 per Class A Ordinary Share, compared to earnings on Class A Ordinary Shares of $3.2 million or $0.11 per Class A Ordinary Share for the First Quarter 2015. December 2015/December 2014 Net earnings for the three months ended December 31, 2015 (“Fourth Quarter 2015”) were $6.2 million, a $0.8 million increase when compared to $5.4 million for the three months ended December 31, 2014 (“Fourth Quarter 2014”). This increase is attributable to a 8% increase in kWh sales and lower finance charges. These items were partially offset by higher consumer services, general and administration, depreciation and maintenance costs for the Fourth Quarter 2015 when compared to the Fourth Quarter 2014. After the adjustment for dividends on the Class B preference shares of the Company, earnings on Class A Ordinary Shares for the Fourth Quarter 2015 were $5.6 million, or $0.18 per Class A Ordinary Share, as compared to $4.8 million, or $0.16 per Class A Ordinary Share for the Fourth Quarter 2014. Disclosure Controls and Procedures The President and Chief Executive Officer (“CEO”) and the VP Finance and Chief Financial Officer (“CFO”), together with Management, have established and maintained the Company’s disclosure controls and procedures (DC&P), to provide reasonable assurance that material information relating to the Company is made known to them by others, particularly during

Caribbean Utilities Company, Ltd.
2016 Third Quarter Report l September 30, 2016 36
the year ending December 31, 2015; and information required to be disclosed by the issuer in its annual filings, interim filings or other reports filed or submitted by it under securities legislation is recorded, processed, summarized and reported within the time periods specified in securities legislation. Based on the evaluation performed over disclosure controls and procedures, it was concluded that the DC&P of CUC is adequately designed and operating effectively as of September 30, 2016. Internal Controls over Financial Reporting (“ICFR”) The CEO and CFO of the Company, together with Management, have established and maintained the Company’s internal control over financial reporting (ICFR), as defined in National Instrument 52-109 Certification of Disclosure in Issuers’ Annual and Interim Filings, to provide reasonable assurance regarding the reliability of financial reporting and the preparation of financial statements for external purposes in accordance with US GAAP. The design of CUC’s internal controls over financial reporting has been established and evaluated using the criteria set forth in the Internal Control-Integrated 2013 Framework by the Committee of Sponsoring Organizations of the Treadway Commission (COSO). Based on the assessment, it was concluded that CUC’s internal controls over financial reporting are adequately designed and operating effectively as of September 30, 2016. Outlook In December 2015 the ERA approved CUC’s 2016-2020 Capital Investment Plan in the amount of $204 million. Approved projects for the upcoming period include completion of ongoing generation and T&D system replacements and upgrades. The Company continues to facilitate the connecting of renewable energy sources to the grid. During the Fourth Quarter 2015, the ERA approved a Power Purchase Agreement (PPA) for a 5 MW plant to be built by Entropy Cayman Solar Limited in the district of Bodden Town. This 5 MW Solar project, scheduled for completion by Second Quarter 2017, will provide energy to power approximately 800 homes with clean renewable solar energy and will significantly reduce emissions into the atmosphere through the avoidance of diesel fuel consumption. Outstanding Share Data At November 4, 2016 the Company had issued and outstanding 32,590,529 Ordinary Shares and 250,000 9% cumulative Participating Class B Preference Shares.

Caribbean Utilities Company, Ltd.
2016 Third Quarter Report l September 30, 2016 37
The number of common shares of the Company that would be issued if all outstanding stock options were converted as at November 4, 2016 is as follows. Conversion of Securities into Common SharesAs at November 4, 2016 (Unaudited)
Number ofCommon Shares Stock Options 199,500 Additional information, including CUC’s Annual Information Form, is available on SEDAR at
www.sedar.com and on the Company’s website at www.cuc-cayman.com.

Caribbean Utilities Company, Ltd.
2016 Third Quarter Report l September 30, 2016 38
Consolidated Balance Sheets (expressed in thousands of United States Dollars)
Unaudited Note As at September
30, 2016
As at December 31,
2015 Assets Current Assets Cash and Cash Equivalents 14,876 1,365 Accounts Receivable 5 11,024 11,767 Related Party Receivables 22 11 - Regulatory Assets 6 13,478 14,346 Inventories 7 2,835 2,237 Prepayments 3,588 2,096 45,812 31,811 Property, Plant and Equipment 8 463,730 447,700 Other Assets 9 24 24 Intangible Assets 10 3,101 3,271 Total Assets 512,667 482,806 Liabilities and Shareholders' Equity Current Liabilities Bank Overdraft - 1,735 Accounts Payable and Accrued Expenses 11 25,298 20,410 Related Party Payables 22 174 14 Regulatory Liabilities 6 2,266 863 Short Term Debt 12 30,000 - Current Portion of Long-Term Debt 11,000 14,000 Consumers' Deposits and Advances for Construction 7,539 6,823 76,277 43,845 Defined Benefit Pension Liability 18 1,071 1,242 Long-Term Debt 15 214,713 222,594 Other Long Term Liabilities 13 551 636 Total Liabilities 292,612 268,317 Shareholders' Equity Share Capital 2,190 2,177 Share Premium 118,471 116,201 Additional Paid in Capital 13 467 467 Retained Earnings 99,938 96,822 Accumulated Other Comprehensive Loss (1,011) (1,178) Total Shareholders' Equity 220,055 214,489 Total Liabilities and Shareholders' Equity 512,667 482,806
See accompanying Notes to Unaudited Interim Consolidated Financial Statements

Caribbean Utilities Company, Ltd.
2016 Third Quarter Report l September 30, 2016 39
Consolidated Statements of Earnings (expressed in thousands of United States Dollars, except basic and diluted earnings per ordinary share and the Weighted Average of Class A Ordinary Shares issued and fully paid)
Unaudited Note Three Months
Ended September
30, 2016
Three Months
Ended September
30, 2015
Nine Months
Ended September
30, 2016
Nine Months
Ended September
30, 2015
Operating Revenues Electricity Sales 21,778 21,131 60,387 57,357 Fuel Factor 21,095 29,111 60,134 85,641 Total Operating Revenues 42,873 50,242 120,521 142,998
Operating Expenses Power Generation 21,955 30,165 63,042 88,679 General and Administration 2,095 2,164 6,555 6,674 Consumer Services 487 606 1,839 2,007 Transmission and Distribution 912 698 2,533 2,130 Depreciation 7,319 6,480 20,917 19,368 Maintenance 1,559 1,609 4,480 4,495 Amortization of Intangible Assets 151 121 453 367 Total Operating Expenses 34,478 41,843 99,819 123,720
Operating Income 8,395 8,399 20,702 19,278 Other (Expenses)/Income: Finance Charges 17 (2,199) (1,644) (4,660) (6,148) Foreign Exchange Gain 19 293 401 840 1,043 Other Income 882 737 2,964 2,516
Total Net Other (Expenses)/Income (1,024) (506) (856) (2,589) Earnings for the Period 7,371 7,893 19,846 16,689 Preference Dividends Paid- Class B (113) (113) (339) (339) Earnings on Class A Ordinary Shares 7,258 7,780 19,507 16,350 Weighted-Average Number of Class A Ordinary Shares Issued and Fully Paid (in thousands) 14 32,528 32,289 32,483 31,041 Earnings per Class A Ordinary Share 14 0.22 0.25 0.60 0.53 Diluted Earnings per Class A Ordinary Share 14 0.22 0.25 0.60 0.53 Dividends Declared per Class A Ordinary Share 0.170 0.165 0.505 0.495
See accompanying Notes to Unaudited Interim Consolidated Financial Statements

Caribbean Utilities Company, Ltd.
2016 Third Quarter Report l September 30, 2016 40
Consolidated Statements of Comprehensive Income (expressed in thousands of United States Dollars)
Unaudited Three Months
Ended September
30, 2016
Three Months
Ended September
30, 2015
Nine Months
Ended September
30, 2016
Nine Months
Ended September
30, 2015
Earnings for the Period 7,371 7,893 19,846 16,689 Amortization of net actuarial loss 56 52 168 154 Total Other Comprehensive Income 56 52 168 154
Comprehensive Income 7,427 7,945 20,014 16,843
See accompanying Notes to Unaudited Interim Consolidated Financial Statements

Caribbean Utilities Company, Ltd.
2016 Third Quarter Report l September 30, 2016 41
Consolidated Statements of Shareholders’ Equity (expressed in thousands of United States Dollars except Common Shares)
Class A Ordinary Shares (in
thousands)
Class A Ordinary
Shares Value ($)
Preference Shares
($)
Share Premium
($)
Additional Paid-in
Capital ($)
Accumulated Other
Comprehensive Loss ($)
Retained Earnings
($)
Total Equity ($)
As at January 1, 2016
32,382 1,927 250 116,201 467 (1,178) 96,822 214,489 Net earnings - - - - - - 19,846 19,846 Common share issuance and stock options plans 209 13 - 2,270 - - - 2,283
Defined benefit plans - - - - - 167 - 167 Dividends on common shares - - - - - - (16,391) (16,391) Dividends on preference shares - - - - - - (339) (339) As at September 30, 2016
32,591 1,940 250 118,471 467 (1,011) 99,938 220,055
As at January 1, 2015
29,260 1,742 250 83,044 463 (1,386) 95,722 179,835 Net earnings - - - - - - 16,689 16,689 Common share issuance and stock options plans
3,073 183 - 32,692 3 - - 32,878 Defined benefit plans - - - - - 154 - 154 Dividends on common shares - - - - - - (15,473) (15,473) Dividends on preference shares - - - - - - (339) (339) As at September 30, 2015
32,333
1,925
250
115,736
466
(1,232)
96,599
213,744
See accompanying Notes to Unaudited Interim Consolidated Financial Statements

Caribbean Utilities Company, Ltd.
2016 Third Quarter Report l September 30, 2016 42
Consolidated Statements of Cash Flows (expressed in thousands of United States Dollars)
Unaudited Three Months
Ended September
30, 2016
Three Months
Ended September
30, 2015
Nine Months
Ended September
30, 2016
NineMonths
Ended September
30, 2015 Operating Activities Earnings for the period 7,371 7,893 19,846 16,689Items not affecting cash: Depreciation 7,319 6,480 20,917 19,368 Amortization of Intangible Assets 151 121 453 367 Non-cash Pension Expenses (125) - (3) - Amortization of Deferred Financing Costs 33 40 113 119 Stock-based compensation - 1 1 3 14,749 14,535 41,327 36,546 Net change in non-cash working capital balances related to operations 4,463 2,133 4,533 1,129 Net Change in Regulatory Deferrals (890) 2,800 2,271 5,958
Cash flow related to operating activities 18,322 19,468 48,131 43,633 Investing Activities Purchase of property, plant and equipment (8,388) (31,890) (36,692) (52,964) Costs related to intangible assets (82) (214) (264) (424)
Cash flow related to investing activities (8,470) (32,104) (36,956) (53,388) Financing Activities Short-term borrowings - - 30,000 - Repayment of debt - - (11,000) (11,000) Decrease in bank overdraft - - (1,735) - Dividends paid (5,166) (5,503) (17,209) (16,449) Net proceeds from share issues 845 500 2,280 32,878
Cash flow related to financing activities (4,321) (5,003) 2,336 5,429 Increase in net cash and cash equivalents 5,531 (17,639) 13,511 (4,326) Cash and cash equivalents - Beginning of period 9,345 35,128 1,365 21,815 Cash and cash equivalents - End of period 14,876 17,489 14,876 17,489 Supplemental disclosure of cash flow information: Interest paid during the period 152 16 6,233 6,424
See Accompanying Notes to Unaudited Interim Consolidated Financial Statements
Caribbean Utilities Company, Ltd.
2016 Third Quarter Report l September 30, 2016 43
Notes to Interim Consolidated Financial Statements Unaudited – September 30, 2016 (expressed in thousands of United States dollars unless otherwise stated) 1. Nature of Operations and Consolidated Financial Statement Presentation These consolidated financial statements have been prepared in accordance with United States Generally Accepted Accounting Principles (“US GAAP”) and reflect the decisions of the Electricity Regulatory Authority (“ERA”). The consolidated financial statements include the accounts of the Company and its wholly-owned subsidiary DataLink, Ltd (“DataLink”). These decisions affect the timing of the recognition of certain transactions resulting in the recognition of regulatory assets and liabilities, which Caribbean Utilities Company, Ltd., (“CUC” or the “Company”) considers it is probable to recover or settle subsequently through the rate-setting process. The principal activity of the Company is to generate and distribute electricity in its licence area of Grand Cayman, Cayman Islands, pursuant to a 20-year exclusive Transmission & Distribution (“T&D”) Licence and a 25 year non–exclusive Generation Licence (collectively the “Licences”) with the Cayman Islands Government (the “Government”), which expire in April 2028 and November 2039 respectively. In March 2012 CUC’s wholly-owned subsidiary, DataLink, received its licence from the Information and Communications Technology Authority (“ICTA”) which permits DataLink to provide fibre optic infrastructure and other information and communication technology (ICT) services to the ICT industry. The ICTA is an independent statutory Authority which was created by the enactment of the Information and Communications Technology Authority Law on May 17, 2002 and is responsible for the regulation and licensing of Telecommunications, Broadcasting, and all forms of radio. The ICTA sets the standards by which ICT networks must be developed and operated under. All significant intercompany balances and transactions have been eliminated on consolidation. Rate Regulated Operations CUC’s base rates are designed to recover all non-fuel and non-regulatory costs and include per kilowatt-hour (“kWh”) electricity charges and fixed facilities charges. Fuel cost charges and regulatory fees are billed as separate line items. Base rates are subject to an annual review and adjustment each June through the Rate Cap and Adjustment Mechanism (“RCAM”). In June 2016, following review and approval by the Electricity Regulatory Authority (“ERA”), the Company increased its base rates by 0.1%. This increase was a result of the 2015 Return on Rate Base (“RORB”) and the increase in the applicable United States (“US”) and Cayman Islands consumer price indices, adjusted to exclude food and fuel, for calendar year 2015. The change in the base rates as a percentage of the US and Cayman Islands consumer price indices was 80% based on the range of the RORB values. The required rate adjustment of 0.1% can be calculated by applying 80% to the total price level index (60% of the Cayman Islands CPI and 40% of the US CPI) of 0.12%. All fuel and lubricating oil costs are passed through to customers without mark-up as a per kWh charge.

Caribbean Utilities Company, Ltd.
2016 Third Quarter Report l September 30, 2016 44
For regulatory purposes fixed assets comprise the completed Property, Plant and Equipment (“PP&E”) and intangible assets acquired or constructed by the Company as reported in the Company’s consolidated financial statements. The original book value of these fixed assets includes an Allowance for Funds Used During Construction (“AFUDC”) (Note 8) and an allowance for General Expenses Capitalised (“GEC”) (Note 8). GEC is calculated as a percentage of up to 10% of Non-Fuel Operating Expenses, varying annually depending on the level of capital activity. Seasonality Interim results will fluctuate due to the seasonal nature of electricity consumption. In Grand Cayman, demand is highest in the summer months due to air-conditioning load. Consequently, interim results are not necessarily indicative of annual results. 2. Summary of Significant Accounting Policies The preparation of financial statements in conformity with US GAAP requires Management to make estimates and assumptions that affect the reported amounts of assets and liabilities and disclosure of contingent assets and liabilities at the date of the financial statements and the reported amounts of revenues and expenses during the reporting period. Actual results could differ from those estimates. 3. Future Accounting Policies Revenue from Contracts with Customers ASU No. 2014-09 was issued in May 2014 and the amendments in this update create ASC Topic 606, Revenue from Contracts with Customers, and supersede the revenue recognition requirements in ASC Topic 605, Revenue Recognition, including most industry-specific revenue recognition guidance throughout the codification. This standard completes a joint effort by FASB and the International Accounting Standards Board to improve financial reporting by creating common revenue recognition guidance for US GAAP and International Financial Reporting Standards that clarifies the principles for recognizing revenue and that can be applied consistently across various transactions, industries and capital markets. This standard was originally effective for annual and interim periods beginning after December 15, 2016 and is to be applied on a full retrospective or modified retrospective basis. ASU No. 2015-14 was issued in August 2015 and the amendments in this update defer the effective date of ASU No. 2014-09 by one year to annual and interim periods beginning after December 15, 2017. Early adoption is permitted as of the original effective date. The majority of the Company’s revenue is generated from energy sales to customers based on published tariff rates, as approved by the respective regulators, and is considered to be in the scope of ASU No. 2014-09. The Company and its subsidiary, DataLink Ltd., are assessing the impact that the adoption of this standard will have on the consolidated financial statements and plan to have this assessment complete in 2016.

Caribbean Utilities Company, Ltd.
2016 Third Quarter Report l September 30, 2016 45
Recognition and Measurement of Financial Assets and Financial Liabilities ASU No. 2016-01, Recognition and Measurement of Financial Assets and Financial Liabilities, was issued in January 2016 and the amendments in this update address certain aspects of recognition, measurement, presentation and disclosure of financial instruments. Most notably, the amendments require the following: (i) equity investments in unconsolidated entities (other than those accounted for using the equity method of accounting) to be measured at fair value through earnings; however, entities will be able to elect to record equity investments without readily determinable fair values at cost, less impairment, and plus or minus subsequent adjustments for observable price changes; and (ii) financial assets and financial liabilities to be presented separately in the notes to the consolidated financial statements, grouped by measurement category and form of financial asset. This update is effective for annual and interim periods beginning after December 15, 2017. Leases ASU No. 2016-02 was issued in February 2016 and the amendments in this update create ASC Topic 842, Leases, and supersede lease requirements in ASC Topic 840, Leases. The main provision of Topic 842 is the recognition of lease assets and lease liabilities on the balance sheet by lessees for those leases that were previously classified as operating leases. For operating leases, a lessee is required to do the following: (i) recognize a right-of-use asset and a lease liability, initially measured at the present value of the lease payments, on the balance sheet; (ii) recognize a single lease cost, calculated so that the cost of the lease is allocated over the lease term on a generally straight-line basis; and (iii) classify all cash payments within operating activities in the statement of cash flows. These amendments also require qualitative disclosures along with specific quantitative disclosures. This update is effective for annual and interim periods beginning after December 15, 2018 and is to be applied using a modified retrospective approach with practical expedients options. Early adoption is permitted. The Company is assessing the impact that the adoption of this update will have on its consolidated financial statements and related disclosures. Improvements to Employee Share-Based Payment Accounting ASU No. 2016-09, Improvements to Employee Share-Based Payment Accounting, was issued in March 2016 as part of FASB’s simplification initiative. The areas for simplification in this update involve several aspects of accounting for share-based payment transactions, including income tax consequences, classification of awards as either equity or liabilities, and classification on the statement of cash flows. This update is effective for annual and interim periods beginning after December 15, 2016. Early adoption is permitted, however, an entity that elects early adoption must adopt all the amendments in the same period. The Company is assessing the impact that the adoption of this update will have on its consolidated financial statements.
4. Changes in Accounting Policies Accounting for Share-Based Payments When the Terms of an Award Provide That a Performance Target Could Be Achieved After the Requisite Service Period Effective January 1, 2015, the Company early adopted ASU No. 2014-12 that resolves diversity in practice for employee share-based payments with performance targets that can entitle an

Caribbean Utilities Company, Ltd.
2016 Third Quarter Report l September 30, 2016 46
employee to benefit from an award regardless of if they are rendering services at the date the performance target is achieved. The adoption of this update did not have an impact on the Company’s consolidated financial statements. Simplifying the Presentation of Debt Issuance Costs Effective December 1, 2015, the Company early adopted ASU No. 2015-03 that requires debt issuance costs to be presented on the consolidated balance sheet as a direct deduction from the carrying amount of debt liability, consistent with debt discounts or premiums. The Company early adopted ASU No. 2015-15 that clarifies the presentation and subsequent measurement of debt issuance costs associated with line-of-credit arrangements. The update permits an entity to defer and present debt issuance costs as an asset and subsequently amortize the deferred debt issuance costs ratably over the term of the line-of-credit arrangement, regardless of whether there are any outstanding borrowings on the line-of-credit arrangement. The adoption of this update was applied retrospectively and did not have a material impact on the Company’s consolidated financial statements.
5. Accounts Receivable
Accounts Receivable ($ thousands)
As at September 30, 2016
As at December 31, 2015 Billings to electricity consumers and DataLink customers 9,611 10,593 Unbilled revenues 2,701 2,160 Other receivables 924 1,232 Allowance for doubtful accounts (2,212) (2,218)
Total accounts receivable 11,024 11,767 Unbilled Revenues Revenue derived from the sale of electricity is taken to income on a bills-rendered basis, adjusted for unbilled revenues. Customer bills are issued throughout the month based on meter readings that establish electricity consumption since the last meter reading. The unbilled revenue accrual for the period is based on estimated electricity sales to customers since the last meter reading. The estimation process for accrued unbilled electricity consumption will result in adjustments of electricity revenue in the periods they become known when actual results differ from the estimates. Consumers are billed at the beginning of each month leading to the accrual of approximately three weeks of unbilled revenue. Other receivables Other receivables relate to amounts due outside of the normal course of operations. Items in other receivables include sale of inventory and machine break-down costs covered by warranties. Other receivables at September 30, 2016 also include billing adjustments for commercial customers.

Caribbean Utilities Company, Ltd.
2016 Third Quarter Report l September 30, 2016 47
6. Regulatory Assets and Liabilities
Asset/Liability ($ thousands) Description
As at September 30,
2016
As at December 31,
2015 Regulatory Assets Fuel Tracker Account (a) 13,105 13,866 Regulatory Assets Derivative contract (b) 121 208 Regulatory Assets Miscellaneous Regulatory Assets (c) 252 272 Total Regulatory Assets 13,478 14,346 Regulatory Liabilities Fuel Tracker Account (a) - - Regulatory Liabilities Government & Regulatory Tracker Account (d) (2,266) (812) Regulatory Liabilities Miscellaneous Regulatory Liabilities (e) - (51) Total Regulatory Liabilities (2,266) (863)
a) Fuel Tracker Account – The 2008 T&D Licence established a fuel tracker mechanism to ensure the Company and the consumers neither gain nor lose from the pass through of fuel costs. The purpose of the fuel tracker account is to accumulate actual fuel costs incurred less fuel factor revenues billed to consumers. This account represents deferred accumulated fuel costs to be recovered from or reimbursed to the consumers. The receivable or payable value represents a regulatory asset or liability. The net position of the fuel tracker accounts fluctuates monthly and is affected by fuel prices and electricity consumption. b) Derivative contract - The Company’s purpose of hedging is to reduce the impact of volatility in the Fuel Cost Charge paid by the Company’s customers in the face of price volatility for the fuel that the Company must purchase in order to provide electric service. This account represents the fair value adjustments for the call options. The Company’s current call option contracts will expire by September 2017. c) Miscellaneous regulatory assets represent costs incurred by the Company, other than fuel and the specifically itemised licence and regulatory fees, to be recovered through the Company’s base rates on terms as agreed with the ERA. d) Government and Regulatory Tracker Account - A licence fee of 1% of gross revenues applies to customer billings for consumption over 1,000 kWh per month as a pass-through charge on a per kWh basis. Additionally, a regulatory fee of ½ of 1% is charged on gross revenues then prorated and applied only to customer billings with consumption over 1,000 kWh per month. The government and regulatory tracker account is the actual fee incurred less the amount billed to consumers. e) Miscellaneous regulatory liabilities represent costs owed by the Company, other than licence and regulatory fees, to be recovered through the Company’s base rates on terms as agreed with the ERA.

Caribbean Utilities Company, Ltd.
2016 Third Quarter Report l September 30, 2016 48
7. Inventories The composition of inventories is shown in the table below: Inventories ($ thousands) As at September 30,
2016 As at December 31,
2015 Fuel 2,056 1,392 Lubricating Oil 471 547 Line spares 88 76Datalink, Ltd. 211 211 Other 9 11 Total 2,835 2,237
8. Property, Plant and Equipment (“PP&E”)
Property, plant and equipment ($ thousands)
Cost Accumulated Depreciation
Net Book Value September 30,
2016 Transmission & Distribution (T&D) 323,174 118,858 204,316 Generation 402,467 163,432 239,035 Other: Land 5,304 - 5,304 Buildings 20,167 11,435 8,732 Equipment, motor vehicles and computers 23,526 17,649 5,877 Total of T&D, Generation and Other 774,638 311,374 463,264 Datalink, Ltd. 541 75 466 Property, plant and equipment 775,179 311,449 463,730 Property, plant and equipment ($ thousands)
Cost Accumulated Depreciation
Net Book Value December 31,
2015 Transmission & Distribution (T&D) 310,299 111,750 198,549 Generation 379,354 151,065 228,289 Other: Land 5,304 - 5,304 Buildings 20,167 11,081 9,086 Equipment, motor vehicles and computers 22,676 16,692 5,984 Total of T&D, Generation and Other 737,800 290,588 447,212 Datalink, Ltd. 541 53 488 Property, plant and equipment 738,341 290,641 447,700
Included in PP&E are a number of capital projects in progress with a total cost to date of $37.5 million (December 31, 2015: $83.1 million). These projects primarily relate to various improvements to the Distribution System. Included in the total cost is an amount of $0.07 million that relates to fibre optic assets for DataLink. Also included in Generation and T&D is freehold land with a cost of $5.0 million (December 31, 2015: $5.0 million). In addition, line inventory with a cost of $ 0.1 million (December 31, 2015: $4.3 million) is included in T&D. Engine spares with a net book value of $13.4 million

Caribbean Utilities Company, Ltd.
2016 Third Quarter Report l September 30, 2016 49
(December 31, 2015: $13.7 million) are included in Generation. The capitalisation of AFUDC is calculated by multiplying the Company’s Cost of Capital rate by the average work in progress for each month. The cost of capital rate for fiscal 2016 is 7.75% (2015: 8.25%) and will be adjusted annually. As a result, during the Third Quarter 2016, the Company recognised $0.8 million in AFUDC (Third Quarter 2015: $1.4 million). During the nine month period ended September 30, 2016, the Company recognised $4.5 million in AFUDC, compared to $3.4 million for the nine month period ended September 30, 2015. GEC is calculated as a percentage of up to 10% of Non-Fuel Operating Expenses, varying annually depending on the level of capital activity. GEC totalled $1.1 million for the Third Quarter 2016, an increase of $0.1 million when compared to $1.0 million for the Third Quarter 2015. GEC totalled $3.2 million for the nine months ended September 30, 2016, compared to GEC of $3.1 million for the nine months ended September 30, 2015. Depreciation on DataLink’s assets is provided on the cost of PP&E on a straight-line basis over the estimated useful lives ranging from 3 to 30 years. Depreciation, by its very nature is an estimate based primarily on the estimated useful life of the asset. Estimated useful lives are based on current facts and take into consideration the anticipated physical life of the assets. In accordance with the Licences, when an asset is impaired or disposed of before the original estimated useful life, the cost of the asset is reduced and the net book value is charged to accumulated depreciation. This treatment is in accordance with the rate regulation standard under US GAAP and differs from non-regulatory treatment of a loss being recognized on the statement of earnings. The amount charged to accumulated depreciation is net of any proceeds received in conjunction with the disposal of the asset. This amount within accumulated depreciation is to be depreciated as per the remaining life of the asset based on the original life when the unit was initially placed into service. 9. Other Assets
Other Assets ($ thousands)
As at September 30, 2016
As at December 31, 2015 Miscellaneous other assets 24 24
Total 24 24 Deferred debt issue costs relate to transaction costs incurred in respect of financial liabilities. These costs are deferred on the balance sheet and are being amortized over the life of the related note using the effective-interest rate method.

Caribbean Utilities Company, Ltd.
2016 Third Quarter Report l September 30, 2016 50
10. Intangible Assets
Intangible Assets ($ thousands)
Cost Accumulated Amortisation
Net Book Value September 30,
2016 Deferred licence renewal costs 1,890 797 1,093 Datalink Ltd. deferred licence renewal costs 200 60 140 Computer Software 6,483 4,817 1,666 Other Intangible Assets in progress 127 - 127 Trademark Costs 75 - 75 Total 8,775 5,674 3,101 Intangible Assets ($ thousands)
Cost Accumulated Amortisation
Net Book Value December 31,
2015 Deferred licence renewal costs 1,890 725 1,165 Datalink Ltd. deferred licence renewal costs 200 50 150 Computer Software 6,200 4,446 1,754 Other Intangible Assets in progress 127 - 127 Trademark Costs 75 - 75 Total 8,492 5,221 3,271 Deferred licence renewal costs relate to negotiations with the Government for licences for the Company. Amortization of deferred licence renewal costs commenced upon conclusion of licence negotiations in April 2008 and extends over the life of the T & D Licence. Amortization of DataLink’s deferred licence renewal costs commenced upon conclusion of licence negotiations in March 2012 and extends over the life of its ICTA licence.
11. Accounts Payable and Accrued Expenses
Accounts Payable ($ thousands) As at September 30, 2016 As at December 31, 2015 Fuel Cost Payable 14,058 13,556 Trade Accounts Payable & Accrued expenses 4,795 3,252 Accrued Interest 3,782 991 Dividends Payable 112 592 Other Accounts Payable 2,551 2,019 Total Accounts Payable 25,298 20,410
Included in Other Accounts Payable is an amount related to the fuel option contracts (see Note 14) of $ 0.1 million at September 30, 2016 ($0.2 million at December 31, 2015).

Caribbean Utilities Company, Ltd.
2016 Third Quarter Report l September 30, 2016 51
12. Short-Term Financing The Company has $50.0 million of unsecured credit financing facilities with the Scotiabank & Trust (Cayman) Limited (“Scotia”) and Royal Bank of Canada (“RBC”). The total available amount was $19.0 million at September 30, 2016 ($44.3 million at December 31, 2015). ($ thousands)
Total Credit Financing Facilities
September 30, 2016
Total Utilized September 30,
2016
Total Available September 30,
2016 Provided by Scotia: Letter of Credit 1,000 500 500 Operating, Revolving Line of Credit 10,000 - 10,000 Catastrophe Standby Loan 7,500 - 7,500 Demand Loan Facility- Interim Funding of Capital Expenditures 31,000 30,000 1,000 Total 49,500 30,500 19,000
Provided by RBC: Corporate Credit Card Line* 500 500 - Total 500 500 - *. Included in Accounts payable and accrued expenses A stand-by fee of 0.10% per annum is applied to the daily unused portion of the Standby Loan and Demand Loan facilities. An annual review fee of 0.05% of the total credit facilities is payable upon confirmation that the Facility has been renewed for a further period, being the earlier of 12 months or the next annual review date.
13. Share Based Compensation Plans Share Options: The shareholders of the Company approved an Executive Stock Option Plan (“ESOP’) on October 24, 1991, under which certain employees and officers may be granted options to purchase Class A Ordinary Shares of the Company. The exercise price per share in respect of options is equal to the fair market value of the Class A Ordinary Shares on the date of grant. Each option is for a term not exceeding ten years, and will become exercisable on a cumulative basis at the end of each year following the date of grant. The maximum number of Class A Ordinary Shares under option shall be fixed and approved by the shareholders of the Company from time to time and is currently set at 1,220,100. Options are forfeited if they are not exercised prior to their respective expiry date or upon termination of employment prior to the completion of the vesting period. Subject to certain amendments requiring shareholder approval, the Board of Directors may amend or discontinue the ESOP at any time without shareholder approval subject to TSX regulations, provided, however, that any amendment that may materially and adversely affect any option rights previously granted to a participant under the Option Plan must be consented to in writing by the Participant.
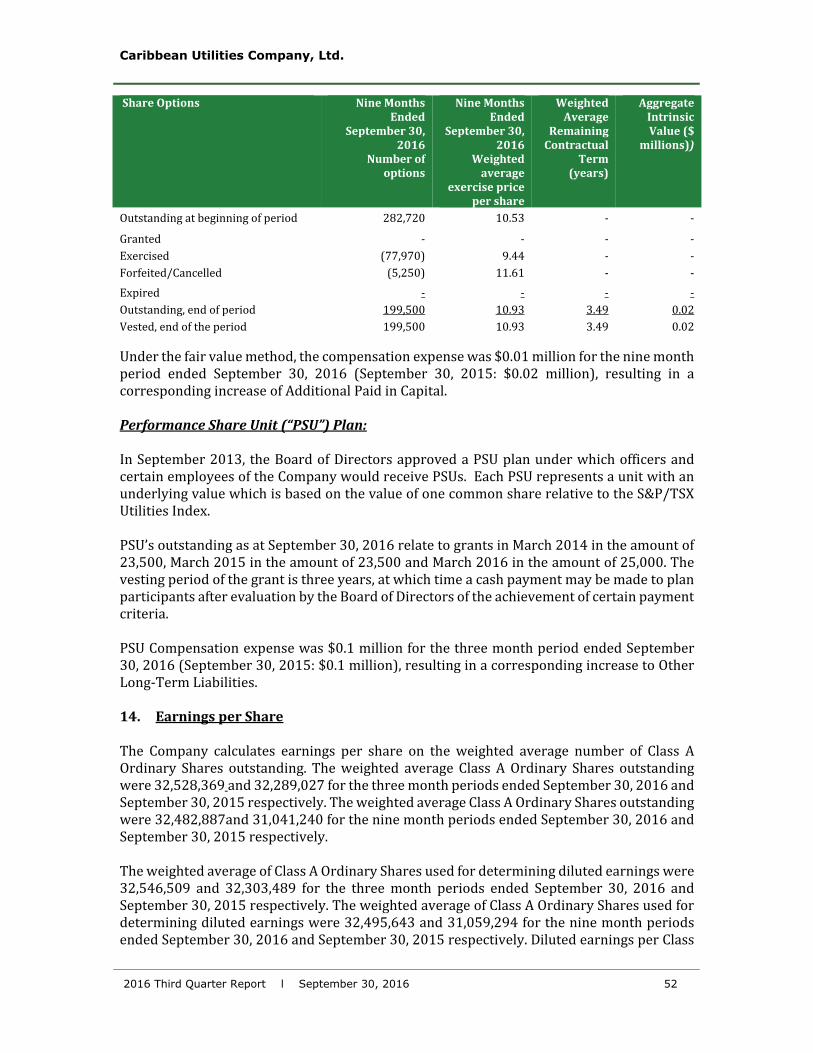
Caribbean Utilities Company, Ltd.
2016 Third Quarter Report l September 30, 2016 52
Share Options Nine Months Ended
September 30, 2016
Number of options
Nine Months Ended
September 30, 2016
Weighted average
exercise price per share
Weighted Average
Remaining Contractual
Term (years)
Aggregate Intrinsic Value ($
millions))
Outstanding at beginning of period 282,720 10.53 - - Granted - - - - Exercised (77,970) 9.44 - - Forfeited/Cancelled (5,250) 11.61 - - Expired - - - - Outstanding, end of period 199,500 10.93 3.49 0.02 Vested, end of the period 199,500 10.93 3.49 0.02 Under the fair value method, the compensation expense was $0.01 million for the nine month period ended September 30, 2016 (September 30, 2015: $0.02 million), resulting in a corresponding increase of Additional Paid in Capital. Performance Share Unit (“PSU”) Plan: In September 2013, the Board of Directors approved a PSU plan under which officers and certain employees of the Company would receive PSUs. Each PSU represents a unit with an underlying value which is based on the value of one common share relative to the S&P/TSX Utilities Index. PSU’s outstanding as at September 30, 2016 relate to grants in March 2014 in the amount of 23,500, March 2015 in the amount of 23,500 and March 2016 in the amount of 25,000. The vesting period of the grant is three years, at which time a cash payment may be made to plan participants after evaluation by the Board of Directors of the achievement of certain payment criteria. PSU Compensation expense was $0.1 million for the three month period ended September 30, 2016 (September 30, 2015: $0.1 million), resulting in a corresponding increase to Other Long-Term Liabilities. 14. Earnings per Share The Company calculates earnings per share on the weighted average number of Class A Ordinary Shares outstanding. The weighted average Class A Ordinary Shares outstanding were 32,528,369 and 32,289,027 for the three month periods ended September 30, 2016 and September 30, 2015 respectively. The weighted average Class A Ordinary Shares outstanding were 32,482,887and 31,041,240 for the nine month periods ended September 30, 2016 and September 30, 2015 respectively. The weighted average of Class A Ordinary Shares used for determining diluted earnings were 32,546,509 and 32,303,489 for the three month periods ended September 30, 2016 and September 30, 2015 respectively. The weighted average of Class A Ordinary Shares used for determining diluted earnings were 32,495,643 and 31,059,294 for the nine month periods ended September 30, 2016 and September 30, 2015 respectively. Diluted earnings per Class

Caribbean Utilities Company, Ltd.
2016 Third Quarter Report l September 30, 2016 53
A Ordinary Share was calculated using the treasury stock method. As at September 30, 2016 the outstanding options are not materially dilutive as the market price of common shares is below or marginally higher than the exercise price.
Earnings (in
thousands) Weighted average
shares (in thousands)
Earnings per common shares
September 30, 2016 Net earnings applicable to common shares 7,258 Weighted Average share outstanding 32,528
Basic Earnings Per Common Share 0.22 Effect of potential dilutive securities: Stock Options - 21 - Diluted Earnings per Common Share 7,258 32,549 0.22
Earnings (in
thousands) Weighted average
shares (in thousands)
Earnings per common shares
September 30, 2015 Net earnings applicable to common shares 7,780 Weighted Average share outstanding 32,289
Basic Earnings Per Common Share 0.25 Effect of potential dilutive securities: Stock Options - 15 - Diluted Earnings per Common Share 7,780 32,304 0.25 15. Fair Value Measurement
Fair value is the price at which a market participant could sell an asset or transfer a liability to an unrelated party. A fair value measurement is required to reflect the assumptions that market participants would use in pricing an asset or liability based on the best available information. These assumptions include the risks inherent in a particular valuation technique, such as a pricing model, and the risks inherent in the inputs to the model. A fair value hierarchy exists that prioritizes the inputs used to measure fair value. The Company is required to determine the fair value of all derivative instruments in accordance with the following hierarchy: The three levels of the fair value hierarchy are defined as follows: Level 1: Fair value determined using unadjusted quoted prices in active markets. Level 2: Fair value determined using pricing inputs that are observable. Level 3: Fair value determined using unobservable inputs only when relevant observable inputs are not available. The fair values of the Company’s financial instruments, including derivatives, reflect a point-in-time estimate based on current and relevant market information about the instruments as at the balance sheet dates. The estimates cannot be determined with precision as they involve uncertainties and matters of judgment and, therefore, may not be relevant in predicting the Company’s future earnings or cash flows.

Caribbean Utilities Company, Ltd.
2016 Third Quarter Report l September 30, 2016 54
The estimated fair values of the Company’s financial instruments, including derivative financial instruments, are as follows: As at September 30, 2016 As at December 31, 2015
($ thousands) Carrying Value Fair Value Carrying Value Fair Value Long term debt, including current portion 225,713 253,282 236,594 251,723 Fuel Option Contracts1 121 121 208 208 1 Carrying value of fuel option contracts included in Accounts Payable and Accrued expenses The fair value of long-term debt is determined by discounting the future cash flows of each debt instrument at an estimated yield to maturity equivalent to benchmark government bonds or treasury bills, with similar terms to maturity, plus a market credit risk premium equal to that of issuers of similar credit quality. Since the Company does not intend to settle the long-term debt prior to maturity, the fair value estimate does not represent an actual liability and, therefore, does not include exchange or settlement costs. The Company measures the fair value of commodity contracts on a daily basis using the closing values observed on commodities exchanges and in over-the-counter markets, or through the use of industry-standard valuation techniques, such as option modelling or discounted cash flow methods, incorporating observable valuation inputs. The resulting measurements are the best estimate of fair value as represented by the transfer of the asset or liability through an orderly transaction in the marketplace at the measurement date. The fair value of the fuel option contract reflects only the value of the heating oil derivative and not the offsetting change in the value of the underlying future purchases of heating oil. The derivatives’ fair value shown in the below table reflects the estimated amount the Company would pay to terminate the contract at the stated date. The fair value has been determined using published market prices for heating oil commodities. The Company’s current option contracts will expire by September 2017. The derivatives entered into by the Company relate to regulated operations and any resulting gains or losses and changes to fair value are recorded in the regulatory asset/regulatory liability accounts, subject to regulatory approval and passed through to customers in future rates. The following table summarizes the fair value measurements of the Company’s long term debt and fuel derivative contracts based on the three levels that distinguish the level of pricing observability utilized in measuring fair value.

Caribbean Utilities Company, Ltd.
2016 Third Quarter Report l September 30, 2016 55
Financial Liability ($ thousands)
September 30, 2016
Total Fair Value
Level 1 -Quoted
Prices in active
markets for identical
assets
Level 2 - Significant
Other inputs
Level 3 - Significant
unobservable inputs Long term debt, including current portion 253,282 - 253,282 - Fuel Option Contracts1 121 - 121 - 1 Carrying value of fuel option contracts included in Accounts Payable and Accrued expenses
16. Financial Risk Management The Company is primarily exposed to credit risk, liquidity risk and interest rate risk as a result of holding financial instruments in the normal course of business. Credit Risk The Company is exposed to credit risk in the event of non-performance by counterparties to derivative financial instruments which include fuel option contracts. If counterparty fails to perform on its contractual obligation to deliver payment when the market price of fuel is greater than the strike price, the Company may find it necessary to purchase diesel at the market price, which will be higher than the contract price. The Company manages this credit risk associated with counterparties by conducting business with high credit-quality institutions. The Company does not expect any counterparties to fail to meet their obligations. There is risk that CUC may not be able to collect all of its accounts receivable and other assets. This does not represent a significant concentration of risk. The requirements for security deposits for certain customers, which are advance cash collections from customers to guarantee payment of electricity billings; reduces the exposure to credit risk. CUC manages credit risk primarily by executing its credit collection policy, including the requirement for security deposits, through the resources of its customer service department. Liquidity Risk The Company’s financial position could be adversely affected if it failed to arrange sufficient and cost-effective financing to fund, among other things, capital expenditures and the repayment of maturing debt. The ability to arrange such financing is subject to numerous factors, including the results of operations and financial position of the Company, conditions in the capital and bank credit markets, ratings assigned by ratings agencies and general economic conditions. These factors are mitigated by the legal requirement per the Licences which requires rates be set to enable the Company to achieve and maintain a sound credit rating in the financial markets of the world.

Caribbean Utilities Company, Ltd.
2016 Third Quarter Report l September 30, 2016 56
($millions) Total 2016 2017-
2018 2019-2020
2021 Onward Accounts payable and accrued expenses 25.3 25.3 Consumer's deposits and advances for construction 7.5 7.5 - - -Letter of credit 0.5 0.5 - - -Short term debt 30.0 30.0 - - -Long term debt 227.0 11.0 29.4 32.0 154.6Long term debt interest 93.9 11.3 20.3 16.7 45.6Total 384.2 85.6 49.7 48.7 200.2
Interest Rate Risk Long-term debt is issued at fixed interest rates, thereby minimising cash flow and interest rate exposure. The Company is primarily exposed to risks associated with fluctuating interest rates on its short-term borrowings and other variable interest credit facilities. The current amount of short-term borrowings is $30 million (nil: December 31, 2015). 17. Finance Charges The composition of finance charges were as follows:
Financing costs ($ thousands)
Three Months Ended
September 30, 2016
Three Months Ended
September 30, 2015
Nine Months Ended
September 30, 2016
Nine Months Ended
September 30, 2015 Interest costs - long-term debt 2,878 3,046 8,795 9,401 Other interest costs 152 46 342 135 AFUDC * (831) (1,448) (4,477) (3,388)
Total 2,199 1,644 4,660 6,148 *Refer to PP&E with regards to AFUDC (Note 7) methodology. 18. Defined Benefit Pension Plan The pension costs of the defined benefit plan are actuarially determined using the projected benefits method. Compensation expense of $0.1 million was recognised for the nine months ended September 30, 2016 ($0.1 million: nine months ended September 30, 2015). The composition of the expense was as follows:
($ thousands)
Three Months Ended
September 30, 2016
Three Months Ended
September 30, 2015
Nine Months Ended
September 30, 2016
Nine Months Ended
September 30, 2015 Interest cost 82 77 246 231 Expected return on plan assets (77) (80) (231) (240) Amortisation of actuarial losses 56 51 167 153 Total 61 48 182 144 This expense has been recorded in general and administrative expenses.

Caribbean Utilities Company, Ltd.
2016 Third Quarter Report l September 30, 2016 57
19. Foreign Exchange The closing rate of exchange on September 30, 2016 as reported by the Bank of Canada for the conversion of U.S. dollars into Canadian dollars was Cdn $1.3117 per US$1.00. The official exchange rate for the conversion of Cayman Islands dollars into U.S. dollars as determined by the Cayman Islands Monetary Authority is fixed at CI$1.00 per US$1.20. Thus, the rate of exchange as of September 30, 2016 for conversion of Cayman Islands dollars into Canadian dollars was Cdn $1.5740 per CI$1.00 (December 31, 2015: Cdn $1.6608). 20. Taxation Under current laws of the Cayman Islands, there are no income, estate, corporate, capital gains or other taxes payable by the Company. The Company is levied custom duties of $0.30 per IG of diesel fuel it imports. In addition, the Company pays customs duties of 15% on all other imports. 21. Commitments The Company has a primary fuel supply contract with RUBiS Cayman Islands Limited (“RUBiS”). Under the agreement the Company is committed to purchase approximately 60% of its diesel fuel requirements for its generating plant from RUBiS. The Company also has a secondary fuel supply contract with Sol Petroleum Cayman Limited (“Sol”) and is committed to purchase approximately 40% of the Company’s fuel requirements for its generating plant from Sol. Contracts with RUBiS and Sol were executed in September 2012. Both contracts expired on July 31, 2014 with the option to renew for two additional 18 month terms. The Company executed 18 month fuel supply contracts in September 2014 upon the expiration of its previous fuel supply contract with both RUBiS and Sol. The Company renewed its contract with RUBiS on September 1, 2016 for the final term which expires on August 31, 2017. The approximate remaining quantities per the fuel contract on an annual basis are, by fiscal year in millions of IGs: 2016 – 5.0 and 2017 – 13.4. The contract with Sol was renewed for the final term on March 1, 2016 which expires on August 31, 2017. The approximate remaining quantities per the fuel contract on an annual basis are, by fiscal year in millions of IGs: 2016 – 3.3 and 2017 – 8.9. Both contracts qualify for the Normal Purchase Normal Sale exemption under ASC 815 and do not qualify as derivatives. The point of delivery for fuel billing purposes remains at the Company’s North Sound Plant compound. The Company is also responsible for the management of the fuel pipeline and ownership of bulk fuel inventory at the North Sound Plant. As a result of the Company’s bulk fuel inventory, the value of CUC’s closing stock of fuel at September 30, 2016 was $2.1 million (December 31, 2015: $1.4 million). This amount includes all fuel held in CUC’s bulk fuel storage tanks, service tanks and day tanks located at the North Sound Plant. In December 2015 the ERA approved CUC’s 2016-2020 Capital Investment Plan in the amount of $204 million. Costs related to the competitive bid award to install 39.7 megawatts (“MW”) of generation capacity are included in the approved CIP in the amount of CUC’s competitive bid.

Caribbean Utilities Company, Ltd.
2016 Third Quarter Report l September 30, 2016 58
As a result of CUC’s successful bid, the Company entered into a design-build contract agreement for the generation project with the consortium of Burmeister & Wain Scandinavian Contractor A/S (“BWSC”) of Denmark and MAN Diesel & Turbo SE (“MAN”) of Germany. The agreement covers the purchase and turnkey installation of a new 39.7 MW power plant which is comprised of two 18.5 MW V48/60 medium-speed diesel generating units, one 2.7 MW waste heat recovery steam turbine, and associated auxiliary equipment. This contract with variation orders is now valued at approximately $56.1 million, previously $55.4 million. On this contract a total of $11.1 million was spent in 2014, an additional $38.8 million was spent during the year ended December 31, 2015, an additional $5.5 million was spent during the nine months ended September 30, 2016 and the remaining amount of $0.7 million is expected to be spent during the last three months of 2016. The total project cost was estimated at $85 million and the actual overall costs are expected to amount to $79.0 million. A total of $11.6 million was spent in 2014, an additional $47.9 million was spent on the project during the year ended December 31, 2015 and $18.5 million was spent during the nine months ended September 30, 2016 and the remaining amount of $1.0 million is expected to be spent during 2016. 22. Transactions with Related Parties
Miscellaneous receivables from Newfoundland Power, a subsidiary of Fortis Inc., totaling $10,526 were outstanding at September 30, 2016 (nil as at December 31, 2015). Miscellaneous payables to Fortis Turks & Caicos, a subsidiary of Fortis Inc., were nil at September 30, 2016 ($11,017 as at December 31, 2015 for travel expenses). Miscellaneous payables to Fortis Inc., the Company’s majority shareholder, was $173,981 at September 30, 2016 ($3,300 as at December 31, 2015) for travel expenses, hurricane preparedness, membership fees and insurance premiums. The Company rents office facilities from a related party, Adare Investments Ltd., on a 5 year lease agreement ending June 30, 2019; rent totaling at September 30, 2016 of $61,049. 23. Comparative Figures
Certain comparative figures have been reclassified to conform with current year disclosure.

Caribbean Utilities Company, Ltd.
2016 Third Quarter Report l September 30, 2016 59
Shareholder Information Shareholder Plans CUC offers its Shareholders a Dividend Reinvestment Plan. Please contact one of CUC’s Registrar and Transfer Agents or write to CUC’s Assistant to the Company Secretary if you would like to receive information about the plan or obtain an enrolment form. CUC also has a Customer Share Purchase Plan for customers resident in Grand Cayman. Please contact our Customer Service Department at (345) 949-5200 if you are interested in receiving details. Our Registrar and Transfer Agents are as follows: CST Trust Company P.O. Box 700, Station B Montreal, QC H3B 3K3 Canada North America toll free: 1-800-387-0825 Direct: (416) 682-3860 Fax: 1-888-249-6189 E-mail: [email protected] Caribbean Utilities Company, Ltd. Company Secretary P.O. Box 38 Grand Cayman KY1-1101 CAYMAN ISLANDS Tel: (345) 949-5200 Fax: (345) 949-4621 E-mail: [email protected] Website: www.cuc-cayman.com If you require further information or have any questions regarding CUC’s Class A Ordinary Shares (listed in U.S. funds on the Toronto Stock Exchange), please contact: Caribbean Utilities Company, Ltd. Assistant to the Company Secretary P.O. Box 38 Grand Cayman KY1-1101 CAYMAN ISLANDS Tel: (345) 949-5200 Fax: (345) 949-4621 E-mail: [email protected] Website: www.cuc-cayman.com

Caribbean Utilities Company, Ltd.457 North Sound Road, P.O. Box 38, Grand Cayman KY1-1101, CAYMAN ISLANDS
Tel: (345) 949-5200 p Fax: (345) 949-4621E-mail: [email protected] p Website: www.cuc-cayman.com