trait-level paranoia shapes inter-subject synchrony in ... · 1 trait-level paranoia shapes...
TRANSCRIPT

1
Trait-level paranoia shapes inter-subject synchrony in brain activity during an 1
ambiguous social narrative 2
3
Emily S. Finn*1, Philip R. Corlett2, Gang Chen3, Peter A. Bandettini1, R. Todd Constable4 4
5 1Section on Functional Imaging Methods, Laboratory of Brain and Cognition, National Institute 6
of Mental Health; Bethesda, Md. 7 2Department of Psychiatry, Yale School of Medicine; New Haven, Conn. 8 3Scientific and Statistical Computing Core, National Institute of Mental Health; Bethesda, Md. 9 4Department of Radiology and Biomedical Imaging, Yale School of Medicine, New Haven, 10
Conn. 11
12
*Corresponding author: [email protected] 13
14
ABSTRACT 15
Individuals often interpret the same event in different ways. How do personality traits modulate 16
patterns of brain activity evoked by a complex stimulus? Participants listened to a narrative 17
during functional MRI describing a deliberately ambiguous social scenario, designed such that 18
some individuals would find it highly suspicious, while others less so. Using inter-subject 19
correlation analysis, we identified several brain areas that were differentially synchronized 20
during listening between participants with high- and low trait-level paranoia, including theory-21
of-mind regions. Event-related analysis indicated that while superior temporal cortex responded 22
reliably to mentalizing events in all participants, anterior temporal and medial prefrontal cortex 23
responded to such events only in high-paranoia individuals. Analyzing participants’ speech as 24
they freely recalled the narrative revealed semantic and syntactic features that also scaled with 25
paranoia. Results indicate that trait paranoia acts as an intrinsic ‘prime’, producing different 26
neural and behavioral responses to the same stimulus across individuals. 27
.CC-BY-NC-ND 4.0 International licensepeer-reviewed) is the author/funder. It is made available under aThe copyright holder for this preprint (which was not. http://dx.doi.org/10.1101/231738doi: bioRxiv preprint first posted online Dec. 13, 2017;

2
That two individuals may see the same event in different ways is a truism of human 28
nature. Examples are found at many scales, from low-level perceptual judgments to 29
interpretations of complex, extended scenarios. This latter phenomenon is known as the 30
“Rashomon effect”1 after a 1950 Japanese film in which four eyewitnesses give contradictory 31
accounts of a crime and its aftermath, raising the point that for multifaceted, emotionally charged 32
events, there may be no single version of the truth. 33
What accounts for these individual differences in interpretation? Assuming everyone has 34
access to the same perceptual information, personality traits may bias different individuals 35
toward one interpretation or another. Paranoia is one such trait, in that individuals with strong 36
paranoid tendencies may be more likely to assign a nefarious interpretation to otherwise neutral 37
events. While paranoia in its extreme is a hallmark symptom of schizophrenia and other 38
psychoses, trait-level paranoia, like many experiences and behaviors associated with psychiatric 39
illness, exists as a continuum rather than a dichotomy2,3. On a behavioral level, up to 30 percent 40
of people report experiencing certain types of paranoid thoughts (e.g., ‘I need to be on my guard 41
against others’) on a regular basis4 and trait-level paranoia in the population follows an 42
exponential, rather than bimodal, distribution5. 43
Few neuroimaging studies have investigated paranoia as a continuum between normality 44
and pathology; the majority simply contrast healthy controls and patients suffering from clinical 45
delusions. However, a handful of reports from subclinical populations describe patterns of brain 46
activity that scale parametrically with tendency toward paranoid or delusional ideation. For 47
example, it has been reported that higher-paranoia individuals show less activity in the medial 48
temporal lobe during memory retrieval and less activity in the cerebellum during sentence 49
completion6, less activity in temporal regions during social reflection7 and auditory oddball 50
detection8, but higher activity in the insula and medial prefrontal cortex during self-referential 51
processing9 and differential patterns of activity in these regions as well as the amygdala while 52
viewing emotional pictures10. 53
Such highly controlled paradigms enable precise inferences about evoked brain activity, 54
but potentially at the expense of real-world validity. For example, brain response to social threat 55
is often assessed with decontextualized static photographs of unfamiliar faces presented rapidly 56
in series (see 11 for a review). Compare this to threat detection in the real world, which involves 57
perceiving and interacting with both familiar and unfamiliar faces in a rich, dynamic social 58
.CC-BY-NC-ND 4.0 International licensepeer-reviewed) is the author/funder. It is made available under aThe copyright holder for this preprint (which was not. http://dx.doi.org/10.1101/231738doi: bioRxiv preprint first posted online Dec. 13, 2017;

3
context. Paranoid thoughts that eventually reach clinical significance usually have a slow, 59
insidious onset, involving complex interplay between a person’s intrinsic tendencies and his or 60
her experiences in the world. In studying paranoia and other trait-level individual differences, 61
then, is important to complement highly controlled paradigms with more naturalistic stimuli. 62
Narrative is an attractive paradigm for several reasons. First, narrative is an ecologically 63
valid way to study belief formation in action. Theories of fiction posit that readers model 64
narratives in a Bayesian framework in much the same way as real-world information12, and story 65
comprehension and theory-of-mind processes share overlapping neural resources13. Second, a 66
standardized narrative stimulus provides identical input, so any variation in interpretation reflects 67
individuals’ intrinsic biases in how they assign salience, learn and form beliefs. Third, from a 68
neuroimaging perspective, narrative listening is a continuous, engaging task that involves much 69
of the brain14 and yields data lending itself to innovative, data-driven analyses such as inter-70
subject correlation15,16. 71
Previous work has shown that experimenters can manipulate patterns of brain activity 72
during naturalistic stimuli by explicitly instructing participants to focus on different aspects of 73
the stimulus. For example, Cooper et al. showed that activity patterns in temporal and frontal 74
regions varied according to whether listeners were told to pay attention to action-, space- or time-75
related features of short stories17. Lahnakoski et al. showed participants the same movie twice, 76
asking them to adopt different perspectives each time, and found differences in neural synchrony 77
depending on which perspective had been taken; results were primarily in parahippocampal, 78
parietal and occipital regions18. Most recently, Yeshurun et al. presented participants with a 79
highly ambiguous story with at least two plausible—but very different—interpretations, and used 80
explicit primes to strongly bias each participant toward one interpretation or the other. Responses 81
in higher-order brain areas, including default mode, were more similar among participants who 82
had received the same prime, indicating that shared beliefs have a powerful effect on how 83
individuals perceive an identical stimulus19. However, while informative, these studies have all 84
relied on an explicit prime or instruction; they cannot explain why individuals often 85
spontaneously arrive at different interpretations of the same stimulus. 86
In this work, we use participants’ intrinsic personality traits as an implicit prime, relating 87
individual differences in trait-level paranoia to brain activity during a naturalistic task in which 88
participants are faced with complex, ambiguous social circumstances. Using a novel narrative 89
.CC-BY-NC-ND 4.0 International licensepeer-reviewed) is the author/funder. It is made available under aThe copyright holder for this preprint (which was not. http://dx.doi.org/10.1101/231738doi: bioRxiv preprint first posted online Dec. 13, 2017;

4
stimulus, we show that while much of the brain is synchronized across all participants during 90
story listening, stratifying participants based on trait-level paranoia reveals an additional set of 91
regions showing stereotyped activity specifically among high-paranoia individuals; many of 92
these are regions involved in theory-of-mind and mentalizing. An encoding model of the task 93
suggests that these regions, including the temporal pole and medial prefrontal cortex, are 94
particularly sensitive to “mentalizing events” when the main character is experiencing an 95
ambiguous social interaction or explicitly reasoning about other characters’ intentions. Finally, 96
we measured participants’ behavioral reactions to the narrative by analyzing their speech as they 97
freely recalled the story, and identified semantic and syntactic features that vary parametrically 98
with trait-level paranoia. Together, results indicate that trait-level paranoia modulates both neural 99
and behavioral responses to a single stimulus across individuals. 100
101
102
RESULTS 103
104
Behavioral data and task performance 105
We created an original, fictional narrative to serve as the stimulus for this study. The 106
narrative described a main character faced with a complex social scenario that was deliberately 107
ambiguous with respect to the intentions of certain characters; it was designed such that different 108
individuals would interpret the events as more nefarious and others as less so. A synopsis of the 109
story is given in Box 1. 110
Twenty-two healthy participants listened to a pre-recorded audio version of the narrative 111
(total duration = 21:50 min:sec, divided into three parts) during fMRI scanning. Following each 112
of the three parts, participants answered three challenging multiple-choice comprehension 113
questions to ensure they had been paying attention. Performance was very accurate (15 of the 22 114
subjects answered 9/9 [100%] questions correctly, while five answered 8/9 [89%] correctly and 115
two answered 7/9 [78%] correctly). Self-report data indicated that subjects generally found the 116
narrative engaging and easy to pay attention to (engagement rating on a scale of 1 to 5: mean = 117
3.8, s.d. = 0.96, median = 4, median absolute deviation [m.a.d.] = 0.72; attention rating: mean = 118
4.1, s.d. = 0.87, median = 4, m.a.d. = 0.66). 119
.CC-BY-NC-ND 4.0 International licensepeer-reviewed) is the author/funder. It is made available under aThe copyright holder for this preprint (which was not. http://dx.doi.org/10.1101/231738doi: bioRxiv preprint first posted online Dec. 13, 2017;
5
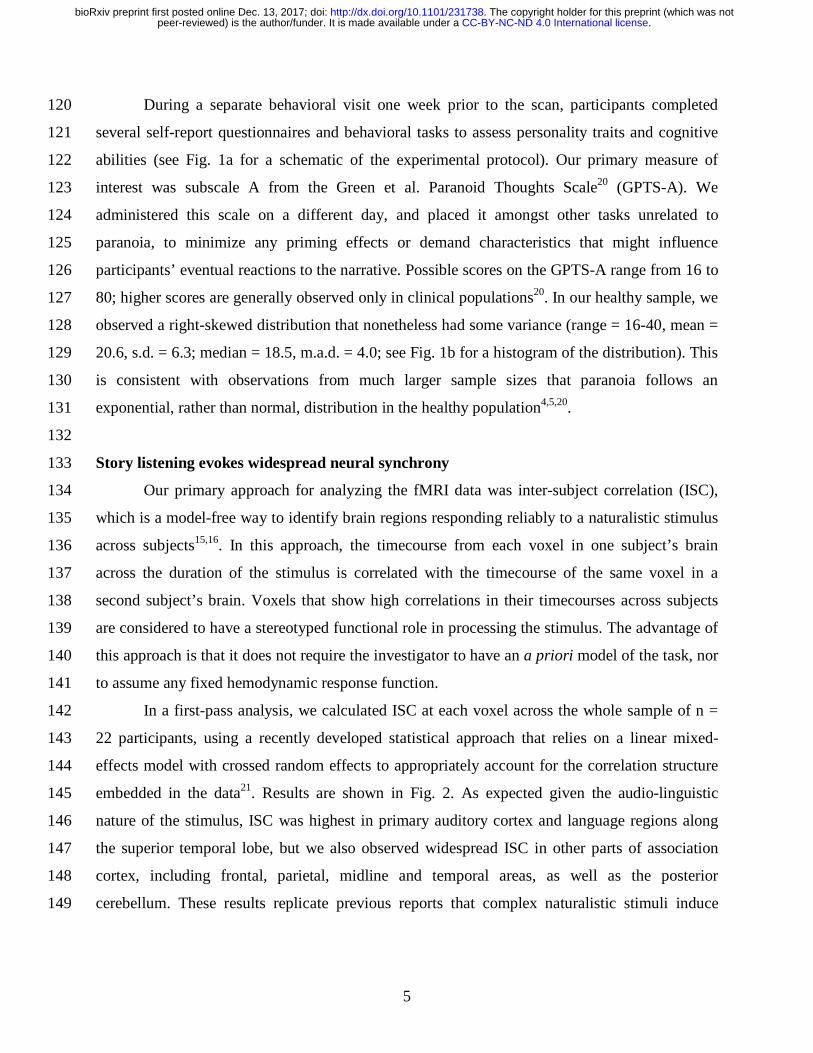
During a separate behavioral visit one week prior to the scan, participants completed 120
several self-report questionnaires and behavioral tasks to assess personality traits and cognitive 121
abilities (see Fig. 1a for a schematic of the experimental protocol). Our primary measure of 122
interest was subscale A from the Green et al. Paranoid Thoughts Scale20 (GPTS-A). We 123
administered this scale on a different day, and placed it amongst other tasks unrelated to 124
paranoia, to minimize any priming effects or demand characteristics that might influence 125
participants’ eventual reactions to the narrative. Possible scores on the GPTS-A range from 16 to 126
80; higher scores are generally observed only in clinical populations20. In our healthy sample, we 127
observed a right-skewed distribution that nonetheless had some variance (range = 16-40, mean = 128
20.6, s.d. = 6.3; median = 18.5, m.a.d. = 4.0; see Fig. 1b for a histogram of the distribution). This 129
is consistent with observations from much larger sample sizes that paranoia follows an 130
exponential, rather than normal, distribution in the healthy population4,5,20. 131
132
Story listening evokes widespread neural synchrony 133
Our primary approach for analyzing the fMRI data was inter-subject correlation (ISC), 134
which is a model-free way to identify brain regions responding reliably to a naturalistic stimulus 135
across subjects15,16. In this approach, the timecourse from each voxel in one subject’s brain 136
across the duration of the stimulus is correlated with the timecourse of the same voxel in a 137
second subject’s brain. Voxels that show high correlations in their timecourses across subjects 138
are considered to have a stereotyped functional role in processing the stimulus. The advantage of 139
this approach is that it does not require the investigator to have an a priori model of the task, nor 140
to assume any fixed hemodynamic response function. 141
In a first-pass analysis, we calculated ISC at each voxel across the whole sample of n = 142
22 participants, using a recently developed statistical approach that relies on a linear mixed-143
effects model with crossed random effects to appropriately account for the correlation structure 144
embedded in the data21. Results are shown in Fig. 2. As expected given the audio-linguistic 145
nature of the stimulus, ISC was highest in primary auditory cortex and language regions along 146
the superior temporal lobe, but we also observed widespread ISC in other parts of association 147
cortex, including frontal, parietal, midline and temporal areas, as well as the posterior 148
cerebellum. These results replicate previous reports that complex naturalistic stimuli induce 149
.CC-BY-NC-ND 4.0 International licensepeer-reviewed) is the author/funder. It is made available under aThe copyright holder for this preprint (which was not. http://dx.doi.org/10.1101/231738doi: bioRxiv preprint first posted online Dec. 13, 2017;

6
stereotyped responses across participants in not only the relevant primary cortex, but also higher-150
order brain regions14,15,22. 151
Also as expected, ISC was generally lower or absent in primary motor and somatosensory 152
cortex, although we did observe significant ISC in parts of primary visual cortex, despite the fact 153
that there was no timecourse of visual input during the story. (To encourage imagery and 154
engagement, we had participants fixate on a static photograph that was thematically relevant to 155
the story during listening, so the observed ISC in visual cortex may reflect similarities in the 156
timecourse of internally generated visualization across participants.) 157
158
Trait-level paranoia modulates neural response to the narrative 159
Having established that story listening evokes widespread neural synchrony across the 160
entire sample, we next sought to determine if there were brain regions whose degree of ISC was 161
modulated by trait-level paranoia. Using a median split of GPTS-A scores, we stratified our 162
sample into a low-paranoia (GPTS-A ≤ 18, n = 11) and high-paranoia (GPTS-A ≥ 19, n = 11) 163
group (Fig. 1b). We then used the same linear mixed-effects model described above formulated 164
as a two-group contrast to reveal areas that are differentially synchronized across paranoia 165
groups. 166
We were primarily interested in two contrasts. First, which voxels show greater ISC 167
among pairs of high-paranoia participants versus low-paranoia participants, or vice versa? This 168
contrast reveals regions that have a stereotyped response in one group but not the other, 169
suggesting a more prominent role for that region in processing the stimulus. Second, which 170
voxels show greater ISC among pairs of participants within the same paranoia group (i.e., high-171
high and low-low) than across groups (high-low)? This contrast reveals regions that have equally 172
stereotyped responses within each group, but whose response timecourses are qualitatively 173
different across groups, suggesting that such regions may be responding to different events 174
within the stimulus depending on paranoia level. These contrasts are schematized in Fig. 1c. 175
Results from both contrasts are shown in Fig. 3. In the first contrast, several regions 176
emerged as being more synchronized in the high-paranoia group relative to the low-paranoia 177
group. Significant clusters were found in the left temporal pole (Talairach coordinates for center 178
of mass: [+46.7, -10.0, -26.2]), left precuneus ([+10.8, +71.0, +35.9]), and two regions of the 179
right medial prefrontal cortex (mPFC; one anterior [-8.1, -46.9, +16.3] and one dorsal [+2.9, -180
.CC-BY-NC-ND 4.0 International licensepeer-reviewed) is the author/funder. It is made available under aThe copyright holder for this preprint (which was not. http://dx.doi.org/10.1101/231738doi: bioRxiv preprint first posted online Dec. 13, 2017;

7
14.8, +45.1]). Searches for these coordinates on Neurosynth, an automatic fMRI results 181
synthesizer for mapping between neural and cognitive states23, indicated that for the left temporal 182
pole and right anterior mPFC clusters, top meta-analysis terms included “mentalizing”, “mental 183
states”, “intentions”, and “theory mind”. There were no regions showing a statistically 184
significant difference in the reverse direction (low-paranoia > high-paranoia). 185
In the second contrast, a set of regions also emerged as being more synchronized within 186
paranoia groups than across paranoia groups. These were the left middle occipital gyrus 187
(Talairach coordinates for center of mass: [+31.3, +86.1, +14.0], Neurosynth: “objects”, “scene”, 188
“encoding”) and the right angular gyrus ([-44.8, +57.9, +37.9], Neurosynth: “beliefs”). There 189
were no regions showing a statistically significant difference in the reverse direction (across 190
groups > within groups), reinforcing the biological validity of stratifying based on trait-level 191
paranoia. 192
193
Establishing specificity to paranoia: control analyses 194
We conducted several control analyses to rule out the possibility that the observed group 195
differences were driven by a factor other than trait-level paranoia. (For all analyses in this 196
section, we checked for both categorical and continuous relationships with paranoia; full results 197
are reported in Table 1.) 198
For example, if the high-paranoia participants have better overall attentional and 199
cognitive abilities, they might simply be paying closer attention to the story, inflating ISC values 200
but not necessarily because of selective attention to ambiguous or suspicious details. However, 201
there were no differences between high- and low-paranoia participants on any of the cognitive 202
tasks we administered (verbal IQ, vocabulary, fluid intelligence or working memory), making it 203
unlikely that observed differences are due to trait-level differences in attention or cognition. As 204
for state-level attention during the story, there was no relationship between paranoia and number 205
of comprehension questions answered correctly, total word count during the recall task, or self-206
report measures of engagement and attention. We also explored potential imaging-based 207
confounds, and found that paranoia was not related to amount of head motion during the scan (as 208
measured by mean framewise displacement), number of censored frames, or temporal signal-to-209
noise ratio (tSNR). In terms of demographics, paranoia groups did not differ in age or sex 210
.CC-BY-NC-ND 4.0 International licensepeer-reviewed) is the author/funder. It is made available under aThe copyright holder for this preprint (which was not. http://dx.doi.org/10.1101/231738doi: bioRxiv preprint first posted online Dec. 13, 2017;

8
breakdown. Thus we are reasonably confident that the observed effects are driven by true trait-211
level differences in paranoia between individuals. 212
213
Probing response to mentalizing events using an encoding model of the task 214
Results of the first contrast from the two-group ISC analysis indicated that certain brain 215
regions showed a more stereotyped response in high-paranoia versus low-paranoia individuals. 216
What features of the narrative were driving activity in these regions? In theory, ISC allows for 217
reverse correlation, in which peaks of activation in a given region’s timecourse are used to 218
recover the stimulus events that evoked them15. In practice, this is often difficult. Especially with 219
narrative stimuli, in which structure is built up over relatively long timescales14, it is challenging 220
to pinpoint exactly which event—word, phrase, sentence—triggered an increase in BOLD 221
activity. 222
Rather than rely on reverse correlation, which is a purely data-driven decoding approach, 223
we took an encoding approach: we created a model of the task based on events that we 224
hypothesized would stimulate differing interpretations across individuals, and evaluated the 225
degree to which certain regions of interest (ROIs) responded to such events, using a standard 226
general linear model (GLM) analysis. Specifically, we labeled sentences in the story when the 227
main character was experiencing an ambiguous (i.e., possibly suspicious) social interaction, 228
and/or sentences when she was explicitly reasoning about the intentions of other characters. For 229
brevity, we refer to these timepoints as “mentalizing events.” In creating the regressor, all events 230
were time-locked to the end of the last word of the labeled sentences, when participants are 231
presumably evaluating information they just heard and integrating it into their situation model of 232
the story. 233
We hypothesized that the two ROIs from the previous analysis known to be involved in 234
theory-of-mind and mentalizing, specifically the left temporal pole and right medial PFC, would 235
show higher evoked activity to mentalizing events in individuals with higher trait-level paranoia. 236
We included two additional ROIs, the left posterior superior temporal sulcus and left Heschl’s 237
gyrus, as a positive and negative control, respectively. We selected the left posterior superior 238
temporal sulcus as a positive control because of its well-established role in theory-of-mind and 239
mentalizing processes, and the fact that it emerged as highly synchronized across all participants 240
(cf. Fig. 2) but did not show a group difference (cf. Fig. 3); thus we hypothesized that this region 241
.CC-BY-NC-ND 4.0 International licensepeer-reviewed) is the author/funder. It is made available under aThe copyright holder for this preprint (which was not. http://dx.doi.org/10.1101/231738doi: bioRxiv preprint first posted online Dec. 13, 2017;
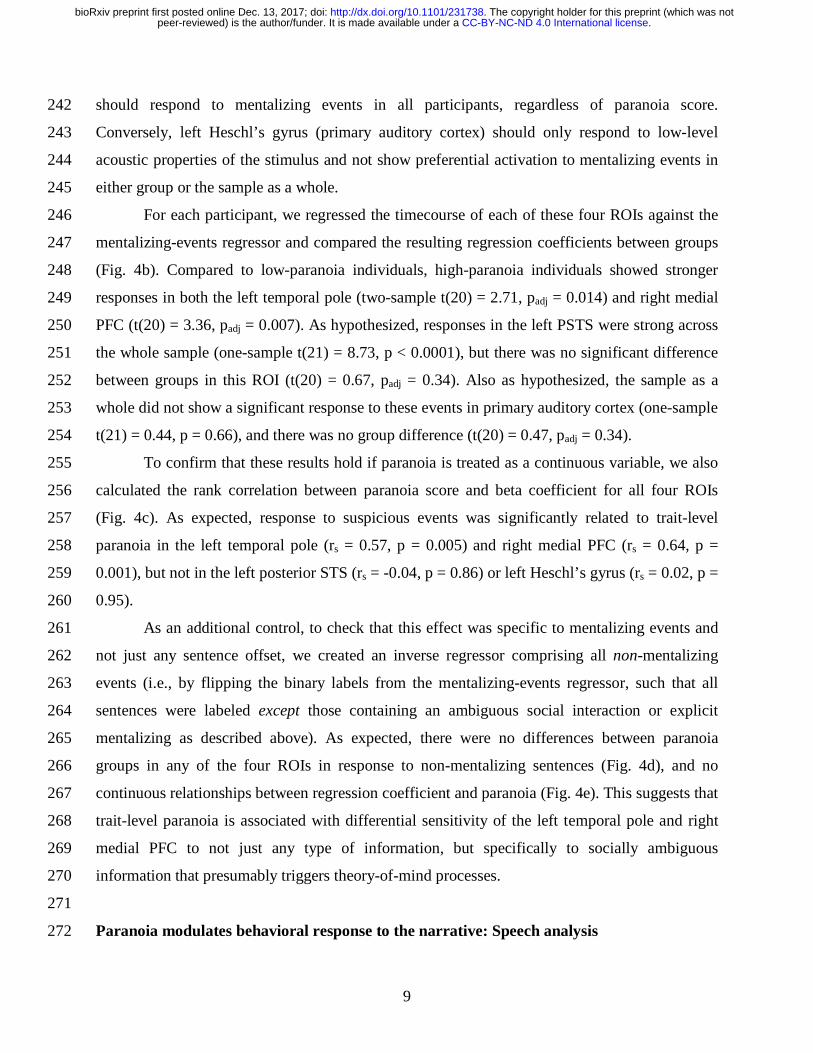
9
should respond to mentalizing events in all participants, regardless of paranoia score. 242
Conversely, left Heschl’s gyrus (primary auditory cortex) should only respond to low-level 243
acoustic properties of the stimulus and not show preferential activation to mentalizing events in 244
either group or the sample as a whole. 245
For each participant, we regressed the timecourse of each of these four ROIs against the 246
mentalizing-events regressor and compared the resulting regression coefficients between groups 247
(Fig. 4b). Compared to low-paranoia individuals, high-paranoia individuals showed stronger 248
responses in both the left temporal pole (two-sample t(20) = 2.71, padj = 0.014) and right medial 249
PFC (t(20) = 3.36, padj = 0.007). As hypothesized, responses in the left PSTS were strong across 250
the whole sample (one-sample t(21) = 8.73, p < 0.0001), but there was no significant difference 251
between groups in this ROI (t(20) = 0.67, padj = 0.34). Also as hypothesized, the sample as a 252
whole did not show a significant response to these events in primary auditory cortex (one-sample 253
t(21) = 0.44, p = 0.66), and there was no group difference (t(20) = 0.47, padj = 0.34). 254
To confirm that these results hold if paranoia is treated as a continuous variable, we also 255
calculated the rank correlation between paranoia score and beta coefficient for all four ROIs 256
(Fig. 4c). As expected, response to suspicious events was significantly related to trait-level 257
paranoia in the left temporal pole (rs = 0.57, p = 0.005) and right medial PFC (rs = 0.64, p = 258
0.001), but not in the left posterior STS (rs = -0.04, p = 0.86) or left Heschl’s gyrus (rs = 0.02, p = 259
0.95). 260
As an additional control, to check that this effect was specific to mentalizing events and 261
not just any sentence offset, we created an inverse regressor comprising all non-mentalizing 262
events (i.e., by flipping the binary labels from the mentalizing-events regressor, such that all 263
sentences were labeled except those containing an ambiguous social interaction or explicit 264
mentalizing as described above). As expected, there were no differences between paranoia 265
groups in any of the four ROIs in response to non-mentalizing sentences (Fig. 4d), and no 266
continuous relationships between regression coefficient and paranoia (Fig. 4e). This suggests that 267
trait-level paranoia is associated with differential sensitivity of the left temporal pole and right 268
medial PFC to not just any type of information, but specifically to socially ambiguous 269
information that presumably triggers theory-of-mind processes. 270
271
Paranoia modulates behavioral response to the narrative: Speech analysis 272
.CC-BY-NC-ND 4.0 International licensepeer-reviewed) is the author/funder. It is made available under aThe copyright holder for this preprint (which was not. http://dx.doi.org/10.1101/231738doi: bioRxiv preprint first posted online Dec. 13, 2017;

10
Having established that paranoia levels modulate individual participants’ brain responses 273
to an ambiguous narrative, we next sought to determine if this trait also modulates behavioral 274
responses to the narrative. In other words, does trait-level (intrinsic) paranoia bear upon state-275
related (stimulus-evoked) paranoia? If the observed differences in neural activity propagate up to 276
conscious perception and interpretation of the stimulus, then participants’ subjective experiences 277
of the narrative should also bear a signature of trait-level paranoia. 278
Immediately following the scan, participants completed a post-narrative battery that 279
consisted of free-speech prompts followed by multiple-choice items to characterize their beliefs 280
and feelings about the story. For the first item, participants were asked to retell the story in as 281
much detail as they could remember, and their speech was recorded. Participants were allowed to 282
speak for as long as they wished on whatever aspects of the story they chose. Without guidance 283
from the experimenter, participants recalled the story in rich detail, speaking an average of 1,081 284
words (range = 399-3,185, s.d. = 610). 285
Audio recordings of participants’ speech were transcribed and submitted to the language 286
analysis software Linguistic Inquiry and Word Count (LIWC; 24. The output of LIWC is one 287
vector per participant describing the percentage of speech falling into various semantic and 288
syntactic categories. Example semantic categories are positive emotion (‘love’, ‘nice’), money 289
(‘cash’, ‘owe’), and body (‘hands’, ‘face’), while syntactic categories correspond to parts of 290
speech such as pronouns, adjectives and prepositions; there are 67 categories in total. 291
Using partial least-squares regression, we searched for relationships between speech 292
features and trait-level paranoia. A first-pass analysis revealed that more than 72 percent of the 293
variance in paranoia score could be accounted for by the first component of speech features; the 294
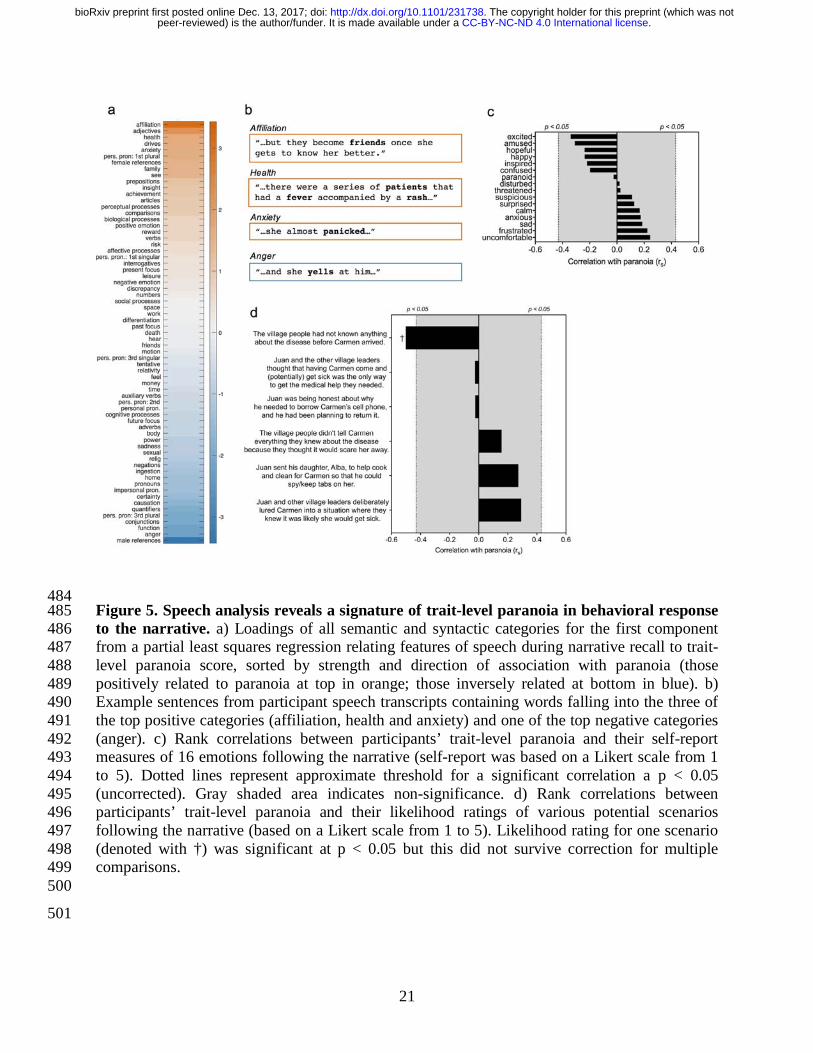
loadings of semantic and syntactic categories for this component are visualized in Fig. 5a. The 295
feature with the highest positive loading—indicating a positive relationship with paranoia—was 296
affiliation, a category including words describing social and familial relationships (e.g., ‘ally’, 297
‘friend’, ‘social’). Also associated with high trait-level paranoia were frequent use of adjectives 298
as well as anxiety- and risk-related words (e.g., ‘bad’, ‘crisis’); drives, a meta-category that 299
includes words concerning affiliation, achievement, power, reward and risk; and health-related 300
words (e.g., ‘clinic’, ‘fever’, ‘infected’; recall that the story featured a doctor treating patients in 301
a remote village; cf. Box 1). Features with strongly negative loadings—indicating an inverse 302
relationship with paranoia—included male references (e.g., ‘him’, ‘his’, ‘man’, ‘father’); anger-303
.CC-BY-NC-ND 4.0 International licensepeer-reviewed) is the author/funder. It is made available under aThe copyright holder for this preprint (which was not. http://dx.doi.org/10.1101/231738doi: bioRxiv preprint first posted online Dec. 13, 2017;
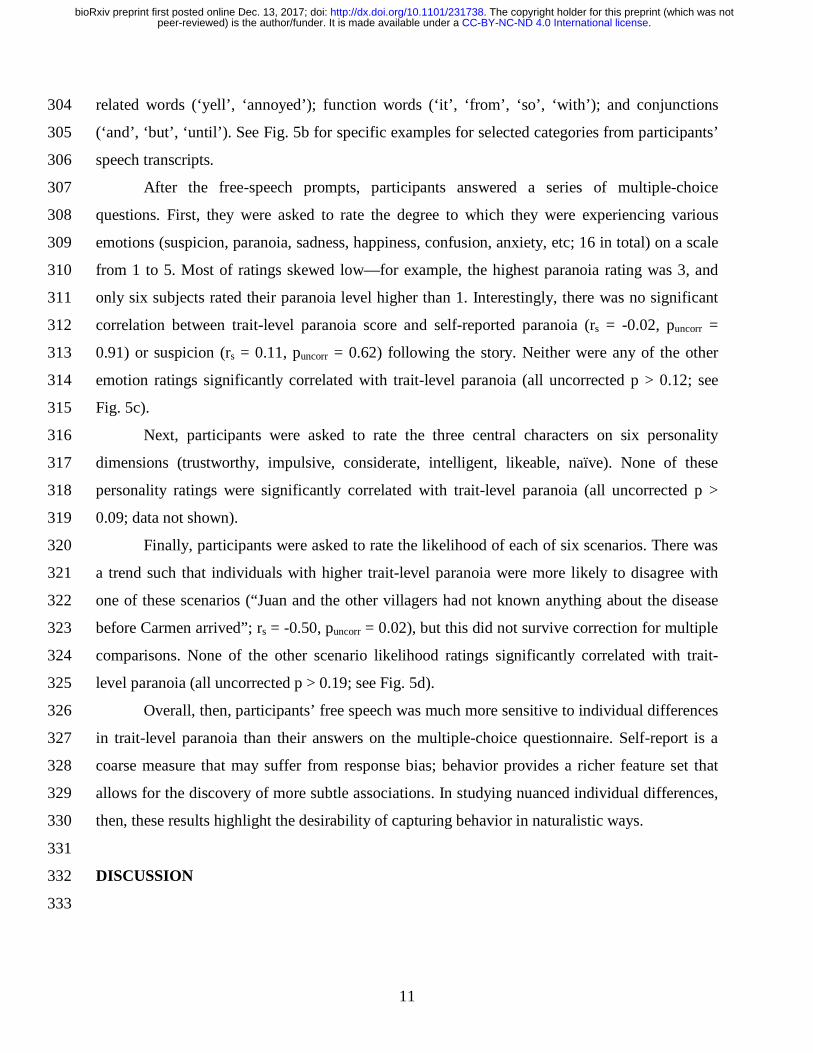
11
related words (‘yell’, ‘annoyed’); function words (‘it’, ‘from’, ‘so’, ‘with’); and conjunctions 304
(‘and’, ‘but’, ‘until’). See Fig. 5b for specific examples for selected categories from participants’ 305
speech transcripts. 306
After the free-speech prompts, participants answered a series of multiple-choice 307
questions. First, they were asked to rate the degree to which they were experiencing various 308
emotions (suspicion, paranoia, sadness, happiness, confusion, anxiety, etc; 16 in total) on a scale 309
from 1 to 5. Most of ratings skewed low—for example, the highest paranoia rating was 3, and 310
only six subjects rated their paranoia level higher than 1. Interestingly, there was no significant 311
correlation between trait-level paranoia score and self-reported paranoia (rs = -0.02, puncorr = 312
0.91) or suspicion (rs = 0.11, puncorr = 0.62) following the story. Neither were any of the other 313
emotion ratings significantly correlated with trait-level paranoia (all uncorrected p > 0.12; see 314
Fig. 5c). 315
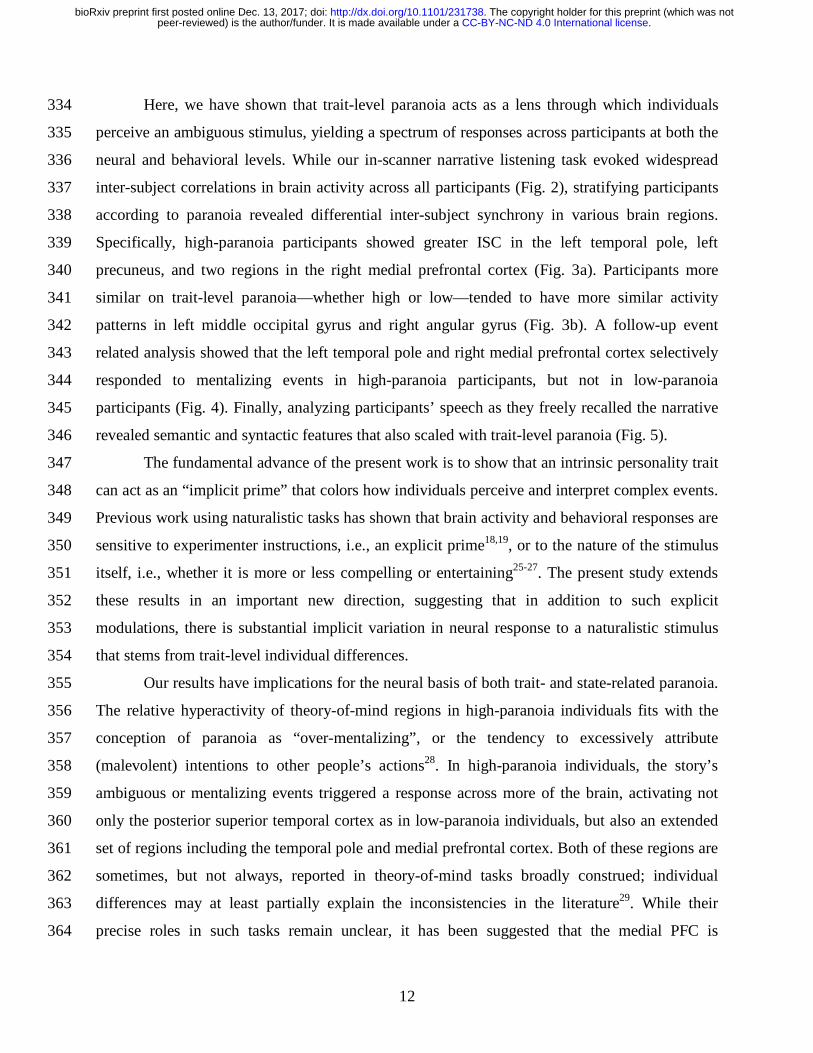
Next, participants were asked to rate the three central characters on six personality 316
dimensions (trustworthy, impulsive, considerate, intelligent, likeable, naïve). None of these 317
personality ratings were significantly correlated with trait-level paranoia (all uncorrected p > 318
0.09; data not shown). 319
Finally, participants were asked to rate the likelihood of each of six scenarios. There was 320
a trend such that individuals with higher trait-level paranoia were more likely to disagree with 321
one of these scenarios (“Juan and the other villagers had not known anything about the disease 322
before Carmen arrived”; rs = -0.50, puncorr = 0.02), but this did not survive correction for multiple 323
comparisons. None of the other scenario likelihood ratings significantly correlated with trait-324
level paranoia (all uncorrected p > 0.19; see Fig. 5d). 325
Overall, then, participants’ free speech was much more sensitive to individual differences 326
in trait-level paranoia than their answers on the multiple-choice questionnaire. Self-report is a 327
coarse measure that may suffer from response bias; behavior provides a richer feature set that 328
allows for the discovery of more subtle associations. In studying nuanced individual differences, 329
then, these results highlight the desirability of capturing behavior in naturalistic ways. 330
331
DISCUSSION 332
333
.CC-BY-NC-ND 4.0 International licensepeer-reviewed) is the author/funder. It is made available under aThe copyright holder for this preprint (which was not. http://dx.doi.org/10.1101/231738doi: bioRxiv preprint first posted online Dec. 13, 2017;
12
Here, we have shown that trait-level paranoia acts as a lens through which individuals 334
perceive an ambiguous stimulus, yielding a spectrum of responses across participants at both the 335
neural and behavioral levels. While our in-scanner narrative listening task evoked widespread 336
inter-subject correlations in brain activity across all participants (Fig. 2), stratifying participants 337
according to paranoia revealed differential inter-subject synchrony in various brain regions. 338
Specifically, high-paranoia participants showed greater ISC in the left temporal pole, left 339
precuneus, and two regions in the right medial prefrontal cortex (Fig. 3a). Participants more 340
similar on trait-level paranoia—whether high or low—tended to have more similar activity 341
patterns in left middle occipital gyrus and right angular gyrus (Fig. 3b). A follow-up event 342
related analysis showed that the left temporal pole and right medial prefrontal cortex selectively 343
responded to mentalizing events in high-paranoia participants, but not in low-paranoia 344
participants (Fig. 4). Finally, analyzing participants’ speech as they freely recalled the narrative 345
revealed semantic and syntactic features that also scaled with trait-level paranoia (Fig. 5). 346
The fundamental advance of the present work is to show that an intrinsic personality trait 347
can act as an “implicit prime” that colors how individuals perceive and interpret complex events. 348
Previous work using naturalistic tasks has shown that brain activity and behavioral responses are 349
sensitive to experimenter instructions, i.e., an explicit prime18,19, or to the nature of the stimulus 350
itself, i.e., whether it is more or less compelling or entertaining25-27. The present study extends 351
these results in an important new direction, suggesting that in addition to such explicit 352
modulations, there is substantial implicit variation in neural response to a naturalistic stimulus 353
that stems from trait-level individual differences. 354
Our results have implications for the neural basis of both trait- and state-related paranoia. 355
The relative hyperactivity of theory-of-mind regions in high-paranoia individuals fits with the 356
conception of paranoia as “over-mentalizing”, or the tendency to excessively attribute 357
(malevolent) intentions to other people’s actions28. In high-paranoia individuals, the story’s 358
ambiguous or mentalizing events triggered a response across more of the brain, activating not 359
only the posterior superior temporal cortex as in low-paranoia individuals, but also an extended 360
set of regions including the temporal pole and medial prefrontal cortex. Both of these regions are 361
sometimes, but not always, reported in theory-of-mind tasks broadly construed; individual 362
differences may at least partially explain the inconsistencies in the literature29. While their 363
precise roles in such tasks remain unclear, it has been suggested that the medial PFC is 364
.CC-BY-NC-ND 4.0 International licensepeer-reviewed) is the author/funder. It is made available under aThe copyright holder for this preprint (which was not. http://dx.doi.org/10.1101/231738doi: bioRxiv preprint first posted online Dec. 13, 2017;

13
specifically involved in meta-cognitive processes of reflecting on feelings and intentions30, and 365
that the temporal pole is responsible for binding complex stimuli to emotional responses31. It is 366
conceivable that both of these processes are more active in individuals with higher trait-level 367
paranoia. 368
While the present study included only healthy controls with subclinical paranoia, it may 369
provide a useful starting point for the study of paranoid or persecutory delusions in schizophrenia 370
and related illnesses. Delusions with a persecutory theme account for roughly 70-80 percent of 371
all delusions. This high prevalence is stable across time32 and geo-cultural factors33-36, suggesting 372
a strong biological component. Persecutory delusions are also the type most strongly associated 373
with anger and most likely to be acted upon, especially in a violent manner37. Thus, 374
understanding the neurobiological basis of paranoid delusions is a critical problem in psychiatry. 375
But because delusions typically have a slow, insidious onset, it is nearly impossible to 376
retrospectively recover specific triggering events in individual patients. A related challenge is 377
that while thematically similar, each patient’s delusion is unique in its details. Thus it is difficult 378
to devise material that will evoke comparable responses across patients. One solution is to craft a 379
model context using a stimulus that is ambiguous yet controlled—i.e., identical across 380
participants, permitting meaningful comparisons of time-locked evoked activity— such as the 381
one used in this work. Future work should study patient populations using paradigms such as this 382
one, as they may shed light on mechanisms of delusion formation and/or provide eventual 383
diagnostic or prognostic value. 384
While there is little work investigating how brain activity is altered during a naturalistic 385
stimulus in psychiatric populations, a handful of studies have used such paradigms in autism, 386
finding that ISC is lower among autistic individuals than typically developing controls while 387
watching movies of social interactions38-40. Notably, the degree of asynchrony scales with 388
autism-like phenotype severity in both the patient and control groups39. It is interesting to 389
juxtapose these reports with the present results, in which individuals with a stronger paranoia 390
phenotype were more synchronized during exposure to socially relevant material; ultimately, this 391
fits with the notion of autism and psychosis as opposite ends of the same spectrum, involving 392
hypo- and hyper-mentalization, respectively41,42. Eventually, it may be possible to combine a 393
naturalistic stimulus with an ISC-based analysis that cuts across diagnostic labels to examine 394
how the synchrony of neural response varies across both healthy and impaired populations. 395
.CC-BY-NC-ND 4.0 International licensepeer-reviewed) is the author/funder. It is made available under aThe copyright holder for this preprint (which was not. http://dx.doi.org/10.1101/231738doi: bioRxiv preprint first posted online Dec. 13, 2017;

14
From a methodological perspective, much of the research using fMRI to study individual 396
differences has shifted focus in recent years from activation measured in task-based conditions to 397
functional connectivity measured predominantly at rest43-47. Both suffer from limitations: 398
traditional tasks are tightly controlled paradigms that often lack ecological validity; resting-state 399
scans, on the other hand, are entirely unconstrained, making it difficult to separate signal from 400
noise. Furthermore, very few resting-state scans use behavioral monitoring, so while they may 401
detect individual or group differences, it is usually impossible to recover the nature of the mental 402
events that give rise to such differences. Naturalistic tasks may be a happy medium for studying 403
both group-level functional brain organization as well as individual differences48,49. We and 404
others have argued that such tasks could serve as a “stress test” to draw out individual variation 405
in brain and behaviors of interest50-53, enhancing the signal-to-noise ratio in the search for 406
neuroimaging-based biomarkers and permitting more precise inferences about the sources of 407
individual differences in neural activity. 408
.CC-BY-NC-ND 4.0 International licensepeer-reviewed) is the author/funder. It is made available under aThe copyright holder for this preprint (which was not. http://dx.doi.org/10.1101/231738doi: bioRxiv preprint first posted online Dec. 13, 2017;

15
Acknowledgements 409
The authors thank Paul Taylor for advice on preprocessing pipelines for naturalistic task data, 410
and Javier Gonzalez-Castillo, Daniel Handwerker, David Jangraw, Peter Molfese, Monica 411
Rosenberg, and Tamara Vanderwal for helpful discussion. 412
413
Author contributions 414
E.S.F, P.R.C and R.T.C conceived the study. E.S.F. developed experimental materials and 415
performed data collection. E.S.F. and G.C. analyzed the data. E.S.F., P.R.C., P.A.B. and R.T.C 416
interpreted results. E.S.F. wrote the manuscript with comments from all other authors. 417
418
Competing financial interests 419
The authors have no competing financial interests to declare. 420
421
.CC-BY-NC-ND 4.0 International licensepeer-reviewed) is the author/funder. It is made available under aThe copyright holder for this preprint (which was not. http://dx.doi.org/10.1101/231738doi: bioRxiv preprint first posted online Dec. 13, 2017;

16
422
Carmen is a young American doctor who journeys to the Amazon to work in a small village health clinic. There, she meets Juan, a village leader, and Alba, a young girl whom she befriends. Soon after arriving, Carmen sees a series of patients with a very serious—and seemingly highly contagious—fever. At times it seems that Juan and the villagers are fully open and forthcoming with Carmen, while at other times their behavior is harder to interpret and it seems as if they may be hiding something. Carmen begins to wonder if the villagers had known about the disease before she arrived, and if she had somehow been deliberately lured to the remote location. The story ends abruptly, when Carmen discovers that Alba herself is sick, and that unbeknownst to her, Alba is Juan’s daughter. Carmen fears she may have already been infected, and wonders what to do next.
Box 1. Synopsis of fictional narrative used as a stimulus.
.CC-BY-NC-ND 4.0 International licensepeer-reviewed) is the author/funder. It is made available under aThe copyright holder for this preprint (which was not. http://dx.doi.org/10.1101/231738doi: bioRxiv preprint first posted online Dec. 13, 2017;

17
423
Figure 1. Experimental protocol, distribution of trait-level paranoia and inter-subject 424 correlation analysis. a) Schematic of experimental protocol. Participants came to the laboratory 425 for an initial behavioral visit, during which they completed several computerized cognitive tasks 426 as well as self-report psychological scales, one of which was the Green et al. Paranoid Thoughts 427 Scale(GPTS). To minimize demand characteristics and/or priming effects, the fMRI scan visit 428 took place approximately one week later. During this visit, subjects listened to an ambiguous 429 social narrative in the scanner and then completed an extensive post-narrative battery consisting 430 of both free-speech prompts and multiple-choice items to characterize their recollections, 431 feelings and beliefs toward the story. b) Distribution of scores on the GPTS-A subscale across n 432 = 22 participants, and median split used to stratify participants into low (≤ 18, blue) and high (≥ 433 19, orange) trait-level paranoia. c) Schematic of inter-subject correlation (ISC) analysis. 434 Following normalization to a standard template, the inter-subject correlation of activation 435 timecourse during narrative listening was computed for each voxel (v, yellow square; enlarged 436 relative to true voxel size for visualization purposes) for each pair of subjects (i,j), resulting in a 437 matrix of pairwise correlation coefficients (r values). These values were then compared across 438 paranoia groups using voxelwise linear mixed-effects models with crossed random effects to 439 account for the non-independent structure of the correlation matrix21. 440
441
.CC-BY-NC-ND 4.0 International licensepeer-reviewed) is the author/funder. It is made available under aThe copyright holder for this preprint (which was not. http://dx.doi.org/10.1101/231738doi: bioRxiv preprint first posted online Dec. 13, 2017;

18
442
Figure 2. Narrative listening evokes widespread inter-subject correlation across the whole 443 sample. Voxels showing significant inter-subject correlation (ISC) across the timecourse of 444 narrative listening in all participants (n = 22). As expected, the highest ISC values were 445 observed in auditory cortex, but several regions of association cortex in the temporal, parietal, 446 frontal and cingulate lobes as well as the cerebellum also showed high synchrony. Also included 447 are three representative axial slices from the cerebellum. Results are displayed at a voxelwise 448 false-discovery rate (FDR) threshold of q < 0.001) 449 450
.CC-BY-NC-ND 4.0 International licensepeer-reviewed) is the author/funder. It is made available under aThe copyright holder for this preprint (which was not. http://dx.doi.org/10.1101/231738doi: bioRxiv preprint first posted online Dec. 13, 2017;

19
451 452 Figure 3. Trait-level paranoia modulates patterns of inter-subject correlation during 453 narrative listening. a) Results from a whole-brain, voxelwise contrast revealing brain regions 454 that are more synchronized between pairs of high-paranoia participants than pairs of low-455 paranoia participants (contrast schematized in top panel, cf. Fig. 1C). Significant clusters were 456 detected in the left temporal pole, two regions in the right medial prefrontal cortex (one anterior 457 and one dorsal and posterior), and the left precuneus. No clusters were detected in the opposite 458 direction (low > high). b) Results from a whole-brain, voxelwise contrast revealing brain regions 459 that are more synchronized within paranoia groups (i.e., high-high and low-low pairs) than 460 across paranoia groups (i.e., high-low pairs; contrast schematized in top panel, cf. Fig 1C). 461 Clusters were detected in the right angular gyrus and left lateral occipital cortex. For both 462 contrasts, results are shown at an initial threshold of p < 0.002 with cluster correction 463 corresponding to p < 0.05. 464 465
.CC-BY-NC-ND 4.0 International licensepeer-reviewed) is the author/funder. It is made available under aThe copyright holder for this preprint (which was not. http://dx.doi.org/10.1101/231738doi: bioRxiv preprint first posted online Dec. 13, 2017;

20
466 Figure 4. Response to mentalizing events is stronger in high- compared to low-paranoia 467 individuals. a) Regions of interest (ROIs) for the event-related analysis. b) Comparison of beta 468 coefficients for each ROI for the mentalizing-events regressor between paranoia groups (low, 469 blue; high, orange). Each dot represents a subject. Boxes represent the median and 25th/75th 470 percentiles, and whiskers represent the minimum and maximum. *p = 0.01; **p < 0.007; n.s., not 471 significant (p-values adjusted for four comparisons). c) Beta coefficients for the mentalizing-472 events regressor plotted against paranoia score treated as a continuous variable (coefficients are 473 the same as in (b)). Top panel: the two ROIs in which beta coefficient was hypothesized to scale 474 with trait-level paranoia (left temporal pole and right medial PFC). Bottom panel: the two control 475 ROIs (left posterior superior temporal sulcus and left Heschl’s gyrus). Continuous relationships 476 between these two variables were assessed with rank (Spearman) correlation, rs. d) Comparison 477 of beta coefficients for each ROI for the non-mentalizing-events regressor (the inverse of the 478 mentalizing-events regressor shown in (b)). Each dot represents a subject. Boxes represent the 479 median and 25th/75th percentiles, and whiskers represent the minimum and maximum. e) Beta 480 coefficients for the non-mentalizing-events regressor plotted against paranoia score treated as a 481 continuous variable (coefficients are the same as in (c)). Left and right panels as in (c). 482 483
.CC-BY-NC-ND 4.0 International licensepeer-reviewed) is the author/funder. It is made available under aThe copyright holder for this preprint (which was not. http://dx.doi.org/10.1101/231738doi: bioRxiv preprint first posted online Dec. 13, 2017;
21
484 Figure 5. Speech analysis reveals a signature of trait-level paranoia in behavioral response 485 to the narrative. a) Loadings of all semantic and syntactic categories for the first component 486 from a partial least squares regression relating features of speech during narrative recall to trait-487 level paranoia score, sorted by strength and direction of association with paranoia (those 488 positively related to paranoia at top in orange; those inversely related at bottom in blue). b) 489 Example sentences from participant speech transcripts containing words falling into the three of 490 the top positive categories (affiliation, health and anxiety) and one of the top negative categories 491 (anger). c) Rank correlations between participants’ trait-level paranoia and their self-report 492 measures of 16 emotions following the narrative (self-report was based on a Likert scale from 1 493 to 5). Dotted lines represent approximate threshold for a significant correlation a p < 0.05 494 (uncorrected). Gray shaded area indicates non-significance. d) Rank correlations between 495 participants’ trait-level paranoia and their likelihood ratings of various potential scenarios 496 following the narrative (based on a Likert scale from 1 to 5). Likelihood rating for one scenario 497 (denoted with †) was significant at p < 0.05 but this did not survive correction for multiple 498 comparisons. 499 500
501
.CC-BY-NC-ND 4.0 International licensepeer-reviewed) is the author/funder. It is made available under aThe copyright holder for this preprint (which was not. http://dx.doi.org/10.1101/231738doi: bioRxiv preprint first posted online Dec. 13, 2017;

22
502
Table 1. Trait paranoia was unrelated to potential confounding variables. There were no 503 significant differences between high- and low-paranoia participants in terms of demographics, 504 cognitive abilities, fMRI data quality or attention to the stimulus. Categorical comparisons were 505 carried out using Student’s t-tests between the low and high paranoia groups as determined by 506 median split (degrees of freedom for all t-tests = 20). Continuous comparisons were carried out 507 using Spearman (rank) correlation between raw paranoia score and the variable of interest. All p-508 values are raw (uncorrected). *Measured with a chi-squared test. FD, framewise displacement; 509 tSNR, temporal signal-to-noise ratio; WRAT, Wide Range Achievement Test. 510
511
.CC-BY-NC-ND 4.0 International licensepeer-reviewed) is the author/funder. It is made available under aThe copyright holder for this preprint (which was not. http://dx.doi.org/10.1101/231738doi: bioRxiv preprint first posted online Dec. 13, 2017;
23
METHODS 512
513
Participants 514
A total of 23 healthy volunteers participated in this study. Data from one participant was 515
excluded due to excessive head motion and self-reported falling asleep during the last third of the 516
narrative. Thus, the final data set used for analysis contained 22 participants (11 females; age 517
range = 19-35 years, mean = 27, s.d. = 4.4). All participants were right-handed, native speakers 518
of English, with no history of neurological disease or injury, and were not on psychoactive 519
medication at the time of scanning. All participants provided written informed consent in 520
accordance with the Institutional Review Board of Yale University. The experiment took place 521
over two visits to the laboratory. Participants were paid $25 upon completion of the first visit 522
(behavioral assessments) and $75 upon completion of the second visit (MRI scan); all 523
participants completed both visits. 524
525
Stimulus 526
An original narrative was written to serve as the stimulus for this experiment. For a synopsis of 527
the story, see Box 1. To mitigate confounds associated with education level or verbal IQ, we 528
wrote the narrative text to be easy to comprehend, with a readability level of 78.1/100 and a 529
grade 5.5 reading level as calculated by the Flesch-Kinkaid Formula. 530
531
Audio recording. A male native speaker of English read the story aloud and his speech was 532
recorded using high-quality equipment at Haskins Laboratories (New Haven, Conn.). The 533
speaker was instructed to read in a natural, conversational tone, but without excess emotion. The 534
final length of the audio recording was 21:50. 535
536
Experimental protocol 537
Session 1: Behavior. Approximately one week prior to the scan visit, participants came to the 538
laboratory to complete a battery of self-report and behavioral tasks. While our primary measure 539
of interest was the Green et al. Paranoid Thoughts Scale (GPTS)20, we also administered several 540
other psychological scales and cognitive assessments, in part to help reduce any demand 541
characteristics that would allow participants to intuit the purpose of the study. We chose the 542
.CC-BY-NC-ND 4.0 International licensepeer-reviewed) is the author/funder. It is made available under aThe copyright holder for this preprint (which was not. http://dx.doi.org/10.1101/231738doi: bioRxiv preprint first posted online Dec. 13, 2017;

24
GPTS because it provides a meaningful assessment of trait-level paranoia in clinical, but 543
crucially, also subclinical and healthy populations. In a previous study, score on this scale best 544
predicted feelings of persecution following immersion in a virtual-reality environment54. The full 545
GPTS contains two subscales, A and B, which pertain to ideas of social reference and ideas of 546
persecution, respectively. We focused on subscale A, as it produces a wider range of scores in 547
subclinical populations20. 548
549
Session 2: MRI scan. The full audio recording was divided into three segments of length 8:46, 550
7:32, and 5:32, respectively; each of these segments was delivered in a continuous functional run 551
while participants were in the scanner. To ensure attention, after each run, subjects answered 552
three challenging multiple-choice comprehension questions regarding the content of the part they 553
had just heard, for a total of nine questions. Immediately upon exiting the scanner, participants 554
completed a post-narrative questionnaire that consisted of open-ended prompts to elicit free 555
speech, followed by multiple-choice items. 556
557
MRI data acquisition and preprocessing 558
Scans were performed on a 3T Siemens TimTrio system at the Yale Magnetic Resonance 559
Research Center. After an initial localizing scan, a high-resolution 3D volume was collected 560
using a magnetization prepared rapid gradient echo (MPRAGE) sequence (208 contiguous 561
sagittal slices, slice thickness = 1 mm, matrix size 256 × 256, field of view = 256 mm, TR = 562
2400 ms, TE = 1.9 ms, flip angle = 8°). Functional images were acquired using a multiband T2*-563
sensitive gradient-recalled single shot echo-planar imaging pulse sequence (TR = 1000 ms, TE = 564
30 ms, voxel size = 2.0mm3, flip angle = 60°, bandwidth = 1976 Hz/pixel, matrix size = 110 × 565
110, field of view = 220 mm × 220 mm, multiband factor = 4). 566
We acquired the following functional scans: 1) an initial eyes-open resting-state run 567
(6:00/360 TRs in duration) during which subjects were instructed to relax and think of nothing in 568
particular; 2) a movie-watching run using Inscapes 55 (7:00/420 TRs); 3) three narrative-listening 569
runs corresponding to parts I, II and III of the story (21:50/1310 TRs in total); and 4) a post-570
narrative, eyes-open resting-state run (6:00/360 TRs) during which subjects were instructed to 571
reflect on the story they had just heard. The present work focuses exclusively on data acquired 572
during narrative listening. The narrative stimulus was delivered through MRI-compatible audio 573
.CC-BY-NC-ND 4.0 International licensepeer-reviewed) is the author/funder. It is made available under aThe copyright holder for this preprint (which was not. http://dx.doi.org/10.1101/231738doi: bioRxiv preprint first posted online Dec. 13, 2017;

25
headphones and a short “volume check” scan was conducted just prior to the first narrative run to 574
ensure that participants could adequately hear the stimulus above the scanner noise. To promote 575
engagement, during the three narrative runs, participants were asked to fixate on a static image of 576
a jungle settlement and to actively imagine the story events as they unfolded. 577
Following conversion of the original DICOM images to NIFTI format, AFNI (Cox 1996) 578
was used to preprocess MRI data. The functional time series went through the following 579
preprocessing steps: despiking, head motion correction, affine alignment with anatomy, 580
nonlinear alignment to a Talairach template (TT_N27), and smoothing with an isotropic FWHM 581
of 5 mm. A ventricle mask was defined on the template and intersected with the subject’s 582
cerebrospinal fluid (CSF) mask to make a subject-specific ventricle mask. Regressors were 583
created from the first three principal components of the ventricles, and fast ANATICOR (Jo et al 584
2010) was implemented to provide local white matter regressors. Additionally, the subject's 6 585
motion time series, their derivatives and linear polynomial baselines for each of the functional 586
runs were included as regressors. Censoring of time points was performed whenever the per-time 587
motion (Euclidean norm of the motion derivatives) was ≥0.3 or when ≥10% of the brain voxels 588
were outliers. Censored time points were set to zero rather than removed altogether (this is the 589
conventional way to do censoring, but especially important for inter-subject correlation analyses, 590
to preserve the temporal structure across participants). The final output of this preprocessing 591
pipeline was a single functional run concatenating data from the three story runs (total duration = 592
21:50, 1310 TRs). All analyses were conducted in volume space and projected to the surface for 593
visualization purposes. 594
We used mean framewise displacement (MFD), a per-participant summary metric, to 595
assess the amount of head motion in the sample. MFD was overall relatively low (after 596
censoring: mean = 0.075 mm, s.d. = 0.026, range = 0.035-0.14). Number of censored time points 597
during the story was overall low but followed a right-skewed distribution (range = 0-135, median 598
= 4, median absolute deviation = 25). All 22 participants in the final analysis retained at least 89 599
percent of the total time points in the story, so missing data was not a substantial concern. Still, 600
we performed additional control analyses to ensure that number of censored timepoints and 601
amount of head motion were not associated with paranoia score in any way that would confound 602
interpretation of the results (see Table 1). 603
604
.CC-BY-NC-ND 4.0 International licensepeer-reviewed) is the author/funder. It is made available under aThe copyright holder for this preprint (which was not. http://dx.doi.org/10.1101/231738doi: bioRxiv preprint first posted online Dec. 13, 2017;

26
Inter-subject correlation 605
Following preprocessing, inter-subject correlation (ISC) during the story was computed 606
across all possible pairs of subjects (i,j) using AFNI’s 3dTcorrelate function, resulting in 231 607
(n*(n-1)/2, where n = 22) unique ISC maps, where the value at each voxel represents the 608
Pearson’s correlation between that voxel’s timecourse in subject i and its timecourse in subject j. 609
To identify voxels demonstrating statistically significant ISC across all 231 subject pairs, 610
we performed inference at the single-group level using a recently developed linear mixed-effects 611
(LME) model with a crossed random-effects formulation to accurately account for the correlation 612
structure embedded in the ISC data 21. This approach has been characterized extensively, 613
including a comparison to non-parametric approaches, and found to demonstrate proper control 614
for false positives and good power attainment 21. The resulting map was corrected for multiple 615
comparisons and thresholded for visualization using a voxelwise false discovery rate threshold of 616
q < 0.001 (Fig. 2). 617
In a second analysis, we stratified participants according to a median split of scores on 618
the GPTS-A subscale. We used these groups to identify voxels that had higher ISC values within 619
one paranoia group or the other, or higher ISC values within rather than across paranoia groups. 620
To this end, we used a two-group formulation of the LME model. This model gives the following 621
outputs: voxelwise population ISC values within group 1 (G11); voxelwise population ISC values 622
within group 2 (G22); voxelwise population ISC values between the two groups that reflect the 623
ISC effect between any pair of subjects with each belonging to different groups (G12). These 624
outputs can be compared to obtain several possible contrasts. Here, we were primarily interested 625
in two of these contrasts: 1) G11 versus G22; and 2) G11G22 versus G12. The maps resulting from 626
each of these contrasts were thresholded using an initial voxelwise threshold of p < 0.002 and 627
controlled for family-wise error (FWE) using a cluster size threshold of 50 voxels, corresponding 628
to a corrected p-value of 0.05. We opted for a particularly stringent initial p-threshold in light of 629
recent concerns about false positives arising from performing cluster correction on maps with 630
more lenient initial thresholds 56. 631
632
Event-related analysis 633
Creating the regressor. One of the authors (E.S.F.) manually labeled sentences 634
containing either an ambiguous social interaction or an instance of the main character 635
.CC-BY-NC-ND 4.0 International licensepeer-reviewed) is the author/funder. It is made available under aThe copyright holder for this preprint (which was not. http://dx.doi.org/10.1101/231738doi: bioRxiv preprint first posted online Dec. 13, 2017;

27
mentalizing about other characters’ intentions using a binary scoring system (1 = ambiguous 636
social interaction or mentalizing present in sentence, 0 = neither ambiguous social interaction nor 637
mentalizing present). Four additional, independent raters previously naïve to the narrative 638
listened to the same version that was played to participants in the scanner. They were then given 639
a written version of the narrative broken down by sentence and asked to label each sentence as 640
described above. Sentences that were labeled by at least three of the five raters were included in 641
the final set of events, which were timestamped based on the offset of the last word of the 642
sentence. These timestamps were convolved with a canonical hemodynamic response function 643
(HRF) to create the mentalizing-events regressor. 644
As a control analysis, we also created a regressor that was the inverse of the above 645
regressor, by flipping the binary labels (0 or 1) for all sentences and convolving the 646
corresponding sentences offset timestamps with the HRF; we refer to this as the non-647
mentalizing-events regressor. 648
ROI definition and GLM. For the left temporal pole and right medial PFC, ROIs were 649
defined based on the cluster-corrected group-comparison map for the contrast ISChigh > ISClow 650
(cf. Fig. 3a). For the left posterior superior temporal sulcus and left Heschl’s gyrus, spherical 651
ROIs were created by placing a sphere with radius 4 mm around a central coordinate. In the case 652
of the left pSTS, this was the peak voxel in this region identified by the whole-sample ISC 653
analysis (cf. Fig. 2; Talairach xyz, [+53, +55, +18]). In the case of left Heschl’s gyrus, this was 654
selected anatomically (Talairach xyz, [-41, -24, +9]; as in 57). 655
Timecourses for each ROI were extracted from each participant’s preprocessed functional 656
data using AFNI’s 3dmaskave function and regressed against both the mentalizing- and non-657
mentalizing-events regressors to obtain a regression coefficient for each participant for each 658
ROI. These regression coefficients were then compared across groups using two-sample t-tests 659
corrected for four multiple comparisons. In the case of the two control ROIs (left pSTS and 660
Heschl’s gyrus) for the mentalizing-events regressor, these coefficients were also pooled across 661
both groups and submitted to a one-sample t-test to test for a significant deviation from zero. 662
663
Analysis of speech features 664
Audio recordings of participants’ retelling of the story were professionally transcribed by 665
a third-party company. We submitted the resulting transcripts to Linguistic Inquiry and Word 666
.CC-BY-NC-ND 4.0 International licensepeer-reviewed) is the author/funder. It is made available under aThe copyright holder for this preprint (which was not. http://dx.doi.org/10.1101/231738doi: bioRxiv preprint first posted online Dec. 13, 2017;

28
Count LIWC; 24, liwc.net, a software program that takes as input a given text and counts the 667
percentage of words falling into different syntactic and semantic categories. Because LIWC was 668
developed by researchers with interests in social, clinical, health, and cognitive psychology, the 669
language categories were created to capture people’s social and psychological states. 670
We restricted LIWC output to the 67 linguistic (syntactic and semantic) categories, 671
excluding categories relating to metadata (e.g., percentage of words found in the LIWC 672
dictionary), as well as categories irrelevant to spoken language (e.g., punctuation). Thus, our 673
final LIWC output was a 22x67 matrix where each row corresponds to a participant and each 674
column to a category. 675
These categories can be scaled very differently from one another. For example, words in 676
the syntactic category “pronoun” accounted for between 10.3-20.5 percent of speech transcripts, 677
while words in the semantic category “leisure” accounted for only 0-1.09 percent. To give 678
approximately equal weight to all categories, we standardized each category (to have zero mean 679
unit variance) across participants before performing partial least squares regression (PLSR) as 680
described in the next section. This ensures that the resulting PLS components are not simply 681
dominated by variance in categories that are represented heavily in all human speech. 682
683
Relating speech features to paranoia 684
To determine which speech features were most related to trait-level paranoia, we 685
submitted the data to a partial least squares regression (PLSR) with the z-scored speech features 686
as X (predictors) and GPTS-A score as Y (response), implemented in Matlab as plsregress. 687
PLSR is a latent variable approach to modeling the covariance structure between two matrices, 688
which seeks to find the direction in X space that explains the maximum variance in Y space. It is 689
well suited to the current problem, because it can handle a predictor matrix with more variables 690
than observations, as well as multi-collinearity among the predictors. 691
In a first-pass analysis, we ran a model with 10 components to determine the number of 692
components needed to explain most of the variance in trait-level paranoia. Results of this 693
analysis indicated that the first component was sufficient to explain 72.3 percent of the total 694
variance in GPTS-A score, so we selected just this component for visualization and 695
interpretation. Predictor loadings for this component are visualized in Fig. 5a. 696
697
.CC-BY-NC-ND 4.0 International licensepeer-reviewed) is the author/funder. It is made available under aThe copyright holder for this preprint (which was not. http://dx.doi.org/10.1101/231738doi: bioRxiv preprint first posted online Dec. 13, 2017;

29
REFERENCES 698 699
1 Davis, B., Anderson, R. & Walls, J. Rashomon Effects: Kurosawa, Rashomon and Their 700 Legacies. (Taylor & Francis, 2015). 701
2 Johns, L. C. & Van Os, J. The Continuity of Psychotic Experiences in the General 702 Population. Clin. Psychol. Rev. 21, 1125-1141, (2001). 703
3 Insel, T. et al. Research Domain Criteria (Rdoc): Toward a New Classification 704 Framework for Research on Mental Disorders. Am. J. Psychiatry. 167, 748-751, (2010). 705
4 Freeman, D. et al. Psychological Investigation of the Structure of Paranoia in a Non-706 Clinical Population. The British Journal of Psychiatry 186, 427-435, (2005). 707
5 Bebbington, P. E. et al. The Structure of Paranoia in the General Population. Vol. 202 708 (2013). 709
6 Whalley, H. C. et al. Correlations between Fmri Activation and Individual Psychotic 710 Symptoms in Un-Medicated Subjects at High Genetic Risk of Schizophrenia. BMC 711 Psychiatry 7, 61, (2007). 712
7 Brent, B. K. et al. Subclinical Delusional Thinking Predicts Lateral Temporal Cortex 713 Responses During Social Reflection. Soc. Cogn. Affect. Neurosci., nss129, (2012). 714
8 Sumich, A., Castro, A. & Kumari, V. N100 and N200, but Not P300, Amplitudes Predict 715 Paranoia/Suspiciousness in the General Population. Pers. Individ. Dif. 61, 74-79, (2014). 716
9 Modinos, G., Renken, R., Ormel, J. & Aleman, A. Self-Reflection and the Psychosis-717 Prone Brain: An Fmri Study. Neuropsychology 25, 295-305, (2011). 718
10 Modinos, G. et al. Multivariate Pattern Classification Reveals Differential Brain 719 Activation During Emotional Processing in Individuals with Psychosis Proneness. 720 Neuroimage 59, 3033-3041, (2012). 721
11 Bishop, S. J. Neural Mechanisms Underlying Selective Attention to Threat. Ann. N. Y. 722 Acad. Sci. 1129, 141-152, (2008). 723
12 Kukkonen, K. Bayesian Narrative: Probability, Plot and the Shape of the Fictional World. 724 Anglia 132, 720-739, (2014). 725
13 Mar, R. A. The Neural Bases of Social Cognition and Story Comprehension. Annu. Rev. 726 Psychol. 62, 103-134, (2011). 727
14 Lerner, Y., Honey, C. J., Silbert, L. J. & Hasson, U. Topographic Mapping of a Hierarchy 728 of Temporal Receptive Windows Using a Narrated Story. J. Neurosci. 31, 2906-2915, 729 (2011). 730
15 Hasson, U., Nir, Y., Levy, I., Fuhrmann, G. & Malach, R. Intersubject Synchronization of 731 Cortical Activity During Natural Vision. Science 303, 1634-1640, (2004). 732
16 Hasson, U., Malach, R. & Heeger, D. J. Reliability of Cortical Activity During Natural 733 Stimulation. Trends in Cognitive Sciences 14, 40-48, (2010). 734
17 Cooper, E. A., Hasson, U. & Small, S. L. Interpretation-Mediated Changes in Neural 735 Activity During Language Comprehension. Neuroimage 55, 1314-1323, (2011). 736
18 Lahnakoski, J. M. et al. Synchronous Brain Activity across Individuals Underlies Shared 737 Psychological Perspectives. Neuroimage 100, 316-324, (2014). 738
19 Yeshurun, Y. et al. Same Story, Different Story: The Neural Representation of 739 Interpretive Frameworks. Psychol. Sci. 28, 307-319, (2017). 740
20 Green, C. et al. Measuring Ideas of Persecution and Social Reference: The Green Et Al. 741 Paranoid Thought Scales (Gpts). Psychol. Med. 38, 101-111, (2008). 742
.CC-BY-NC-ND 4.0 International licensepeer-reviewed) is the author/funder. It is made available under aThe copyright holder for this preprint (which was not. http://dx.doi.org/10.1101/231738doi: bioRxiv preprint first posted online Dec. 13, 2017;
30
21 Chen, G., Taylor, P. A., Shin, Y.-W., Reynolds, R. C. & Cox, R. W. Untangling the 743 Relatedness among Correlations, Part Ii: Inter-Subject Correlation Group Analysis 744 through Linear Mixed-Effects Modeling. NeuroImage 147, 825-840, (2017). 745
22 Yarkoni, T., Speer, N. K. & Zacks, J. M. Neural Substrates of Narrative Comprehension 746 and Memory. Neuroimage 41, 1408-1425, (2008). 747
23 Yarkoni, T., Poldrack, R. A., Nichols, T. E., Van Essen, D. C. & Wager, T. D. Large-748 Scale Automated Synthesis of Human Functional Neuroimaging Data. Nature Methods 8, 749 665, (2011). 750
24 Linguistic Inquiry and Word Count: Liwc 2015 (Pennebaker Conglomerates, Austin, TX, 751 2015). 752
25 Schmälzle, R., Häcker, F. E. K., Honey, C. J. & Hasson, U. Engaged Listeners: Shared 753 Neural Processing of Powerful Political Speeches. Soc. Cogn. Affect. Neurosci. 10, 1137-754 1143, (2015). 755
26 Dmochowski, J. P. et al. Audience Preferences Are Predicted by Temporal Reliability of 756 Neural Processing. Nature communications 5, 4567, (2014). 757
27 Ki, J. J., Kelly, S. P. & Parra, L. C. Attention Strongly Modulates Reliability of Neural 758 Responses to Naturalistic Narrative Stimuli. J. Neurosci. 36, 3092-3101, (2016). 759
28 Brüne, M. “Theory of Mind” in Schizophrenia: A Review of the Literature. Schizophr. 760 Bull. 31, 21-42, (2005). 761
29 Carrington, S. J. & Bailey, A. J. Are There Theory of Mind Regions in the Brain? A 762 Review of the Neuroimaging Literature. Hum. Brain Mapp. 30, 2313-2335, (2009). 763
30 Amodio, D. M. & Frith, C. D. Meeting of Minds: The Medial Frontal Cortex and Social 764 Cognition. Nat. Rev. Neurosci. 7, 268-277, (2006). 765
31 Olson, I. R., Plotzker, A. & Ezzyat, Y. The Enigmatic Temporal Pole: A Review of 766 Findings on Social and Emotional Processing. Brain 130, 1718-1731, (2007). 767
32 Cannon, B. J. & Kramer, L. M. Delusion Content across the 20th Century in an American 768 Psychiatric Hospital. Int. J. Soc. Psychiatry 58, 323-327, (2012). 769
33 Tateyama, M., Asai, M., Hashimoto, M., Bartels, M. & Kasper, S. Transcultural Study of 770 Schizophrenic Delusions. Tokyo Versus Vienna and Tubingen (Germany). 771 Psychopathology 31, 59-68, (1997). 772
34 Stompe, T. et al. Comparison of Delusions among Schizophrenics in Austria and in 773 Pakistan. Psychopathology 32, 225-234, (1998). 774
35 Gutiérrez-Lobos, K., Schmid-Siegel, B., Bankier, B. & Walter, H. Delusions in First-775 Admitted Patients: Gender, Themes and Diagnoses. Psychopathology, (2001). 776
36 Brakoulias, V. & Starcevic, V. A Cross-Sectional Survey of the Frequency and 777 Characteristics of Delusions in Acute Psychiatric Wards. Australasian Psychiatry 16, 87-778 91, (2008). 779
37 Coid, J. W., Ullrich, S., Kallis, C. & et al. The Relationship between Delusions and 780 Violence: Findings from the East London First Episode Psychosis Study. JAMA 781 Psychiatry 70, 465-471, (2013). 782
38 Hasson, U. et al. Shared and Idiosyncratic Cortical Activation Patterns in Autism 783 Revealed under Continuous Real-Life Viewing Conditions. Autism Research 2, 220-231, 784 (2009). 785
39 Salmi, J. et al. The Brains of High Functioning Autistic Individuals Do Not Synchronize 786 with Those of Others. NeuroImage: Clinical 3, 489-497, (2013). 787
.CC-BY-NC-ND 4.0 International licensepeer-reviewed) is the author/funder. It is made available under aThe copyright holder for this preprint (which was not. http://dx.doi.org/10.1101/231738doi: bioRxiv preprint first posted online Dec. 13, 2017;

31
40 Byrge, L., Dubois, J., Tyszka, J. M., Adolphs, R. & Kennedy, D. P. Idiosyncratic Brain 788 Activation Patterns Are Associated with Poor Social Comprehension in Autism. J. 789 Neurosci. 35, 5837-5850, (2015). 790
41 Crespi, B. & Badcock, C. Psychosis and Autism as Diametrical Disorders of the Social 791 Brain. Behav. Brain Sci. 31, 241-261, (2008). 792
42 Ciaramidaro, A. et al. Schizophrenia and Autism as Contrasting Minds: Neural Evidence 793 for the Hypo-Hyper-Intentionality Hypothesis. Schizophr. Bull. 41, 171-179, (2015). 794
43 Kelly, C., Biswal, B. B., Craddock, R. C., Castellanos, F. X. & Milham, M. P. 795 Characterizing Variation in the Functional Connectome: Promise and Pitfalls. Trends in 796 Cognitive Sciences 16, 181-188, (2012). 797
44 Castellanos, F. X., Di Martino, A., Craddock, R. C., Mehta, A. D. & Milham, M. P. 798 Clinical Applications of the Functional Connectome. Neuroimage 80, 527-540, (2013). 799
45 Finn, E. S. et al. Functional Connectome Fingerprinting: Identifying Individuals Using 800 Patterns of Brain Connectivity. Nat. Neurosci. 18, 1664-1671, (2015). 801
46 Smith, S. M. et al. A Positive-Negative Mode of Population Covariation Links Brain 802 Connectivity, Demographics and Behavior. Nat. Neurosci. 18, 1565-1567, (2015). 803
47 Rosenberg, M. D. et al. A Neuromarker of Sustained Attention from Whole-Brain 804 Functional Connectivity. Nat. Neurosci. advance online publication, (2015). 805
48 Ren, Y., Nguyen, V. T., Guo, L. & Guo, C. C. Inter-Subject Functional Correlation 806 Reveal a Hierarchical Organization of Extrinsic and Intrinsic Systems in the Brain. Sci. 807 Rep. 7, 10876, (2017). 808
49 Vanderwal, T. et al. Individual Differences in Functional Connectivity During 809 Naturalistic Viewing Conditions. bioRxiv, (2016). 810
50 Finn, E. S. & Constable, R. T. Individual Variation in Functional Brain Connectivity: 811 Implications for Personalized Approaches to Psychiatric Disease. Dialogues Clin. 812 Neurosci. 18, 277-287, (2016). 813
51 Dubois, J. & Adolphs, R. Building a Science of Individual Differences from Fmri. Trends 814 in Cognitive Sciences 20, 425-443, (2016). 815
52 Koyama, M. S. et al. Imaging the at-Risk Brain: Future Directions. J. Int. Neuropsychol. 816 Soc. 22, 164-179, (2016). 817
53 Finn, E. S. et al. Can Brain State Be Manipulated to Emphasize Individual Differences in 818 Functional Connectivity? Neuroimage, (2017). 819
54 VALMAGGIA, L. R. et al. Virtual Reality and Paranoid Ideations in People with an ‘at-820 Risk Mental State’ for Psychosis. The British Journal of Psychiatry 191, s63-s68, (2007). 821
55 Vanderwal, T., Kelly, C., Eilbott, J., Mayes, L. C. & Castellanos, F. X. Inscapes: A 822 Movie Paradigm to Improve Compliance in Functional Magnetic Resonance Imaging. 823 Neuroimage 122, 222-232, (2015). 824
56 Eklund, A., Nichols, T. E. & Knutsson, H. Cluster Failure: Why Fmri Inferences for 825 Spatial Extent Have Inflated False-Positive Rates. Proc. Natl. Acad. Sci. USA, 826 201602413, (2016). 827
57 Schönwiesner, M. et al. Heschl's Gyrus, Posterior Superior Temporal Gyrus, and Mid-828 Ventrolateral Prefrontal Cortex Have Different Roles in the Detection of Acoustic 829 Changes. J. Neurophysiol. 97, 2075-2082, (2007). 830
831
.CC-BY-NC-ND 4.0 International licensepeer-reviewed) is the author/funder. It is made available under aThe copyright holder for this preprint (which was not. http://dx.doi.org/10.1101/231738doi: bioRxiv preprint first posted online Dec. 13, 2017;

.CC-BY-NC-ND 4.0 International licensepeer-reviewed) is the author/funder. It is made available under aThe copyright holder for this preprint (which was not. http://dx.doi.org/10.1101/231738doi: bioRxiv preprint first posted online Dec. 13, 2017;
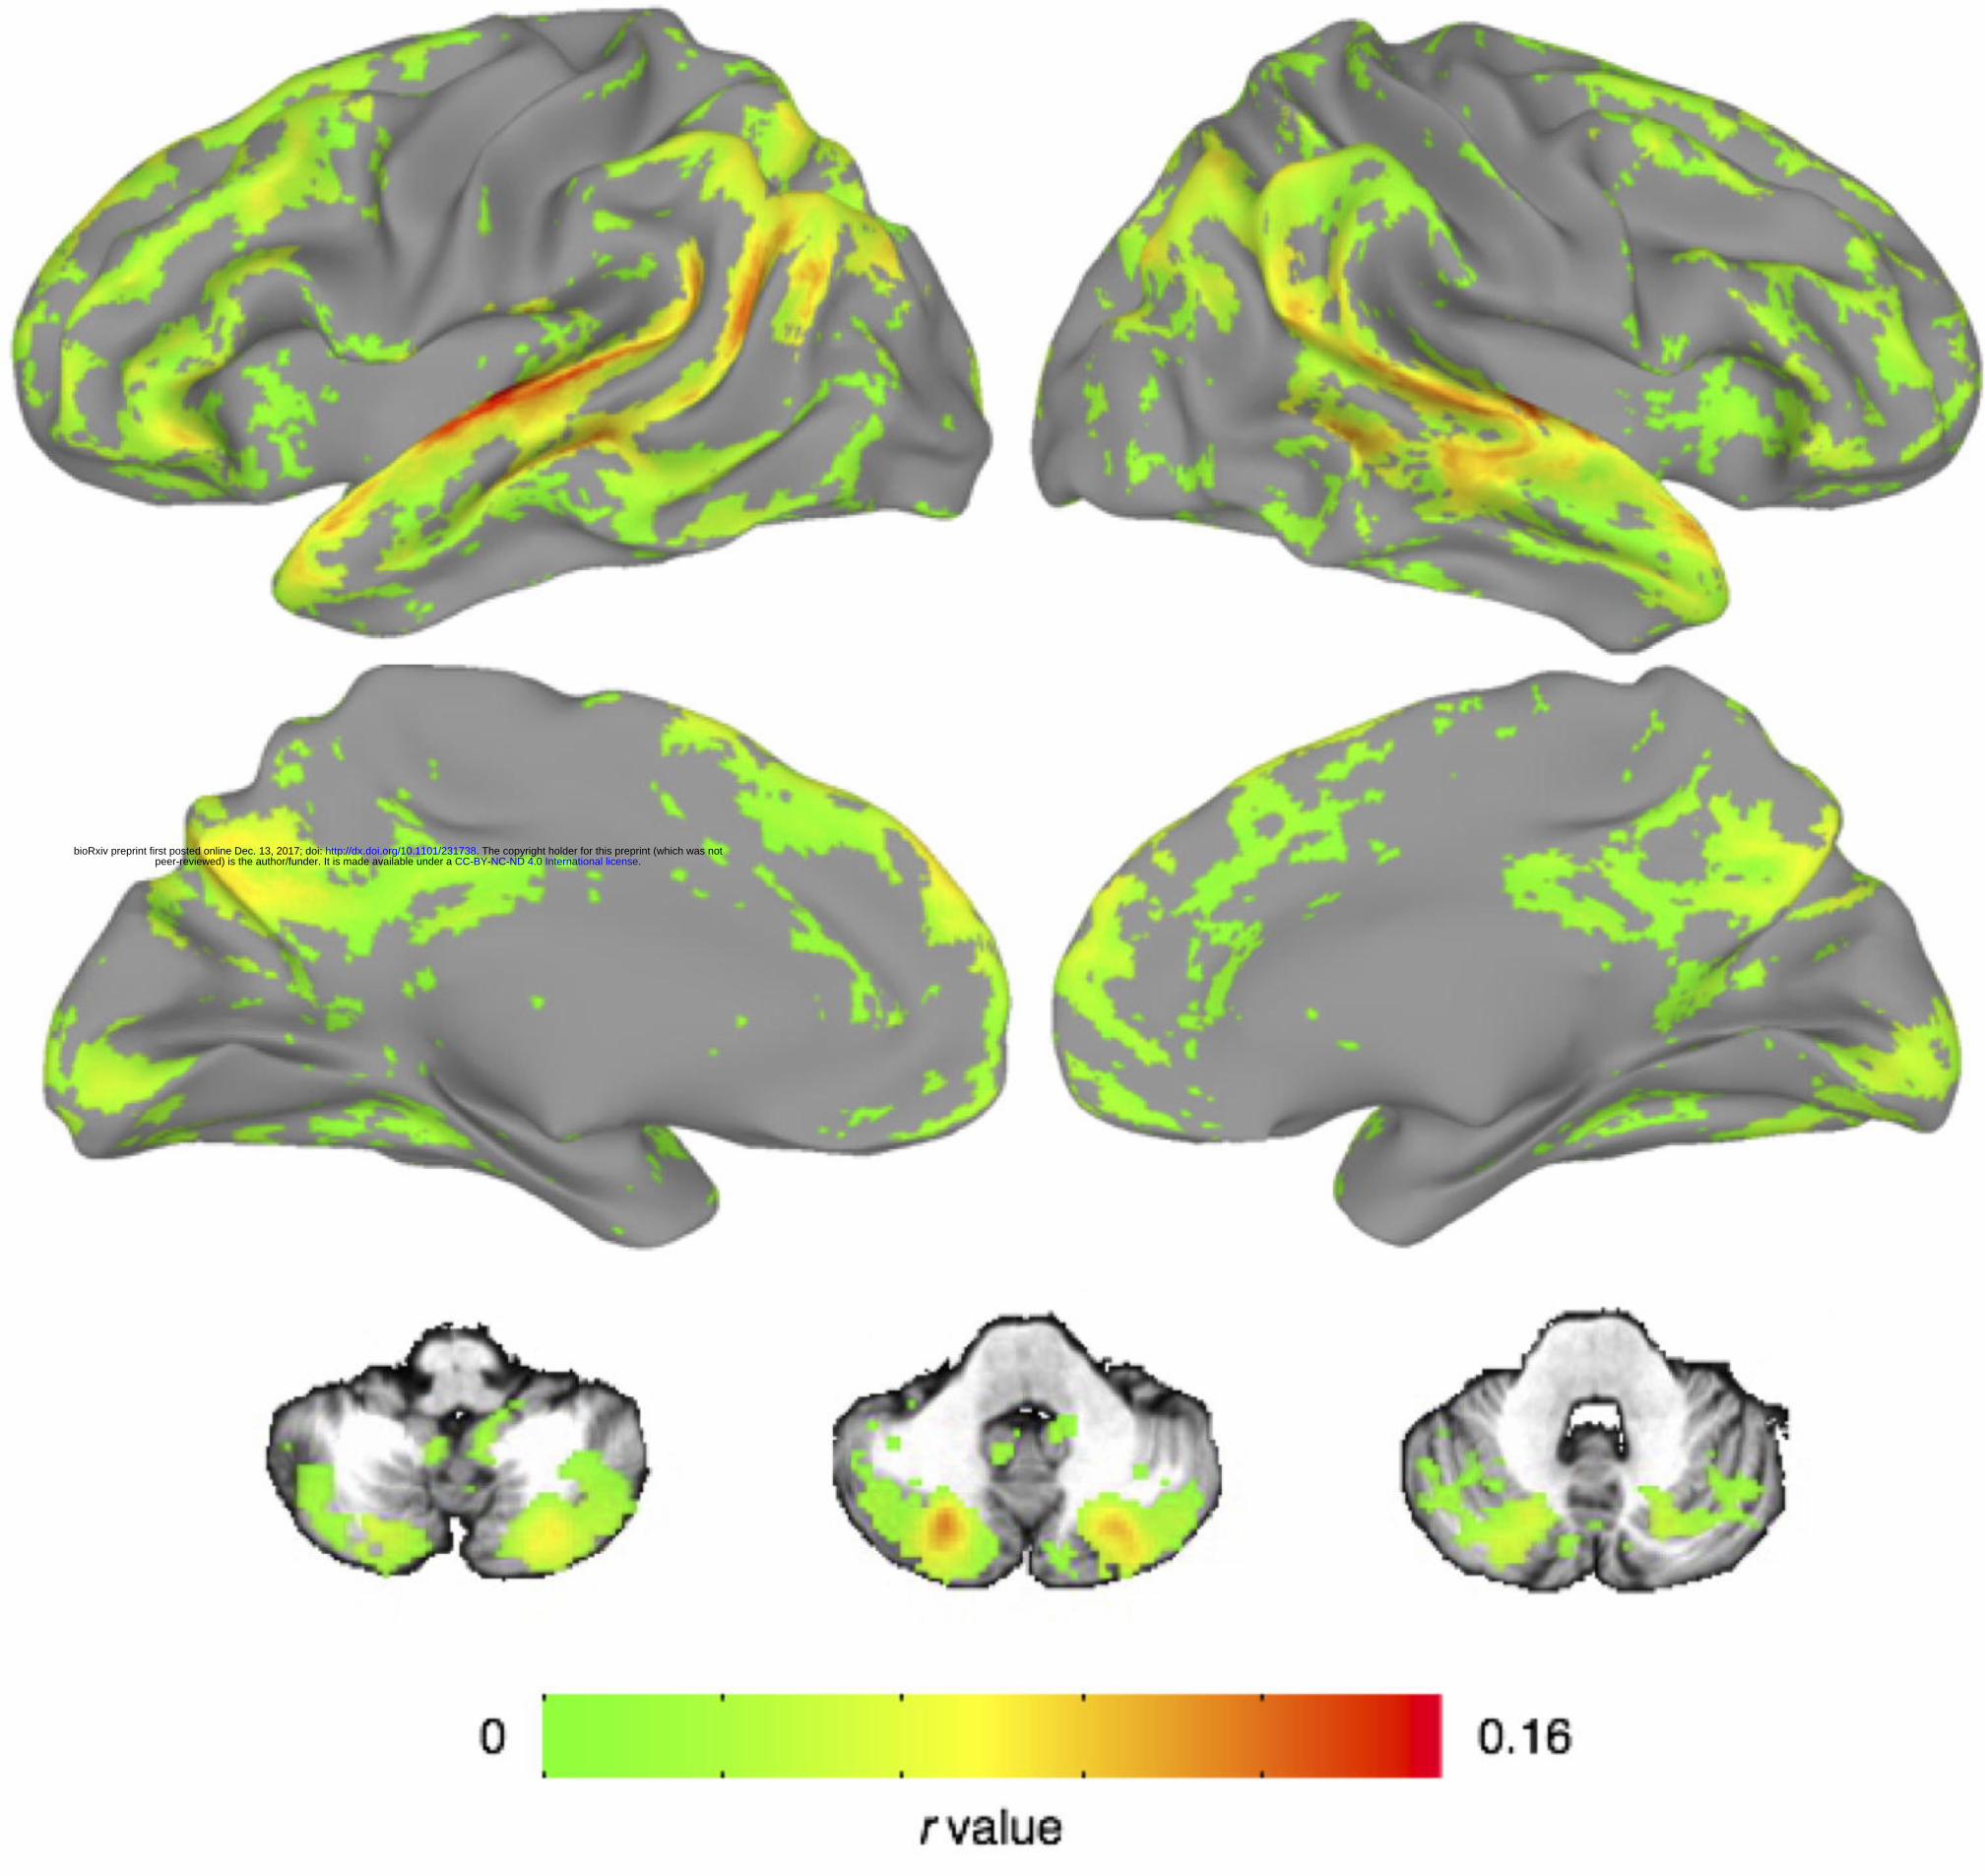
.CC-BY-NC-ND 4.0 International licensepeer-reviewed) is the author/funder. It is made available under aThe copyright holder for this preprint (which was not. http://dx.doi.org/10.1101/231738doi: bioRxiv preprint first posted online Dec. 13, 2017;

.CC-BY-NC-ND 4.0 International licensepeer-reviewed) is the author/funder. It is made available under aThe copyright holder for this preprint (which was not. http://dx.doi.org/10.1101/231738doi: bioRxiv preprint first posted online Dec. 13, 2017;

.CC-BY-NC-ND 4.0 International licensepeer-reviewed) is the author/funder. It is made available under aThe copyright holder for this preprint (which was not. http://dx.doi.org/10.1101/231738doi: bioRxiv preprint first posted online Dec. 13, 2017;

.CC-BY-NC-ND 4.0 International licensepeer-reviewed) is the author/funder. It is made available under aThe copyright holder for this preprint (which was not. http://dx.doi.org/10.1101/231738doi: bioRxiv preprint first posted online Dec. 13, 2017;